Electron-phonon relaxation and excited electron...
9
Electron-phonon relaxation and excited electron distribution in gallium nitride V. P. Zhukov, V. G. Tyuterev, E. V. Chulkov, and P. M. Echenique Citation: Journal of Applied Physics 120, 085708 (2016); doi: 10.1063/1.4961874 View online: http://dx.doi.org/10.1063/1.4961874 View Table of Contents: http://scitation.aip.org/content/aip/journal/jap/120/8?ver=pdfcov Published by the AIP Publishing Articles you may be interested in Ab initio calculation of electron–phonon coupling in monoclinic β-Ga2O3 crystal Appl. Phys. Lett. 109, 072102 (2016); 10.1063/1.4961308 Numerical analysis of indirect Auger transitions in InGaN Appl. Phys. Lett. 101, 011111 (2012); 10.1063/1.4733353 Ab initio studies of electronic properties of bare GaN(0001) surface J. Appl. Phys. 106, 054901 (2009); 10.1063/1.3204965 Reduced subpicosecond electron relaxation in GaN x As 1 − x Appl. Phys. Lett. 86, 161912 (2005); 10.1063/1.1904709 Additional phonon modes and close satellite valleys crucialfor electron transport in hexagonal gallium nitride Appl. Phys. Lett. 85, 609 (2004); 10.1063/1.1776622 Reuse of AIP Publishing content is subject to the terms at: https://publishing.aip.org/authors/rights-and-permissions. Download to IP: 158.227.172.141 On: Fri, 21 Oct 2016 08:52:17
Transcript of Electron-phonon relaxation and excited electron...
Electron-phonon relaxation and excited electron distribution in gallium nitrideV. P. Zhukov, V. G. Tyuterev, E. V. Chulkov, and P. M. Echenique Citation: Journal of Applied Physics 120, 085708 (2016); doi: 10.1063/1.4961874 View online: http://dx.doi.org/10.1063/1.4961874 View Table of Contents: http://scitation.aip.org/content/aip/journal/jap/120/8?ver=pdfcov Published by the AIP Publishing Articles you may be interested in Ab initio calculation of electron–phonon coupling in monoclinic β-Ga2O3 crystal Appl. Phys. Lett. 109, 072102 (2016); 10.1063/1.4961308 Numerical analysis of indirect Auger transitions in InGaN Appl. Phys. Lett. 101, 011111 (2012); 10.1063/1.4733353 Ab initio studies of electronic properties of bare GaN(0001) surface J. Appl. Phys. 106, 054901 (2009); 10.1063/1.3204965 Reduced subpicosecond electron relaxation in GaN x As 1 − x Appl. Phys. Lett. 86, 161912 (2005); 10.1063/1.1904709 Additional phonon modes and close satellite valleys crucialfor electron transport in hexagonal gallium nitride Appl. Phys. Lett. 85, 609 (2004); 10.1063/1.1776622
Reuse of AIP Publishing content is subject to the terms at: https://publishing.aip.org/authors/rights-and-permissions. Download to IP: 158.227.172.141 On: Fri, 21 Oct 2016
08:52:17
Electron-phonon relaxation and excited electron distribution in galliumnitride
V. P. Zhukov,1,2 V. G. Tyuterev,2,3,4,a) E. V. Chulkov,2,4,5 and P. M. Echenique2,5
1Institute of Solid State Chemistry, Urals Branch of the Russian Academy of Sciences, Pervomayskaya st. 91,Yekaterinburg, Russia2Donostia International Physics Center (DIPC), P. Manuel de Lardizabal 4, 20018 San Sebastian, Spain3Tomsk State Pedagogical University, Kievskaya st. 60, Tomsk, Russia4Tomsk State University, Lenin st. 36, Tomsk, Russia5Departamento de Fisica de Materiales, Facultad de Ciencias Qumicas, UPV/EHU and Centro de Fisica deMateriales CFM-MPC and Centro Mixto CSIC-UPV/EHU, Apdo. 1072, 20080 San Sebastian, Spain
(Received 6 May 2016; accepted 16 August 2016; published online 30 August 2016)
We develop a theory of energy relaxation in semiconductors and insulators highly excited by the
long-acting external irradiation. We derive the equation for the non-equilibrium distribution func-
tion of excited electrons. The solution for this function breaks up into the sum of two contributions.
The low-energy contribution is concentrated in a narrow range near the bottom of the conduction
band. It has the typical form of a Fermi distribution with an effective temperature and chemical
potential. The effective temperature and chemical potential in this low-energy term are determined
by the intensity of carriers’ generation, the speed of electron-phonon relaxation, rates of inter-band
recombination, and electron capture on the defects. In addition, there is a substantial high-energy
correction. This high-energy “tail” largely covers the conduction band. The shape of the high-
energy “tail” strongly depends on the rate of electron-phonon relaxation but does not depend on the
rates of recombination and trapping. We apply the theory to the calculation of a non-equilibrium
distribution of electrons in an irradiated GaN. Probabilities of optical excitations from the valence
to conduction band and electron-phonon coupling probabilities in GaN were calculated by the
density functional perturbation theory. Our calculation of both parts of distribution function in
gallium nitride shows that when the speed of the electron-phonon scattering is comparable with the
rate of recombination and trapping then the contribution of the non-Fermi “tail” is comparable with
that of the low-energy Fermi-like component. So the high-energy contribution can essentially affect
the charge transport in the irradiated and highly doped semiconductors. Published by AIP Publishing.[http://dx.doi.org/10.1063/1.4961874]
I. INTRODUCTION
The study of the relaxation processes in crystals is indis-
pensable for the understanding of a number of physical phe-
nomena induced by external sources at high excitation
levels. First of all, this concerns to the experiments with the
impact by electron beams and powerful lasers.1,2 The knowl-
edge of the energy and momentum relaxation is also indis-
pensable for the study of the high-field transport of charge
carriers,3–5 including the case of electric breakdown.6,7 One
should also mention such phenomena as laser ablation,8
abrupt thermal impact,9,10 ultra-fast phase transitions,11 pho-
tocatalysis,12 and the solar energy conversion.13,14 In the
investigation of the energy relaxation processes in Si,1,15
GaAs,14,16–20 GaP,21,22 InP,21,23 and CdSe,24 the non-
equilibrium distribution of electrons is usually simulated as a
quasi-Fermi function which is localized close to the bottom
of the conduction band.
In the works of Refs. 12 and 25–27 on the example of
the compounds ZnO and TiO2, it was established that in a
wide-bandgap material the evolution of energy relaxation
has some peculiarities. It has been shown that the form of
quasi-equilibrium distribution differs markedly from the case
of narrow-bandgap compounds, and covers a wide range of
energy within the conduction and valence bands over the
band edges at a distance comparable to the width of the
band gap.
In the current article, we will consider the quasi-
equilibrium distribution in more general terms that allow us
to incorporate into the theory27 the processes of radiative
recombination and trapping of carriers. This makes it possi-
ble to specify the energy dependence of the distribution func-
tion either directly near the band edges or away from them.
We apply the proposed theory to the case of gallium nitride
in the wurtzite structure.
The paper is organized as follows. In Sec. II, we present
the analytical methods we use. First, we derive the equation
for the quasi-equilibrium distribution function. Next, its for-
mal solution is given in Subsection II A. On this basis, in
Subsection II B, we develop an effective phonon model that
allows an exact solution which is presented in Subsection
II C. Section III describes the techniques of numerical calcu-
lation for GaN. The necessary material dependent quantities,
namely, optical excitation probabilities and electron-phonon
coupling characteristics, are calculated ab initio within the
a)Author to whom correspondence should be addressed. Electronic mail:
0021-8979/2016/120(8)/085708/8/$30.00 Published by AIP Publishing.120, 085708-1
JOURNAL OF APPLIED PHYSICS 120, 085708 (2016)
Reuse of AIP Publishing content is subject to the terms at: https://publishing.aip.org/authors/rights-and-permissions. Download to IP: 158.227.172.141 On: Fri, 21 Oct 2016
08:52:17
pseudopotential approach and density functional theory
(DFT). Section IV presents the application of Secs. II and III
to the non-equilibrium distribution of carriers in the conduct-
ing band of GaN. Finally, the results are discussed and sum-
marized in Sec. V.
II. CALCULATION METHODS
The kinetic equation for the time-dependent distribution
function f ðt;EÞ ¼ GðEÞnðt;EÞ of a non-equilibrium electron
state created by the powerful external source of high-energy
irradiation was investigated in Ref. 27. Here, GðEÞ ¼PckdðE� EckÞ is the density of electron states in the con-
duction band, n(t, E) is the occupation number of non-
equilibrium electrons, the energy E is taken with respect to
the bottom of the conduction band (hereafter “excess ener-
gy”). The excitation of electrons from the valence to conduc-
tion band by an external source is followed by the fast
momentum randomization, within several femtoseconds.1
This conclusion was confirmed recently in the study of ultra-
fast scattering dynamics of hot electrons in GaAs by using
time- and angle-resolved photoemission spectroscopy and abinitio calculations.28 That is why, the occupation number nck
of electron’s band state Eck can be regarded just as a function
of energy n(t, E), the phonon occupation number is consid-
ered to be energy-dependent as well: Nrq ¼ Nð�Þ.We restrict ourselves to the case when the maximum
excess energy of external excitation is located lower than the
threshold of impact ionization Eimp. Numerically, it roughly
equals to the band-gap value above the bottom of the con-
duction band. Once the energy of an electron is lower than
Eimp, the production of secondary electrons and holes is pro-
hibited since it is impossible to simultaneously satisfy the
energy and momentum conservation laws. Therefore, inelas-
tic electron-electron processes are absent in this range, and
energy relaxation can only be associated with the electron-
phonon scattering. For GaN, this threshold corresponds to
the excess energy equal to 3.25 eV.
Retaining linear and quadratic terms by phonon energy
which is a small quantity relative to the band energy Eck, one
comes to the following equation for a non-equilibrium distri-
bution f(t, E) of electrons in the conduction band:27
df t;Eð Þdt
¼ df t;Eð Þdt
� �ext�G Eð Þn t;Eð Þcrec Eð Þ
þ d
dE
dn t;Eð ÞdE
C2 Eð Þ þ n t;Eð Þ 1� n t;Eð Þð ÞC1 Eð Þ� �
:
(1)
Hereafter,
C0ðEÞ ¼ð�m
0
Cð�;EÞd�; C1ðEÞ ¼ð�m
0
�Cð�;EÞd�;
C2ðEÞ ¼ð�m
0
�2ðNð�Þ þ 1=2ÞCð�;EÞd�: (2)
A spectral function of electron-phonon interaction
Cð�;EÞ is defined as
Cð�;EÞ ¼Xrq
Xckc0k0
dðE� EckÞ � Prq
ckc0k0dk06q�k
� dðE� Ec0k0 Þdð�� �rqÞ: (3)
Prq
ckc0k0¼ 2p
�h jhckjHel�phrq jc0k0ij2 is the matrix element of
electron-phonon interaction operator. �rq is the energy of a
phonon of rth branch with the wave vector q. The term
½df ðt;EÞ=dt�ext describes the distribution of excited carriers
created by the external sources of generation. The expression
f ðt;EÞcrecðEÞ takes into consideration the flow of electrons
from the conduction band to the valence bands and to the
impurity levels. The range of integration in Eq. (2) extends
from zero up to the maximal phonon energy �m. The function,
ce�phðEÞ ¼ C0ðEÞ=GðEÞ; (4)
specifies the probability per unit time for an electron to leave
a given excess energy level E, so it is the electron-phonon
relaxation rate.
The well-known Eliashberg spectral function a2Fð�Þ of
the electron-phonon interaction, which relates to the Fermi-
level in superconductors,29 can be generalized for an arbi-
trary excess energy level in semiconductor as
a2Fð�;EÞ ¼ �hCð�;EÞ=ð2pGðEÞÞ: (5)
This function, in its turn, determines in semiconductor the
electron-phonon coupling constant kðEÞ, relating to a given
energy E
kðEÞ ¼ 2
ð�m
0
d�a2Fð�;EÞ=�: (6)
A. Stationary solution for the distribution function
If the action of an external excitation continues for a
time long enough, then the quasi-stationary distribution
becomes established. Then a search of a quasi-stationary
distribution function df ðt;EÞ=dt ¼ 0 reduces itself to the
solution of the equation for the time-independent occupa-
tion number n(E). The stationary solution of the nonlinear
inhomogeneous differential equation (1) can be found by a
perturbation theory.30 We seek the approximate stationary
solution of Eq. (1) in the form nðEÞ ¼ n0ðEÞ þ n1ðEÞ.Here, n0ðEÞ is the exact “non-perturbed” solution for a sta-
tionary homogeneous equation (1) with omitted sources
and sinks,
½df ðt;EÞ=dt�ext ¼ 0; crecðEÞ ¼ 0: (7)
The first order correction n1ðEÞ takes into account the
terms ½df ðt;EÞ=dt�ext and crecðEÞ treating them as a
perturbation.
One can check by a direct substitution that there exists
an exact partial solution for n0ðEÞ in the following form:
n0ðEÞ ¼ ðeRðEÞ þ 1Þ�1; (8)
where
085708-2 Zhukov et al. J. Appl. Phys. 120, 085708 (2016)
Reuse of AIP Publishing content is subject to the terms at: https://publishing.aip.org/authors/rights-and-permissions. Download to IP: 158.227.172.141 On: Fri, 21 Oct 2016
08:52:17
RðEÞ ¼ðE
0
C1ðE0Þ=C2ðE0ÞdE0 þ C: (9)
Here, C is an integration constant.
Under the conditions of low intensity of external expo-
sure, one has to regard n0ðEÞ as a small quantity. In this
case, keeping the leading terms we arrive from Eq. (1) to the
linearized equation with a stationary solution,
n0ðEÞ ¼ e�RðEÞ: (10)
Both distributions (8) and (10) should be localized in the
energy region where the electron-phonon relaxation is ineffi-
cient, i.e., at E � �m, where �m is the maximal energy of the
phonon spectrum. An equation for the correction n1ðEÞcomes out by substitution of n0ðEÞ in Eq. (1). We restrict
ourselves by the examination of excitation regimes when
n1ðEÞ can be treated as a small and smooth quantity.
Retaining the leading terms, the equation for the correction
term in the stationary regime acquires the following form:
d
dE1� 2n0 Eð Þ½ �n1 Eð ÞC1 Eð Þ
� �þ df t;Eð Þ=dt� �
ext
� n0 Eð ÞG Eð Þcrec Eð Þ ¼ 0: (11)
The solution of Eq. (11) which satisfies the condition
n1ðEÞ¼ 0 at E � Emax can be written as
n1ðEÞ ¼ f½1� 2n0ðEÞ�C1ðEÞg�1 �ðEmax
E
f½df ðt;E0Þ=dt�ext
� n0ðE0ÞGðE0ÞcrecðE0ÞgdE0: (12)
Here, Emax is the maximal level of electrons excitation.
In a stationary regime, the total number of electrons gen-
erated per unit time by the external source should be equal to
the number of electrons that leave the conduction band dur-
ing the same time due to the inter-band recombination and
trapping by the impurity levels
ðEmax
0
½df ðt;EÞ=dt�extdE ¼ðEmax
0
n0ðEÞGðEÞcrecðEÞdE: (13)
Note that C1ðEÞ � E as E! 0. Hence, Eq. (13) pro-
vides the proper finite limit of n1ðEÞ at the bottom of the con-
duction band. This equation defines implicitly the integration
constant C in Eq. (9)
As n0ðEÞ is mostly localized in a small region of order
of phonon spectrum width E < �m above the conduction
band bottom then one can neglect the value n0ðEÞ � 1 at
E > �m.
The non-equilibrium occupation number n1ðEÞ in the
high energy region can be derived by using Eq. (13) which
determines the integration constant C in the solution (8) or
(10) of n0ðEÞ,
n1ðEÞ C�11 ðEÞ
ðEmax
E
½df ðt;E0Þ=dt�extdE0: (14)
The expression similar to Eq. (14) for the high energy “tail”
of the distribution function f1ðEÞ ¼ n1ðEÞGðEÞ was formerly
discussed in Refs. 12, 25, and 26, where the electron-hole
recombination has not been formally taken into consider-
ation. One can see now that the electron-hole recombination
actually does not affect the shape of the high-energy “tail” of
distribution.
B. The “effective phonon” model
Due to an extensive amount of complicated numerical
calculations in Eqs. (2), (3), and (9), a straightforward deri-
vation of the distribution function by Eqs. (8), (10), and (12)
is prohibitively difficult. So we offer a simple model that
adequately describes the scattering processes on the basis of
some realistic averaging procedure.
Let us define an averaged energy loss per one electron in
the process of a single transition act from an excess level E as
�avðEÞ ¼ C1ðEÞ=C0ðEÞ: (15)
In calculations of Refs. 25 and 26, it was shown that for DFT
band structures in ZnO and TiO2 this quantity manifests a
weak energy dependence. In Sec. IV, we will show that this
is also valid for GaN.
By using this observation, we introduce the model which
neglects the energy dependence of �av and considers that the
electron interacts with a single averaged “effective” vibra-
tional scatterer with a fixed energy �0. In what follows, we
identify �0 with the numerically calculated �av. Next, we
introduce the averaged electron-phonon coupling factor
which we also calculate numerically by using the DFT band
structure in Sec. IV,
PavðEÞ ¼ C0ðEÞ=G2ðEÞ: (16)
The formal averaging of (3) leads to the assumption,
Cð�;EÞ ¼ PavðEÞG2ðEÞdð�� �0Þ: (17)
Then the definition (4) implies that
ce�phðEÞ ¼ GðEÞPavðEÞ: (18)
Model expressions for C0; C1; C2 follow from defini-
tions (2)
C0ðEÞ ¼ PavðEÞG2ðEÞ;C1ðEÞ ¼ �0PavðEÞG2ðEÞ;C2ðEÞ ¼ �2
0ðNð�0Þ þ 1=2ÞPavðEÞG2ðEÞ: (19)
Taking these approximations into account, we also find
the expression for R(E) as defined by Eq. (9)
RðEÞ ¼ E=½�0ðNð�0Þ þ 1=2Þ� þ C: (20)
Then Eq. (8) for n0 acquires the form of quasi-Fermi
distribution
n0 Eð Þ ¼ expE� lkBTef f
� þ 1
� �1
; (21)
where effective temperature of the excited electrons near the
bottom of the conduction band is Tef f ¼ �0ðNð�0Þ þ 1=2Þ=kB.
085708-3 Zhukov et al. J. Appl. Phys. 120, 085708 (2016)
Reuse of AIP Publishing content is subject to the terms at: https://publishing.aip.org/authors/rights-and-permissions. Download to IP: 158.227.172.141 On: Fri, 21 Oct 2016
08:52:17
The effective chemical potential l ¼ �kBTef f C is defined
implicitly by Equation (13).
C. The case of weak degeneracy
We discuss hereafter the case of week degeneracy, when
n0ðEÞ � 1. This is a realistic case for the exposure by the
sunlight or a mercury lamp,31 when the typical number of
photons per unit cell of a crystal does not exceed 10�5. In this
case, Eq. (10) reduces to the quasi-Boltzmann distribution
n0ðEÞ ¼ A expð�E=½�0ðNð�0Þ þ 1=2Þ�Þ: (22)
For further simplification, let us introduce the separable
approximation for the emission term ½df ðt;EÞ=dt�ext in
Eq. (14),
½df ðt;EÞ=dt�ext ¼ S0ðtÞ�SðEÞ: (23)
Here, the function S0ðtÞ, in general time-dependent, is
defined to be equal to the total number of excited electrons
per unit of time, which depends on the intensity of exposure.
In the quasi-stationary regime, S0ðtÞ changes slowly,
dS0=dt� S0ðtÞ=se�ph, and can be considered as a constant
S0ðtÞ S0.
The function �SðEÞ describes the distribution of the
excited electrons over the energy scale of the conduction
band. It has to be normalized to unity:Ð
�SðEÞdE ¼ 1.
Employing this definition and effective phonon approxima-
tion, one can write the expression for the “tail” distribution
as
n1 Eð Þ S0
�0ce�ph Eð ÞG Eð Þ
ðEmax
E
�S E0ð ÞdE0: (24)
The first-principle calculations demonstrate that in GaNnear the bottom of the conduction band G(E) has almost lin-
ear energy dependence. We approximate this dependence as
GðEÞ ¼ G0E.
In general, Nð�0Þ is also a non-equilibrium distribution
of phonons, and it would be necessary to investigate its evo-
lution in conjunction with the evolution of the electron distri-
bution. However, if the duration of action of external
excitation exceeds the characteristic relaxation time of the
phonon subsystem, it can be regarded as the Boltzmann
function.
In the low-temperature limit when Nð�0Þ � 1, we can
neglect a phonon occupation number. We also neglect the
energy dependence of the recombination and trapping rate
crecðEÞ in the small energy range �m near the bottom of the
conduction band, hence crecðEÞ ¼ crec. In the high excitation
regime, the value Emax �m and in Eq. (13) it can be
replaced by infinity. This helps us, employing Eq. (13), to
find the normalization coefficient A in expression (22) for n0
A ¼ 4S0=ðcrecG0�20Þ: (25)
Now we see that the n0ðEÞ depends on the intensity of expo-
sure, via the function S0, as well as on the rate crec of trap-
ping and recombination processes.
Hence, the total electron distribution function,
f ðEÞ ¼ f0ðEÞ þ f1ðEÞ ¼ GðEÞðn0ðEÞ þ n1ðEÞÞ; (26)
is written as
f ðEÞ ¼ S0
�f4c�1
recE=�0 � c�1e�phðEÞg � exp ð�2E=�0Þ
þ c�1e�phðEÞ
ðEmax
E
�SðEÞdE
�=�0: (27)
III. TECHNICAL DETAILS
We apply the described approach to the gallium nitride
compound in the wurtzite structure. Our calculations have
been performed by employing the ab initio pseudo-potential
computer code Quantum Espresso (QE) based on the density
functional theory for the electron band structure and density-
functional perturbation theory for the phonon band states.32
The pseudo-wave functions were expanded in plane waves
with the energy cutoff of 820 eV. In the calculations of the
electron states, we employed a set of 50 wave vectors per irre-
ducible part of the Brillouin zone (IPBZ). The calculations of
the phonon states and characteristics of the electron-phonon
coupling were performed for a set of 12 wave vector in the
IPBZ. Gallium norm-conserving atomic pseudo-potential was
calculated by using the Bachelet-Hamann-Schlter method33
with Perdew-Zunger exchange-correlation potential.34 The
pseudo-potential for nitrogen was constructed within the
approach of Von Barth and Car.35 We will show later that
such a way of calculations provide very good results for both
electron and phonon band structures.
We compute the �SðEÞ distribution function also based on
the band structure calculations by means of the QE computer
code. For example, if the energy of the quantum of optical
excitation is Eexc then for the excess energy E we sum the
probabilities of all direct excitations from the electronic states
at the energy E� Eexc to the states at the energy E. Hence,
the non-normalized �SðEÞ function is
�SðEÞ ¼Xknn0
dðE� EnkÞTðnk; n0kÞdðE� Eexc � En0kÞ; (28)
where Tðnk; n0kÞ is the probability of the transition between
the states jnki and jn0ki. For the calculations of the
Tðnk; n0kÞ transition probabilities, we apply dipole approxi-
mation. The details of such an approach can be found in Ref.
36.
IV. RESULTS AND DISCUSSION
The calculated dispersion curves and the corresponding
total density of electron states are given for GaN in Fig. 1.
The direct band gap in C-point is equal to 3.25 eV, in good
agreement with the experimental value of 3.4 eV (Ref. 37).
The top of the valence band is formed by 2p-like states of
nitrogen, the bottom of the conduction band corresponds to
the 4s-like states of Ga. Also, the energy differences between
the conduction band states at symmetry points of the
Brillouin zone agree with the results of previous
085708-4 Zhukov et al. J. Appl. Phys. 120, 085708 (2016)
Reuse of AIP Publishing content is subject to the terms at: https://publishing.aip.org/authors/rights-and-permissions. Download to IP: 158.227.172.141 On: Fri, 21 Oct 2016
08:52:17
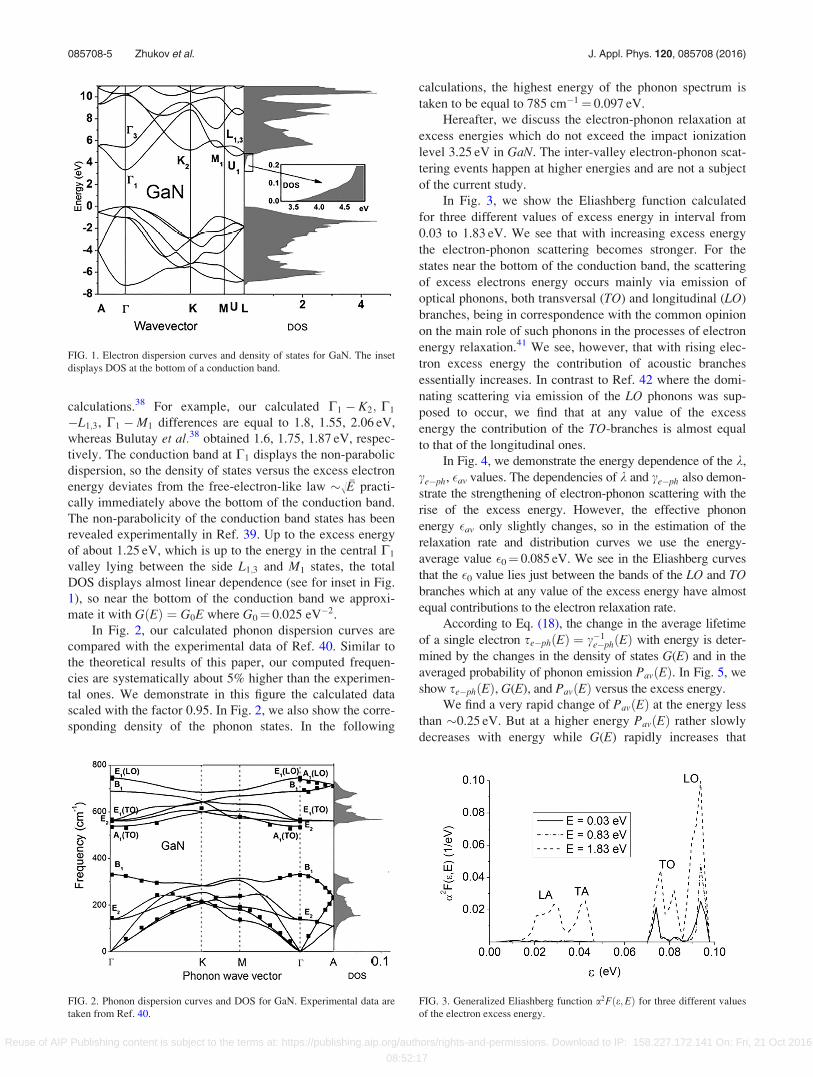
calculations.38 For example, our calculated C1 � K2; C1
�L1;3, C1 �M1 differences are equal to 1.8, 1.55, 2.06 eV,
whereas Bulutay et al.38 obtained 1.6, 1.75, 1.87 eV, respec-
tively. The conduction band at C1 displays the non-parabolic
dispersion, so the density of states versus the excess electron
energy deviates from the free-electron-like law �� �E practi-
cally immediately above the bottom of the conduction band.
The non-parabolicity of the conduction band states has been
revealed experimentally in Ref. 39. Up to the excess energy
of about 1.25 eV, which is up to the energy in the central C1
valley lying between the side L1;3 and M1 states, the total
DOS displays almost linear dependence (see for inset in Fig.
1), so near the bottom of the conduction band we approxi-
mate it with GðEÞ ¼ G0E where G0¼ 0.025 eV�2.
In Fig. 2, our calculated phonon dispersion curves are
compared with the experimental data of Ref. 40. Similar to
the theoretical results of this paper, our computed frequen-
cies are systematically about 5% higher than the experimen-
tal ones. We demonstrate in this figure the calculated data
scaled with the factor 0.95. In Fig. 2, we also show the corre-
sponding density of the phonon states. In the following
calculations, the highest energy of the phonon spectrum is
taken to be equal to 785 cm�1¼ 0.097 eV.
Hereafter, we discuss the electron-phonon relaxation at
excess energies which do not exceed the impact ionization
level 3.25 eV in GaN. The inter-valley electron-phonon scat-
tering events happen at higher energies and are not a subject
of the current study.
In Fig. 3, we show the Eliashberg function calculated
for three different values of excess energy in interval from
0.03 to 1.83 eV. We see that with increasing excess energy
the electron-phonon scattering becomes stronger. For the
states near the bottom of the conduction band, the scattering
of excess electrons energy occurs mainly via emission of
optical phonons, both transversal (TO) and longitudinal (LO)
branches, being in correspondence with the common opinion
on the main role of such phonons in the processes of electron
energy relaxation.41 We see, however, that with rising elec-
tron excess energy the contribution of acoustic branches
essentially increases. In contrast to Ref. 42 where the domi-
nating scattering via emission of the LO phonons was sup-
posed to occur, we find that at any value of the excess
energy the contribution of the TO-branches is almost equal
to that of the longitudinal ones.
In Fig. 4, we demonstrate the energy dependence of the k,
ce�ph, �av values. The dependencies of k and ce�ph also demon-
strate the strengthening of electron-phonon scattering with the
rise of the excess energy. However, the effective phonon
energy �av only slightly changes, so in the estimation of the
relaxation rate and distribution curves we use the energy-
average value �0¼ 0.085 eV. We see in the Eliashberg curves
that the �0 value lies just between the bands of the LO and TObranches which at any value of the excess energy have almost
equal contributions to the electron relaxation rate.
According to Eq. (18), the change in the average lifetime
of a single electron se�phðEÞ ¼ c�1e�phðEÞ with energy is deter-
mined by the changes in the density of states G(E) and in the
averaged probability of phonon emission PavðEÞ. In Fig. 5, we
show se�phðEÞ, G(E), and PavðEÞ versus the excess energy.
We find a very rapid change of PavðEÞ at the energy less
than �0.25 eV. But at a higher energy PavðEÞ rather slowly
decreases with energy while G(E) rapidly increases that
FIG. 2. Phonon dispersion curves and DOS for GaN. Experimental data are
taken from Ref. 40.
FIG. 3. Generalized Eliashberg function a2Fðe;EÞ for three different values
of the electron excess energy.
FIG. 1. Electron dispersion curves and density of states for GaN. The inset
displays DOS at the bottom of a conduction band.
085708-5 Zhukov et al. J. Appl. Phys. 120, 085708 (2016)
Reuse of AIP Publishing content is subject to the terms at: https://publishing.aip.org/authors/rights-and-permissions. Download to IP: 158.227.172.141 On: Fri, 21 Oct 2016
08:52:17

leads to the reduction of s. In other words, the reduction of
the electron relaxation time is determined by the expansion
of the space of electronic states available for the electron
that looses its energy via phonon emission. Note that the
changes of PavðEÞ in Fig. 5 are very similar to that observed
in our previous study of the electron dynamics.26
The available literature data on the electron relaxation
time in GaN are contradictory. In Refs. 42 and 43, the
electron-phonon relaxation time has been evaluated by using
the Frohlich theory of electron-phonon scattering which
employs the experimental values of dielectric constants
eð1Þ; eð0Þ and phonon xLO;xTO frequencies. This estima-
tion of relaxation time, 10 fs, corresponds well to our
energy-averaged data. However, the energy dependence of
the relaxation time has not been investigated.
The energy dependence of a relaxation time was investi-
gated in Refs. 38 and 44. Bulutay et al.,38 relying on the
modified Frohlich’s electron-phonon matrix elements, per-
formed the calculations of phonon-assisted scattering rate in
GaN taking into account the coupling of excited electrons
with long-wave LO and TO phonon modes. Yamakawa
et al.44 extended the model of Ref. 38 by adding the calcula-
tion of deformation potentials in semi-phenomenological
rigid-ion model. According to the calculations in Refs. 38
and 44, the relaxation rate increases with the excess energy,
although this growth is not as rapid as in our first-principle
calculations. They found also that the TO-like scattering rate
is more than two orders of magnitude lower than that of the
LO-like scattering in contrast with our Fig. 3.
Let us note in this connection that in recent ab initiostudies of electron-phonon scattering in polar crystals
(Sjakste et al.45 and Verdi and Guistino46), it was shown that
the phenomenological Frohlich’s expression properly repro-
duces the long-range scattering probability only for LO pho-
nons with small wave vectors, covering the central part of
the Brillouin zone. In the rest part of Brillouin zone, the elec-
tron interactions with LO-like phonons are of the short-range
nature.
The ab initio probabilities of the electron scattering at
TO-like and short-wavelength TA-like and LA-like phonons
are comparatively low because of their short range nature.
But as the quantity of the electron-phonon processes with the
short-range interaction in the high-excitation regime pre-
dominates so their contribution to the relaxation rate turns
out to be comparable with the contribution from the long-
wavelength LO phonons as it is shown in Fig. 3.
Ab initio calculations in GaAs47 also show that
Frohlich’s expression strongly overestimates the contribution
of LO phonon to the hot electrons’ relaxation and underesti-
mates a contribution of TO branches.
Dasgupta et al.48 in their experimental work came to the
conclusion that the relaxation rate decreases with excess
energy. However, their estimation of the relaxation rate and
time was not direct since they were based on the measure-
ments of the inelastic mean free path (IMFP) of electrons in
a hot electron transistor with GaN as the base layer. The
increase of the IMFP with the excess energy can be associ-
ated with both the increase of the electron velocity and the
reduction of the electron-defect scattering. The discrepancy
between our ab initio calculated data and experimental data
of Ref. 48 deserves a special study.
In Fig. 6, the results of our calculations for three distri-
bution curves, �SðEÞ; f0ðEÞ, and f1ðEÞ, are shown. Our aim is
to compare the values of f0ðEÞ and f1ðEÞ, so we can omit the
factor S0ðtÞ=�0. Two parameters in our evaluations are
FIG. 4. Energy dependence of the constant of electron-phonon scattering k,
the rate of the scattering ce�ph, and the averaged value of the emitted phonon
energy �av.
FIG. 5. Energy dependencies of the electron relaxation time se�phðEÞ, aver-
aged rate of the single phonon emission PavðEÞ and density of the electron
states G(E).
085708-6 Zhukov et al. J. Appl. Phys. 120, 085708 (2016)
Reuse of AIP Publishing content is subject to the terms at: https://publishing.aip.org/authors/rights-and-permissions. Download to IP: 158.227.172.141 On: Fri, 21 Oct 2016
08:52:17
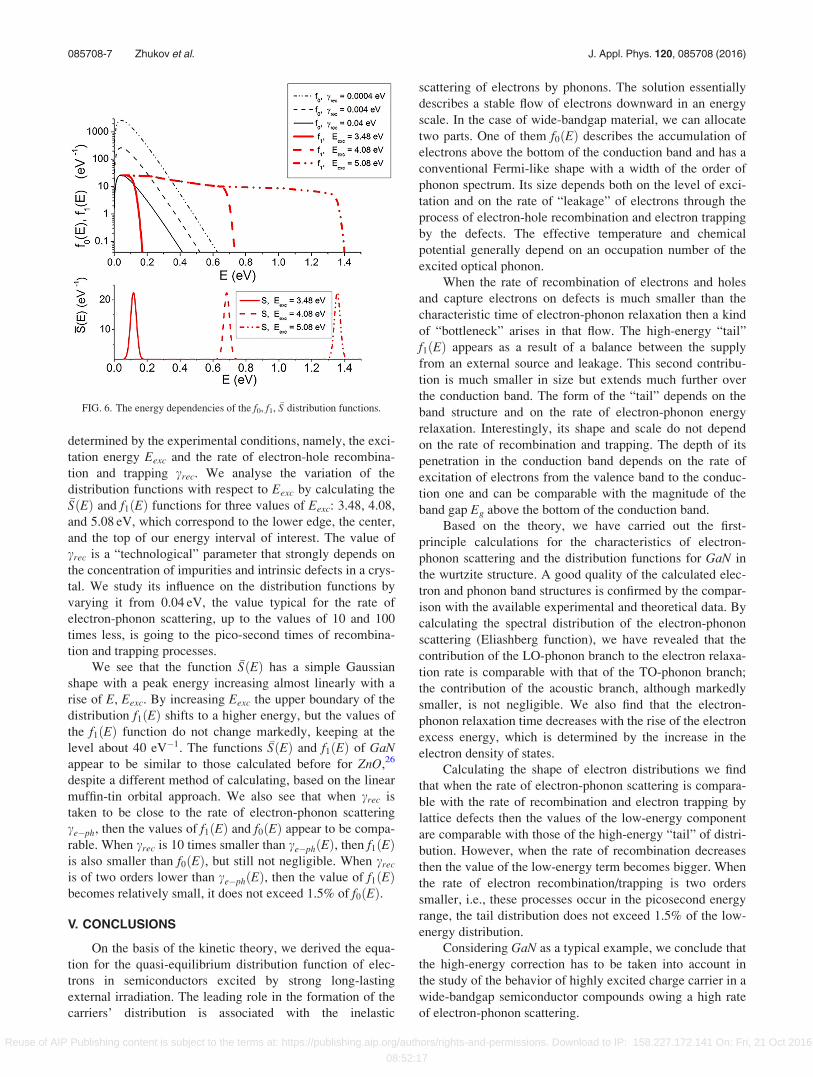
determined by the experimental conditions, namely, the exci-
tation energy Eexc and the rate of electron-hole recombina-
tion and trapping crec. We analyse the variation of the
distribution functions with respect to Eexc by calculating the�SðEÞ and f1ðEÞ functions for three values of Eexc: 3.48, 4.08,
and 5.08 eV, which correspond to the lower edge, the center,
and the top of our energy interval of interest. The value of
crec is a “technological” parameter that strongly depends on
the concentration of impurities and intrinsic defects in a crys-
tal. We study its influence on the distribution functions by
varying it from 0.04 eV, the value typical for the rate of
electron-phonon scattering, up to the values of 10 and 100
times less, is going to the pico-second times of recombina-
tion and trapping processes.
We see that the function �SðEÞ has a simple Gaussian
shape with a peak energy increasing almost linearly with a
rise of E, Eexc. By increasing Eexc the upper boundary of the
distribution f1ðEÞ shifts to a higher energy, but the values of
the f1ðEÞ function do not change markedly, keeping at the
level about 40 eV�1. The functions �SðEÞ and f1ðEÞ of GaNappear to be similar to those calculated before for ZnO,26
despite a different method of calculating, based on the linear
muffin-tin orbital approach. We also see that when crec is
taken to be close to the rate of electron-phonon scattering
ce�ph, then the values of f1ðEÞ and f0ðEÞ appear to be compa-
rable. When crec is 10 times smaller than ce�phðEÞ, then f1ðEÞis also smaller than f0ðEÞ, but still not negligible. When crec
is of two orders lower than ce�phðEÞ, then the value of f1ðEÞbecomes relatively small, it does not exceed 1.5% of f0ðEÞ.
V. CONCLUSIONS
On the basis of the kinetic theory, we derived the equa-
tion for the quasi-equilibrium distribution function of elec-
trons in semiconductors excited by strong long-lasting
external irradiation. The leading role in the formation of the
carriers’ distribution is associated with the inelastic
scattering of electrons by phonons. The solution essentially
describes a stable flow of electrons downward in an energy
scale. In the case of wide-bandgap material, we can allocate
two parts. One of them f0ðEÞ describes the accumulation of
electrons above the bottom of the conduction band and has a
conventional Fermi-like shape with a width of the order of
phonon spectrum. Its size depends both on the level of exci-
tation and on the rate of “leakage” of electrons through the
process of electron-hole recombination and electron trapping
by the defects. The effective temperature and chemical
potential generally depend on an occupation number of the
excited optical phonon.
When the rate of recombination of electrons and holes
and capture electrons on defects is much smaller than the
characteristic time of electron-phonon relaxation then a kind
of “bottleneck” arises in that flow. The high-energy “tail”
f1ðEÞ appears as a result of a balance between the supply
from an external source and leakage. This second contribu-
tion is much smaller in size but extends much further over
the conduction band. The form of the “tail” depends on the
band structure and on the rate of electron-phonon energy
relaxation. Interestingly, its shape and scale do not depend
on the rate of recombination and trapping. The depth of its
penetration in the conduction band depends on the rate of
excitation of electrons from the valence band to the conduc-
tion one and can be comparable with the magnitude of the
band gap Eg above the bottom of the conduction band.
Based on the theory, we have carried out the first-
principle calculations for the characteristics of electron-
phonon scattering and the distribution functions for GaN in
the wurtzite structure. A good quality of the calculated elec-
tron and phonon band structures is confirmed by the compar-
ison with the available experimental and theoretical data. By
calculating the spectral distribution of the electron-phonon
scattering (Eliashberg function), we have revealed that the
contribution of the LO-phonon branch to the electron relaxa-
tion rate is comparable with that of the TO-phonon branch;
the contribution of the acoustic branch, although markedly
smaller, is not negligible. We also find that the electron-
phonon relaxation time decreases with the rise of the electron
excess energy, which is determined by the increase in the
electron density of states.
Calculating the shape of electron distributions we find
that when the rate of electron-phonon scattering is compara-
ble with the rate of recombination and electron trapping by
lattice defects then the values of the low-energy component
are comparable with those of the high-energy “tail” of distri-
bution. However, when the rate of recombination decreases
then the value of the low-energy term becomes bigger. When
the rate of electron recombination/trapping is two orders
smaller, i.e., these processes occur in the picosecond energy
range, the tail distribution does not exceed 1.5% of the low-
energy distribution.
Considering GaN as a typical example, we conclude that
the high-energy correction has to be taken into account in
the study of the behavior of highly excited charge carrier in a
wide-bandgap semiconductor compounds owing a high rate
of electron-phonon scattering.
FIG. 6. The energy dependencies of the f0, f1, �S distribution functions.
085708-7 Zhukov et al. J. Appl. Phys. 120, 085708 (2016)
Reuse of AIP Publishing content is subject to the terms at: https://publishing.aip.org/authors/rights-and-permissions. Download to IP: 158.227.172.141 On: Fri, 21 Oct 2016
08:52:17
The two-photon photoemission experiments28,49–52 are
able to measure the electron distributions in energy and
momentum space. Hence, we expect that quasi-equilibrium
“tails” can manifest themselves in 2PPE measurements.
The length of the high-energy “tail” may cover a sub-
stantial part of the conduction band. Its contribution to the
total concentration of non-equilibrium carriers may be com-
parable to that of the conventional Fermi part and thus can
have a significant influence on the transport properties of the
irradiated crystal. The presence of the “tail” should lead to a
contribution in the conductivity from the carriers which
transfer the charges through highly excited states. One can
expect that this contribution should have some specific tem-
perature dependence and should only weakly depend of
doping.
The experimental evidence of high-energy “tail” already
have been observed in experiments on NaCl, KCl, KBr
excited by a powerful electron beam.53 The high-energy
mobility was measured and a quasi-metallic behavior of
high-energy conductivity was established.
ACKNOWLEDGMENTS
The work was supported by RFBR, research Project No.
15-02-00293 and the Tomsk State University Competitiveness
Improvement Program. V.G.T. acknowledges the support of
Ministry of Education and Science of Russian Federation base
part 101. The calculations have been performed by using the
URAN cluster of the Institute of mathematics and mechanics
in the Urals branch of the Russian Academy of Sciences and
SKIF CYBERIA cluster of Tomsk State University.
1A. Othonos, J. Appl. Phys. 83, 1789 (1998).2J. Shah, Ultrafast Spectroscopy of Semiconductors and SemiconductorNanostructures (Springer, New York, 1999).
3E. Bringuier, Phys. Rev. B 57, 2280 (1998).4W. Tisdale, K. Williams, B. Timp, D. Norris, E. Aydil, and X. Y. Zhu,
Science 328, 1543 (2010).5M. Dur, S. Goodnick, S. Pennathur, J. Wager, M. Reigrotzki, and R.
Redmer, J. Appl. Phys. 83, 3176 (1998).6Y. Sun, S. Boggs, and R. Ramprasad, Appl. Phys. Lett. 101, 132906
(2012).7F. Bertazzi, M. Moresco, and E. Bellotti, J. Appl. Phys. 106, 063718
(2009).8C. Wang, L. Jiang, F. Wang, X. Li, Y. Yuan, and H. Tsai, Phys. Lett. A
375, 3200 (2011).9A. A. Grinberg and S. Luryi, Phys. Rev. Lett. 65, 1251 (1990).
10Y. Gurevich, G. Logvinov, Y. Drogobitskiy, A. Carballo-Sanchez, and J.
Salazar, J. Appl. Phys. 91, 183 (2002).11D. von der Linde, K. Sokolowski-Tinten, and J. Bialkowski, Appl. Surf.
Sci. 109–110, 1 (1997).12V. P. Zhukov, V. G. Tyuterev, E. V. Chulkov, and P. M. Echenique, Int. J.
Photoenergy 2014, 738921.13M. Neges, K. Schwarzburg, and F. Willig, Sol. Energy Mater. Sol. Cells
90, 2107 (2006).14E. Tea, H. Hamzeh, and F. Aniel, J. Appl. Phys. 110, 113108 (2011).15M. Harb, R. Ernstorfer, T. Dartigalongue, C. Hebeisen, R. Jordan, and R.
Miller, J. Phys. Chem. B 110, 25308 (2006).16J. Callan, A.-T. Kim, L. Huang, and E. Mazur, Chem. Phys. 251, 167 (2000).17G. Fasol, W. Hackenberg, H. P. Hughes, K. Ploog, E. Bauser, and H.
Kano, Phys. Rev. B 41, 1461 (1990).
18P. Supancic, U. Hohenester, P. Kocevar, D. Snoke, R. Hannak, and W.
Ruhle, Phys. Rev. 53, 7785 (1996).19M. Asche and O. G. Sarbei, Phys. Status Solidi B 141, 487–491 (1987).20R. F. Leheny, J. Shah, R. L. Fork, C. V. Shank, and A. Migus, Solid State
Commun. 31, 809–813 (1979).21C. Collier, B. Born, X. Jin, and J. Holzman, Appl. Phys. Lett. 103, 072106
(2013).22C. M. Collier, B. Born, X. Jin, and J. F. Holzman, Proc. SPIE 8845,
88450U (2013).23U. Hohenester, P. Supancic, P. Kocevar, X. Q. Zhou, W. Kutt, and H.
Kurz, Phys. Rev. B 47, 13233 (1993).24S. S. Prabhu, A. S. Vengurlekar, S. K. Roy, and J. Shah, Phys. Rev. B 51,
14233 (1995).25V. Zhukov and V. Tyuterev, Phys. Solid State 54, 2173 (2012).26V. Zhukov, V. Tyuterev, and E. Chulkov, J. Phys.: Condens. Matter 24,
405802 (2012).27V. G. Tyuterev, V. P. Zhukov, P. M. Echenique, and E. V. Chulkov,
J. Phys.: Condens. Matter 27, 025801 (2015).28H. Tanimura, J. Kanasaki, K. Tanimura, J. Sjakste, N. Vast, M. Calandra,
and F. Mauri, Phys. Rev. B 93, 161203(R) (2016).29G. M. Eliashberg, Sov. Phys. JETP 11, 696 (1960).30A. H. Nayfeh, “General weakly nonlinear systems,” in Introduction to
Perturbation Techniques (Wiley-Interscience, NY, 1981), p. 177.31R. Loudon, The Quantum Theory of Light (Oxford University Press Inc.,
New York, 1983).32S. Baroni, S. de Gironcoli, and A. Dal Corso, Rev. Mod. Phys. 73, 515
(2001).33G. B. Bachelet, D. R. Hamann, and M. Schl€uter, Phys. Rev. B 26, 4199
(1982).34J. P. Perdew and A. Zunger, Phys. Rev. B 23, 5048 (1981).35A. Dal Corso, S. Baroni, R. Resta, and S. de Gironcoli, Phys. Rev. B 47,
3588 (1993).36A. Benassi, PW SCF epsilon.x users manual, Technical Report, Physics
Department, Universita degli Studi di Modena e Reggio Emilia, Report
No. INFM/S3, 2008.37B. G. Streetman and S. Banerjee, Solid State Electronic Devices, 5th ed.
(Prentice Hall, New Jersey, 2000), p. 524.38C. Bulutay, B. K. Ridley, and N. A. Zakhleniuk, Phys. Rev. B 62, 15754
(2000).39S. Syed, J. B. Heroux, Y. J. Wang, M. J. Manfra, R. J. Molnar, and H. L.
Stormer, Appl. Phys. Lett. 83, 4553 (2003).40T. Ruf, J. Serrano, M. Cardona, P. Pavone, M. Pabst, M. Krisch, M. D.
Astuto, T. Suski, I. Grzegory, and M. Leszczynski, Phys. Rev. Lett. 86,
906 (2001).41B. C. Lee, K. W. Kim, M. Dutta, and M. A. Stroscio, Phys. Rev. B 56, 997
(1997).42N. Stanton, A. Kent, A. Akimov, P. Hawker, T. Cheng, and C. T. Foxon,
J. Appl. Phys. 89, 973 (2001).43S. J. Sheih, K. Tsen, D. Ferry, A. Botchkarev, B. Sverdlov, A. Salvador,
and H. Morkoc, Appl. Phys. Lett. 67, 1757 (1995).44S. Yamakawa, S. Aboud, M. Saranit, and S. M. Goodnick, Semicond. Sci.
Technol. 19, S475 (2004).45J. Sjakste, N. Vast, M. Calandra, and F. Mauri, Phys. Rev. B 92, 054307
(2015).46C. Verdi and F. Giustino, Phys. Rev. Lett. 115, 176401 (2015).47M. Bernardi, D. Vigil-Fowler, C. S. Ong, J. B. Neaton, and S. G. Louie,
PNAS 112, 5291 (2015).48S. S. Dasgupta, J. L. Nidhi, A. Raman, C. Hurni, G. Gupta, J. Speck, and
U. Mishra, Appl. Phys. Express 6, 034002 (2013).49W. A. Tisdale, M. Muntwiler, D. J. Norris, E. S. Aydil, and X.-Y. Zhu,
J. Phys. Chem. C 112, 14682 (2008).50J.-C. Deinert, D. Wegkamp, M. Meyer, C. Richter, M. Wolf, and J.
Stahler, Phys. Rev. Lett. 113, 057602 (2014).51K. Onda, B. Li, and H. Petek, Phys. Rev B 70, 045415 (2004).52A. Argondizzo, S. Tan, and H. Petek, J. Phys. Chem. C 120, 12959 (2016).53D. Vaisburd, in Proceedings of the II International Conference on Space
Charge in Solid Dielectrics. Antibes—Juan-les-Pins, Supplement a laRevie Le Vide I Science, Technique et Applications N 275, Janvier-Fevrier-Mars (1995), pp. 126–136.
085708-8 Zhukov et al. J. Appl. Phys. 120, 085708 (2016)
Reuse of AIP Publishing content is subject to the terms at: https://publishing.aip.org/authors/rights-and-permissions. Download to IP: 158.227.172.141 On: Fri, 21 Oct 2016
08:52:17