Electroencephalogram signatures of loss and recovery of ...Electroencephalogram signatures of loss...
10
Electroencephalogram signatures of loss and recovery of consciousness from propofol Patrick L. Purdon a,b,1 , Eric T. Pierce a , Eran A. Mukamel c,d , Michael J. Prerau a , John L. Walsh a , Kin Foon K. Wong a , Andres F. Salazar-Gomez a , Priscilla G. Harrell a , Aaron L. Sampson a , Aylin Cimenser a , ShiNung Ching a,b , Nancy J. Kopell e,1 , Casie Tavares-Stoeckel a , Kathleen Habeeb f , Rebecca Merhar a , and Emery N. Brown a,b,g,h,1 a Department of Anesthesia, Critical Care, and Pain Medicine, and f Clinical Research Center, Massachusetts General Hospital, Boston, MA 02114; b Department of Brain and Cognitive Sciences, g Division of Health Sciences and Technology, and h Institute for Medical Engineering and Science, Massachusetts Institute of Technology, Cambridge, MA 02139; c Center for Brain Science, Harvard University, Cambridge, MA 02139; d Center for Theoretical Biological Physics, University of California at San Diego, La Jolla, CA 92093; and e Department of Mathematics and Statistics, Boston University, Boston, MA 02215 Contributed by Nancy J. Kopell, January 3, 2013 (sent for review September 22, 2012) Unconsciousness is a fundamental component of general anesthe- sia (GA), but anesthesiologists have no reliable ways to be certain that a patient is unconscious. To develop EEG signatures that track loss and recovery of consciousness under GA, we recorded high- density EEGs in humans during gradual induction of and emer- gence from unconsciousness with propofol. The subjects executed an auditory task at 4-s intervals consisting of interleaved verbal and click stimuli to identify loss and recovery of consciousness. During induction, subjects lost responsiveness to the less salient clicks before losing responsiveness to the more salient verbal stimuli; during emergence they recovered responsiveness to the verbal stimuli before recovering responsiveness to the clicks. The median frequency and bandwidth of the frontal EEG power tracked the probability of response to the verbal stimuli during the transitions in consciousness. Loss of consciousness was marked simultaneously by an increase in low-frequency EEG power (<1 Hz), the loss of spatially coherent occipital alpha oscillations (8–12 Hz), and the appearance of spatially coherent frontal alpha oscil- lations. These dynamics reversed with recovery of consciousness. The low-frequency phase modulated alpha amplitude in two dis- tinct patterns. During profound unconsciousness, alpha amplitudes were maximal at low-frequency peaks, whereas during the transi- tion into and out of unconsciousness, alpha amplitudes were max- imal at low-frequency nadirs. This latter phase–amplitude relationship predicted recovery of consciousness. Our results provide insights into the mechanisms of propofol-induced unconsciousness, establish EEG signatures of this brain state that track transitions in conscious- ness precisely, and suggest strategies for monitoring the brain activity of patients receiving GA. G eneral anesthesia (GA), a drug-induced state comprising unconsciousness, amnesia, analgesia, and immobility with maintenance of physiological stability (1, 2), is a cornerstone of modern medicine that is crucial for safely performing most sur- gical and many nonsurgical procedures. In the United States, nearly 60,000 people receive GA daily for surgery alone (1), sug- gesting that no physicians manipulate the state of the brain more often or more profoundly than anesthesiologists. Ironically, brain- state monitoring is not an accepted practice in anesthesia care because markers that reliably track changes in level of con- sciousness under GA have yet to be identified (3, 4). The standards for assessing if patients are adequately anesthetized include in- direct measures of brain state—changes in heart rate, blood pressure, and muscle tone—along with presumed drug pharma- cokinetics, pharmacodynamics, and, for inhaled anesthetics, the level of exhaled anesthetic gas. The EEG, which measures scalp electrical potentials generated by cortical postsynaptic currents (5), has long been considered the most feasible approach for tracking brain states under GA. The first EEG recordings in humans under GA, reported in 1937, revealed systematic changes with increasing doses of both ether and pentobarbital (6). Despite attempts to characterize EEG morphology under GA (6–9), reading the EEG has not become part of routine anesthesiology practice. Instead, a simpler ap- proach is used: Present-day depth-of-anesthesia monitors com- pute proprietary indices that reduce the EEG to a single, easy-to- interpret number intended to represent a patient’s level of un- consciousness (10–15). These indices are designed to apply to all anesthetics and are constructed from a combination of spectral and entropy measures that typically require tens of seconds to compute (3, 16). Despite the appeal of this approach, these in- dices relate only indirectly to level of unconsciousness. Compared with non–EEG-based approaches, they have been ineffective in reducing the incidence of intraoperative awareness, i.e., when patients are aware under GA even though they appear to be un- conscious (4). The need to develop principled neurophysiological approaches to monitoring the state of the brain under GA has become particularly compelling given growing concerns about its possible detrimental effects, including emergence delirium in children (17), adverse developmental effects in neonates and infants (18), and cognitive dysfunction in the elderly (19). The black-box approach of these indices obscures structure in the EEG signal, visible even in 1937 (6), that could be related directly to the state of consciousness in the same way that the electrocardiogram, blood pressure, and cardiac output can be related to the state of the cardiovascular system. A variety of EEG patterns are known to arise during GA maintained by both GABA A receptor-specific and ether-derived anesthetics. These EEG patterns include increases in frontal EEG power (20–24), a shift in EEG power toward lower frequencies (25), changes in coherence (22, 26), and burst suppression and isoelectricity (27). However, the relationship between these or other EEG patterns Significance Anesthesiologists reversibly manipulate the brain function of nearly 60,000 patients each day, but brain-state monitoring is not an accepted practice in anesthesia care because markers that reliably track changes in level of consciousness under general anesthesia have yet to be identified. We found specific behavioral and electrophysiological changes that mark the transition between consciousness and unconsciousness in- duced by propofol, one of the most commonly used anesthetic drugs. Our results provide insights into the mechanisms of propofol-induced unconsciousness and establish EEG sig- natures of this brain state that could be used to monitor the brain activity of patients receiving general anesthesia. Author contributions: P.L.P., E.T.P., J.L.W., and E.N.B. designed research; P.L.P., E.T.P., J.L.W., A.F.S.-G., P.G.H., C.T.-S., K.H., R.M., and E.N.B. performed research; P.L.P., E.A.M., M.J.P., K.F.K.W., A.C., and E.N.B. contributed new analytic tools; P.L.P., E.A.M., M.J.P., K.F.K.W., A.F.S.-G., A.L.S., A.C., S.C., N.J.K., and E.N.B. analyzed data; and P.L.P. and E.N.B. wrote the paper. Conflict of interest statement: P.L.P. and E.N.B. have a patent pending on anesthesia monitoring. Freely available online through the PNAS open access option. 1 To whom correspondence may be addressed. E-mail: [email protected], [email protected], or [email protected]. This article contains supporting information online at www.pnas.org/lookup/suppl/doi:10. 1073/pnas.1221180110/-/DCSupplemental. E1142–E1151 | PNAS | Published online March 4, 2013 www.pnas.org/cgi/doi/10.1073/pnas.1221180110 Downloaded by guest on June 1, 2020
Transcript of Electroencephalogram signatures of loss and recovery of ...Electroencephalogram signatures of loss...

Electroencephalogram signatures of loss and recoveryof consciousness from propofolPatrick L. Purdona,b,1, Eric T. Piercea, Eran A. Mukamelc,d, Michael J. Preraua, John L. Walsha, Kin Foon K. Wonga,Andres F. Salazar-Gomeza, Priscilla G. Harrella, Aaron L. Sampsona, Aylin Cimensera, ShiNung Chinga,b,Nancy J. Kopelle,1, Casie Tavares-Stoeckela, Kathleen Habeebf, Rebecca Merhara, and Emery N. Browna,b,g,h,1
aDepartment of Anesthesia, Critical Care, and Pain Medicine, and fClinical Research Center, Massachusetts General Hospital, Boston, MA 02114; bDepartmentof Brain and Cognitive Sciences, gDivision of Health Sciences and Technology, and hInstitute for Medical Engineering and Science, Massachusetts Instituteof Technology, Cambridge, MA 02139; cCenter for Brain Science, Harvard University, Cambridge, MA 02139; dCenter for Theoretical Biological Physics,University of California at San Diego, La Jolla, CA 92093; and eDepartment of Mathematics and Statistics, Boston University, Boston, MA 02215
Contributed by Nancy J. Kopell, January 3, 2013 (sent for review September 22, 2012)
Unconsciousness is a fundamental component of general anesthe-sia (GA), but anesthesiologists have no reliable ways to be certainthat a patient is unconscious. To develop EEG signatures that trackloss and recovery of consciousness under GA, we recorded high-density EEGs in humans during gradual induction of and emer-gence from unconsciousness with propofol. The subjects executedan auditory task at 4-s intervals consisting of interleaved verbaland click stimuli to identify loss and recovery of consciousness.During induction, subjects lost responsiveness to the less salientclicks before losing responsiveness to the more salient verbalstimuli; during emergence they recovered responsiveness to theverbal stimuli before recovering responsiveness to the clicks. Themedian frequency and bandwidth of the frontal EEG powertracked the probability of response to the verbal stimuli duringthe transitions in consciousness. Loss of consciousness was markedsimultaneously by an increase in low-frequency EEG power (<1Hz), the loss of spatially coherent occipital alpha oscillations (8–12Hz), and the appearance of spatially coherent frontal alpha oscil-lations. These dynamics reversed with recovery of consciousness.The low-frequency phase modulated alpha amplitude in two dis-tinct patterns. During profound unconsciousness, alpha amplitudeswere maximal at low-frequency peaks, whereas during the transi-tion into and out of unconsciousness, alpha amplitudes were max-imal at low-frequency nadirs. This latter phase–amplitude relationshippredicted recovery of consciousness. Our results provide insightsinto the mechanisms of propofol-induced unconsciousness, establishEEG signatures of this brain state that track transitions in conscious-ness precisely, and suggest strategies for monitoring the brainactivity of patients receiving GA.
General anesthesia (GA), a drug-induced state comprisingunconsciousness, amnesia, analgesia, and immobility with
maintenance of physiological stability (1, 2), is a cornerstone ofmodern medicine that is crucial for safely performing most sur-gical and many nonsurgical procedures. In the United States,nearly 60,000 people receive GA daily for surgery alone (1), sug-gesting that no physicians manipulate the state of the brain moreoften or more profoundly than anesthesiologists. Ironically, brain-state monitoring is not an accepted practice in anesthesia carebecause markers that reliably track changes in level of con-sciousness underGAhave yet to be identified (3, 4). The standardsfor assessing if patients are adequately anesthetized include in-direct measures of brain state—changes in heart rate, bloodpressure, and muscle tone—along with presumed drug pharma-cokinetics, pharmacodynamics, and, for inhaled anesthetics, thelevel of exhaled anesthetic gas.The EEG, which measures scalp electrical potentials generated
by cortical postsynaptic currents (5), has long been considered themost feasible approach for tracking brain states under GA. Thefirst EEG recordings in humans under GA, reported in 1937,revealed systematic changes with increasing doses of both etherand pentobarbital (6). Despite attempts to characterize EEGmorphology under GA (6–9), reading the EEG has not becomepart of routine anesthesiology practice. Instead, a simpler ap-
proach is used: Present-day depth-of-anesthesia monitors com-pute proprietary indices that reduce the EEG to a single, easy-to-interpret number intended to represent a patient’s level of un-consciousness (10–15). These indices are designed to apply to allanesthetics and are constructed from a combination of spectraland entropy measures that typically require tens of seconds tocompute (3, 16). Despite the appeal of this approach, these in-dices relate only indirectly to level of unconsciousness. Comparedwith non–EEG-based approaches, they have been ineffective inreducing the incidence of intraoperative awareness, i.e., whenpatients are aware under GA even though they appear to be un-conscious (4). The need to develop principled neurophysiologicalapproaches to monitoring the state of the brain under GA hasbecome particularly compelling given growing concerns about itspossible detrimental effects, including emergence delirium inchildren (17), adverse developmental effects in neonates andinfants (18), and cognitive dysfunction in the elderly (19).The black-box approach of these indices obscures structure in
the EEG signal, visible even in 1937 (6), that could be relateddirectly to the state of consciousness in the same way that theelectrocardiogram, blood pressure, and cardiac output can berelated to the state of the cardiovascular system. A variety ofEEG patterns are known to arise during GA maintained by bothGABAA receptor-specific and ether-derived anesthetics. TheseEEG patterns include increases in frontal EEG power (20–24),a shift in EEG power toward lower frequencies (25), changes incoherence (22, 26), and burst suppression and isoelectricity (27).However, the relationship between these or other EEG patterns
Significance
Anesthesiologists reversibly manipulate the brain function ofnearly 60,000 patients each day, but brain-state monitoring isnot an accepted practice in anesthesia care because markersthat reliably track changes in level of consciousness undergeneral anesthesia have yet to be identified. We found specificbehavioral and electrophysiological changes that mark thetransition between consciousness and unconsciousness in-duced by propofol, one of the most commonly used anestheticdrugs. Our results provide insights into the mechanisms ofpropofol-induced unconsciousness and establish EEG sig-natures of this brain state that could be used to monitor thebrain activity of patients receiving general anesthesia.
Author contributions: P.L.P., E.T.P., J.L.W., and E.N.B. designed research; P.L.P., E.T.P., J.L.W.,A.F.S.-G., P.G.H., C.T.-S., K.H., R.M., and E.N.B. performed research; P.L.P., E.A.M., M.J.P.,K.F.K.W., A.C., and E.N.B. contributed new analytic tools; P.L.P., E.A.M., M.J.P., K.F.K.W., A.F.S.-G.,A.L.S., A.C., S.C., N.J.K., and E.N.B. analyzed data; and P.L.P. and E.N.B. wrote the paper.
Conflict of interest statement: P.L.P. and E.N.B. have a patent pending onanesthesia monitoring.
Freely available online through the PNAS open access option.1To whom correspondence may be addressed. E-mail: [email protected],[email protected], or [email protected].
This article contains supporting information online at www.pnas.org/lookup/suppl/doi:10.1073/pnas.1221180110/-/DCSupplemental.
E1142–E1151 | PNAS | Published online March 4, 2013 www.pnas.org/cgi/doi/10.1073/pnas.1221180110
Dow
nloa
ded
by g
uest
on
June
1, 2
020
and the loss and recovery of consciousness remain poorly un-derstood. In particular, it has been difficult to identify specificEEG signatures that are associated with the point of loss ofconsciousness (LOC), because most anesthesia-related EEGdata come from clinical settings in which GA induction is per-formed rapidly, causing the crucial transition from consciousnessto unconsciousness within 30–60 s (1). Compounding this rapidLOC is the problem of measuring level of consciousness. Themost common approach is to ask patients to respond to a verbalor physical stimulus and rate the quality of responses on a 0–5numerical scale (10, 28). This highly subjective assessment usu-ally is repeated on a time-scale of minutes (10, 29) and resolvespoorly the time point at which consciousness is lost or regained.EEG signatures that predict return of consciousness have beendifficult to establish for similar reasons.To study the relationship between EEG activity and the loss
and recovery of consciousness, we recorded high-density (64-channel) EEGs while administering increasing (induction) anddecreasing (emergence) doses of propofol to 10 healthy volun-teers executing a structured auditory-response task to assessconscious behavior. Over an ∼2-h period, we used a computer-controlled infusion to increase the target effect-site concentrationof propofol gradually from a baseline of 0 μg/mL to a peak levelof 5 μg/mL (30). We then gradually decreased the propofol target
effect-site concentration until it once again was 0 μg/mL (Fig.1A). During the infusion, subjects listened to prerecorded audi-tory stimuli, presented once every 4 s, consisting of their names,words, and a train of clicks. The subject’s task was to identify thestimulus type with an appropriate button press. The time-seriesof responses provided a behavioral marker of the state of con-sciousness. We analyzed the EEG using time-varying spectral,coherence, and phase–amplitude methods and related thesequantities to the probability of response to the auditory stimuli.We identified highly structured EEG signatures that can be usedto monitor and manage the states of unconsciousness and seda-tion induced by propofol. These findings also provide insightsinto the mechanisms of propofol-induced unconsciousness.
ResultsContinuous Transitions Between Consciousness and Unconsciousness.To track changes in level of consciousness quantitatively in re-lation to propofol’s target effect-site concentration (Fig. 1A), weused a Bayesian state-space algorithm (31) to estimate from thetime-series of correct and incorrect responses each subject’sresponse-probability curve for the verbal stimuli (neutral wordsand subject’s name), Pverbal, and response-probability curve forthe click stimuli, Pclicks (Fig. 1B). We used the same method tocalculate the difference between the response-probability curves,
Con
cent
ratio
n (
g/m
l)
00.05
0.5
0.951
P(R
espo
nse)
EON LOC ROC EOFF
0
0.5
1
Pve
rbal
− P
clic
ks
00.05
0.5
0.951
LOC
P(R
espo
nse)
ROC
−30 −15 0 15 30
0
0.5
1
Pve
rbal
− P
clic
ks
Time difference from LOC (min)−30 −15 0 15 30
Time difference from ROC (min)
A
B
C
D
E
Clicks
Verbal
Verbal - Clicks
Probabilty of Response
Propofol Level
ecnegremEnoitcudnIenilesaB
Probabilty of Response
Difference in Probability: PVerbal-PClicks
Difference in Probability: PVerbal-PClicks
Individual Subject
Group Level
0 20 40 60 80 100 120 1400
5
Time (min)
EON ECORCOL OFF
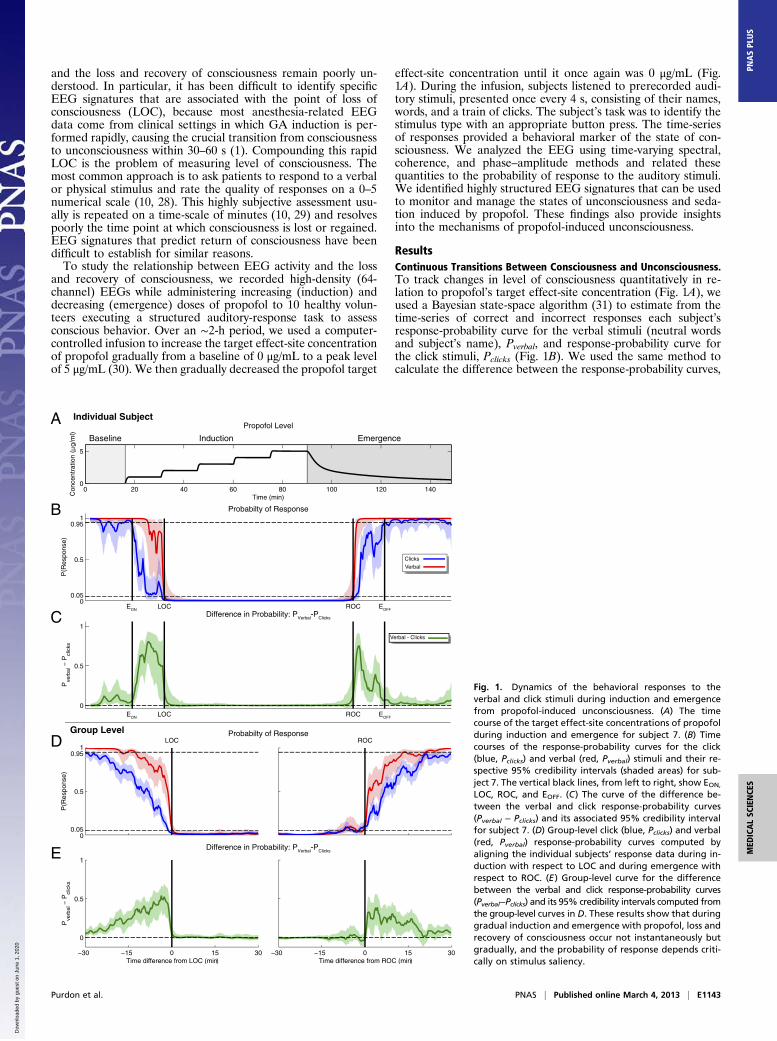
Fig. 1. Dynamics of the behavioral responses to theverbal and click stimuli during induction and emergencefrom propofol-induced unconsciousness. (A) The timecourse of the target effect-site concentrations of propofolduring induction and emergence for subject 7. (B) Timecourses of the response-probability curves for the click(blue, Pclicks) and verbal (red, Pverbal) stimuli and their re-spective 95% credibility intervals (shaded areas) for sub-ject 7. The vertical black lines, from left to right, show EON,
LOC, ROC, and EOFF. (C) The curve of the difference be-tween the verbal and click response-probability curves(Pverbal − Pclicks) and its associated 95% credibility intervalfor subject 7. (D) Group-level click (blue, Pclicks) and verbal(red, Pverbal) response-probability curves computed byaligning the individual subjects’ response data during in-duction with respect to LOC and during emergence withrespect to ROC. (E) Group-level curve for the differencebetween the verbal and click response-probability curves(Pverbal−Pclicks) and its 95% credibility intervals computed fromthe group-level curves in D. These results show that duringgradual induction and emergence with propofol, loss andrecovery of consciousness occur not instantaneously butgradually, and the probability of response depends criti-cally on stimulus saliency.
Purdon et al. PNAS | Published online March 4, 2013 | E1143
MED
ICALSC
IENCE
SPN
ASPL
US
Dow
nloa
ded
by g
uest
on
June
1, 2
020

Pverbal − Pclicks (Fig. 1C). During induction Pclicks tended to de-crease before Pverbal, whereas during emergence Pverbal tended toincrease before Pclicks. To analyze this observation formally, wedefined behavioral time markers for each subject, based on thePclicks and Pverbal curves, to compare and pool data across subjects.We defined the first indication of a change in consciousness, theeffect onset (EON), as the first time during induction at whichPclicks was less than 0.95 and remained so for at least 5 min. Wechose a 5-min interval because it is approximately three times theequilibration time-constant for propofol (30). Similarly, we de-fined the effect offset (EOFF) as the first time during emergenceat which Pclicks was greater than 0.95 and remained greater for atleast 5 min. We defined LOC as the first time during induction atwhich Pverbal was less than 0.05 and remained so for at least 5 minand return of consciousness (ROC) as the first time duringemergence at which Pverbal was greater than 0.95 and remained sofor at least 5 min.We used Bayesian statistical inference to determine if Pclicks <
Pverbal by computing the posterior probability Pr{Pclicks < Pverbal}.During induction, in 10 of 10 subjects, we observed that Pclicks <Pverbal during the transition between EON and LOC; an exampleis shown in Fig. 1C. This condition is indicated by the fact that Pr{Pclicks < Pverbal} = Pr{0 < Pverbal − Pclicks} > 0.95, or equiva-lently, that the 95% credibility intervals for Pverbal − Pclicks(shaded area in Fig. 1C) do not include 0 during this period. Thetransition between EON and LOC required a median of 23.9 min(minimum, 6.7 min; 25th percentile, 16.4 min; 75th percentile,28.6 min; maximum 32.8 min). We estimated group-level Pclicks,Pverbal, and Pverbal − Pclicks curves for both induction and emer-gence by aligning the responses to the auditory tasks with respectto LOC and ROC, respectively (Fig. 1 D and E). The group-levelanalysis corroborated the individual subject analyses, showingthat Pclicks < Pverbal during the transition to LOC (Pr{Pclicks <Pverbal} > 0.95; Fig. 1E). Moreover, the group-level curvesshowed a gradual increase in the difference between theseresponse probabilities as subjects approached LOC (Fig. 1E).During emergence, individual response-probability curves
were more variable, but again we found that Pclicks < Pverbal at thegroup level (Pr{Pclicks < Pverbal} > 0.95; Fig. 1E). During emer-gence, 6 of 10 subjects did not reach EOFF because they did notachieve Pclicks > 0.95 for 5 min or longer. Therefore we conser-vatively estimated the emergence transition time by using eitherEOFF or the end of the recording if EOFF was not achieved. Allsubjects were conscious at the end of the recording time. Wefound that the transition between ROC and EOFF requireda median of 25.5 min (minimum, 4.9 min; 25th percentile, 12.8min; 75th percentile, 38.0 min; maximum, 47.6 min). Theseresults show that during gradual induction of and emergencefrom GA with propofol, loss and recovery of consciousness donot occur instantaneously but instead show gradual transitionsduring which the probability of response depends critically onstimulus saliency.
Dynamics of the EEG Spectrum Covary with Changes in Probability ofResponse and LOC/ROC. To analyze the dynamics of EEG oscil-lations during induction of and emergence from GA, we com-puted time-varying spectra (spectrograms) (32). We computedgroup-level spectrograms by taking the median baseline-nor-malized spectrogram across subjects, aligned at LOC for in-duction and at ROC for emergence (Fig. 2B). To minimizespatial blurring in this and subsequent analyses, we used a near-est-neighbor Laplacian reference, in which the Laplacian is cal-culated by taking each channel and subtracting the average of thenearest neighbors (24). During induction, gamma (25–40 Hz)and beta (13–24Hz) power increased significantly above baselinelevels during the 30 min before LOC—when Pclicks < Pverbal—andremained elevated during the unconscious period (Fig. 2 B andC). At LOC, both alpha (8–12 Hz) and low-frequency (0.1–1 Hz)power increased significantly (Fig. 2 B and C). Fifteen minutesafter LOC, the increases in alpha power were concentrated infrontal channels, whereas those for low-frequency power were
distributed broadly across temporal and parietal channels (Fig.2D). During emergence, these changes in power occurred inreverse, following a similar time course: Frontal alpha and low-frequency power decreased at ROC, whereas gamma/beta powerremained elevated throughout the post-ROC period whenPclicks < Pverbal. These analyses show that changes in broad-bandgamma/beta power coincide with the behavior changes beforeLOC and after ROC, whereas changes in slow and alpha powercoincide with LOC and ROC.The standard definitions of the alpha, beta, and gamma EEG
frequency bands provide a convenient shorthand for describingdifferent oscillations. However, Fig. 2B makes clear that thesepropofol-induced oscillations are not confined neatly to singlebands but instead move among these bands to varying degreesduring both induction and emergence. Furthermore, when weexamined individual subject spectrograms (e.g., Fig. S1), thebroad-band gamma/beta power seen before LOC appeared todecrease continuously in frequency and bandwidth toward thealpha range, and then appeared to increase in frequency andbandwidth after ROC. To characterize this changing frequencydistribution quantitatively, we estimated the median frequencyand bandwidth (interquartile range) of the group-level baseline-normalized spectrograms in the frequency range between 2 and40 Hz (Fig. 3A; see SI Text for additional details). We chose the2–40 Hz interval to provide a broad range of frequencies whileavoiding bias introduced by power in the low-frequency (0.1–1Hz) band.During induction, in the transition period before LOC, the
median frequency decreased from 23.1 to 12.0 Hz, and thebandwidth decreased from 17.4 to 9.1 Hz (Fig. 3A). Duringemergence, in the transition period after ROC, the median fre-quency increased from 11.8 to 21.9 Hz, and the bandwidth in-creased from 9.9 to 12.8 Hz. We analyzed the spatial distributionof power at the median frequency at different behavioral timepoints for each subject and computed group-level spatial esti-mates at each time point by taking the median power acrosssubjects. We used the previously defined behavioral time points(EON, LOC, ROC, and EOFF), along with three newly definedtime points—Pre-LOC (the midpoint between EON and LOC),Unconscious (the midpoint between LOC and ROC), and Post-LOC (the midpoint between ROC and EOFF)—to providea higher temporal resolution in our analysis.We found that the power at the median frequency had a frontal
distribution across the different behavioral time points (Fig. 3B).To compare this spatial distribution of power at the medianfrequency with activity in the traditional frequency bands, weexamined the spatial distribution of power within the gamma,beta, and alpha bands at the same time points (Fig. S2). Gammaand beta power showed a frontal distribution from Pre-LOCthrough LOC; during unconsciousness the frontal power distribu-tion moved to the beta and alpha bands, consistent with the de-creasing trend in the median frequency. During emergence, frontalpower shifted from the alpha and beta bands to span the beta andgamma bands, again consistent with the increasing median fre-quency. In addition, frontal gamma power appeared to persistthrough EOFF. These results show that activity in the gamma, beta,and alpha bands varies continuously during the transitions into andout of propofol-induced unconsciousness, and that power in thesebands all have a common frontal distribution. To distinguish thispattern of continuously varying median frequency and bandwidthfrom activity within traditional fixed-frequency bands, we refer tothis phenomenon as the “traveling peak.”
Changes in Spatially Coherent Alpha Activity Mark Unconsciousness.Because low-frequency and alpha oscillation power are prom-inent across the entire scalp and the frontal areas, respectively,during unconsciousness (Fig. 2D), we investigated the degree towhich activity in these frequency bands was spatially coherent.We performed eigenvector decompositions of the cross-spectralmatrices and analyzed the spatial distribution of the first eigen-vector, or principal mode, at all frequencies from 0.1 to 40 Hz in
E1144 | www.pnas.org/cgi/doi/10.1073/pnas.1221180110 Purdon et al.
Dow
nloa
ded
by g
uest
on
June
1, 2
020

the baseline and unconscious states. We used the modal pro-jection, i.e., the fraction of power explained by the principalmode at each frequency as a function of time, to measure thedegree of coherent spatial activity (Fig. 4) (24, 32, 33). If a highfraction of the variance is explained by a principal mode, itsuggests that there is highly coherent spatial activity at the as-sociated frequency. We aligned the modal projection acrosssubjects with respect their respective LOCs and ROCs to con-struct group-level summaries (Fig. 4).Only the principal mode in the alpha frequency band was
prominent throughout the study (Fig. 4). At baseline, the alphafrequency had an occipital distribution because all subjects wereinstructed to keep their eyes closed throughout the study to avoideye-movement artifacts and confounds (Fig. 4 A and B). Hence,the occipital alpha is consistent with the well-known awake eyes-closed state (34). Occipital prominence of the principal mode waspresent while the subjects were awake, ended at LOC, andreturned, and remained prominent after ROC. In contrast, duringunconsciousness, the principal mode in the alpha range wasprominent in a frontal distribution (Fig. 4 C and D). Frontalprominence of the alpha principal mode occurred at the sametime and frequency range (∼10 Hz) as the increased frontal alphapower (Fig. 2) and the traveling peak (Fig. 3). In contrast, lowfrequencies did not show a prominent principal mode, eventhough low-frequency power increased bymore than 10-fold in the
unconscious state compared with baseline (Fig. 2). These findingsdemonstrate that with propofol the transition from awake eyes-closed consciousness to unconsciousness is marked by the loss ofspatially coherent occipital alpha oscillations and the appearanceof spatially coherent frontal alpha oscillations. At ROC, the spa-tially coherent frontal alpha oscillations disappear and the spa-tially coherent occipital alpha oscillations return.
Different Patterns of Phase–Amplitude Modulation Mark ProfoundUnconsciousness and Recovery of Consciousness. To investigatefurther the structure in the prominent low-frequency and alphaoscillations observed during unconsciousness, we analyzed phase–amplitude modulation between the rhythms (35). That is, wecomputed the extent to which the phase of the low-frequencyoscillations modulated the amplitude of the alpha and beta (8–14Hz) oscillations by computing time-varying phase–amplitudehistograms for each subject and for the group aligned atLOC and ROC (36). As described in ref. 36 and in theMaterialsand Methods, we bandpass filtered the EEG signal to obtainlow-frequency and alpha/beta components and used the Hilberttransform to estimate low-frequency phase and alpha and betaamplitude.Our analysis identified two distinct patterns of phase–amplitude
modulation. During induction, beginning ∼20 min before LOCand extending∼10min after LOC, the alpha/beta amplitudes were
0
1LOC
P(R
espo
nse)
Fre
quen
cy (
Hz)
0
10
20
30
40
−30 −15 0 15 30
100
101
102
Time rel. LOC (min)
Med
ian
norm
aliz
ed p
ower
0
1ROC
Median norm
alized spectrum (dB
)
−30 −15 0 15 30Time rel. ROC (min)
0.1−1 Hz8−12 Hz25−35 Hz
0.1−1 Hz 8−12 Hz 25−35 Hz
Norm
alized median pow
er (dB)
−5
0
5
10
15
Clicks
Verbal
Time = LOC +15 min
A
B
C
D
2
4
6
8
10
12
14
Group Level Probability of Response
Baseline-Normalized Spectrogram
Baseline-Normalized Power
Spatial Distribution of Baseline-Normalized Power
CORCOL
Fig. 2. Dynamics of the EEG spectrogram duringinduction and emergence from propofol-inducedunconsciousness. (A) Group-level click (blue, Pclicks)and verbal (red, Pverbal) response-probability curves,as shown previously in Fig. 1D. (B) Group-levelbaseline-normalized spectrograms from a frontalchannel (approximately Fz, nearest-neighbor Lap-lacian reference) aligned with respect to LOC andROC. The white contour circumscribes the regionswhere power differs significantly from baseline (P <0.05, sign test) and indicates significant increases inpower spanning low-frequency (0.1–1Hz) throughgamma (25–35 Hz) bands. (C) Group-level timecourse of power in low-frequency, alpha (8–12 Hz),and gamma bands aligned with respect to LOC andROC. (D) Group-level spatial distribution of low-frequency, alpha, and gamma power during un-consciousness (LOC + 15 min). These analyses showthat changes in broad-band gamma/beta powercoincide with the behavioral changes before LOCand after ROC, whereas changes in slow and alphapower coincide with LOC and ROC.
Purdon et al. PNAS | Published online March 4, 2013 | E1145
MED
ICALSC
IENCE
SPN
ASPL
US
Dow
nloa
ded
by g
uest
on
June
1, 2
020

largest at the troughs of low-frequency oscillations (Fig. 5 B andC;P < 0.05 in 9 of 10 subjects within 10 min of LOC by permutationtest, detailed in ref. 36; the troughs are Laplacian surface-negativedeflections).We term this pattern “trough-max.”During profoundunconsciousness, i.e., from 10–40 min after LOC, the phase–am-plitude modulation shifted by 180°, such that the alpha/betaamplitudes were largest at the peaks of low-frequency oscillations(Fig. 5 B and D; P < 0.05 in 8 of 10 subjects by permutation test;the peaks are Laplacian surface-positive deflections).We term thispattern “peak-max.” Both phase–amplitude modulation patternswere readily apparent in the raw EEG traces (Fig. 5 C and D).During emergence, the phase–amplitude modulation reverted tothe trough-max pattern at ∼15 min before ROC (Fig. 5B; P < 0.05in 9 of 10 subjects, permutation test). More generally, we foundthat the low-frequency oscillations modulated a range of fre-quencies from the theta band through the gamma band (Fig. S3).
Our findings suggest that the peak-max pattern is a marker ofprofound unconsciousness, and the transition from the peak-maxpattern to the trough-max pattern predicts when subjects may beable to recover consciousness.
DiscussionThe mechanisms of unconsciousness caused by GA are regardedas one of the great mysteries of medicine (37). By combininggradual induction and emergence with a task paradigm capable oftracking changes in behavior every 4 s, our study offers behavioralmarkers and EEG signatures characterizing loss and recovery ofconsciousness from propofol and mechanistic insights into howpropofol may induce unconsciousness. Our findings are (i) thebehavioral changes in the transitions between consciousness andunconsciousness depend critically on stimulus saliency; (ii) themedian frequency and bandwidth of frontal EEG power (the
2
Fre
quen
cy (
Hz)
EON Pre−LOC LOC
Power (dB)−5 0 5 10
Unconscious ROC Post−ROC EOFF
A
B
)−30 −15 0 15 30
10
20
30
40
)−30 −15 0 15 30
Time difference from LOC (min Time difference from ROC (min
Traveling Peak Frequency and Bandwidth
Traveling Peak Spatial Distribution
CORCOL
Fig. 3. Time course of the traveling peak, thecontinuous transformation in median frequencyand bandwidth spanning the gamma, beta, andalpha bands during the transitions into and out ofunconsciousness. (A) Group-level spectrograms com-puted between 2 and 40 Hz for a single frontalchannel (approximately Fz, nearest-neighbor Lap-lacian reference), aligned with respect to LOC (Left)and ROC (Right) and normalized by the baselinespectrum. The 25th, median, and 75th percentileswithin this frequency range are overlaid in white.The median represents the center frequency of thetraveling peak, while the interquartile range (i.e.,the difference between the 75th and 25th percen-tiles) represents the bandwidth of the travelingpeak. (B) Spatial distribution of power at the me-dian frequency at different behavioral end points.Pre-LOC is the midpoint between EON and LOC.Unconscious refers to the midpoint between LOCand ROC. Post-LOC is the midpoint between ROCand EOFF.
Frequency (H
z)
LOC
0
10
20
30
ROCBaseline(10.25Hz)
0
10
20
30
20
Unconscious(10.25Hz)
Time rel. LOC (min) Time rel. ROC (min)−20 0 20 −20 0
Percentage total power at each frequency0 0.5
Projection weight0 0.5
Power within Principal ModePrincipal Mode BA
DC
Fig. 4. Spatially coherent alpha oscillations at LOCand ROC. (A) At baseline, spatially coherent alphaoscillations are concentrated in occipital channels,represented by the principal mode of the crossspectral matrix. (B) Activity within the principalmode, represented by the modal projection (theproportion of total power captured by the principalmode) dissipates at LOC (Left) and returns at ROC(Right). (C) In the unconscious state, spatially co-herent alpha oscillations are concentrated in frontalchannels. (D) Activity within this frontal alphamode, characterized by the modal projection,begins after LOC and ceases at ROC. Statistical sig-nificance for the modal projection was assessedusing a permutation procedure (Materials andMethods); areas shaded in gray were not significant(P > 0.05). These analyses reveal that there isa change in coherent alpha oscillations at LOC,when a spatially coherent occipital alpha modeshuts off and a spatially coherent frontal alphamode engages. These changes reverse at ROC.
E1146 | www.pnas.org/cgi/doi/10.1073/pnas.1221180110 Purdon et al.
Dow
nloa
ded
by g
uest
on
June
1, 2
020

traveling peak) track changes in level of consciousness; (iii) LOCis marked by an increase in low-frequency power, loss of coherentoccipital alpha oscillations, and the appearance of coherentfrontal alpha oscillations; (iv) ROC is marked by a decrease inlow-frequency power, loss of coherent frontal alpha oscillations,and reappearance of coherent occipital alpha oscillations; (v) thetrough-max pattern of phase–amplitude modulation marks thetransitions into and out unconsciousness, whereas the peak-maxpattern marks profound unconsciousness. These behavioral andEEG signatures are summarized in Fig. 6.
Neurophysiological Properties of Propofol’s EEG Signatures. Thefindings from our traveling peak and principal mode analyses (Fig.3 A and B) are consistent with results from our recent modelingstudies. Using network models of Hodgkin–Huxley neurons, wedemonstrated that gamma and beta power increased in corticalcircuits with low-dose propofol administration (38) and that as thedose was increased, gamma and beta activity coalesced into a co-herent alpha oscillation through synchronization of thalamo–cortical interactions (39). This coalescence agrees with the trav-eling peak and the spatially coherent alpha activity we observed atLOC (Fig. 4D). Our model analysis suggests that this coalescenceoccurs as the cortex and thalamus mutually entrain through theirreciprocal connections into tightly organized, spatially coherentoscillations in the alpha range (39).Our current findings also suggest that propofol-induced gamma,
beta, and coherent frontal alpha oscillations are likely not separatephysiological phenomena but rather different dynamic regimesof thalamo–cortical networks whose activity tracks the level ofarousal. Loss of gamma-band coherence has been reported to beassociated with LOC (22, 40, 41). We observed changes in alpha-band power (Fig. 2) and coherence (Fig. 4) linked to LOC and ROCbut did not see such effects in the gamma band.The temporal coincidence between the changes in low-fre-
quency (0.1–1 Hz) power and coherent alpha oscillations at LOCand ROC (Figs. 2 and 4) suggests that these phenomena mayhave a shared origin. There is a class of high-threshold thalamic
relay neurons that burst at alpha frequencies when depolarizedbut spike in a low-frequency burst pattern when hyperpolarized(42). Hyperpolarization of these neurons could explain the si-multaneous changes in occipital alpha and low-frequency powerat LOC and ROC. This hyperpolarization could occur viareduced excitatory input from cortex or brainstem, or fromincreased GABAergic inhibition from thalamic reticular nucleus.The peak-max pattern (Fig. 5 and Fig. S3) resembles the slow
oscillation which has been studied extensively in sleep (43), ket-amine/xylazine anesthesia (44, 45), and, more recently, in studiesof human single units during propofol-induced unconsciousness(46). In slow oscillations, surface-positive waves are associatedwith UP or ON states in which broad-band EEG, local field po-tential, and multiunit activity are all increased (44, 46–48). On theother hand, DOWN or OFF states are associated with periods ofneuronal silence (44, 46–48). The slow oscillation is thought toreflect a state of reduced cortico–cortical functional connectivity(46, 49, 50). The spatial distribution and lack of spatial coherencewe observed in the low-frequency oscillations are consistent withthis idea (Fig. 4 and Fig. S2). The trough-max pattern could be aninstantiation of the slow cortical potential, a category of low-frequency activity in which surface-negative deflections are as-sociated with high-frequency activity (51). Anesthesia-inducedphase–amplitude modulation has been studied previously (51–54). However, our results establish the existence of two distinctpatterns of low-frequency phase modulation of the alpha/betaoscillation amplitudes and show that each pattern is linked toa different state of unconsciousness. The mechanism for thetransition between the two patterns remains an open question.Anteriorization, the frontal shift in EEG power in multiple
bands, has also been associated with unconsciousness (20–24, 26,52). We find that anteriorization begins before LOC and involvespower increases in the alpha through gamma bands (travelingpeak, Fig. 3) and increases in alpha band coherence at LOC (Fig.4). During emergence, after ROC, anteriorization reverses, butfrontal gamma power persists even after behavioral responseshave returned (Fig. 3 and Fig. S2). These results suggest that
0
0.5
1LOC
0
5
1ROC
Low
-Fre
quen
cy P
hase
−20 −10 0 10 20 30 40
π
0
−20 −10 0 10 20 30 40
Relative α band amplitude (8−14 Hz)0.8 0.9 1 1.1 1.2
1 s/100 µV
Raw
Alpha Bandpass (8−14 Hz)
Low-Frequency Bandpass (0.1−1 Hz)
xaM-kaePxaM-hguorT
P(R
espo
nse)
A
B
DC
Trough-Max Trough-MaxPeak-Max
Group Level Probabilty of Response
Clicks
Verbal
Modulation of Alpha Amplitude by Low-Frequency Phase
Time Series Examples
Phase-Amplitude Modulation
Fig. 5. Two distinct patterns of phase–amplitudemodulation that develop asynchronously with LOCand ROC. (A) Group-level click (blue, Pclicks) andverbal (red, Pverbal) response-probability curves asshown in Fig. 1D. (B) The phase–amplitude histo-gram showing the relationship between the low-frequency (0.1–1 Hz) phase (y-axis, shown with ref-erence sinusoid) and mean-normalized alpha/beta(8–14Hz) oscillation amplitude (color map) asa function of time (x-axis) relative to LOC (Left) andROC (Right). The trough-max pattern, in which thealpha oscillation amplitude is maximal at the low-frequency troughs, occurs during transitions intoand out unconsciousness. The peak-max pattern, inwhich the alpha oscillation amplitude is maximal atthe low-frequency peaks, occurs during periods ofprofound unconsciousness. (C ) The trough-maxpattern observed in the time-domain EEG trace ofan individual subject. (D) The peak-max patternobserved in the time-domain EEG trace of an in-dividual subject. Modulograms and time-domaintraces are from a frontal channel (approximately Fz,nearest-neighbor Laplacian reference). The peak-max modulation identifies a profound state of un-consciousness, whereas the trough-max patternappears during transitions into and out of uncon-sciousness and therefore can be used to predict ROC.
Purdon et al. PNAS | Published online March 4, 2013 | E1147
MED
ICALSC
IENCE
SPN
ASPL
US
Dow
nloa
ded
by g
uest
on
June
1, 2
020

elevated frontal gamma/beta power could offer a quantitativemarker of sedation and/or a measure of persistent subclinicaleffects of propofol following emergence.
Two Putative Mechanisms of Propofol-Induced Unconsciousness.Unconsciousness coincides with spatially coherent frontal alphaoscillations, whereas loss of this coherent activity precedes ROC.Previous reports also have shown that responsiveness decreaseswith increased frontal alpha synchrony (26). We postulate, basedon our modeling studies, that spatially coherent alpha oscillationscontribute to propofol-induced unconsciousness by drasticallyrestricting communication within frontal thalamo–cortical circuitsto this narrow frequency band (39). Several studies have shownthat low-frequency oscillations are more prominent with in-creasing anesthetic dose and levels of unconsciousness (6, 8, 21,22, 25). In recent multiscale human intracranial studies of pro-pofol-induced unconsciousness, Lewis et al. (46) found thatneuronal spiking is limited to a brief phase window of the slowoscillation, and is silent otherwise. These propofol-induced slowoscillations occurred asynchronously across cortex, creating a stateof functional isolation between cortical areas (46). This obser-vation suggests that reduced functional intracortical con-nectivity is another possible mechanism for propofol-inducedunconsciousness. If, as we postulate, the peak-max modulation
pattern is a manifestation of this slow oscillation, the peak-maxpattern would be a marker of that decreased connectivity.The creation of highly structured oscillations, as occurs during
seizures, is associated with unconsciousness (55) and could be amechanism of anesthetic-induced unconsciousness. Taken to-gether, our modeling and experimental results identify restrictionof thalamo–cortical communication to the alpha range and slowoscillation-mediated reduction in intracortical communication asspecific oscillatory dynamics that may explain how propofolinduces unconsciousness. These highly structured oscillationscould provide a means to disrupt integrated information pro-cessing within the brain (56) as well as anterior–posterior corticalfeedback (41, 57, 58), both of which are considered crucial forconscious processing (56, 59).
Comparisons with Sleep and Coma. GA-induced unconsciousnessoften is compared with sleep (52, 60); our results lend furthersupport to our previous statements that there are similarities aswell as important differences in their EEG dynamics (1). Sleepspindles occur with a frequency range and spatial distributionthat are similar to the frontal alpha/beta rhythms described here(61), and spindles are generated by a similar thalamo–corticalcircuit (62). However, the time-domain morphology of theseoscillations is very different: Spindles have a transient envelope
EON ECOL OFFROC
P(Verbal Reponse)
P(Click Response)
Trough-MaxTrough-Max Peak-Max
Frontal Spectrogram
Behavioral Data
Frontal Alpha/Beta Coherence
Low-Frequency Power
Low-Frequency/Alpha-Beta Phase/Amplitude Relationship
Occipital Alpha Coherence
Low-Frequency Oscillation (<1Hz)
P(r
esp
on
se)
Fre
qu
en
cyC
oh
ere
nce
Po
we
r
1
0
1
0
1
0
low
high
-π
-π
Time
low-frequency
gamma
beta
alpha
Perceived “Spectral Edge”
Travelling
Peak
A
B
C
D
E
Fig. 6. Summary of behavioral and EEG signaturesduring induction of and emergence from propofol-induced unconsciousness. (A) Responses to auditorystimuli show continuous changes in probability ofresponse and a salience dependence during thetransition to unconsciousness and during ROC. (B)The frontal EEG spectrogram shows a travelingpeak that begins as broad-band beta-gammapower at the onset of behavioral effects anddecreases in frequency and bandwidth into the al-pha range toward LOC. (C) Spatially coherent pos-terior alpha oscillations disappear and spatiallycoherent frontal alpha oscillations appear at LOC.At ROC, spatially coherent posterior alpha oscil-lations reappear, and spatially coherent frontalalpha oscillations disappear. (D) Low frequency (<1Hz) power increases at LOC and decreases at ROC.(E) Two patterns of low-frequency phase modula-tion of alpha/beta amplitude. The trough-maxpattern appears at the transition into and out ofLOC. The peak-max pattern appears at profoundunconsciousness. These results establish EEG sig-natures that characterize unconsciousness, trackthe transitions into and out of unconsciousness,and provide a means to monitor and predict thebrain states of patients receiving propofol for GAor sedation.
E1148 | www.pnas.org/cgi/doi/10.1073/pnas.1221180110 Purdon et al.
Dow
nloa
ded
by g
uest
on
June
1, 2
020

with a refractory period of several seconds (62), whereas pro-pofol-induced alpha/beta oscillations appear more continuous innature. This difference could reflect propofol’s inhibitory effecton thalamic calcium-dependent hyperpolarization-activated cur-rents (Ih) (63), which are thought to mediate the sleep spindle’stransient shape and refractory period (64). Propofol-induced slowoscillations are associated with shorter periods of neuronal firingand longer periods of silence than sleep slow waves, suggestinga more profound degree of cortical impairment than seen withsleep (46). We speculate that, as a result, sleep slow waves mightshow less pronounced phase–amplitude modulation than thepropofol-induced slow oscillation (peak-max).EEG patterns similar to those described here during propofol-
induced unconsciousness, including frontal alpha waves, low-frequency oscillations, and burst-suppression, can be observed indifferent coma states (1, 65). However, less is known about thespatiotemporal dynamics and mechanisms of these EEG pat-terns in coma, and further study will be required to make de-tailed comparisons with GA. More generally, systematic analysescomparing GA, sleep, coma, and other altered states of con-sciousness may yield important insights into the mechanismsunderlying these phenomena.
Tracking Brain States of Patients Under GA. Anesthesiologists pro-vide care to thousands of patients daily, but only about half usedepth-of-anesthesia monitors (66). The EEG-derived indicesreported by these monitors relate only indirectly to LOC, ROC,and unconsciousness. Hence, even when patients are monitored,their brain states are not known precisely (4). The standardsfor monitoring vital physiological variables in anesthesiology—heart rate, blood pressure, oxygen saturation, and temperature(67, 68)—have been critical for reducing morbidity, mortality, andmalpractice premiums (69). Because there are no such standardsfor tracking brain states under GA (70), there is no principled wayat present to prevent intraoperative awareness (4), postoperativedelirium, or postoperative cognitive dysfunction.The EEG signatures we have identified for propofol can be
computed in real-time, are easy to recognize, and can be inter-preted in a way that relates directly to the mechanisms throughwhich this anesthetic is postulated to induce unconsciousness.The traveling peak and the trough-max pattern can be used totrack transitions into and out of unconsciousness (Fig. 3 A and B).Alpha coherence (Fig. 4) could be used as a marker of un-consciousness during surgeries such as carotid endarterectomiesin patients that have a full EEG montage. The trough-max pat-tern offers a predictor of ROC (Fig. 5A and B), whereas the peak-max pattern (Fig. 5 A and B) provides a signature of profoundunconsciousness. When the peak-max pattern is present, ourfindings suggest that it is improbable that a patient will haveawareness. Neither the trough-max nor the peak-max pattern canbe detected by spectral or entropy-based analyses (3), becausethese quantities do not contain phase information. The bispectralstatistic SyncFastSlow computed as part of the Bispectral Index(16) also is unable to detect these modulation patterns (36), mostlikely because the broad range of frequencies that are pooledtogether (0.5–47 Hz) effectively cancels out phase information(36, 71). However, because phase–amplitude modulation can berepresented as a form of quadratic phase coupling (72), it couldbe estimated using properly structured bispectral techniques.Studies of other anesthetics that combine experimental and
modeling paradigms likewise could relate drug-specific EEG sig-natures to the mechanisms of drug action and the associated be-havioral and brain states they produce. This deeper understandingof anesthetic neurophysiology will provide new insights into brainfunction and altered states of consciousness or arousal. It shouldalso translate into more reliable approaches to monitoring thebrain states of patients receiving GA and for tailoring drug dosingbased on specific, real-time knowledge of these states. Such in-formed approaches are critical steps for establishing neurophysi-ologically based standards for brain-state monitoring during GA.
Materials and MethodsSubject Selection and Clinical Procedures. We studied 10 normal healthy vol-unteers, 18–36 y of age. These studies were approved by the Human ResearchCommittee at the Massachusetts General Hospital. All subjects provided in-formed consent. All subjects were American Society of AnesthesiologyPhysical Status I with Mallampati Class I airway anatomy. In addition tostandard preanesthesia assessments, we tested all subjects for normal hear-ing and performed a urine toxicology screen to ensure that subjects had nottaken drugs that might interact adversely with propofol or confound the EEGor behavioral results. We administered a urine pregnancy test for each fe-male subject to ensure that none was pregnant.
Before the start of the study, we required subjects to take nothing bymouth for at least 8 h. During the study, subjects breathed 30% oxygen byvolume. We monitored each subject’s heart rate with an electrocardiogram,oxygen saturation through pulse oximetry, respiration and expired carbondioxide with capnography, and blood pressure through an arterial line. Thearterial line also was used for blood sampling. To ensure subject safety, atleast three anesthesiologists were present at each study: one was responsiblesolely for the medical management of the subject during the study, thesecond controlled the propofol administration, and the third performedblood sampling. When a subject became apneic, the first anesthesiologistassisted breathing with bag/mask ventilation. A phenylephrine infusion wasused to maintain mean arterial pressure above a patient-specific level de-termined from the subject’s baseline measurements.
Experimental Design and Procedures. For induction of unconsciousness, weused a computer-controlled infusion to achieve propofol target effect-siteconcentrations of 0, 1, 2, 3, 4, and 5 μg/mL (Fig. 1A) (30, 73). We maintainedeach target effect-site concentration level for 14 min. We denoted the pro-pofol concentration atwhich each subject stopped responding to button pressas “CLOR.” Emergence began at the end of the 5 μg/mL level. To provide agradual emergence,we reduced the propofol infusion rates in a stepwise fashionto achieve target effect-site concentrations of CLOR −0.5 μg mL, CLOR −1.0 μg/mL,and CLOR −1.5 μg/mL, and 0 μg/mL, for 14 min each. We performed bloodsampling for later propofol assays at the midpoint and end of each level.
Before each study, we acquired structural MRI for each subject (SiemensTrio 3 Tesla, T1-weighted magnetization-prepared rapid gradient echo, 1.3-mm slice thickness, 1.3 × 1 mm in-plane resolution, TR/TE = 2530/3.3 ms, 7°flip angle) and digitized scalp electrode positions (Polhemus FASTRACK 3D).During induction and emergence, we recorded EEGs using a 64-channelBrainVision MRI Plus system (Brain Products) with a sampling rate of 5,000Hz, resolution 0.5 μV least significant bit (LSB), bandwidth 0.016–1000 Hz.We also recorded galvanic skin response, plethysmography (PowerLab;ADInstruments), and video (BrainVision Video Module; Brain Products).
Subjects were instructed to close their eyes throughout the study to avoideye-blink artifacts in the EEG. Keeping the eyes closed also helped distin-guish between normal awake, eyes-closed occipital alpha oscillations (34)and the frontal alpha oscillations associated with unconsciousness causedby propofol.
Subjects were presented a series of auditory stimuli during the study andasked to respond to these stimuli by button presses to assess level of consciousbehavior. The stimuli, which consisted of either a verbal stimulus or an au-ditory click, were presented every 4 s in a repeating sequence of click-click-verbal-click-click, with a total of 210 stimuli per target effect-site concen-tration level. Verbal stimuli consisted either of the subject’s name or a word(LIBRARY, CABINET, VEHICLE, TABLE, BUILDING, LADDER, PACKAGE), ran-domized with an equal number of name or word stimuli at each level. Wordsand names were recorded by a male native English speaker (P.L.P.). The clicktrain was delivered binaurally, with 40-Hz clicks in the left ear and 84-Hzclicks in the right ear. Subjects were instructed to press one button if theyheard their name and to press the other button if they heard any otherstimulus. For click-train stimuli, subjects were instructed to wait until the endof the stimulus before responding so that auditory event-related potentialscould be recorded without response artifacts. Analysis of these event-relatedpotentials will be reported in a separate publication.
Click trains were constructed by modulating uniformly distributed whitenoise with a periodic ON/OFF trapezoid function (for 40-Hz clicks, 12.5-ms OFFperiod, 12.5-ms ON period, 2-ms rise time, 2-ms fall time; for 80 Hz clicks, 6-msOFF period, 6-ms ON period, 1-ms rise time, 2-ms fall time). All stimuli wererecorded at a sampling rate of 44.1 kHz. Stimuli were presented using Pre-sentation software (Neurobehavioral Systems, Inc.) with ear-insert head-phones (ER2; Etymotic Research) at ∼81 decibels peak sound pressure level.
Button-press stimuli were recorded using a custom-built computer mousewith straps fitted to hold the first and second fingers in place over the mousebuttons throughout the study. The mouse also was lightly strapped to the
Purdon et al. PNAS | Published online March 4, 2013 | E1149
MED
ICALSC
IENCE
SPN
ASPL
US
Dow
nloa
ded
by g
uest
on
June
1, 2
020

subject’s hand using tape and an arterial line board to ensure that responsescould be recorded accurately during emergence.
Behavioral Analysis.We estimated the probability of response to the click andverbal stimuli and the difference in probability of response by using BayesianMonte Carlo methods to fit a state-space model to these data (31, 74). Toperform group-level analyses, we aligned the behavioral data across subjectswith respect to each subject’s LOC time for induction and with respect toeach subject’s ROC time for emergence. We then pooled the responseswithin 20-s bins. The pooled data were used to estimate group-level prob-abilities of response using the state-space model.
EEG Preprocessing. We applied an anti-aliasing filter and down-sampled theEEG data to 500 or 250 Hz before analysis. An investigator experienced inreading EEGs (P.L.P.) visually inspected the data from each subject and ex-cluded channels with noise or artifacts. We coregistered the electrodepositions with MRI-based scalp-surface reconstructions obtained with Free-surfer (75) and remontaged EEG signals to a nearest-neighbor Laplacianreference, using distances along the scalp surface to weigh neighboringelectrode contributions.
Spectral Analysis. We computed spectrograms using the multitaper method,with window lengths of T = 2 s with 1.9 s overlap, time-bandwidth productTW = 2, number of tapers K = 3, and spectral resolution of 2 Hz (32, 76). Wecomputed group-level baseline-normalized spectrograms for induction andemergence by taking the median across subjects with the data aligned to theLOC and ROC time points, respectively. To determine if the group-level spec-trogram was significantly greater than baseline, we performed a sign test ateach time-frequency location, treating each subject as an independent sample.
To characterize the traveling peak, we first computed the group-levelbaseline- and total power-normalized spectra aligned at LOC (induction) andROC (emergence) time points. We then computed themedian, 25th, and 75thpercentiles between 2 and 40 Hz at each time point and applied a random-walk fixed-interval smoother to each resulting time series (77). We estimatedthe state space observation variance by computing the sample variance ofthe first 10 s of each time series and estimated the random-walk state var-iance by taking the square of the end-to-end rate of change for each timeseries [i.e., σ2state ¼ ððy1−yNÞ=NÞ2, where N is the number of samples in thetime series, and y1 and yN are the first and last samples in the time series,respectively]. We computed group-level scalp power distributions by takingthe median across subjects. Scalp EEG plots were performed using the top-oplot function in EEGLab (78).
Eigenvalue and Modal Projection Analyses. We performed an eigenvectordecomposition analysis of the cross-spectral matrix to identify the principalmodes of oscillation in the conscious and unconscious states and to analyzehow activity within these principal modes changed through time. We esti-mated the cross-spectral matrices Pbaseline(f) and Punconscious(f) at each fre-quency f using the multitaper method (parameters as above) using datafrom the full baseline period, and segments of at least 5 min extending fromLOC to ROC, respectively, for each subject. We divided each segment intononoverlapping 2-s windows, and we computed the median over all win-dows of the real and imaginary parts of each entry in the cross-spectral
matrix (33). We performed an eigenvalue decomposition on this mediancross-spectral matrix at each frequency. Each eigenvector describes a co-herent spatial distribution or mode of oscillation, and the correspondingeigenvalue quantifies the power in this mode. We refer to the first eigen-vector u1(f) at a given frequency f as the principal mode of oscillation forthat frequency.
We usedmodal projection analysis to characterize how powerwithin theseprincipal modes changed as a function of time (33). For each Slepian-tapered,Fourier-transformed vector in each channel, x(f, t), at frequency f and timewindow t (duration 20 s, nonoverlapping), we defined the modal projectionas the power within the principal mode, normalized by total power:
MPðf ; tÞ ¼ jxT ðf ; tÞu1ðfÞj2jxðf ; tÞj2 :
We used a permutation-based procedure to assess statistical significance forthe modal projection analysis. For each 20-s time window we applieda randomly selected circular time shift to the raw data from each channel. Theshifted data then were subjected to the eigenvector and modal projectionanalysis described above. To generate a null distribution, we repeated thisprocedure 200 times with a new random time shift for each channel. Toimprove resolution we resampled the 200 permutation controls 500 times,with replacement. We used this null distribution to find the 95% confidencelimit for significant modal projection for each subject at each time point andfrequency. We averaged the 95% confidence limit across subjects andcompared the average with the mean of the original global coherence. Timepoints and frequencies at which the mean modal projection was below themean of the 95% confidence interval were determined to be nonsignificant(shown in gray in Fig. 4 B and D).
Phase–Amplitude Modulation Analysis.We analyzed the relationship betweenlow-frequency phase (0.1–1 Hz) and alpha/beta (8–14 Hz) amplitude bycalculating a phase–amplitude histogram, or “modulogram” (36). We down-sampled the EEG data to 250 Hz, then applied bandpass filters to constructnarrow-band slow and alpha/beta signals (36). We then applied the Hilberttransform to each signal and computed the low-frequency oscillation phaseΨ(t) and alpha oscillation amplitude A(t). To construct the modulogram, weassigned each temporal sample to one of 18 equally spaced phase bins basedon the value of Ψ(t), averaging over 2-min epochs. The modulogram in eachphase bin is the average of A(t) for all samples within the bin, normalized bythe average of A(t) over the entire 2-min epoch. To assess statistical signif-icance for the modulogram, we performed a permutation test, described inref. 36.
ACKNOWLEDGMENTS. This work was supported by National Institutes ofHealth (NIH) Director’s Pioneer Award DP1-OD003646 and NIH Grant R01-MH071847 (to E.N.B.), by NIH New Innovator Award DP2-OD006454 andK-Award K25-NS057580 (to P.L.P.), and by R01-EB006385 (to E.N.B., P.L.P.,and K.F.K.W.) This work was also supported by the Massachusetts GeneralHospital Department of Anesthesia, Critical Care, and Pain Medicine, as wellas the Harvard Catalyst and The Harvard Clinical and Translational ScienceCenter (NIH Award UL1 RR 025758).
1. Brown EN, Lydic R, Schiff ND (2010) General anesthesia, sleep, and coma. N Engl J Med
363(27):2638–2650.2. Brown EN, Purdon PL, Van Dort CJ (2011) General anesthesia and altered states of
arousal: A systems neuroscience analysis. Annu Rev Neurosci 34:601–628.3. Palanca BJ, Mashour GA, Avidan MS (2009) Processed electroencephalogram in depth
of anesthesia monitoring. Curr Opin Anaesthesiol 22(5):553–559.4. Avidan MS, et al.; BAG-RECALL Research Group (2011) Prevention of intraoperative
awareness in a high-risk surgical population. N Engl J Med 365(7):591–600.5. Niedermeyer E, Lopes da Silva FH (2005) Electroencephalography: Basic Principles,
Clinical Applications, and Related Fields (Lippincott Williams & Wilkins, Philadelphia),
5th Ed, pp xiii, 1309.6. Gibbs FA, Gibbs EL, Lennox WG (1937) Effect on the electroencephalogram of certain
drugs which influence nervous activity. Arch Intern Med 60:154–169.7. Kiersey DK, Bickford RG, Faulconer A, Jr. (1951) Electro-encephalographic patterns
produced by thiopental sodium during surgical operations; description and
classification. Br J Anaesth 23(3):141–152.8. Faulconer A, Jr. (1952) Correlation of concentrations of ether in arterial blood with electro-
encephalographic patterns occurring during ether-oxygen and during nitrous oxide,
oxygen and ether anesthesia of human surgical patients. Anesthesiology 13(4):361–369.9. Clark DL, Rosner BS (1973) Neurophysiologic effects of general anesthetics. I. The
electroencephalogram and sensory evoked responses in man. Anesthesiology 38(6):564–582.
10. Glass PS, et al. (1997) Bispectral analysis measures sedation and memory effects ofpropofol, midazolam, isoflurane, and alfentanil in healthy volunteers. Anesthesiology86(4):836–847.
11. Doi M, Gajraj RJ, Mantzaridis H, Kenny GN (1997) Relationship between calculatedblood concentration of propofol and electrophysiological variables during emergencefrom anaesthesia: Comparison of bispectral index, spectral edge frequency, medianfrequency and auditory evoked potential index. Br J Anaesth 78(2):180–184.
12. Schneider G, Gelb AW, Schmeller B, Tschakert R, Kochs E (2003) Detection ofawareness in surgical patients with EEG-based indices—bispectral index and patientstate index. Br J Anaesth 91(3):329–335.
13. Li X, Cui S, Voss LJ (2008) Using permutation entropy to measure theelectroencephalographic effects of sevoflurane. Anesthesiology 109(3):448–456.
14. Schultz A, Siedenberg M, Grouven U, Kneif T, Schultz B (2008) Comparison ofNarcotrend Index, Bispectral Index, spectral and entropy parameters during inductionof propofol-remifentanil anaesthesia. J Clin Monit Comput 22(2):103–111.
15. Revuelta M, et al. (2008) Validation of the index of consciousness during sevofluraneand remifentanil anaesthesia: A comparison with the bispectral index and thecerebral state index. Br J Anaesth 101(5):653–658.
16. Rampil IJ (1998) A primer for EEG signal processing in anesthesia. Anesthesiology89(4):980–1002.
17. Vlajkovic GP, Sindjelic RP (2007) Emergence delirium in children: Many questions, fewanswers. Anesth Analg 104(1):84–91.
E1150 | www.pnas.org/cgi/doi/10.1073/pnas.1221180110 Purdon et al.
Dow
nloa
ded
by g
uest
on
June
1, 2
020
18. Reddy SV (2012) Effect of general anesthetics on the developing brain. J AnaesthesiolClin Pharmacol 28(1):6–10.
19. Krenk L, Rasmussen LS (2011) Postoperative delirium and postoperative cognitivedysfunction in the elderly - what are the differences? Minerva Anestesiol 77(7):742–749.
20. Tinker JH, Sharbrough FW, Michenfelder JD (1977) Anterior shift of the dominant EEGrhytham during anesthesia in the Java monkey: Correlation with anesthetic potency.Anesthesiology 46(4):252–259.
21. Gugino LD, et al. (2001) Quantitative EEG changes associated with loss and returnof consciousness in healthy adult volunteers anaesthetized with propofol orsevoflurane. Br J Anaesth 87(3):421–428.
22. John ER, et al. (2001) Invariant reversible QEEG effects of anesthetics. Conscious Cogn10(2):165–183.
23. Feshchenko VA, Veselis RA, Reinsel RA (2004) Propofol-induced alpha rhythm.Neuropsychobiology 50(3):257–266.
24. Cimenser A, et al. (2011) Tracking brain states under general anesthesia by usingglobal coherence analysis. Proc Natl Acad Sci USA 108(21):8832–8837.
25. Rampil IJ, Matteo RS (1987) Changes in EEG spectral edge frequency correlate withthe hemodynamic response to laryngoscopy and intubation. Anesthesiology 67(1):139–142.
26. Supp GG, Siegel M, Hipp JF, Engel AK (2011) Cortical hypersynchrony predictsbreakdown of sensory processing during loss of consciousness. Curr Biol 21(23):1988–1993.
27. Jäntti V, Yli-Hankala A, Baer GA, Porkkala T (1993) Slow potentials of EEG burstsuppression pattern during anaesthesia. Acta Anaesthesiol Scand 37(1):121–123.
28. Chernik DA, et al. (1990) Validity and reliability of the Observer’s Assessment ofAlertness/Sedation Scale: Study with intravenous midazolam. J Clin Psychopharmacol10(4):244–251.
29. Kearse LA, Jr., et al. (1998) Bispectral analysis of the electroencephalogram predictsconscious processing of information during propofol sedation and hypnosis.Anesthesiology 88(1):25–34.
30. Schnider TW, et al. (1999) The influence of age on propofol pharmacodynamics.Anesthesiology 90(6):1502–1516.
31. Smith AC, et al. (2004) Dynamic analysis of learning in behavioral experiments. JNeurosci 24(2):447–461.
32. Mitra P, Bokil H (2007) Observed Brain Dynamics (Oxford Univ Press, New York).33. Wong KF, et al. (2011) Robust time-varying multivariate coherence estimation:
Application to electroencephalogram recordings during general anesthesia. ConfProc IEEE Eng Med Biol Soc 2011:4725–4728.
34. Redlich FC, Callahan A, Mendelson RH (1946) Electroencephalographic changes aftereye opening and visual stimulation. Yale J Biol Med 18:367–376.
35. Tort AB, Komorowski R, Eichenbaum H, Kopell N (2010) Measuring phase-amplitudecoupling between neuronal oscillations of different frequencies. J Neurophysiol104(2):1195–1210.
36. Mukamel EA, Wong KF, Prerau MJ, Brown EN, Purdon PL (2011) Phase-basedmeasures of cross-frequency coupling in brain electrical dynamics under generalanesthesia. Conf Proc IEEE Eng Med Biol Soc 2011:1981–1984.
37. Kennedy D, Norman C (2005) What don’t we know? Science 309(5731):75.38. McCarthy MM, Brown EN, Kopell N (2008) Potential network mechanisms mediating
electroencephalographic beta rhythm changes during propofol-induced paradoxicalexcitation. J Neurosci 28(50):13488–13504.
39. Ching S, Cimenser A, Purdon PL, Brown EN, Kopell NJ (2010) Thalamocortical modelfor a propofol-induced alpha-rhythm associated with loss of consciousness. Proc NatlAcad Sci USA 107(52):22665–22670.
40. Mashour GA (2004) Consciousness unbound: Toward a paradigm of generalanesthesia. Anesthesiology 100(2):428–433.
41. Imas OA, Ropella KM, Ward BD, Wood JD, Hudetz AG (2005) Volatile anestheticsdisrupt frontal-posterior recurrent information transfer at gamma frequencies in rat.Neurosci Lett 387(3):145–150.
42. Hughes SW, Crunelli V (2005) Thalamic mechanisms of EEG alpha rhythms and theirpathological implications. Neuroscientist 11(4):357–372.
43. Crunelli V, Hughes SW (2010) The slow (<1 Hz) rhythm of non-REM sleep: A dialoguebetween three cardinal oscillators. Nat Neurosci 13(1):9–17.
44. Chauvette S, Crochet S, Volgushev M, Timofeev I (2011) Properties of slow oscillationduring slow-wave sleep and anesthesia in cats. J Neurosci 31(42):14998–15008.
45. Steriade M, Nuñez A, Amzica F (1993) A novel slow (< 1 Hz) oscillation of neocorticalneurons in vivo: Depolarizing and hyperpolarizing components. J Neurosci 13(8):3252–3265.
46. Lewis LD, et al. (2012) Rapid fragmentation of neuronal networks at the onset ofpropofol-induced unconsciousness. Proc Natl Acad Sci USA 109(49):E3377–E3386.
47. Csercsa R, et al. (2010) Laminar analysis of slow wave activity in humans. Brain 133(9):2814–2829.
48. Nir Y, et al. (2011) Regional slow waves and spindles in human sleep. Neuron 70(1):153–169.
49. Massimini M, et al. (2005) Breakdown of cortical effective connectivity during sleep.Science 309(5744):2228–2232.
50. Langheim FJ, Murphy M, Riedner BA, Tononi G (2011) Functional connectivity in slow-wave sleep: Identification of synchronous cortical activity during wakefulness andsleep using time series analysis of electroencephalographic data. J Sleep Res 20(4):496–505.
51. He BJ, Raichle ME (2009) The fMRI signal, slow cortical potential and consciousness.Trends Cogn Sci 13(7):302–309.
52. Murphy M, et al. (2011) Propofol anesthesia and sleep: A high-density EEG study.Sleep 34(3):283–91A.
53. Breshears JD, et al. (2010) Stable and dynamic cortical electrophysiology ofinduction and emergence with propofol anesthesia. Proc Natl Acad Sci USA 107(49):21170–21175.
54. Molaee-Ardekani B, Senhadji L, Shamsollahi MB, Wodey E, Vosoughi-Vahdat B (2007)Delta waves differently modulate high frequency components of EEG oscillations invarious unconsciousness levels. Conf Proc IEEE Eng Med Biol Soc 2007:1294–1297.
55. Blumenfeld H (2011) Epilepsy and the consciousness system: Transient vegetativestate? Neurol Clin 29(4):801–823.
56. Alkire MT, Hudetz AG, Tononi G (2008) Consciousness and anesthesia. Science322(5903):876–880.
57. Ku SW, Lee U, Noh GJ, Jun IG, Mashour GA (2011) Preferential inhibition of frontal-to-parietal feedback connectivity is a neurophysiologic correlate of general anesthesia insurgical patients. PLoS ONE 6(10):e25155.
58. Boly M, et al. (2012) Connectivity changes underlying spectral EEG changes duringpropofol-induced loss of consciousness. J Neurosci 32(20):7082–7090.
59. Dehaene S, Changeux JP (2011) Experimental and theoretical approaches to consciousprocessing. Neuron 70(2):200–227.
60. Franks NP, Zecharia AY (2011) Sleep and general anesthesia. Can J Anaesth 58(2):139–148.
61. Dehghani N, Cash SS, Halgren E (2011) Topographical frequency dynamics within EEGand MEG sleep spindles. Clin Neurophysiol 122(2):229–235.
62. Destexhe A, Contreras D, Steriade M (1998) Mechanisms underlying the synchronizingaction of corticothalamic feedback through inhibition of thalamic relay cells. JNeurophysiol 79(2):999–1016.
63. Ying SW, Abbas SY, Harrison NL, Goldstein PA (2006) Propofol block of I(h)contributes to the suppression of neuronal excitability and rhythmic burst firing inthalamocortical neurons. Eur J Neurosci 23(2):465–480.
64. Destexhe A, Bal T, McCormick DA, Sejnowski TJ (1996) Ionic mechanisms underlyingsynchronized oscillations and propagating waves in a model of ferret thalamic slices.J Neurophysiol 76(3):2049–2070.
65. Brenner RP (2005) The interpretation of the EEG in stupor and coma. Neurologist11(5):271–284.
66. Covidien (2011) BIS Eductation, Frequently Asked Questions: How often is BIS moni-toring being used? Available at www.biseducation.com/faq1.aspx?mi=132.
67. Cooper JB, Newbower RS, Kitz RJ (1984) An analysis of major errors and equipmentfailures in anesthesia management: Considerations for prevention and detection.Anesthesiology 60(1):34–42.
68. Eichhorn JH, et al. (1986) Standards for patient monitoring during anesthesia atHarvard Medical School. JAMA 256(8):1017–1020.
69. Gaba DM (2000) Anaesthesiology as a model for patient safety in health care. BMJ320(7237):785–788.
70. Anonymous; American Society of Anesthesiologists Task Force on IntraoperativeAwareness (2006) Practice advisory for intraoperative awareness and brain functionmonitoring: A report by the american society of anesthesiologists task force on in-traoperative awareness. Anesthesiology 104(4):847–864.
71. Miller A, Sleigh JW, Barnard J, Steyn-Ross DA (2004) Does bispectral analysis of theelectroencephalogram add anything but complexity? Br J Anaesth 92(1):8–13.
72. Nikias CL, Raghuveer MR (1987) Bispectrum estimation: A digital signal processingframework. Proc IEEE 75(7):869–891.
73. Shafer SL, Gregg KM (1992) Algorithms to rapidly achieve and maintain stable drugconcentrations at the site of drug effect with a computer-controlled infusion pump. JPharmacokinet Biopharm 20(2):147–169.
74. Wong KF, et al. (2011) Bayesian analysis of trinomial data in behavioral experimentsand its application to human studies of general anesthesia. Conf Proc IEEE Eng MedBiol Soc 2011:4705–4708.
75. Dale AM, Fischl B, Sereno MI (1999) Cortical surface-based analysis. I. Segmentationand surface reconstruction. Neuroimage 9(2):179–194.
76. Percival DB, Walden AT (1993) Spectral Analysis for Physical Applications (CambridgeUniv Press, New York).
77. Kitagawa G, Gersh W (1996) Smoothness Priors Analysis of Time Series (Springer, NewYork).
78. Delorme A, Makeig S (2004) EEGLAB: An open source toolbox for analysis of single-trial EEG dynamics including independent component analysis. J Neurosci Methods134(1):9–21.
Purdon et al. PNAS | Published online March 4, 2013 | E1151
MED
ICALSC
IENCE
SPN
ASPL
US
Dow
nloa
ded
by g
uest
on
June
1, 2
020