ELECTROCHEMICAL IMPEDANCE SPECTROSCOPY …web.phys.cmu.edu/~yfeng1/EIS papers/References/EIS... ·...
10
Ekcrrochimro Acta. Vol. 41. Nos. l/8. pp. 1073. 108.2, 1996 CoDYriRht C 1996 Elvvier Science Ltd. Pergamon 0013-4686(95)oo44o-8 Primi in &eac Britain. All rights reserved @X3-4686/96 Sl5.00 + 0.00 ELECTROCHEMICAL IMPEDANCE SPECTROSCOPY AS A TOOL FOR INVESTIGATING UNDERPAINT CORROSION P. L. BONORA,* F. DEFLORIAN, and L. FEDRIZZI University of Trento, Department of Materials Engineering, Via Mesiano 77, 38100 Trento, Italy (Received 8 May 1995) Abstract-Electrochemical Impedance Spectroscopy (EN) has been widely utilised in the last few years as a tool, together with surface analysis, to investigate the protecting properties of organic coatings for metals. The possible defects and limitations of coatings are detectable with the use of such experimental techniques. The metal coated system is generally fairly complex and consists of a metal substrate (mild steel, aluminium, zinc, magnesium, stainless steel, etc.), a surface pretreatment (chromatation, phos- phatation, or mechanical surface preparations, etc.) and some layers of paint with different chemical and physical properties (adhesion promoters, primers, intermediate layers and top coatings, etc.). All these parameters can influence the electrochemical behaviour measured by EIS, and therefore also the electrical models (equivalent electrical circuits) used to explain the impedance results. The aim of this work is to introduce the approach of electrochemical impedance data interpretation by equivalent electrical circuits on organic coated metals showing some examples relevant to different metal substrates or coating cycles. Key words: electrochemical impedance spectroscopy, organic coatings, corrosion, equivalent electrical circuit, delamination, defects, water uptake. INTRODUCI’ION Electrochemical impedance spectroscopy (EIS) is widely used with good results for the e :ctrochemical characterisation of protecting organic coating on metal@ l-41. The system, which consists of a metal covered by an organic film, is generally quite complex and it may consider a large number of different situations. Firstly the metal substrate may include different alloys: mild steel, aluminium, zinc (as metal coating on steel sheets) or magnesium, considering also new painted substrates such as stainless steel. These sub- strate surfaces can be pretreated in many different ways before painting: chemical conversion treatment for coil coating (chromatation, phosphatation, new “chromium free” pretreatment, etc.) or mechanical surface preparations such as sand blasting or brush- ing. Finally the protecting coating cycle often con- sists of some layers of paint which include adhesion promoters, primer surface tolerant, intermediate layers and top coatings. These different organic layers have different chemical and physical proper- ties due to the different chemical composition of the matrix and the presence of anticorrosive pigments. All these parameters (metal substrates, surface pretreatments, painting cycles) can influence the elec- trochemical behaviour measured by EIS, which is also a function of the environment and the general condition of measuring (temperature, oxygen con- centration, etc.). The final purpose of the EIS characterisation of protecting organic coatings is to obtain information about the system properties such as presence of * Author to whom correspondence should be addressed. defects, reactivity of the interface, adhesion, barrier properties to water, etc. Knowledge of these param- eters is very useful for predicting anti-corrosive behaviour in service of paints. It is evident that to obtain this result it is neces- sary to distinguish the impedance values as a func- tion of the frequency in the single contribution due to the components of the system, for example dis- tinguishing the part of the impedance due to the coating from that part due to the substrate. In other words, proposing some equivalent electrical circuits which can model the impedance results. It is possible to choose a limited number of electrical elements (capacitance, resistance, etc.) with an impedance equivalent to the impedance of the system studied for every frequency. From the complex situation previously described about organic coatings and metal, it clearly emerges that such models (or equivalent electrical circuits) will be different according to the different materials, and they will have to be chosen carefully. In order to use the correct equivalent circuit, all the information obtained about the system, including using non- electrochemical methods, can be very useful, also because it is important to remember that mathemati- cally there are a large number of different equivalent electrical circuits with the same impedance[S]. This part of the electrochemical impedance data interpretation is critical because an incorrect model of the system studied causes a loss of information which could be obtained from the EIS results[6]. The second step, which is also very important, is the effort to pass from the values of the equivalent electrical circuit (resistance, capacitance, etc.) to physical properties characterising the system, which are the final aim of the EIS characterisation of 1073
Transcript of ELECTROCHEMICAL IMPEDANCE SPECTROSCOPY …web.phys.cmu.edu/~yfeng1/EIS papers/References/EIS... ·...

Ekcrrochimro Acta. Vol. 41. Nos. l/8. pp. 1073. 108.2, 1996 CoDYriRht C 1996 Elvvier Science Ltd.
Pergamon
0013-4686(95)oo44o-8
Primi in &eac Britain. All rights reserved @X3-4686/96 Sl5.00 + 0.00
ELECTROCHEMICAL IMPEDANCE SPECTROSCOPY AS A TOOL FOR INVESTIGATING UNDERPAINT CORROSION
P. L. BONORA,* F. DEFLORIAN, and L. FEDRIZZI
University of Trento, Department of Materials Engineering, Via Mesiano 77, 38100 Trento, Italy
(Received 8 May 1995)
Abstract-Electrochemical Impedance Spectroscopy (EN) has been widely utilised in the last few years as a tool, together with surface analysis, to investigate the protecting properties of organic coatings for metals. The possible defects and limitations of coatings are detectable with the use of such experimental techniques. The metal coated system is generally fairly complex and consists of a metal substrate (mild steel, aluminium, zinc, magnesium, stainless steel, etc.), a surface pretreatment (chromatation, phos- phatation, or mechanical surface preparations, etc.) and some layers of paint with different chemical and physical properties (adhesion promoters, primers, intermediate layers and top coatings, etc.). All these parameters can influence the electrochemical behaviour measured by EIS, and therefore also the electrical models (equivalent electrical circuits) used to explain the impedance results. The aim of this work is to introduce the approach of electrochemical impedance data interpretation by equivalent electrical circuits on organic coated metals showing some examples relevant to different metal substrates or coating cycles.
Key words: electrochemical impedance spectroscopy, organic coatings, corrosion, equivalent electrical circuit, delamination, defects, water uptake.
INTRODUCI’ION
Electrochemical impedance spectroscopy (EIS) is widely used with good results for the e :ctrochemical characterisation of protecting organic coating on metal@ l-41.
The system, which consists of a metal covered by an organic film, is generally quite complex and it may consider a large number of different situations. Firstly the metal substrate may include different alloys: mild steel, aluminium, zinc (as metal coating on steel sheets) or magnesium, considering also new painted substrates such as stainless steel. These sub- strate surfaces can be pretreated in many different ways before painting: chemical conversion treatment for coil coating (chromatation, phosphatation, new “chromium free” pretreatment, etc.) or mechanical surface preparations such as sand blasting or brush- ing. Finally the protecting coating cycle often con- sists of some layers of paint which include adhesion promoters, primer surface tolerant, intermediate layers and top coatings. These different organic layers have different chemical and physical proper- ties due to the different chemical composition of the matrix and the presence of anticorrosive pigments.
All these parameters (metal substrates, surface pretreatments, painting cycles) can influence the elec- trochemical behaviour measured by EIS, which is also a function of the environment and the general condition of measuring (temperature, oxygen con- centration, etc.).
The final purpose of the EIS characterisation of protecting organic coatings is to obtain information about the system properties such as presence of
* Author to whom correspondence should be addressed.
defects, reactivity of the interface, adhesion, barrier properties to water, etc. Knowledge of these param- eters is very useful for predicting anti-corrosive behaviour in service of paints.
It is evident that to obtain this result it is neces- sary to distinguish the impedance values as a func- tion of the frequency in the single contribution due to the components of the system, for example dis- tinguishing the part of the impedance due to the coating from that part due to the substrate. In other words, proposing some equivalent electrical circuits which can model the impedance results. It is possible to choose a limited number of electrical elements (capacitance, resistance, etc.) with an impedance equivalent to the impedance of the system studied for every frequency.
From the complex situation previously described about organic coatings and metal, it clearly emerges that such models (or equivalent electrical circuits) will be different according to the different materials, and they will have to be chosen carefully. In order to use the correct equivalent circuit, all the information obtained about the system, including using non- electrochemical methods, can be very useful, also because it is important to remember that mathemati- cally there are a large number of different equivalent electrical circuits with the same impedance[S].
This part of the electrochemical impedance data interpretation is critical because an incorrect model of the system studied causes a loss of information which could be obtained from the EIS results[6].
The second step, which is also very important, is the effort to pass from the values of the equivalent electrical circuit (resistance, capacitance, etc.) to physical properties characterising the system, which are the final aim of the EIS characterisation of
1073

1074 P. L. BONORA et al.
organic coatings. However, not all the elements of the equivalent electrical circuit have the same impor- tance for this aim, and particular care must be used to choose the parameter to discuss.
In order to obtain this kind of information, it is necessary to understand how the physical properties, for example adhesion or water barrier properties, can influence the electrical parameters measured by EIS.
The aim of this work is to introduce the approach of electrochemical impedance data interpretation by equivalent electrical circuits on organic coated metals by showing some examples relevant to differ- ent metal substrates, pretreatments or coating cycles.
Equivalent electrical circuit
The models (equivalent electrical circuits) devel- oped to explain the electrochemical impedance results use a combination of resistance, capacitance or other elements as constant phase elements (cpe) or Warburg elements[6, 73. This model must respect two conditions:
(4
@I
all the elements of the proposed circuit must have a clear physical meaning. They have to be associated with physical properties of the system that can generate this kind of electrical response. In order to obtain this result the change with time of the parameters composing the circuit have to be. continuous and not random; the equivalent electrical circuit must generate spectra which, with suitable values of the ele- ments, are different from the experimental results for a small enough defined quantity only (the error is acceptable if it is not only small but also not periodical or regular as a function of the frequency). The equivalent electrical circuit has to be as simple as possible; in other words, if by eliminating an element the previously described condition is still valid, then the circuit must be simplified.
The effectiveness of the models obtained by equiv- alent electrical circuits is dependent on respecting these two conditions. If condition B is not satisfied, then the model is not consistent with the experimen- tal results, and therefore it is wrong. If condition A is not satisfied, the model is not linked to a real physi- cal meaning, therefore it is not useful.
One of the first works on the EIS characterisation of organic coatings was published by Mansfeld et a/.[81 and it also suggested a general model of an equivalent electrical circuit from which a large number of other models can be derived (Fig. 1). This circuit is composed of the electrolyte resistance, fol- lowed by a capacitance (coating capacitance C,) in parallel with a resistance (the coating or pore resist- ance RJ and finally an element Z which represents the electrochemical process at the metal interface. It is the definition of Z which mainly distinguishes the circuits proposed in the literature. However, the model in Fig. 1 contains an important assumption: the ion flow and the corrosion process are localised under the coating and they are not homogeneous on the surface. This is because the corrosion process is presumed to be at the base of the defects in the coating, and not involving all the testing area (in this
RO I Fig. 1. General equivalent electrical circuit for organic
coated metals.
case the faradic reaction would be in series with the coating capacitance).
The works of Mansfeld et aI.[8, 93 proposed two different circuits modelling the corrosion reaction. One is composed of a capacitance (the double layer capacitance Cd,) in parallel with a resistance (the charge transfer resistance R,,) which describes the electrochemical reaction under activation control. This model of the interface is very popular and it is applied in many papers[lO-141, because it is quite simple and suitable for many different systems, including those where there are macro-defects in the coating[15, 161. The second circuit proposed by Mansfeld et aI.[8, 93 for the metal coating interface consider a Warburg (W) element. In this case the dif- fusion process is suggested as being the controlling step and, with regard to impedance, the electrical behaviour of the interface is dominated by the Warburg element. For other authors the Warburg element does not substitute the double layer capac- itance and the charge transfer resistance, but is added in series with the charge transfer resistanceC171.
A complete approach to the use of equivalent elec- trical circuits was proposed more recently by Geenen et aI.[18, 193, by using extensively fitting software (in particular the Equivcrts software developed by Boukamp[ZO]) and suggesting examples of more complex equivalent electrical circuits with many elements[21].
EXPERIMENTAL
The following examples of EIS characterisation were performed on different materials. The samples were mild steel, galvanised steel, stainless steel and aluminium sheets with different organic coatings: fluoropolymer, epoxy or polyester coatings. The thicknesses of the coatings range from about 30 to 1OOpm.
The electrochemical impedance measurements were performed in the 10 kHz-1 mHz frequency range using a Solartron 1255 Frequency Response Analyser connected to a 273 PARC potentiostat.
The amplitude of the sinusoidal voltage signal was 10mV. The electrochemical tests were carried out in a quiescent aerated sodium sulphate (0.3% or 0.1 M at pH 2) or a 3.5% sodium chloride aqueous solu- tion. The exposed painted sheet area was about 30 cm*.
The three-electrode electrochemical cell was obtained by sticking a plastic cylinder on the sample
Investigating underpaint corrosion 1075
sheet and filling it with the test solution. A saturated value of admittance (Q) and the exponent of the sulphate electrode (sse; + 640mV vs. she) as refer- angular frequency o (n). The last parameter can be ence and a platinum counter electrode were discussed in terms of diffusion phenomena, surface employed. morphology and dissipative processes[5,23].
All the impedance measurements were carried out in a Faraday cage in order to minimise external interference on the system studied; in addition, the absence of distorting artefacts due to the equipment was shown by the use of different kinds of reference electrodes.
The experimental impedance spectra were inter- preted on the basis of equivalent electrical circuits using a fitting software (Equivcrt) elaborated by Boukamp[20].
RESULTS AND DISCUSSION
Effect of the substrate
In the case of Fig. 2(a), the simple nature of the coating (only a layer of polymer without another dis- persed phase) enables the coating to be modelled as an ideal capacitance C, in parallel with the ionic resistance R, through the coating. In the same way the presence of a metal surface without chemical pretreatments together with the iron electrochemical dissolution reaction which involves a single time constant, enables the metal-polymer interface to be considered as a resistance (the charge transfer resist- ance R,,) in parallel with the double layer capac- itance C,, (the double layer capacitance on quite a rough surface). In this example the suggested model is simple but it is in good agreement with the experi- mental result.
The first example of coated metals is the simple system consisting of sand blasted mild steel covered with a layer (30pm) of fluoropolymer coating, without pigments. The Nyquist diagram of samples with these characteristics immersed in 0.3% sodium sulphate for 30 days is shown in Fig. 2(a). It is pos- sible to see two different time constants and accord- ing to many other works[lO-141, the equivalent electrical circuit in Fig. 2(b) can be used, which is composed of the coating capacitance C, , the coating resistance R,, the double layer capacitance C,, and the charge transfer resistance R,,[22]. All the capac- itances shown in the equivalent electrical circuits are mathematically modelled using a constant phase element (cpe) in order to consider also the electro- chemical behaviour of systems which do not corre- spond exactly to a pure capacitance; in this way we have two parameters describing the element: the
In addition the presence of macro-defects caused artificially or due to sample deformations does not modify the equivalent electrical circuit, while, of course, it changes the values of the parameters com- posing the circuit[24,25].
Another example is the case of a steel substrate covered with a zinc metal coating and finally an epoxy coating[26]. A typical impedance spectrum, obtained after 10 days of immersion in 3.5% sodium chloride solution shows the presence of two time constants that become more and more distinct as the immersion time increases, which corresponds well with the model shown in Fig. 2. Moreover, after about 100 days of immersion we can observe the appearance of a diffusion tail at the lowest fre- quencies.
At the lowest frequencies only one time constant is easily distinguishable instead of the three different
(b)
(4 I JOE+09
r
2 l
g l.OOE+O9 - l
E C 0
l
I JOE+09 1 .OOE+O9 2.OOE+O9 3.OOE+O!J Z’ (ohm cm2)
Fig. 2. (a) Impedance measurements in Nyquist form of a fluoropolymer coated steel (30pm) after 30 days of immersion in sodium sulphate solution. (b) Equivalent electrical circuit for fluoropolymer coated
steel.

1076 P. L. fklNORA et al.
(a)
0
0 CC
0
0 -T cdl
II 0 Cdiff
W 0
0 0
I I I I 0.25 0.50 0.75 1.00
2’/107 (ohmscm*)
Fig. 3. (a) Impedance measurements in Nyquist form of an epoxy coated galvanised steel with macro- defect in sodium chloride solution. (b) Equivalent electrical circuit for epoxy coated galvanised steel.
ones observed for the bare samplesC26, 271. In fact, the impedance measurements performed on bare zinc electroplated and phosphatised steel in the same solution show three time constants, the first relating to the porosity in the phosphate layer and the other two to complex reactions on the zinc substrate. We can assume that the faradic processes are not exactly the same for the bare sample under the organic coating. Moreover, the presence of an intact coating can hide the phosphatised layer contribution to the impedance and can slow down the substrate degra- dation process so that the diffusion contributions are not detectable at the usual measuring frequencies until after a very long immersion time (about 100 days).
Considering the same coating with an artificial defect of about 0.1 mm2 it is possible to see more than two loops related to different time constants (Fig. 3(a)). Such an experimental result is clearly related to the complexity of the metal substrate. However, it is quite difficult to correlate the electrical parameters defined in the impedance plots obtained from coated samples with those obtained from bare samples. The experimental fitting obtained quite a good result by the use of the equivalent electrical circuit shown in Fig. 3(b), which proposes the intro- duction of three different time constants. The first time constant is undoubtedly representative of the organic coating and it is described by the coating capacitance C, and the coating resistance R,, which is representative of the electrolyte reaching the metal substrate through the artificial defect.
The interpretation of the second and third time constants in Fig. 3(b) is not easy. In fact the values of the capacitance related to the second loop do not agree with the capacitance of the phosphatised layer as measured on the bare sample (2 x lo-‘F/cm’). This value, measured on the very small area of the defect, is too close to the coating capacitance to be distinguished from it. Moreover the phosphatised layer can be damaged seriously when the artificial defect is produced. Consequently, the second and third capacitative loops should be associated with the complex reactions on the zinc substrate.
In particular, the second loop is determined by the charge transfer resistance (R,,) and by the double layer capacitance Cdl (better represented by C.P.E.) and the third can be probably correlated to diffusion processes caused by the presence of corrosion pro- ducts (R,,,, and Cdi!r).
A third different example of metal substrate con- siders aluminium. The impedance diagrams of poly- ester coated (20pm) chromatised aluminium, during the first days of immersion, show a capacitative behaviour[28]. However, by the use of a fitting pro- cedure, it is possible to highlight the presence of a resistive component which in general had already appeared in the first days of immersion. The pres- ence of the resistance is thus clearly visible after about ten days. The value of such a resistive com- ponent is very high, in the range of lO’“Qcm’, and shows a very slow decrease with time, up to 120 days of immersion in the testing solution (0.1 M Na,SO, at pH = 2 by adding H,SO,) (Fig. 4). The presence of the resistive component together with the possi- bility of measuring a sufficiently stable electrode potential indicates that the organic coating allows the electrolyte to penetrate at the metal substrate, through the microporosity or through the micro- defects of the coating itself129J Nevertheless, as shown by the resistance trend, these small defects do not grow significantly with time, probably as a con-
2’ (ohm cm*)
Fig. 4. Impedance measurements in Nyquist form for poly- ester coated aluminium after 76, 100 and 113 days of
immersion in sodium sulphate solution.

Investigating underpaint corrosion 1077
sequence of a very good coating substrate adhesion improved by the pretreatment which further acts as an inhibitor due to the chromate presence.
The impedance results obtained from samples with macro-defects can be modelled with an equivalent electrical circuit as shown in Fig. 5[30], which, in addition to the coating capacitance and resistance, considers the double layer capacitance and the Z, element which contains the charge transfer resistance R,, and also the electrical elements describing the low frequency behaviour due to the complex alu- minium dissolution reaction. When the protective properties of the organic coating are good, the Z, detectable contribution is only R,, .
If the coating is protective (without macro-defects) it is impossible to distinguish these two resistive components probably because the time constant of the coating and that of the faradaic impedance are too similar. However, as a first approximation we can use as parameter evaluating the degree of pro- tection exerted by the different organic coatings the total resistance R,,, which is the sum of the resistance of the electrolyte in the pores of the coating R, and the charge transfer resistance relevant to the electro- chemical process at the metal areas in contact with the electrolyte R,,[28]. In Fig. 6 we show the treof the value R,,, (the only resistive component that can be identified in the impedance diagram).
An increasing need for very high resistance to cos- metic corrosion, for a more extended service life and for reduced maintenance costs for infrastructures, opens up new fields of application for coil coated
Fig. 5. Equivalent electrical circuit for polyester coated aluminium.
The coating thickness can complicate the interpre- tation of the impedance diagram, hiding the electro- chemical behaviour at the interface because of the high coating impedance, and creating many difIi- culties in finding the best equivalent electrical circuit. However, when the coating thickness enables the electrical properties of the coating to be measured correctly as in Fig. 2(a), the equivalent electrical circuit for unpigmented coating is the model shown in Fig. 2(b)[22, 331.
Fig. 6. Trend of the value R,,, vs. time of immersion for The case of coating with anti-corrosive pigments is polyester coated aluminium. different. A typical impedance diagram in Bode form,
stainless steel[31]. In the case of the inox substrate, the model in Fig. 3 seems without doubt to be unsuitable for modelling the interface because of the presence of an oxide layer with specific electrical properties (not always detectable with impedance measurements) and because of the very low reactivity of this class of metals, which can cause a very high charge transfer resistance value due to metal disso- lution. Moreover, after the beginning of the corro- sion process, the mechanisms will be related to a localised corrosion which is typical for a passive surface.
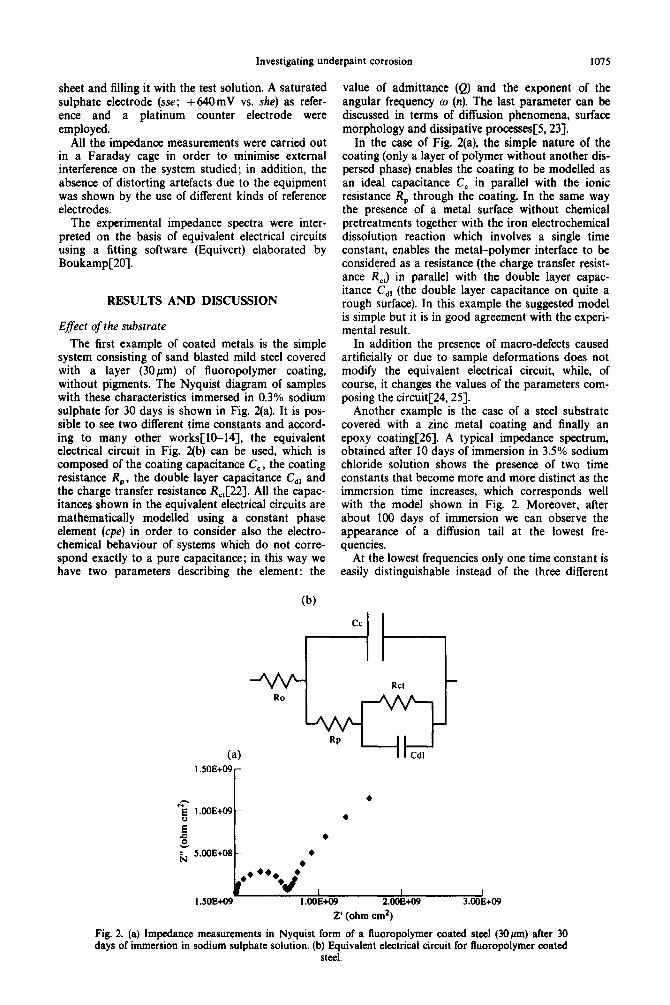
An impedance result obtained for epoxy coated AISI 430 stainless steel with macro-defects after 3 days of immersion in 3.5% sodium chloride solution is shown in Bode form in Fig. 7(a). The equivalent electrical circuit which can explain the EIS data is shown in Fig. 7(b). In addition to the elements also existing in the circuit of Fig. 2(b) (but with higher values of charge transfer resistance) we note the pres- ence of a time constant which can be related to the electrical properties of the passive oxide layer on the metal surface (R,, and C,,)[32]. The R,, and C,, values (normalized respect to the defective area) are in agreement with the data obtained on samples without coating. In this example we are able to measure the electrical behaviour of the coating, the corrosion reaction at the interface and also the elec- trical behaviour (oxide capacitance and oxide resistance) of the passive layer.
Eflect of the coating A first important effect of the coating on the
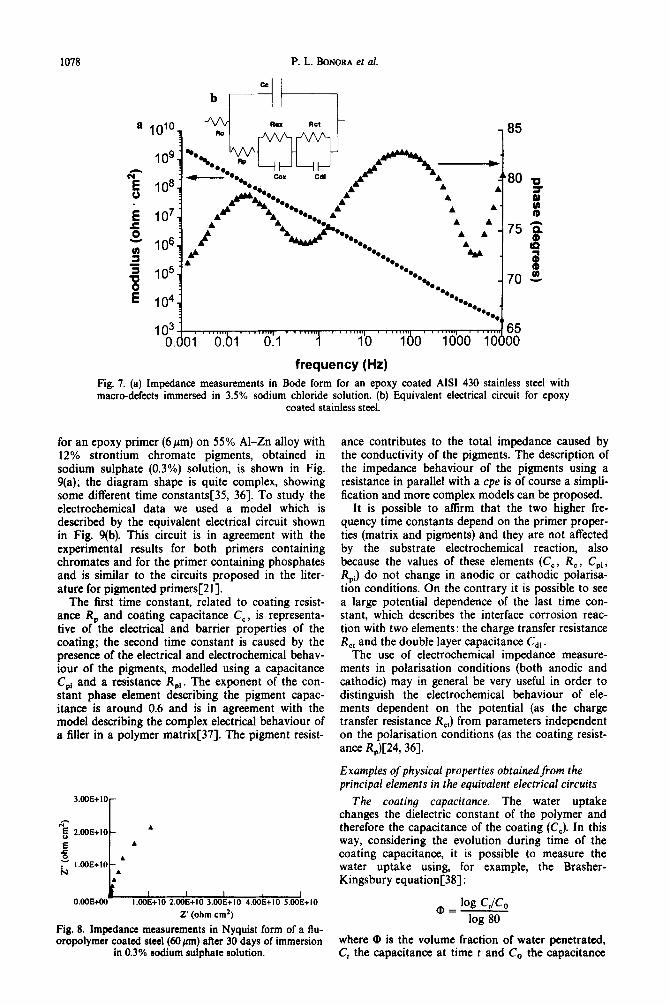
impedance result is a consequence of the coating thickness. The total impedance (and in particular the pore resistance) increases remarkably, increasing the coating thickness and in many cases reaching values near to the limits of the equipment used. It is there- fore very difficult in such a case to distinguish, in the typical frequency range of measurement, the different time constants, one of which is related to the coating properties and one of which is related to the corro- sion process[33, 341. It is possible to have an imped- ance plot as shown in Fig. 8 (a high barrier fluoropolymer coated mild steel immersed for 30 days in 0.3% sodium sulphate solution), compared to plot Fig. 2(a) regarding the same system but with lower thickness (30 instead of 60pm). In many cases it is also impossible to measure the impedance at the lowest frequency because reducing the frequency increases the impedance, but with the equipment described in the experimental part we cannot measure impedance higher than 109/1010 R.
1078 P. L. E&IN~RA et al.
frequency (Hz)
Fig. 7. (a) Impedance measurements in Bode form for an epoxy coated AISI 430 stainless steel with macro-defects immersed in 3.5% sodium chloride solution. (b) Equivalent electrical circuit for epoxy
coated stainless steel.
for an epoxy primer (6pm) on 55% Al-Zn alloy with 12% strontium chromate pigments, obtained in sodium sulphate (0.3%) solution, is shown in Fig. 9(a); the diagram shape is quite complex, showing some different time constantsC35, 36-J. To study the electrochemical data we used a mode1 which is described by the equivalent electrical circuit shown in Fig. 9(b). This circuit is in agreement with the experimental results for both primers containing chromates and for the primer containing phosphates and is similar to the circuits proposed in the liter- ature for pigmented primers[21].
The first time constant, related to coating resist- ance R, and coating capacitance C,, is representa- tive of the electrical and barrier properties of the coating; the second time constant is caused by the presence of the electrical and electrochemical behav- iour of the pigments, modelled using a capacitance C,$ and a resistance R,i. The exponent of the con- stant phase element describing the pigment capac- itance is around 0.6 and is in agreement with the model describing the complex electrical behaviour of a filler in a polymer matrix[37]. The pigment resist-
3.M)E+IO
r
67 & 2.00E+IO ’ E . c s . k
I.OOE+IO .
O.OOl3OO I.OOE+IO 2.@JE+IO 3.OOE+IO 4.OOE+IO 5.OOE+IO
z’ (ohm cd)
Fig. 8. Impedance measurements in Nyquist form of a flu- oropolymer coated steel (6Opm) aRer 30 days of immersion
in 0.3% sodium sulphate solution.
ante contributes to the total impedance caused by the conductivity of the pigments. The description of the impedance behaviour of the pigments using a resistance in parallel with a cpe is of course a simpli- fication and more complex models can be proposed.
It is possible to affirm that the two higher fre- quency time constants depend on the primer proper- ties (matrix and pigments) and they are not affected by the substrate electrochemical reaction, also because the values of these elements (C,, R,, CPi, RPi) do not change in anodic or cathodic polarisa- tion conditions. On the contrary it is possible to see a large potential dependence of the last time con- stant, which describes the interface corrosion reac- tion with two elements: the charge transfer resistance R,, and the double layer capacitance Cdl.
The use of electrochemical impedance measure- ments in polarisation conditions (both anodic and cathodic) may in general be very useful in order to distinguish the electrochemical behaviour of ele- ments dependent on the potential (as the charge transfer resistance R,,) from parameters independent on the polarisation conditions (as the coating resist- ance R,)[24, 361.
Examples of physical properties obtained from the principal elements in the equivalent electrical circuits
The coating capacitance. The water uptake changes the dielectric constant of the polymer and therefore the capacitance of the coating (C,). In this way, considering the evolution during time of the coating capacitance, it is possible to measure the water uptake using, for example, the Brasher- Kingsbury equation[38] :
@ = log CtIG log 80
where 0 is the volume fraction of water penetrated, C, the capacitance at time t and Co the capacitance

Investigating underpaint corrosion 1079
a
102 I.“, . . . . . . . 1 . . . . . . . . . . . . . . . . . . 0 ,,.>,,, 1 ,-mmj 10
1 o-3 1 o-2 lOi 100 10' 102 103 IO4 105
Frequency (Hz) Fig. 9. (a) Impedance measurements in Bode form for an epoxy primer with strontium chromate pig- ments on 55% Al-Zn immersed in sodium sulphate solution. (b) Equivalent electrical circuit for epoxy
primer on 55% Al-Zn.
at time t = 0; the value 80 is the dielectric constant of water at 25°C.
This formula is based on the following conditions:
(a) water is homogeneously dispersed; (b) no water-polymer chemical interaction; (c) penetration of a low volume of and no swelling of
the matrix[19].
of adhesion, whilst remaining a presupposition for the electrochemical reaction and for the reduction of the resistance to the passage of ions through the coating itselfl40, 411. After coating saturation the water uptake process can continue by water accumu- lation at the metal-polymer interface (delamination).
The typical evolution of @ vs. time shows an increase after immersion, reaching a constant value after some hours. This final value a, (saturation value), is important in order to evaluate the barrier properties of the coating.
The diffusion coefficient can be obtained by solving Fick’s second law:
6C -= _D$. 6t
Many other mathematical methods are available in the literature for determining the diffusion processC39-J.
For example Fig. 10 shows an increase in the coating capacitance trend, due to the water uptake, for a polyester coated galvanised steel immersed in 3.5% sodium chloride solution, before and after about 100 h of uu irradiation, following the ASTM G53-88 standard. The difference in the capacitance increment is due to the degradation effects of uu irra- diation on the polymeric structure of the coating matrix. The irradiated sample absorbed more water than the other one and from the data in Fig. 10 it is possible to calculate the water uptake saturation value which is about 4% for the samples not irradi- ated and 11% for the samples irradiated for 100 h.
The evolution of the water absorption process in an organic coating immersed in a solution is a very important phenomenon because normally it is a prelude to phenomena of paint-metal interface loss
The pore resistance. A way of determining the area of the defects through the coatings is to evaluate the pores resistance (R,), with the assumption of cylin- drical pores[24,42].
It is known that R, = pod/A,, hence knowing d and p. it is possible to determine the A,, value. The main problem in the determining of A,, following
_ 0.12r
. n . . .
I
oOh n IOOh
Times (minutes)
Fig. 10. Water uptake trend for a polyester coated galvanized steel immersed in sodium chloride solu- tion, before and after about 100 h of uu irradiation.

1080 P. L. Boi9oRa et al.
both the mentioned methods, is the evaluation of p,, . However, even in the case in which it is impossible to know its exact value, it is always possible to compare the R, values for different coatings and to consider the trends with time of R, in inverse pro- portion to the defect area evolution.
Figure 11 shows for example the different R, evol- ution for a fluoropolymer coating before and after mechanical deformation (the strain is 7%). In this case the increase in the defects area after mechanical deformation is evident[25].
The charge transfer resistance. The electrochemical behaviour and the corrosion processes at the metal surface are described in the impedance results mainly by the parameter R,, In particular the charge trans- fer resistance is inversely proportional to the corro- sion rate and to the surface area under corrosion[43].
Comparing the R,, values of different primers (epoxy primer containing chromate or phosphate pigments) on 55% Al-Zn we note a first difference. The samples covered with the primer containing phosphates show higher dispersion in impedance data than the primer containing chromates. This behaviour is due to the different protecting mechan-
isms of the primers[44]. The primer containing phosphates acts mainly as a barrier and the pig- ments (both titanium dioxide and strontium phosphate) prevent the corrosion, reducing the water and ion penetration. On the other hand, the primer containing chromates acts in the presence of chro- mates by increasing the passivation tendency of the substrate, and therefore a pigment dissolution is an important condition[35,36].
The presence of random defects in the primer can remarkably reduce the protection properties of the primer containing phosphates, because in such a case it cannot act as an effective barrier and hence the defects can cause quite high dispersion of the imped- ance data. On the other hand, the materials contain- ing chromates can protect the substrate even in presence of defects, because the dissolving chromates can reduce the corrosion rate by metal passivation. The coatings containing chromates are much less sensitive to the presence of random defects (scratch, pores, etc.).
However, considering the best results for both kind of primers, we can see similar R,, values after a few days of immersion, as shown in Fig. 12. These results are very interesting because they show that
I .OOE+09 CL
-6 l.OOE+08 A-r-r-‘_. -
E r \ z l.OOE+07 -
2 A Sample deformed 7% ‘\.-A\._.
tB0E+06 - o Sample undeformed
1 .OOE+O5 I I I 1 I I I 0 100 200 300 400 500 600 700
Time (hours)
Fig. 11. Coating resistance (R,) evolution vs. time of immersion in sodium sulphate for a fluoropolymer coating before and after mechanical deformation.
1oS! , I I r 0 160 200 360 4bO 5dO 660 760
Time (hours) Fig. 12. Charge transfer resistance (R,,) evolution vs. immersion time for epoxy primer with strontium
phosphate or strontium chromate pigments on 55X1 Al-&.

Investigating underpaint corrosion
I DOE-02 r
1081
A- E s
l -•
Z 2
B ‘.0°E-03 a .E / E 2 i; /-+-‘-‘-*
1 .OOE-04 - I I I I I I I 0 100 200 300 400 500 600 700
Time (hours)
Fig. 13. Trend of the delaminated area vs. immersion time for the 7% deformed fluoropolymers sample immersed in sodium sulphate solution.
with some assumption (absence of defects) environ- mentally friendly primers, too, can protect metal structures, as do chromates.
Double layer capacitance. From the C,, values it is possible to obtain information about the wet area. Comparing the values of the measured double layer capacitance with a specific Cd, (measured on bare samples) it is possible for example to evaluate the delamination area[22,26,46].
Figure 13 shows the trend of the delaminated area vs. immersion time for the 7% deformed fluoro- polymers sample (considering a specific double layer capacitance of 30pF/cm2)[25]. A large increase in the delamination area occurs only after about 450 h.
The comparison between the electrochemical behaviour at the interface of deformed and unde- formed samples is significant. The deformation can be assumed to be elastic and the shear elastic modulus is known to be about 600MPa. From this data the residual stress can be calculated and the value is about 4 kg/cm2. Comparing the reactive area obtained from the undeformed sample and the deformed one, it is possible to evaluate the influence of a residual stress of about 4 kg/cm2 on the interface degradation. After 100 h of immersion the reactive area measured using C,, on a different type of 7% deformed fluoropolymer coating is about 0.005cm2, and the value relevant to the undeformed sample is 0.001 cm2. The delamination tendency after bending, in this case, is about five times higher and this growth is due to the mechanical deformation which brings about the development of some defects and introduces residual stress at the interface.
CONCLUSIONS
In this work is shown the approach of electro- chemical impedance data interpretation by equiva- lent electrical circuits of organic coated metals showing some examples relevant to different metal substrates (mild steel, galvanized steel, aluminium, inox) or coating cycles (fluoropolymer, epoxy or polyester coatings).
The influence of different chemical and physical properties (adhesion, presence of defects, barrier properties, inhibition, etc.) on the EIS measurements was also discussed for the different examples. All
these parameters can influence the electrochemical behaviour measured by EIS, and therefore also the electrical models (equivalent electrical circuits) used to explain the impedance results.
REFERENCES
1
2 3.
4. 5.
6.
7.
8.
9.
10. 11.
12. 13. 14. 15.
16.
17. 18.
19. 20. 21.
22.
L. Beauvier, I. Epelboin, J. C. Lastrade, H. Takenouti, Surf. Technol. 4,237 (1976). L. M. Callow, J. D. Scantlebury, JOCCA 64, 83 (1981). J. Titz, G. H. Wagner, H. Spaehn, M. Ebert, K. Juett- ner, W. J. Lorenz, Corrosion 46, 221 (1990). H. Leidheiser. J. Coat. Tech. 63. 21 (1991). J. R. Macdonald, Impedance S~ectrhco~y. Wiley, New York (1986). E. P. M. van Westing, Ph.D. Thesis, Delft University, (1992) A. Pirnat, L. Meszaros, B. Lengyel, Electrochim. Acta 35, 515 (1990). F. Mansfeld, M. Kendig, S. Tsai, Corrosion 38, 478 (1982). F. Mansfeld, M. Kendig, S. Tsai, Corrosion Sci. 23, 317 (1983). G. W. Walter, Corrosion Sci. 26,681 (1986). F. Mansfeld, S. L. Jeanjaquet, M. Kendig, Corrosion Sci. 26, 735 (1986). M. Kendig, J. Scully, Corrosion 46.22 (1990). F. Mansfeld, C. H. Tsai, Corrosion 47,958 (1991). J. R. Scully, S. T. Hensley, Corrosion SO, 705 (1994). I. Thompson. D. CamDbell. Corrosion Sci. 36. 187 (1994). _ - F. Deflorian, L. Fedrizzi, P. L. Bonora, Corrosion 50, 113 (1994). R. Hirayama, S. Haruyama, Corrosion 47,952 (1991). F. M. Geenen, J. H. W. de Wit, E. P. M. van Westig, Prog. Org. Coat. 18,299 (1990). F. M. Geenen, Ph.D. Thesis, Delft University (1991). B. Boukamp, Solid State Ionics 20,31 (1986). E. P. M. van West&, G. M. Ferrari, J. H. W. de Wit, Corrosion Sci. 36. 1323 (1994). F. Deflorian, L.’ Fed&, b. L. Bonora, Prog. Org Coat., 23, 73 (1993).
23. G. L. M. K. S. Kahanda, M. Tomkiewicz, J. electro- chemical Sot. 137,3423 (1990).
24. F. Deflorian, L. Fedrizzi, A. Locaspi, P. L. Bonora, Electrochim. Acta 38, 1945 (1993).
25. F. Deflorian, L. Fedrizzi, P. L. Bonora, Proceedings of Advances in Corrosion Protection by Organic Coatings, P. 15. Cambridge. 12-16 September 1994.
26. ‘F. &florian, f. b. Misko&Stankovic, P. L. Bonora, L. Fedrizzi, Corrosion SO, 446 (1994).

1082 P. L. BONORA et al.
27.
28.
29. 30.
31.
32.
33.
34.
35.
36.
C. Cachet. R. Wiart. J. electroanal. Chem. 12% 103
L. Fedrizzi, F. Deflorian, D. Tomasi, P. L. Bonora, Pro- ceedinas of the 1st Mexican Symposium on Metallic Cor-
(1981).
rosion: Mlrida (Messico), 7-l i hiarch 1993, in press. F. Mansfeld, Electrochim. Acta 35, 1533 (1990). L. Fedriui, F. Deflorian, P. L. Bonora, Electrochimica Acta (accepted 1996). L. Lori, A. Tamba, F. Deflorian, L. Fedrizzi, P. L. Bonora, Progress in Organic Coatings (in press 1996). J. Hitzig, K. Jiittner, W. J. Lorenz, W. Paatsch, J. elec- trochem. Sot. 133,887 (1986). F. Deflorian, L. Fed&i, D. Lenti, P. L. Bonora, Prog. Org. Coat. 22, 39 (1993). C. Lin, T. Nguyen, M. McKnight, Prog. Org. Coat. 20, 169 (1992). F. Deflorian, L. Fedriti, G. Boni, Proceedings of the EUROCOAT 95. Lione. 19-21 Seotember 1995. Vol. 3. p. 129. - L. Fedrizzi, F. Deflorian, G. Boni, P. L. Bonora, E. Pasini, Proceedings of XXI Conference on Organic
37. H. Kawamoto, in Carbon Black polymers composites. Marcel Dekker, New York.
Coatings Science and Technology, Athens, 10-14 July, 1995, p. 171.
38. D. M. Brasher, A. H. Kingsbury, J. Appl. Chem. 4, 62 (1954).
39. T. Monetta, F. Bellucci, L. Nicodemo, L. Nicolais, Prog. Org. Coat. 21, 353 (1993).
40. W. Funke, JOCCA 9, 114 (1985). 41. H. Leidheiser. W. Funke. JOCCA 9. 121 (1985). 42. R. D. Arm&on& J. D.’ Wright, ?. M. ‘Hanhyside, J.
appl. Electrochem. 22,795 (1992). 43. A. Amirudin, D. Thierry, Prog. Org. Coat. 26, l(l995). 44. R. D. Armstrong, J. D. Wright, Electrochim. Acta 38,
1799 (1993). 45. A. Bittner J. Coat. Technol. 61, 11 (1989). 46. R. D. Armstrong, J. D. Wright, Corrosion Sci. 33, 1529
(1992).