
Jakarta, Presentation On Nexus Of Economic Freedeom, Migration
Upload
truongdieuCategory
view
217download
0
AE Electricity Consumption and Economic Growth Nexus: A Multivariate Analysis for Turkey
Amfiteatru Economic 246
ELECTRICITY CONSUMPTION AND ECONOMIC GROWTH NEXUS: A MULTIVARIATE ANALYSIS FOR TURKEY
Ali Acaravci 1and Ilhan Ozturk 2 1) Mustafa Kemal University, Hatay, Turkey
2) Cag University, Mersin, Turkey Abstract This study examines the short-run and long-run causality issues between electricity consumption and economic growth in Turkey for 1968–2006 period by using Granger causality models augmented with a lagged error-correction term. The bounds F–test for cointegration test yields evidence of a long-run relationship between employment ratio, electricity consumption per capita and real GDP per capita. The overall results from the three error-correction based Granger causality models show that there is an evidence of unidirectional short-run, long-run and strong causalities running from the electricity consumption per capita to real GDP per capita. But, there is no causal evidence from the real GDP per capita to electricity consumption per capita. In other words, “Growth hypothesis” is confirmed in Turkey. This suggests that electricity consumption plays an important role in economic growth. Keywords: electricity consumption, economic growth, causality JEL Classification: C32, C52, Q43
Introduction
Energy consumption and growth relationship has been widely discussed in the energy economics literature since the seminal work of Kraft and Kraft (1978). This issue has been analyzed by many academicians and becomes popular in the last decade1. However, the contractionary results in the empirical literature for electricity consumption-growth nexus are still contunies and there is no concensus about the relationship and direction of causality between these variables in the literature and Turkey has no exception. It is important to empirically investigate whether there is a causal link between electricity consumption and economic growth and the way of causality. This is because the direction of causality has Corresponding author, Ilhan Ozturk - [email protected]
The first version of this paper has been presented in the “Society for the Study of Emerging Markets’ EuroConference 2010, July 16-18, 2010, Milas, Turkey”.
1 See Narayan and Prasad (2008), Payne (2010) and Ozturk (2010) for a detailed literature survey on electricity consumption – economic growth nexus.

Economic Interferences AE
Vol. XIV • No. 31 • February 2012 247
significant policy implications for designing and implementing energy policies (Jumbe, 2004). There are four testable hypotheses related energy-growth nexus in the literature which are as follows: (1) Growth hypothesis: It implies that causality running from electricity consumption to economic growth. (2) Conservation hypothesis: It is also called unidirectional causality running from economic growth to electricity consumption. (3) Feedback hypothesis: It implies that there is two-way (bidirectional) causality between electricity consumption and economic growth. (4) Neutrality hypothesis: The neutrality hypothesis is supported by the absence of a causal relationship between electricity consumption and real GDP.
Projections for Turkey made officially indicate a continuing increase in demand for energy, especially for electricity, in the next two decades (ESMAP Report, 2000). In addition, this relation can be seen in figure no. 1 and table no. 1 which show that (i) both series are moving smoothly with an upward trend, but (ii) electricity consumption has a higher growth rate than GDP. This means that the higher demand for electricity in Turkey is growing rapidly due to the technical, social and economic development.
The aim of this study is to investigate the causal relationship between electricity consumption and economic growth in Turkey by using autoregressive distributed lag (hereafter ARDL) bounds testing approach of cointegration and error-correction based Granger causality models for Turkey over 1968–2006 period. The rest of the paper is organized as follows. The next section presents the model and data. Section three shows the methodology. The fourth section reports the empirical results. The last section concludes the paper.
(a) in log-levels (b) in growth rates Figure no. 1: The electric power consumption per capita, employment ratio
and real GDP per capita
Table no. 1: The average growth rates of electricity consumption and real GDP (%) Variables 1968-72 1973-77 1978-82 1983-87 1988-92 1993-97 1998-02 2003-06
gELC 7.94 8.98 2.06 6.24 4.73 5.10 1.94 4.30
gGDP 1.91 3.33 -0.81 3.43 1.30 1.98 -0.68 4.11
gELC - gGDP 6.03 5.65 2.87 2.81 3.43 3.12 2.62 0.19 Notes: gELC and gGDP are the average growth rates of electricity consumption per capita (kWh) and real GDP per capita (constant 2000 US$), respectively

AE Electricity Consumption and Economic Growth Nexus: A Multivariate Analysis for Turkey
Amfiteatru Economic 248
Since the question of whether electricity consumption causes economic growth or economic growth causes electricity consumption is an unresolved issue, this paper may be considered as a complementary study to the previous studies. Because most of the earlier studies on the electricity consumption - growth nexus were using only two variables. In other words, they were employed bivariate models which cause an omitted variable problem. Thus, to avoid this problem, we used a multivariate model in this study by adding also employment variable into model. The empirical results of related studies for Turkey are summarized in table no. 2. It can be seen that there is no consensus on the subject which is in line with the existing literature.
Table no. 2: Summary of empirical studies on electricity consumption–growth nexus for Turkey
Authors Period Variables Methodology Conclusion
Murry and Nan (1996)
1950-1970 Electricity consumption, GDP
Granger causality, VAR
ELC GDP
Altinay and Karagol (2005)
1950-2000 Electricity consumption, GDP
Granger-causality, Dolado–Lutkepohl causality
ELC GDP
Halicioglu (2007)
1968-2005 Residential electricity consumption, GDP, residential electricity price, the urbanization rate
Granger causality, ARDL cointegration
GDP ELC
Narayan and Prasad (2008)
1960-2002 Electricity consumption, GDP
Bootstrapped Granger-causality
ELC GDP
Soytas and Sari (2007)
1968-2002 Industry electricity consumption, value added-Manufacturing, Manufacturing employment, manufacturing real fixed investment
Granger-causality, VEC, JJ cointegration
IELC MVA
Notes: and represent unidirectional causality and no causality, respectively. Abbreviations are defined as follows: VAR= vector autoregressive model, VEC= vector error correction model, JJ= Johansen–Juselius, ARDL= autoregressive distributed lag, ELC= electricity consumption, GDP= real gross domestic product, IELC= industrial electricity consumption, MVA= manufacturing value added.
1. Model and data description
Following the empirical literature, the standard log-linear functional specification of long-run relationship between the real GDP, electricity consumption and employment ratio (percent) may be expressed as:
t t t tgdp elc em (1)
where gdp ln GDP / Nt t t , elc ln ELC / Nt t t , em ln EM / Nt t t and
t is the error term; GDP is real GDP (constant 2000 US$), N is total population, ELC is
electric power consumption (kWh) and EM is total labor force. The annual Turkish time series (except labor force) data are taken for 1968-2006 from the World Development

Economic Interferences AE
Vol. XIV • No. 31 • February 2012 249
Indicators - WDI (The World Bank, 201-) online database and data for total labor force is obtained from Turkish Statistical Institute (201-). All variables are employed with their natural logarithms form to reduce heteroscedasticity and to obtain the growth rate of the relevant variables by their differenced logarithms.
2. Methodology
The relationship between the electricity consumption and economic growth will be performed in two steps. First, we will define the long-run relationships among the variables by using the ARDL bounds testing approach of cointegration. Secondly, we will test causal relationships by using the error-correction based causality models.
2.1 Autoregressive Distributed Lag (ARDL) Cointegration Analysis
The ARDL bounds testing approach of cointegration is developed by Pesaran and Shin (1999) and Pesaran et al. (2001). The ARDL cointegration approach has numerous advantages in comparison with other cointegration methods such as Engle and Granger (1987), Johansen (1988), and Johansen and Juselius (1990) procedures: (i) it is efficent estimator even if samples are small and some of the regressors are endogenous, (ii) it allows that the variables may have different optimal lags, and (iii) it employs a single reduced form equation and thus it has less loss in degree of freedom, iv) no need for all the variables in the system be of equal order of integration, therefore it does not require the pre-testing of the variables, included in the model, for stationary analysis (See, Pesaran and Shin,1999; Pesaran et al. 2001).
However, if the order of integration of any of the variables is greater than one, for example an I(2) variable, then the critical bounds provided by Pesaran et al. (2001) and Narayan (2005) are not valid. They are computed on the basis that the variables are I(0) or I(1). For this purpose, it is necessary to test for unit root to ensure that all the variables satisfy the underlying assumption of the ARDL bounds testing approach of cointegration methodology before proceeding to the estimation stage. In order to overcome the low power problems associated with conventional unit root tests especially in small samples, we therefore prefer the weighted symmetric ADF test (ADF-WS) of Park and Fuller (1995), and the generalized least squares version of the Dickey-Fuller test (ADF-GLS) proposed by Elliot, Rothenberg, and Stock (1996). These tests require much shorter sample sizes than conventional unit root tests to attain the same statistical power. Leybourne et al. (2005) have recently noted that ADF-WS has good size and power properties compared to other tests.
Basically, the ARDL approach involves two steps for estimating long-run relationship. The first step is to investigate the existence of long-run relationship among all variables in the equation. The ARDL model for the standard log-linear functional specification of long-run relationship between electricity consumption per capita, employment ratio and real GDP per capita may follows as:
1 1 1
1 1 11 0 0
1 1 2 1 3 1 1
1
a b c
t i t i p t p q t qi p q
t t t t
gdp gdp elc em
gdp elc em
(2)

AE Electricity Consumption and Economic Growth Nexus: A Multivariate Analysis for Turkey
Amfiteatru Economic 250
where 1t and are the white noise term and the first difference operator, respectively.
An appropriate lag selection based on a criterion such as Akaike Information Criterion (AIC) and Schwarz Bayesian Criterion (SBC). The bounds testing procedure is based on
the joint F-statistic or Wald statistic that is tested the null of no cointegration, 0 : 0rH ,
against the alternative of 1 : 0rH , 1, 2,3r .
Two sets of critical values that are reported in Pesaran et al. (2001) provide critical value bounds for all classifications of the regressors into purely I(1), purely I(0) or mutually cointegrated. If the calculated F-statistics lies above the upper level of the band, the null is rejected, indicating cointegration. If the calculated F-statistics is below the upper critical value, we cannot reject the null hypothesis of no cointegration. Finally, if it lies between the bounds, a conclusive inference cannot be made without knowing the order of integration of the underlying regressors. Recently, Narayan (2005) argues that exiting critical values, because they are based on large sample sizes, cannot be used for small sample sizes. Narayan (2005) regenerated the set of critical values for the limited data ranging from 30–80 observations by using the Pesaran et al. (2001)’s GAUSS code. With the limited annual time series Turkish data on electricity consumption per capita, employment ratio and real GDP per capita, this study employs the critical values of Narayan (2005) for the bounds F-test rather than Pesaran et al. (2001).
If there is evidence of long-run relationships (cointegration) between the variables, the second step is to estimate the following long-run and short-run models that are represented in Equations (3) and (4):
2 2 2
2 2 21 0 0
2 2
a b c
t i t i p t p q t qi p q
tgdp gdp elc em
(3)
3 3 3
3 3 31 0 0
3 1 3
a b c
t i t i p t p q t qi p q
t tgdp gdp elc em ECT
(4)
where is the coefficient of error correction term (hereafter ECT). ECT, defined as:
2 2 2
2 2 21 0 0
2
a b c
t i t i p t p q t qi p q
tECT gdp gdp elc em
(5)
It shows how quickly variables converge to equilibrium and it should have a statistically significant coefficient with a negative sign.
2.2 Causality analysis
ARDL cointegration method tests the existence or absence of long-run relationships between electricity consumption per capita, employment ratio and real GDP per capita. It doesn’t indicate the direction of causality. We use the two-steps procedure from the Engle and Granger (1987) model to examine the causal relationship between the variables. Once estimating the long-run model in Equation (3) in order to obtain the estimated residuals, the

Economic Interferences AE
Vol. XIV • No. 31 • February 2012 251
next step is to estimate error-correction based Granger causality models. As opposed to the conventional Granger causality method, the error-correction based causality test allows for the inclusion of the lagged error-correction term derived from the cointegration equation (See Odhiambo, 2009). This approach allows us to distinguish between “short-run” and “long-run” Granger causality. Nonsignificance or elimination of any of the “lagged error-correction terms” affects the implied long-run relationship and may be a violation of theory. The nonsignificance of any of the “differenced” variables reflects only short-run relationship (Masih and Masih, 1996). Thus, the following models may employ to explore the causal relationships between the variables:
11
2
3
11,1 12,1 13,1
21,1 22,1 23,1 1
31,1 32,1 33,1 1
11, 12, 13,
21, 22, 23,
31, 32, 33,
...
t t
t t
t t
k k k
k k k
k k k
gdp gdp
elc elc
em em
41
2 5
6
1
3
t
t
t
t k
t k t
t k
gdp
elc ECT
em
(6)
Residual terms, 4t , 5t and 6t , independently and normally distributed with zero mean
and constant variance. Using Equation (6), causal relationships can be examined in three ways: i) Short-run or weak Granger causalities are detected through the F-statistics or Wald test for the significance of the relevant coefficients on the first differenced series. ii) Another possible source of causation is the ECT in equations; the long-run causalities are examined through the t-test or Wald test for the significance of the relevant coefficient
on the lagged error–correction term. iii) Strong Granger causalities are detected by joint testing of significance of the relavant and coefficients (table no. 3).
Table no. 3: The null hypotheses for Granger causalities
Short-run Causality Long-run Causality
gdp elc em i
gdp --- 12,1 12,... 0k 13,1 13,... 0k 1 0
elc 21,1 21,... 0k --- 23,1 23,... 0k 2 0
em 31,1 31,... 0k 32,1 32,... 0k --- 3 0
Strong Causality
gdp elc em
gdp 1 12,1 12,... 0k 1 13,1 13,... 0k
elc 2 21,1 21,... 0k --- 2 23,1 23,... 0k
em 3 31,1 31,... 0k 3 32,1 32,... 0k ---

AE Electricity Consumption and Economic Growth Nexus: A Multivariate Analysis for Turkey
Amfiteatru Economic 252
3. Empirical results
Results of the weighted symmetric ADF test (ADF-WS) and the generalized least squares version of the Dickey-Fuller test (ADF-GLS) are presented in table no. 4. The null hypothesis is unit root and the alternative hypothesis is level stationarity for both tests. The Dickey-Fuller regressions include an intercept and a linear trend in the levels, and include an intercept in the first differences. The numbers of optimal lags are based on SBC. 95% simulated critical values for 36 observations computed by stochastic simulations. The results indicate that electricity consumption per capita and real GDP per capita are I(1) while employment ratio is I(0). Thus we can confidently apply the ARDL methodology to our model.
Table no. 4: Unit roots test results
In levels 1st differences ADF-GLS ADF-WS ADF-GLS ADF-WS gdp - 2.5520 (0) c+t - 2.7023 (0) c+t - 6.0439 (0) c - 6.2643 (0) c elc - 1.9213 (1) c+t - 1.4839 (1) c+t - 3.3222 (0) c - 3.9135 (0) c em - 3.2152 (0) c+t - 3.3996 (1) c+t Critical Values
- 3.1910 (0) - 3.2397 (1)
- 3.2430 (0) - 3.4164 (1)
- 2.2717 (0) - 2.3131 (1)
- 2.5188 (0) - 2.6597 (1)
Notes: Model c+t has the Dickey-Fuller regressions include an intercept and a linear trend, model c has the Dickey-Fuller regressions include an intercept but not a trend. Numbers of lags are in ( ).
CV is the 95% simulated critical value using 36 observations and computed by stochastic simulations for relevant numbers of lags are in ( ) using 1000 replications.
According to Pesaran and Shin (1999), the SBC is generally used in preference to other criteria because it tends to define more parsimonious specifications. With the limited observations, this study used the SBC to select an appropriate lag for the ARDL model. Table no. 5 presents the estimated ARDL (1,1,0) model that has passed several diagnostic tests that indicate no evidence of serial correlation and heteroskedasticity. Besides this, the ADF unit root test for the residuals revealed that they are stationary. The bounds F–test for cointegration test yields evidence of a long-run relationship between electricity consumption per capita and real GDP per capita at 1% significance level in Turkey. The estimated log-linear long-run coefficient of the electricity consumption per capita is about 0.33 and positive. This coefficient implies the elasticity of electricity consumption and an increase in electricity consumption per capita will raise the real GDP per capita by 33%. The estimated ECT is also negative (-0.326) and statistically significant at 1% confidence level. ECT indicates that any deviation from the long-run equilibrium between variables is corrected about 33% for each period and takes about 3 periods to return the long-run equilibrium level.
Table no. 5: Estimated short-run and long-run coefficients using the ARDL (1,1,0)
Variables Short-Run Long-Run
GDP(-1) 0.674 [0.000]
ELC 0.876 [0.000] 0.329 [0.000]
ELC(-1) -0.769 [0.000]
EM - 0.169 [0.315] - 0.519 [0.366]
Constant 2.475 [0.008] 7.602 [0.003]
Economic Interferences AE
Vol. XIV • No. 31 • February 2012 253
Variables Short-Run Long-Run
R2 0.9887 NORM 1.094 [0.579]
ECM -0.326 [0.006]
Adj. R2 0.9874 LM 1.842 [0.175]
ADF -7.034 (-4.513)
RSS 0.0209 HET 0.275 [0.600]
F 6.634
Notes: RSS is residual sum of squares. NORM, LM and HET are the Lagrange multiplier statistics for normality, serial correlation and heteroskedasticity of residuals, respectively. These statistics are distributed as χ2 distribution with two degree of freedom for NORM and one degree of freedom for LM and HET. ECT is the estimated coefficient of error correction term. p-values for the estimated coefficients and statistics are in [ ]. ADF is unit root test statistics for residuals and its %5 critical value is in ( ). F is the ARDL bounds test. The critical values for the lower I(0) and upper I(1) bounds are 4.948 and 6.028 for 1 % significance level, respectively (Narayan, 2005, Appendix: Case II).
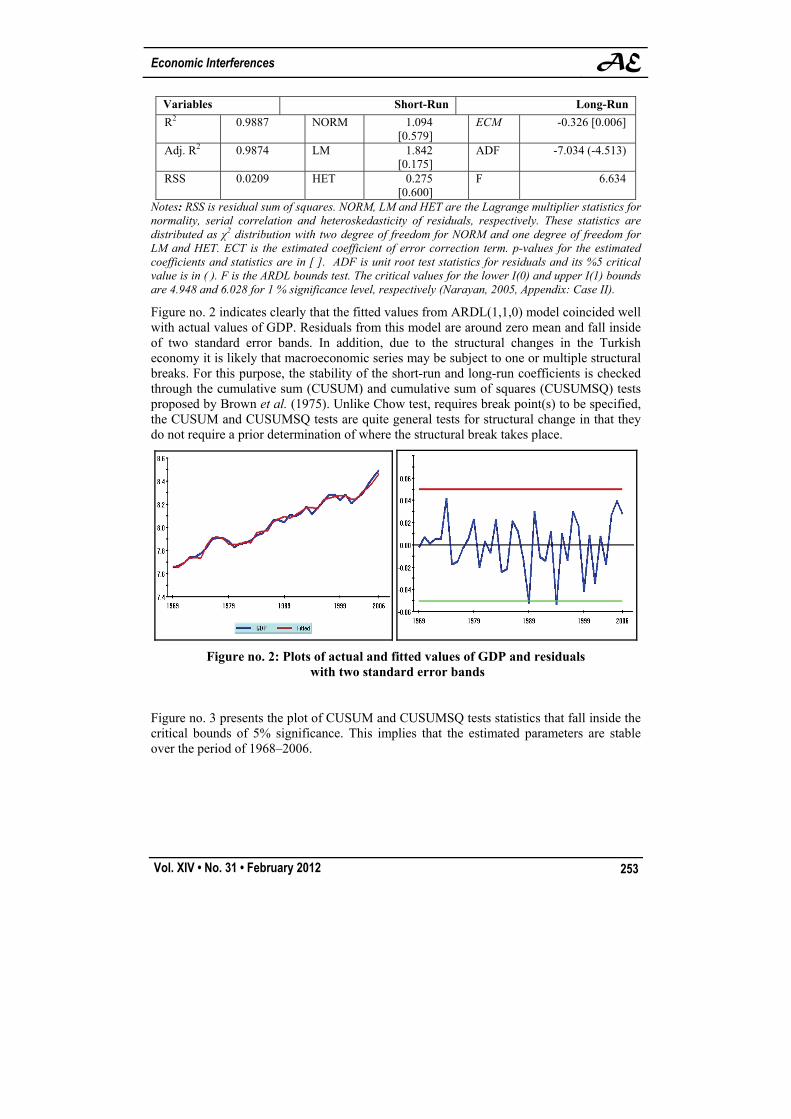
Figure no. 2 indicates clearly that the fitted values from ARDL(1,1,0) model coincided well with actual values of GDP. Residuals from this model are around zero mean and fall inside of two standard error bands. In addition, due to the structural changes in the Turkish economy it is likely that macroeconomic series may be subject to one or multiple structural breaks. For this purpose, the stability of the short-run and long-run coefficients is checked through the cumulative sum (CUSUM) and cumulative sum of squares (CUSUMSQ) tests proposed by Brown et al. (1975). Unlike Chow test, requires break point(s) to be specified, the CUSUM and CUSUMSQ tests are quite general tests for structural change in that they do not require a prior determination of where the structural break takes place.
Figure no. 2: Plots of actual and fitted values of GDP and residuals with two standard error bands
Figure no. 3 presents the plot of CUSUM and CUSUMSQ tests statistics that fall inside the critical bounds of 5% significance. This implies that the estimated parameters are stable over the period of 1968–2006.

AE Electricity Consumption and Economic Growth Nexus: A Multivariate Analysis for Turkey
Amfiteatru Economic 254
Figure no. 3: Plot of Cusum of Squares and Cusum test
This study also explores causal relationship between the variables in terms of the three error-correction based Granger causality models: i) Weak (short-run) Granger causality, ii) Long-run Granger causality, and iii) Strong Granger causality. According to results from three kinds of Granger causality, there are evidences of a unidirectional short-run, long-run and strong causalities running from the electricity consumption per capita; evidences of a unidirectional short-run and strong causalities running from employment ratio to real GDP per capita. But, there is no causal evidence from the real GDP per capita to electricity consumption per capita (table no. 6 and figure no. 4). These results confirms “Growth hypothesis” for Turkey which suggests that electricity consumption plays an important role in economic growth. Thus, any reducing (increasing) in electricity consumption could lead to a fall (rise) in growth of Turkish economy.
Table no. 6: Granger causality test results
Short-run Causality Long-run Causality
gdp elc em i
gdp --- 3.4145 (0.0646) 8.2573 (0.0041) 6.0143 (0.0142)
elc 0.0001 (0.9998) --- 1.4794
(0.2239) 0.4031 (0.5255)
em 0.8663 (0.3520) 0.0714 (0.7893) --- 0.0457 (0.8308)
Strong Causality
gdp elc em
gdp --- 6.2904 (0.0431) 13.6519 (0.0041)
elc 0.4116 (0.8140) --- 1.9577 (0.3758)
em 0.8726 (0.6464) 0.0766 (0.9624) ---
Notes: The null hypothesis is that there is no causal relationship between variables. Values in parentheses are p-values for Wald tests with a χ2 distribution. ∆ is the first difference operator.

Economic Interferences AE
Vol. XIV • No. 31 • February 2012 255
Figure no. 4: Granger causality relationships
Conclusion
There is a growing literature that examines the causality relationship between electricity consumption and real GDP. But, the empirical results have yielded mixed results in terms of the four hypotheses (neutrality, conservation, growth, and feedback) related to the causal relationship between electricity consumption and economic growth. This study may be considered as a complementary study to the previous studies about the causal relationship between energy consumption and economic growth for Turkey.
This paper investigates the short-run and long-run causality issues between electricity consumption and economic growth in Turkey for 1968–2006 period by using Granger causality models augmented with a lagged error-correction term. According to three kinds of Granger causality results, the electricity consumption per capita weakly and strongly causes real GDP per capita in both short-run and long-run. The results also show that there is no causal evidence from the real GDP per capita to electricity consumption per capita. In other words, there is only unidirectional causality running from electricity consumption to real GDP in Turkey. Thus, “Growth hypothesis” is confirmed in Turkey. This implies that high electricity consumption tends to have high economic growth, but not the reverse case in Turkey.
As a conclusion, energy conservation policies, such as rationing electricity consumption, are likely to have an adverse effect on real GDP of Turkey. As a policy implication, the energy growth policies regarding electricity consumption should be adapted in such a way that the development of this sector stimulates economic growth.
References
Altinay, G. and Karagol, E., 2005. Electricity consumption and economic growth: evidence from Turkey. Energy Economics, 27(6), pp. 849–856.
Brown, R.L., Durbin, J. and Evans, J.M., 1975. Techniques for testing the consistency of regression relations over time. Journal of the Royal Statistical Society, 37(2), pp. 149-192.
Elliot, G., Rothenberg, T.J. and Stock, J.H., 1996. Efficient tests for an autoregressive unit root. Econometrica, 64(4), pp. 813–836.
gdp
em
elc
Unidirectional strong Granger Causality
Unidirectional long run Granger Causality
Unidirectional short run Granger Causality

AE Electricity Consumption and Economic Growth Nexus: A Multivariate Analysis for Turkey
Amfiteatru Economic 256
Engle, R.F. and Granger, C.W.J., 1987. Co-integration and error correction: representation, estimation, and testing. Econometrica, 55(2), pp. 251-276.
ESMAP Report, 2000. Turkey Energy and the Environment Issues and Options Paper. Report No: ESM 229. USA: Europe and Central Asia Region, Energy Sector Unit Energy, Mining and Telecommunications Department and Environment Department of the World Bank.
Halicioglu, F., 2007. Residential electricity demand dynamics in Turkey. Energy Economics, 29(2), pp. 199–210.
Johansen, S., 1988. Statistical analysis of cointegration vectors. Journal of Economic Dynamics and Control, 12(2-3), pp. 231-254.
Johansen, S. and Juselius, K., 1990. Maximum likelihood estimation and inference on cointegration - with applications to the demand for money. Oxford Bulletin of Economics and Statistics, 52(2), pp. 169-210.
Jumbe, C.B.L., 2004. Cointegration and causality between electricity consumption and GDP: empirical evidence from Malawi. Energy Economics, 26(1), pp. 61–68.
Kraft, J. and Kraft, A., 1978. On the relationship between energy and GNP. Journal of Energy and Development, 3(2), pp. 401– 403.
Leybourne, S.J., Kim, T. and Newbold, P., 2005. Examination of some more powerful modifications of the Dickey-Fuller test. Journal of Time Series Analysis, 26(3), pp. 355-369.
Murray, D.A. and Nan, G.D., 1996 A definition of the gross domestic product-electrification interrelationship. Journal of Energy and Development, 19(2), pp. 275–283.
Masih, A.M.M. and Masih, R., 1996. Energy consumption, real income and temporal causality: results from a multi-country study based on cointegration and error-correction modeling techniques. Energy Economics, 18(3), pp. 165–183.
Narayan, P.K., 2005. The saving and investment nexus for China: evidence from cointegration tests. Applied Economics, 37(17), pp. 1979–1990.
Narayan, P.K. and Prasad, A., 2008. Electricity consumption-real GDP causality nexus: evidence from a bootstrapped causality test for 30 OECD countries. Energy Policy, 36(2), pp. 910–918.
Odhiambo, N.M., 2009. Energy consumption and economic growth nexus in Tanzania: an ARDL bounds testing approach. Energy Policy, 37(2), pp. 617-622.
Ozturk, I., 2010. A literature survey on energy–growth nexus. Energy Policy, 38(1), pp. 340-349.
Park, H.J. and Fuller W.A., 1995. Alternative estimators and unit root tests for the autoregressive process. Journal of Time Series Analysis, 16(4), pp. 415–429.
Payne, J.E., 2010. A survey of the electricity consumption-growth literature. Applied Energy, 87(3), pp. 723-731.
Economic Interferences AE
Vol. XIV • No. 31 • February 2012 257
Pesaran, H.M. and Shin, Y., 1999. Autoregressive distributed lag modelling approach to cointegration analysis. In: S. Storm, ed. 1999. Econometrics and Economic Theory in the 20th Century: The Ragnar Frisch Centennial Symposium. Cambridge: Cambridge University Press. Ch. 11.
Pesaran, M.H., Shin, Y. and Smith, R.J., 2001. Bounds testing approaches to the analysis of level relationships. Journal of Applied Econometrics, 16(3), pp. 289–326.
Soytas, U. and Sari, R., 2007. The relationship between energy and production: evidence from Turkish manufacturing industry. Energy Economics, 29(6), pp. 1151–1165.
The World Bank, 201-. World Development Indicators. [online] Available at: <http://data.worldbank.org/indicator> [Accessed 12 January 2012].
Turkish Statistical Institute, 201-. Turkish Statistical Institute. [online] Available at: <www.tuik.gov.tr> [Accessed 12 January 2012].