Electrical Machines LAB Manual 2015 16 Cycle 2 (1)
27
- 1 - EXPERIMENT No. 5 NO LOAD TESTS ON A DC SHUNT MOTOR Name____________________________________________ ID No._______________________ Sec.No ________________________ Batch No._____________ Marks obtained_____________ Date__________________________ Instructor’s signature______________________________ --------------------------------------------------------------------------------------------------------------------- A. SWINBURNE’S TEST 1. Objective To determine the performance of the given DC shunt machine in both generator and motor modes of operation. 2. Name plate ratings of the machine to be tested: ……………………………………………………………………………………………… ……………………………………………………………………………………………… 3. Range of Instruments and other Accessories S. No. DESCRIPTION TYPE RANGE MFR. NAME MFR. NO.
-
Upload
harshit-garg -
Category
Documents
-
view
20 -
download
6
description
1. NO LOAD TEST ON A DC SHUNT MOTOR 2. SUMPNER'S TEST3. NO LOAD TEST ON A DC SHUNT GENERATOR4. NO LOAD TEST ON A THREE PHASE INDUCTION MOTOR5. LOAD TEST ON SYNCHRONOUS MACHINE
Transcript of Electrical Machines LAB Manual 2015 16 Cycle 2 (1)

- 1 -
EXPERIMENT No . 5
NO LOAD TESTS ON A DC SHUNT MOTOR
Name____________________________________________ ID No._______________________
Sec.No ________________________ Batch No._____________ Marks obtained_____________
Date__________________________ Instructor’s signature______________________________
---------------------------------------------------------------------------------------------------------------------
A. SWINBURNE’S TEST
1. Objective
To determine the performance of the given DC shunt machine in both generator and
motor modes of operation.
2. Name plate ratings of the machine to be tested:
………………………………………………………………………………………………
………………………………………………………………………………………………
3. Range of Instruments and other Accessories
S. No. DESCRIPTION TYPE RANGE MFR. NAME MFR. NO.

- 2 -
4. Circuit Diagram
Fig. 2.1
5. Methodology
Connect the machine under test as in the circuit diagram of Fig. 2.1. Start the motor by
including maximum external resistance (Ra) in armature circuit and fully cutting out
regulating resistance (Rf) in the field circuit.
• Adjust external resistance in armature to give rated at voltage at machine terminals.
• Adjust regulating resistance in the field circuit to give rated speed at no–load.
Readings
Applied voltage, V =
Armature current, Ia0 =
Field current, If =
Now, measure the armature resistance by connecting a voltmeter across A–AA, an
ammeter and an external resistance in series, across a DC source (do not connect field
circuit).
==a
aa I
VR
6. Calculations
Constant loss, ( )=−= aaLk RIVIP 200
Armature copper loss, == aav RIP 2
Total loss, =+= vkL PPP

- 3 -
Efficiency can now be calculated as:
Generator
( )=+= fLa III (2.1)
=
+=
LL
LG PVI
VIη (2.2)
Motor
( )=−= fLa III (2.3)
=
−=L
LLM VI
PVIη (2.4)
Using the above relations, carry out computations for generator and motor efficiencies in
the tabular form given below.
Generator Operation
V = _____________, If = ______________, Pk = ____________, Ra = ___________
IL (%FL) 20 40 60 80 100 120
Output(VIL)
Ia
Pv = I2aRa
PL = Pk + Pv
Input = Output + PL
Efficiency (%)
Motor Operation
V = ______________, If = ______________, Pk = ____________, Ra = ___________
IL(%FL) 20 40 60 80 100 120
Input(VIL)
Ia
Pv = I2aRa
PL = Pk + Pv
Output = Input - PL
% Efficiency

- 4 -
7. Graph to be drawn
1. Efficiency vs. output (kW) for generator operation
2. Efficiency vs. output (kW) for motor operation
8. Results
Generator Mode:
Load Efficiency IL
FL41
FL2
1
FL4
3
FL
Motoring Mode:
Load Efficiency IL
FL4
1
Fl2
1
FL4
3
FL
B. SPEED CONTROL OF A DC MOTOR (NO-LOAD)
1. Introduction
The DC motors are, in general, much more adaptable speed drives than AC motors. The
speed of DC motor depends upon the following relations.
−=ϕ
aaan
RIVKn (2.5)
where Va = voltage across armature terminals
Armature voltage drop is quite small and can be ignored. Thus,

- 5 -
≈ϕ
an
VKn (2.6)
As per the magnetization characteristic,
( )fIF=ϕ ; (F is function of) (2.7)
So from eq. (2.6),
( )
=
f
an IF
VKn (2.8)
In the linear region of magnetization, ff IK=ϕ and so
=
f
an I
VKn (2.9)
This equation gives two methods of speed control.
Variation of field excitation (keeping Va constant): Field control.
Variation of voltage across armature (Va) (keeping field current constant): Armature
control.
2. Objective
To obtain the speed control characteristics of a DC motor at no load.
3. Name plate rating:
………………………………………………………………………………………………
………………………………………………………………………………………………
………………………………………………………………………………………………
………………………………………………………………………………………………
4. Rating of instruments and accessories (standard format)
S. No. DESCRIPTION TYPE RANGE MFR. NAME MFR. NO.

- 6 -
5. Connection Diagram
The circuit diagram for speed control is given in Fig.2.1.
6. Methodology
Field Control
Start the motor with field regulating resistor (Rf) at minimum value and armature
resistance (Ra) at maximum value. Increases Rf till the machine runs at rated r.p.m. Further,
increase the field resistance Rf and note down the speed for the corresponding value of field
current.
Take one more set of reading at about 20% lower than rated Va.
Readings
1) Va = _________________.
If
N
2) Va = ________________.
If
N
Armature Control
Here, since speed is directly proportional to the armature voltage, keeping field current
constant, speed lower than rated can be obtained.
Now, connect the motor as in Fig.2.1. Switch on the mains and run the machine at rated
r.p.m. as in field control. Keeping field current constant, vary the voltage across armature by
adjusting Ra. At each value of voltage across armature, note the corresponding speed.
This method is however not suitable for big machines, where Ward–Leonard test is
employed.
Take one more set at about 20% lower If.
Readings
1) I f = ________________.
Va

- 7 -
n
2) I f = ________________.
Va
n
7. Calculations: NIL
8. Graphs to be drawn
1. Speed vs. field current (field control)
2. Speed vs. voltage across armature (armature control)
9. Results
The speed characteristics are as shown in the graphs

- 8 -
EXPERIMENT No. 6
SUMPNER’S TEST
Name____________________________________________ ID No._______________________
Sec.No _______________________ Batch No._____________ Marks obtained_____________
Date__________________________ Instructor’s signature______________________________
---------------------------------------------------------------------------------------------------------------------
1. Objective
To determine the parameters of the equivalent circuit of a single-phase transformer and
estimate the performance characteristics.
2. Name plate ratings of the transformer to be tested:
………………………………………………………………………………………………
………………………………………………………………………………………………
3. Range of instruments and accessories (standard format)
S.No. DESCRIPTION TYPE RANGE MFR. NAME MFR. NO.

- 9 -
4. Connection Diagram
Fig.6.1 Circuit Diagram for Sumpner’s Test
5. Methodology
1. Bring the variac (in the secondaries circuit) to zero position.
2. Adjust the variac so as to make the input voltage V1 equal to the rated value. Keeping
SPST switch open; switch on the mains. If the secondaries are currently connected in
phase opposition, the voltage across the switch will be nearly zero. Otherwise this
voltmeter will read twice the rated secondary voltage. In such a case switch off the
supply and reverse the polarities of one of the secondaries. Restart the experiment and
see the voltage across the switch is nearly zero.
3. Close the SPST switch. Raise the variac output voltage gradually such that the
secondary current (I2) attains full-load value.

- 10 -
Readings (LV side)
Applied voltage, V1 = (rated)
Input current, I1 = 2I0 =
Input power (W1), 2Pi (core loss) =
Input power to each transformer, Pi =
Readings (HV side)
Applied voltage, V2 =
Input current, I2 = (adjusted to full-load value in step-3 above)
Input power (W2), 2PC (copper loss) =
Input power to each transformer, Pc =
6. Calculations
Shunt parameters (LV side) are
=
=
1
00 V
IY (6.1)
=
=
21V
PG i
i (6.2)
( ) =−= 220 im GYB (6.3)
Series parameters (HV side) are
=
=
2
22I
VZ eq
=eqZ (6.4)
=
=
22I
PR C
eq (6.5)
( ) =−= 22eqeqeq RZX (6.6)
7. Graphs: NIL
8. Results
a) Draw the equivalent circuit of the transformer as seen from LV side.
b) Draw the equivalent circuit of the transformer as seen from HV side.

- 11 -
EXPERIMENT No. 7
NO LOAD TESTS ON DC SHUNT GENERATOR
Name____________________________________________ ID No._______________________
Sec.No _______________________ Batch No._____________ Marks obtained_____________
Date__________________________ Instructor’s signature______________________________
----------------------------------------------------------------------------------------------------
A. Open-Circuit Test
B. Critical Speed of a DC Shunt Generator
A. OPEN–CIRCUIT TEST
1. Objective
To obtain the magnetization characteristic, and determine the critical field resistance and
critical speed of the given DC shunt generator.
2. Name plate ratings:
………………………………………………………………………………………………
………………………………………………………………………………………………
3. Range of instruments and accessories (standard format)
S.No. DESCRIPTION TYPE RANGE MFR. NAME MFR. NO.

- 12 -
4. Connection Diagram
Fig.4.1
5. Methodology
1. Connect the generator as shown in Fig.4.1
2. Switch on the DC mains.
3. Start the DC motor and adjust to the rated speed of the generator.
4. Slowly increase the voltage across generator field with the help of jockey of the
potential divider. Note down the induced e.m.f. and field current.
5. Repeat the process until the voltage reads 20% more than the rated value. Throughout
the experiment the speed is kept constant at the rated value.
Readings
Residual voltage before introducing the field =
Rated speed, n =
Table 4.1
If
Ea
6. Calculations: NIL

- 13 -
7. Graph to be drawn
(1) Magnetization characteristics
8. Results
(a) Critical field resistance Rc at rated speed (from the graph) =
(b) Critical speed at If, corresponding to rated e.m.f. =
B. Critical Speed of a DC shunt Generator
1. Objective
To determine the critical speed of a DC generator.
2. Name plate ratings:
………………………………………………………………………………………………
………………………………………………………………………………………………
3. Range of instruments and accessories (standard format)
S.No. DESCRIPTION TYPE RANGE MFR. NAME MFR. NO.
4. Connection Diagram:
Fig.4.2

- 14 -
5. Methodology
1. Connect as shown in Fig.4.2
2. Switch on the mains.
3. Adjust the speed of the motor to the rated of generator.
4. Keeping the field circuit resistance unaltered, reduce the speed by armature control.
Note down the speed and e.m.f. induced.
Readings
Field current, If =
Table 4.2
N
V0 = Ea
6. Calculations: NIL
7. Graph to be drawn
(1) e.m.f. induced vs. speed
8. Results
(a) Critical speed at If, corresponding to rated e.m.f. =
(b) Critical speed of Generator =

- 15 -
EXPERIMENT No. 8
NO LOAD TESTS ON A THREE-PHASE INDUCTION MOTOR
Name__________________________________________ ID No.________________________
Sec.No ___________________ Batch No._____________ Marks obtained ________________
Date__________________________ Instructor’s signature ____________________________
---------------------------------------------------------------------------------------------------------------------
1. Objective
To determine the circuit model parameters and estimate the performance of a three-phase
induction motor.
2. Name plate ratings:
…………………………………………………………………………………………………
…………………………………………………………………………………………………
3. Range of instruments and other accessories (standard format)
S.No. DESCRIPTION TYPE RANGE MFR. NAME MFR. NO.

- 16 -
4. Connection Diagram
Fig.10.2.Circuit diagram no load tests on 3 phase IM
5. Methodology
No-load Test
Turn the variac handle to zero voltage position, switch on the mains and gradually raise the
variac voltage to start the motor. Set the variac handle to a position so as to feed this motor at
rated three-phase voltage.
Readings
Input voltage (line), VL =
Input current (line), IOL =
Wattmeter reading, W =
Input power, POT = Iron loss + Windage and friction loss = (3×W) =
All calculations are done on per phase basis.

- 17 -
Input voltage (phase), V0 =
Input current (phase), I0 =
Input power (phase), P0 =
Blocked Rotor Test
The shaft is held tight so that the rotor is prevented from rotating. With variac in zero
position, switch on the mains. Gradually raise the voltage till the motor current reaches full-load
value.
Readings
Input voltage (line), VBRL =
Input current (line), IBRL =
Wattmeter reading, W =
Input power, PBRT = copper losses = (3×W) =
All calculations are done on per phase basis.
Input voltage (phase), VBR =
Input current (phase), IBR =
Input power (phase) PBR =
Measurement of stator resistance
Apply a DC source across two terminals of motor (stator) and read values of voltage and
current.In case of a star-connected machine, anyone of the line terminal and the neutral terminal
can be used.But for delta connected machine, the resistance thus measured is a combination of r
(resistance per phase of delta winding) and 2r connected in parallel. The value of r can now be
calculated.

- 18 -
Average value of stator DC resistance (per phase), R1 =
6. Calculations
=
=
0
00 I
VZ
=
=
20
00
I
PR
( ) =−= 20
200 RZX
( ) =−= 10 XXX m (X1 is to be obtained from B.R. test)
Rotational losses of the induction motor, ( ) =−= 1200 3 RIPPr
=
=
BR
BRBR I
VZ
=
=
2BR
BRBR I
PR
( ) =−= 22BRBRBR RZX
=+= '21 XXX BR
=
==2
'21
BRXXX (Assumption)
( ) =
+−=
2'2
1'2
m
mBR X
XXRRR
Draw the circuit model indicating the values of the parameters calculated above.
Induction Motor performance can be computed by the following methods:
(a) From equivalent circuit
(b) From circle diagram.
(a) Determination of performance characteristics from equivalent circuit:
Determine the following.
Rated voltage (phase), V =
=+ '21 XX

- 19 -
=+ '21 RR
Load resistance, ( )
=
−=
s
sRRL
1'2
Synchronous speed, ns = r.p.m.;
ωs = rad/s.
No-load current (phase), =∠= 000 ϕII
Table 10.1
Slip, s = 0.0 0.01 0.02 0.04 0.06 0.08 0.1 0.3 0.5 0.7 0.85 1.0
RL =
=
+
s
RR
'2
1
( )=
+
+
+=
'21
21'
2
'
XXj
s
RR
Z
=∠
= 2'
2
'2 ϕ
Z
VI
=∠+= ϕ'20 III L
== ϕcosLin VIP
Efficiency,
=
=
inP
P0η
Power factor, cos θ =
Torque,
=s
sRI
Tω
'2
'2

- 20 -
(b) Predetermination of performance characteristics from circle diagram:
Determine the following.
No-load current per phase, =∠ 00 ϕI
From B.R. test,
Rated voltage line
IBRL (at rated voltage) = IBRL ------------------------ =
VBRL
Input current, IBR (phase) =
=
= −
BRLBRL
BRTBR
IV
P
3cos 1ϕ
Draw the circuit diagram as shown in Fig.10.3 to scale on a graph sheet, according to be
procedure given below and hence complete Table.10.2.
Current scale: 1cm = I A
Power scale: 1cm = VI W
Torque scale: 1cm =
s
VI
ω N-m
1. Draw =∠= 00' ϕIOO
2. Draw == BRIOK (at ϕBR)
3. Join O′K. This is output line.
4. Draw KH and step off 12 RIFG BR=
5. Join O′F. This is Torque line.
6. Draw the perpendicular bisector to O′K to meet O′G at L.
7. With L as center and L0 (or LK) as radius, draw the circle.
This completes the construction.

- 21 -
Fig. 10.3
Take any point A on the circle; draw ABCDE as shown and join ∠VOA = ϕ; OA = I;
AB = Output; AE = Input;
BC = Rotor copper loss; CD = Stator copper loss; AC = Rotor input; DE= Constant
loss; Torque =
s
AC
ω; Slip =
AC
BC; Efficiency =
AE
AB;
Take convenient number of points between O′ and K on the circle and complete the
Table 10.2.
Table 10.2
Output
Input
Rotor input
Rotor copper loss
Slip
Efficiency

- 22 -
Line current
Power factor
Torque
7. Graphs:
Draw the complete performance characteristics for both equivalent circuit method and circle
diagram method.
8. Results:
Complete performance characteristics of the given three-phase IM are as shown in graphs.

- 23 -
EXPERIMENT No. 9
LOAD TEST ON SYNCHRONOUS MACHINE
Name____________________________________________ ID No._______________________
Sec.No _______________________ Batch No._____________ Marks obtained_____________
Date__________________________ Instructor’s signature______________________________
---------------------------------------------------------------------------------------------------------------------
1. Objective
1. To start and synchronize the synchronous machine (SM) to the bus-bars.
2. To conduct load test on the SM as a motor.
3. To conduct load test on the SM as a generator.
2. Name plate ratings:
…………………………………………………………………………………………………
…………………………………………………………………………………………………
3. Range of instruments and accessories (standard format)
S.No. DESCRIPTION TYPE RANGE MFR. NAME MFR. NO.
- 24 -
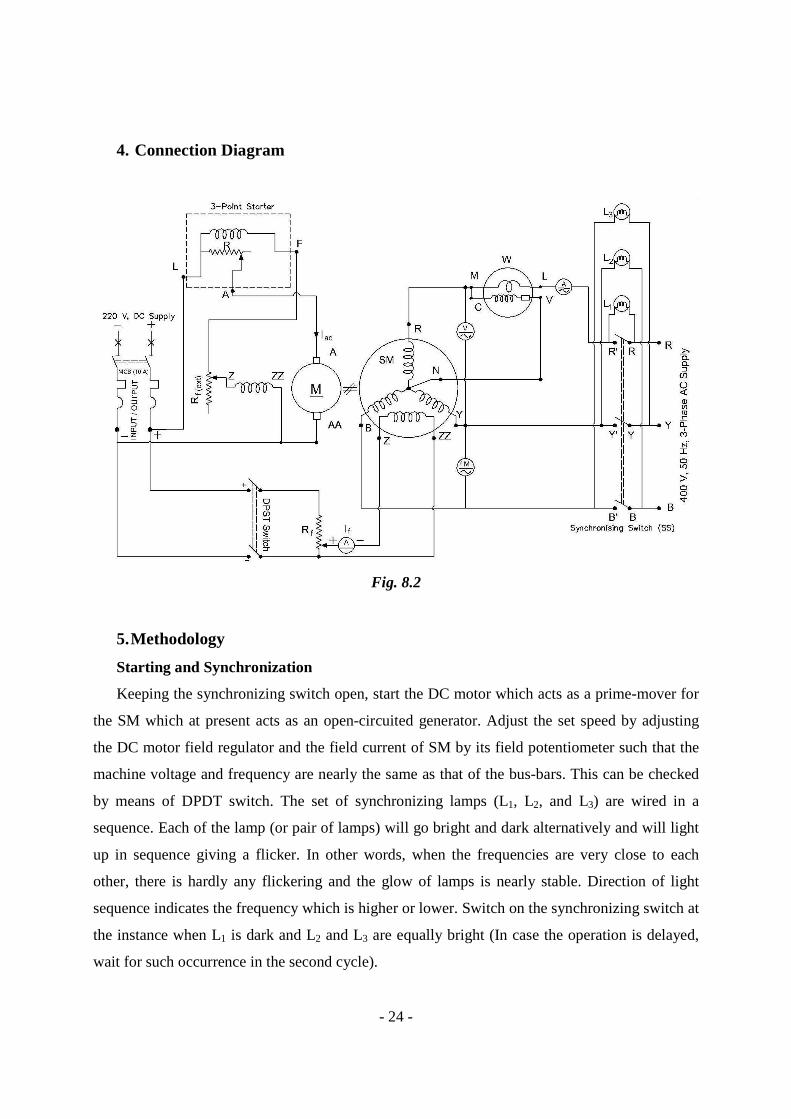
4. Connection Diagram
Fig. 8.2
5. Methodology
Starting and Synchronization
Keeping the synchronizing switch open, start the DC motor which acts as a prime-mover for
the SM which at present acts as an open-circuited generator. Adjust the set speed by adjusting
the DC motor field regulator and the field current of SM by its field potentiometer such that the
machine voltage and frequency are nearly the same as that of the bus-bars. This can be checked
by means of DPDT switch. The set of synchronizing lamps (L1, L2, and L3) are wired in a
sequence. Each of the lamp (or pair of lamps) will go bright and dark alternatively and will light
up in sequence giving a flicker. In other words, when the frequencies are very close to each
other, there is hardly any flickering and the glow of lamps is nearly stable. Direction of light
sequence indicates the frequency which is higher or lower. Switch on the synchronizing switch at
the instance when L1 is dark and L2 and L3 are equally bright (In case the operation is delayed,
wait for such occurrence in the second cycle).

- 25 -
The SM is now synchronized to the bus-bars and is in a floating state.
A. Load Test on Synchronous Generator
1. The machine is floating on the mains.
2. Decrease the field excitation of the DC machine. The field current decreases and
correspondingly the speed should increase. But as the machine is synchronized to the
bus-bars, its speed can’t change. So Eg decreases, resulting in more power being
drawn from the mains. Therefore, mechanical power being supplied to the SM
increases which then act as a generating machine, feeding power to the bus-bars.
3. Gradually reduce the SM field current by increasing its regulating resistance. The SM
armature current will pass through a minimum value (at unity pf) and then begin to
increase. Do not permit it to exceed 4.0 A and take readings indicated below.
4. Decrease the field excitation of the DC machine further. Keeping the input to the DC
motor constant at the new value, repeat step 3. Record the readings in Tables.
B. Load Test on Synchronous Motor
Disconnect the DC machine from the mains. The SM is now acting as a motor, while the
DC machine is acting as a generator. Connect the resistance load to the generator armature
terminals and load it up. The power drawn by the SM from the AC mains correspondingly
increases.
Conduct experiments in the following sequence of steps.
1. Adjust the load current of the DC generator to about 10A at a terminal voltage of
220V.
2. Cut out the regulating resistance in the SM field, keeping a watch on the SM armature
current (it should not exceed 4.0 A).
3. Gradually reduce the SM field current by increasing its regulating resistance. The SM
armature current will pass through a minimum value (at unity pf) and then begin to
increase. Do not permit it to exceed 4.0 A and take readings as indicated below.
4. Adjust the load on the DC generator to the next higher level and repeat step 3. Record
the readings in Tables.

- 26 -
6. Calculations
SET: 1
DC Motor
V =
Ia =
Pout =
Synchronous Generator
I f (A)
I g (A)
Pin (kW)
pf
SET: 2
DC Generator
V =
Ia =
Pout =
Synchronous Motor
I f (A)
I g (A)
Pin (kW)
Pf

- 27 -
7. Graphs to be drawn
(a) V-curve, Ia vs. If at a particular load.
(b) Inverted V-curve, pf vs. If at a particular load.
8. Results
V-curves and inverted V-curves of the given SM are as shown in graph.