ELECTRICAL INSULATION FOR AC ROTATING MACHINES DV... · issn 2167-3594 neta world journal print...
7
ISSN 2167-3594 NETA WORLD JOURNAL PRINT ISSN 2167-3586 NETA WORLD JOURNAL ONLINE SPRING2018 WHAT IS IT? HOW IS IT CHOSEN? WHY DOES IT FAIL? ELECTRICAL INSULATION FOR AC ROTATING MACHINES: POWERTEST NEW PRODUCT FORUM PAGE 120
Transcript of ELECTRICAL INSULATION FOR AC ROTATING MACHINES DV... · issn 2167-3594 neta world journal print...

ISSN 2167-3594 NETA WORLD JOURNAL PRINTISSN 2167-3586 NETA WORLD JOURNAL ONLINE
SPRIN
G20
13SPRIN
G20
18
WHAT IS IT?
HOW IS IT CHOSEN?
WHY DOES IT FAIL?
ELECTRICAL INSULATION FOR AC ROTATING MACHINES:
POWERTEST NEW PRODUCT FORUM PAGE 120
2 • SPRING 2018 CONDITION ASSESSMENT OF THE INDUCTION MOTOR BASED ON VIBRATION AND CURRENT SIGNATURE ANALYSES
BY SRDJAN JOKIC AND SASA IKIC, DV Power
The early diagnosis of fault conditions in electrical machines is important for increasing the reliability of the machine drive systems. One noninvasive method for condition-based monitoring of electrical machines is vibration measurement. Motor vibration analysis can detect electrical or mechanical malfunctions on stator, rotor, and bearings as well as external sources of vibration. This article includes an overview of the detection techniques employed and discusses the vibration and current signature analysis of a squirrel cage induction motor.
Condition-based management is one of the asset management strategies based on the assessment of the actual equipment state. It can utilize numerous diagnostic and monitoring techniques to assess the state of the observed system. Considering that electrical rotating machines are essential elements of both power systems and industrial processes, great attention is paid to the process of their proper maintenance.
Basically, all motor condition diagnostic techniques or methods are divided into offline or online methods, depending on whether or not the observed equipment is energized. Observed individually, the methods are focused on identifying certain problems in mechanical or electrical terms, but they may, with some accuracy, detect another fault state as well. Vibration analysis is one online method that is often combined with other diagnostic tools.
CONDITION ASSESSMENT OF THEINDUCTION
MOTOR BASED ON VIBRATION AND
CURRENT SIGNATURE ANALYSES
FEATURE
NETAWORLD • 3CONDITION ASSESSMENT OF THE INDUCTION MOTOR BASED ON VIBRATION AND CURRENT SIGNATURE ANALYSES
It can also be part of a continuous monitoring system, especially for a functionally important object such as a power plant generator. In that application, if the operating vibration level becomes critical, an alarm is displayed; if severe, a shutdown is initiated.
The most commonly used monitoring systems in motor drive applications are:
• Insulation system analysis• Partial discharge monitoring• Rotor flux analysis• Motor current signature analysis• Acoustic emission detection• Vibration measurement• Temperature monitoring
This article is focused on condition-based assessment utilizing vibration measurement data analysis in combination with motor current signature analysis.
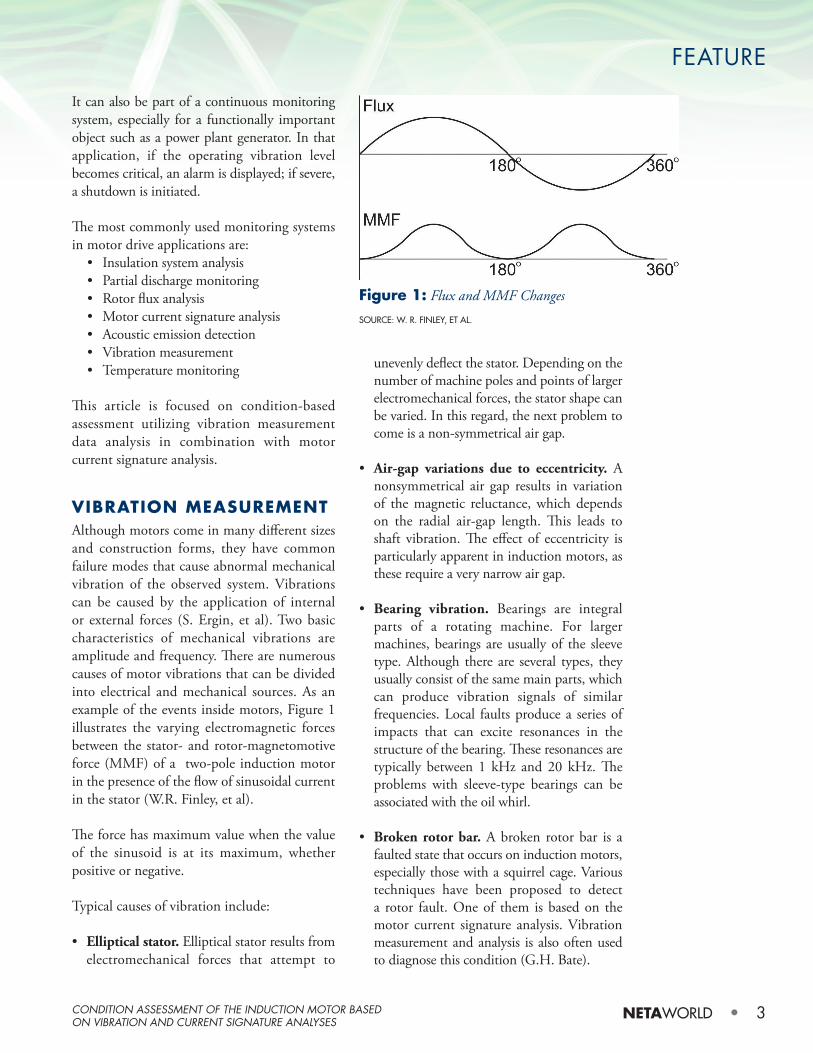
VIBRATION MEASUREMENTAlthough motors come in many different sizes and construction forms, they have common failure modes that cause abnormal mechanical vibration of the observed system. Vibrations can be caused by the application of internal or external forces (S. Ergin, et al). Two basic characteristics of mechanical vibrations are amplitude and frequency. There are numerous causes of motor vibrations that can be divided into electrical and mechanical sources. As an example of the events inside motors, Figure 1 illustrates the varying electromagnetic forces between the stator- and rotor-magnetomotive force (MMF) of a two-pole induction motor in the presence of the flow of sinusoidal current in the stator (W.R. Finley, et al).
The force has maximum value when the value of the sinusoid is at its maximum, whether positive or negative.
Typical causes of vibration include:
• Elliptical stator. Elliptical stator results from electromechanical forces that attempt to
unevenly deflect the stator. Depending on the number of machine poles and points of larger electromechanical forces, the stator shape can be varied. In this regard, the next problem to come is a non-symmetrical air gap.
• Air-gap variations due to eccentricity. A nonsymmetrical air gap results in variation of the magnetic reluctance, which depends on the radial air-gap length. This leads to shaft vibration. The effect of eccentricity is particularly apparent in induction motors, as these require a very narrow air gap.
• Bearing vibration. Bearings are integral parts of a rotating machine. For larger machines, bearings are usually of the sleeve type. Although there are several types, they usually consist of the same main parts, which can produce vibration signals of similar frequencies. Local faults produce a series of impacts that can excite resonances in the structure of the bearing. These resonances are typically between 1 kHz and 20 kHz. The problems with sleeve-type bearings can be associated with the oil whirl.
• Broken rotor bar. A broken rotor bar is a faulted state that occurs on induction motors, especially those with a squirrel cage. Various techniques have been proposed to detect a rotor fault. One of them is based on the motor current signature analysis. Vibration measurement and analysis is also often used to diagnose this condition (G.H. Bate).
FEATURE
Figure 1: Flux and MMF ChangesSOURCE: W. R. FINLEY, ET AL.
4 • SPRING 2018
• Rotor bar passing frequency vibration. High-frequency vibration appears in the motor stator when current is induced into rotor bars under load. In that process, the flow of electrical current creates a magnetic field around the bars. Based on this, an attractive force is created toward the stator. The magnitude of this vibration varies with load. These frequencies are much higher than the usual expected measured frequencies.
• Vibrations that occur due to imbalance. Due to errors in the alignment of the axis of inertia and the axis of rotation, there are often deflections of the bearing points. Depending on the amount of deviation, characteristic vibrations can occur (T. Bertolini, T. Fuchs).
THE CONDITION ASSESSMENTA proper machine condition assessment is based on qualitative data analysis. Analysis of the vibration signal consists of two steps: obtaining vibration data and then determining the characteristic signals that are present.
Some vibration anomalies may also occur on a healthy machine. Such problems can be detected in the narrow-band signatures. Identifying such anomalies often requires
expert knowledge. A trend of increasing signal changes is often an indication of the need for machine maintenance. A great aid in detecting faults can be signal comparison with data obtained from a machine of the same characteristics.
There are numerous techniques used in post-processing and analyzing the signal:
• Fast Fourier transform• Instantaneous power FFT• Demodulated current spectrum• Wavelet analysis• Orbital pattern analysis• Selective envelope detection• Cepstrum analysis• Modal analysis
Vibration analysis and the decision-making process are often based on techniques employing an artificial neural network and fuzzy logic.
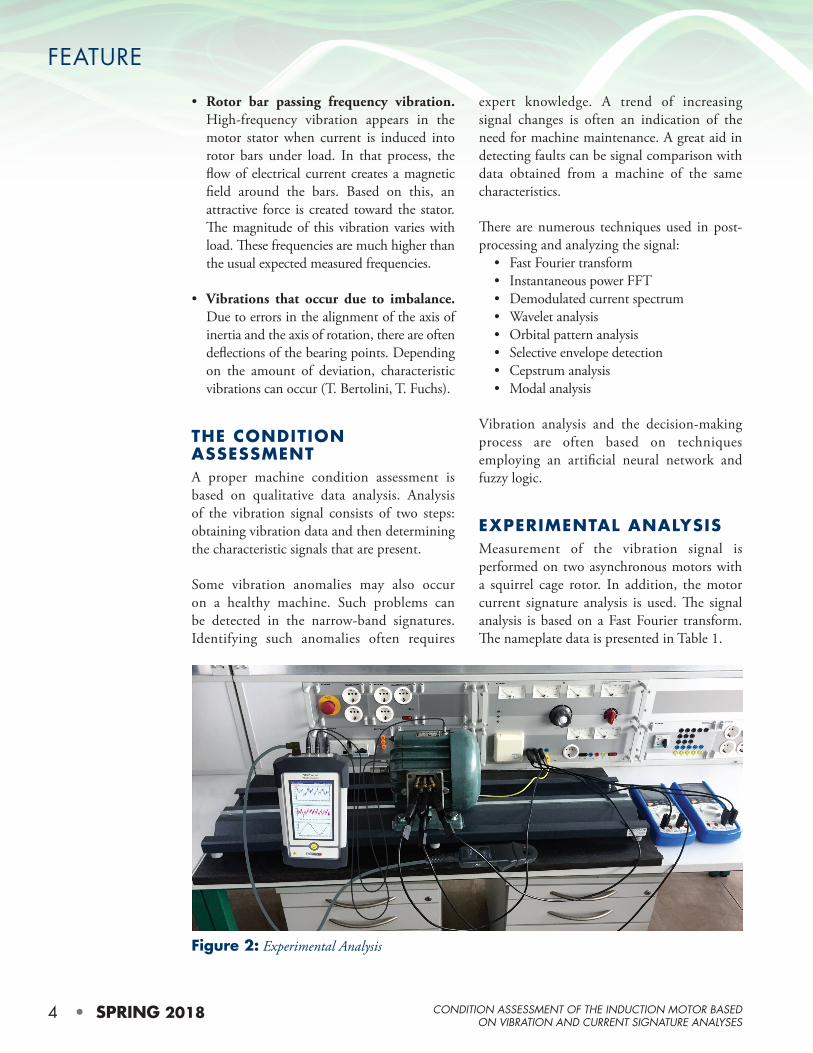
EXPERIMENTAL ANALYSISMeasurement of the vibration signal is performed on two asynchronous motors with a squirrel cage rotor. In addition, the motor current signature analysis is used. The signal analysis is based on a Fast Fourier transform. The nameplate data is presented in Table 1.
FEATURE
CONDITION ASSESSMENT OF THE INDUCTION MOTOR BASED ON VIBRATION AND CURRENT SIGNATURE ANALYSES
Figure 2: Experimental Analysis

NETAWORLD • 5
Table 1: Nameplate Data for the Observed Motors
Power [kW] 0.8
Current D/Y [A] 4/2.5
Voltage D/Y [V] 220/380
Rotation Speed [rpm] 1,350
Cos φ 0.76
Frequency [Hz] 50
The number of pole pairs of the motors is two. Although they have the same characteristics, the machines had been applied in different conditions, so their characteristics were different. The motors were tested while unloaded (Figure 2).
According to standard recommendations (IEEE Std 112-1984), the motors were placed on a flexible surface during testing to obtain measurements as accurately as possible, regardless of mounting conditions.
The scheme of the measuring and processing system is presented in Figure 3.
Vibration values were measured at several points on horizontal and vertical axes. At the same time, the line current was recorded. The sampling frequency was set to 10 kHz. Figure 4 shows the recorded vibrations for the two induction motors at the surface point that had the highest vibration values. This is a plot of the recorded signals as a function of time (y axis).
FEATURE
CONDITION ASSESSMENT OF THE INDUCTION MOTOR BASED ON VIBRATION AND CURRENT SIGNATURE ANALYSES
Figure 3: Motor with the Measurement System
Figure 4: Vibration Measurement versus Time (y Axis)
Figure 5: Vibration Amplitude Spectrum (y Axis)
The vibration amplitude spectrum for the machine with faulted state (motor 1) and machine with healthy state at that point (motor 2) is shown in Figure 5.
Figure 6 shows the part of the measured signal in the x axis (shaft side of the motor).
Figure 6: Vibration Measurement versus Time (x Axis)

6 • SPRING 2018
fundamental component. The motor faulted state is often the result of a combination of electrical and mechanical problems, so the signal can be affected by components resulting from the motor speed and the fundamental frequency. The local fault inside the machine leads to resonant appearances on the bearing and motor housing, which are, in this specific case, visible at frequencies of 1,000 Hz, 3,500 Hz, and 4,500 Hz. The frequency range of interest in motor current signature analysis is typically 0–5 kHz (E.L. Bonaldi, et al). According to the Nyquist Theorem, the sampling frequency of the transducers used should be at least 10 kHz.
It is important to recognize individual signal components. As an example of static eccentricity, sideband components appear at frequencies determined by this equation (D. Miljkovic and M.T. Thomson, et al):
where:
fec - eccentricity frequencyfg - electrical supply frequencyR - the number of rotor barss - slip of induction motorp - number of pole-pairsnd = ±1nws = 1,3,5,7…
While bearing faults are difficult to detect, for most bearings, faults are recognized by equations:
The current amplitude spectrum of motor-1 and motor-2 are shown in Figure 9. In this specific case, recording and analyzing the spectrum revealed a significant difference at a frequency range of around 3,000 Hz.
CONDITION ASSESSMENT OF THE INDUCTION MOTOR BASED ON VIBRATION AND CURRENT SIGNATURE ANALYSES
FEATURE
Figure 8: Damage on the Rotor Cage
Figure 7: Vibration Amplitude Spectrum
The amplitude spectrum in the x axis is shown in Figure 7.
It can be seen that the vibration level is higher for one of the observed motors. Also, there is a noticeable noise increase for this machine. Analysis of the signals in each axis shows that the gain of individual components is different. Specifically, the occurrence of various faults has different impacts on vibration in the x and y axes.
By disassembling the motor with the higher vibration level, the eccentricity of the rotor shaft was observed due to a bearing fault on one side of the machine. At the same time, changes in the squirrel cage were caused by contact and friction of the rotor with the stator teeth (Figure 8).
It is interesting that there are signals around the network frequency with a considerable number of harmonics and subharmonics of the

NETAWORLD • 7CONDITION ASSESSMENT OF THE INDUCTION MOTOR BASED ON VIBRATION AND CURRENT SIGNATURE ANALYSES
The sideband signal components are more predominant for one of the machines, a clear indicator that the motor is in a faulted state.
CONCLUSIONInduction motors play a significant role in industrial processes and other applications, so an assessment of their condition is an important segment of asset management. The condition-based assessment is based on several techniques. One of them, vibration measurement analysis, is an important noninvasive technique. Vibration analysis involves two segments: data acquisition and data analysis. The analysis is often based on transformation to the frequency domain and the use of various tools for recognition of characteristic vibration signals. Combination of the vibration data analysis with the motor current signature analysis provides significant improvements to faulted state detection.
The experimental analysis presented here is an example of condition state assessment for the induction motor. By recognizing the characteristic components of the vibration signal and performing a motor current signature analysis, the mechanical changes were determined to be due to static eccentricity and a bearing fault.
REFERENCESS. Ergin, A. Uzuntas, M.B. Gulmezoglu,
“Detection of Stator, Bearing and Rotor Faults in Induction Motors,” International Conference on Communication Technology and System Design, pp 1103–1109, 2011.
W. R. Finley, M. M. Hodowanec, W. G. Holter, “An Analytical Approach to Solving Motor Vibration Problems,” IEEE Transactions on Industry Applications, vol. 36, Issue 5, Sept/Oct 2000, pp. 1467–1480.
G. H. Bate, “Vibration Diagnostics for Industrial Electric Motor Drives,” Bruiel & Kjaer, Application Note, 026 –12, pp. 1–12.
T. Bertolini, T. Fuchs, “Vibrations and Noises in Small Electric Motors,” 2012, pp. 58–81.
IEEE Std. 112-1984, Standard Test Procedure for Polyphase Induction Motors and Generators.
E. L. Bonaldi, L. E. de Lacerda de Oliveira, J. G. B. da Silva, G. Lambert-Torresm, L. E. Borges da Silva, “Induction Motors — Modelling and Control,” InTech, 2012, pp. 487–520.
D. Miljkovic, “Brief Review of Motor Current Signature Analysis,” pp. 1–12.
M. T. Thomson, R. J. Gilmore, “Motor Current Signature Analysis to Detect Faults in Induction Motor Drives — Fundamentals, Data Interpretation and Industrial Case Histories,” Proceedings of the 30-Seconds Turbomachinery Symposium, Texas, 2003, pp. 145–156.
Srdjan Jokic has been cooperating with DV Power in the field of transformers and rotating electrical machines since 2006. He holds a BS and an MS in electrical engineering from the University of East Sarajevo. Srdjan has been a Teaching Assistant and Senior Teaching Assistant at the Faculty of Electrical Engineering,
University of East Sarajevo, since 2008.
Sasa Ikic is an Engineer in the hardware development and research department at DV-Power. He holds a BS in electrical engineering from the University of East Sarajevo. His interests include the development of circuit breaker testing equipment.
FEATURE
Figure 9: Current Amplitude Spectrum at Specific Frequencies