Electrical Cable Test Results and Analysis During Fire ...o Provides fire-induced cable failures...
221
Electrical Cable Test Results and Analysis During Fire Exposure (ELECTRA-FIRE) A Consolidation of Three Major Fire-Induced Circuit and Cable Failure Experiments Performed Between 2001 and 2011 Final Report Office of Nuclear Regulatory Research NUREG-2128
Transcript of Electrical Cable Test Results and Analysis During Fire ...o Provides fire-induced cable failures...

Electrical Cable Test Results and Analysis During Fire Exposure (ELECTRA-FIRE) A Consolidation of Three Major Fire-Induced Circuit and Cable Failure Experiments Performed Between 2001 and 2011 Final Report
Office of Nuclear Regulatory Research
NUREG-2128

NRC Reference Material
As of November 1999, you may electronically access NUREG-series publications and other NRC records at NRC’s Public Electronic Reading Room at http://www.nrc.gov/reading-rm.html. Publicly released records include, to name a few, NUREG-series publications; Federal Register notices; applicant, licensee, and vendor documents and correspondence; NRC correspondence and internal memoranda; bulletins and information notices; inspection and investigative reports; licensee event reports; and Commission papers and their attachments.
NRC publications in the NUREG series, NRC regulations, and Title 10, “Energy,” in the Code of Federal Regulations may also be purchased from one of these two sources. 1. The Superintendent of Documents
U.S. Government Printing Office Mail Stop SSOP Washington, DC 20402–0001 Internet: bookstore.gpo.gov Telephone: 202-512-1800 Fax: 202-512-2250
2. The National Technical Information Service Springfield, VA 22161–0002 www.ntis.gov 1–800–553–6847 or, locally, 703–605–6000
A single copy of each NRC draft report for comment is available free, to the extent of supply, upon written request as follows: Address: U.S. Nuclear Regulatory Commission
Office of Administration Publications Branch Washington, DC 20555-0001
E-mail: [email protected] Facsimile: 301–415–2289
Some publications in the NUREG series that are posted at NRC’s Web site address http://www.nrc.gov/reading-rm/doc-collections/nuregs are updated periodically and may differ from the last printed version. Although references to material found on a Web site bear the date the material was accessed, the material available on the date cited may subsequently be removed from the site.
Non-NRC Reference Material
Documents available from public and special technical libraries include all open literature items, such as books, journal articles, transactions, Federal Register notices, Federal and State legislation, and congressional reports. Such documents as theses, dissertations, foreign reports and translations, and non-NRC conference proceedings may be purchased from their sponsoring organization.
Copies of industry codes and standards used in a substantive manner in the NRC regulatory process are maintained at—
The NRC Technical Library Two White Flint North 11545 Rockville Pike Rockville, MD 20852–2738
These standards are available in the library for reference use by the public. Codes and standards are usually copyrighted and may be purchased from the originating organization or, if they are American National Standards, from—
American National Standards Institute 11 West 42nd Street New York, NY 10036–8002 www.ansi.org 212–642–4900
AVAILABILITY OF REFERENCE MATERIALS IN NRC PUBLICATIONS
Legally binding regulatory requirements are stated only in laws; NRC regulations; licenses, including technical specifications; or orders, not in NUREG-series publications. The views expressed in contractor-prepared publications in this series are not necessarily those of the NRC. The NUREG series comprises (1) technical and administrative reports and books prepared by the staff (NUREG–XXXX) or agency contractors (NUREG/CR–XXXX), (2) proceedings of conferences (NUREG/CP–XXXX), (3) reports resulting from international agreements (NUREG/IA–XXXX), (4) brochures (NUREG/BR–XXXX), and (5) compilations of legal decisions and orders of the Commission and Atomic and Safety Licensing Boards and of Directors’ decisions under Section 2.206 of NRC’s regulations (NUREG–0750). DISCLAIMER: This report was prepared as an account of work sponsored by an agency of the U.S. Government. Neither the U.S. Government nor any agency thereof, nor any employee, makes any warranty, expressed or implied, or assumes any legal liability or responsibility for any third party’s use, or the results of such use, of any information, apparatus, product, or process disclosed in this publication, or represents that its use by such third party would not infringe privately owned rights.

Electrical Cable Test Results and Analysis During Fire Exposure (ELECTRA-FIRE) A Consolidation of Three Major Fire-Induced Circuit and Cable Failure Experiments Performed Between 2001 and 2011 Final Report Manuscript Completed: February 2013 Date Published: September 2013 Prepared by: G. Taylor1, N. Melly1, H. Woods1, and T. Pennywell1 T. Olivier2 and C. Lopez2 1NRC, Office of Nuclear Regulatory Research 2Sandia National Laboratories Office of Nuclear Regulatory Research
NUREG-2128


iii
ABSTRACT Over the past 10 years, there have been three major test programs exploring realistic electrical functionality of electrical cables under fire conditions. The three programs were:
- The Electric Power Research Institute (EPRI) and the Nuclear Energy Institute (NEI), 2002
o Research and test efforts undertaken jointly by EPRI and NEI to investigate, characterize, and quantify fire-induced circuit failures.
- NRC Cable Response to Live Fire (CAROLFIRE), 2008 o CAROLFIRE was started at the end of the NEI/EPRI test program. It provides an
experimental basis for resolving five of the six items identified as “Bin 2” circuit configurations in Regulatory Issue Summary (RIS) 2004-003, “Risk-Informed Approach for Post-Fire Safe-Shutdown Circuit Inspections.”
o Improved fire modeling tools for the prediction of cable damage under fire conditions.
- NRC Direct Current Electrical Shorting in Response to Exposure Fire (DESIREE-FIRE), 2012
o Provides fire-induced cable failures modes and effects data for dc-powered control circuits.
Corresponding EPRI and U.S. Nuclear Regulatory Commission (NRC) technical reports document the test results; however, only the EPRI tests provided an evaluation of various parameters affecting the likelihood of cable failure modes. However, these evaluations were based on a limited set of test data (18 tests). Since then, NRC-sponsored testing has added several hundred data points on the electrical failure characteristics of electrical cable exposure to intense thermal conditions. Evaluating these and other parameters using all available test data would improve understanding of the effects of various parameters on cable failure modes. During an electrical expert Phenomena Identification and Ranking Table (PIRT) meeting in 2011, it became apparent that having individual experts independently analyze the three data sets to derive conclusions to support the PIRT was inefficient and impractical. Thus, the NRC, with support from EPRI and Sandia National Laboratories (SNL), began a project to analyze and catalogue the whole experimental data set to allow the PIRT panel members to make responsible technical decisions. This report documents the background work that was done to analyze the data sets and provides the results in tabular and graphical formats. The authors did not attempt to remove outliers or perform other probabilistic methods to arrive at the conclusions in this report. The objective of this report is to present the data in a factual and coherent format to allow the PIRT panel members to make their best informed decisions.


v
TABLE OF CONTENTS Section Page ABSTRACT .............................................................................................................................. iii TABLE OF CONTENTS ................................................................................................................ v LIST OF FIGURES ...................................................................................................................... vii LIST OF TABLES ......................................................................................................................... xi EXECUTIVE SUMMARY ............................................................................................................ xv ACKNOWLEDGEMENTS ........................................................................................................... xix ACRONYMS AND ABBREVIATIONS ......................................................................................... xxi 1. INTRODUCTION ................................................................................................ 1-1
1.1 Background ........................................................................................................ 1-1 1.2 Objective ............................................................................................................ 1-3 1.3 The Approach ..................................................................................................... 1-3 1.4 Report Organization ........................................................................................... 1-8
2. INTRA-CABLE – ALTERNATING CURRENT CIRCUITS .................................. 2-1
2.1 AC Data Analysis Approach ............................................................................... 2-1 2.2 Conductor Count ................................................................................................ 2-5 2.3 Thermal Exposure Conditions ............................................................................ 2-6 2.4 Cable Orientation ............................................................................................... 2-9 2.5 Raceway Routing ............................................................................................. 2-11 2.6 Raceway Fill ..................................................................................................... 2-13 2.7 Insulation Type ................................................................................................. 2-15 2.8 Insulation Material ............................................................................................ 2-17 2.9 Insulation-Jacket Type Combinations............................................................... 2-19 2.10 CPT Size .......................................................................................................... 2-21 2.11 Circuit Grounding ............................................................................................. 2-23 2.12 Wiring Configuration ......................................................................................... 2-25 2.13 Conductor Size ................................................................................................. 2-26 2.14 Water Based Fire Suppression Effects on AC Circuit Failures ......................... 2-28 2.15 AC Circuit Concurrence of Hot Short-Induced Spurious Operations ................ 2-31
3. INTER-CABLE – ALTERNATING CURRENT CIRCUITS .................................. 3-1 4. INTRA-CABLE – DIRECT CURRENT CIRCUITS .............................................. 4-1
4.1 DC Data Analysis Approach ............................................................................... 4-1 4.2 Conductor Count .............................................................................................. 4-13 4.3 Thermal Exposure Conditions .......................................................................... 4-14 4.4 Raceway Routing ............................................................................................. 4-16 4.5 Cable Orientation ............................................................................................. 4-18 4.6 Raceway Fill ..................................................................................................... 4-18 4.7 Insulation Type ................................................................................................. 4-23 4.8 Insulation Material ............................................................................................ 4-24 4.9 Insulation-Jacket Type Combinations............................................................... 4-26 4.10 Wiring Configuration ......................................................................................... 4-28 4.11 Conductor Size ................................................................................................. 4-30 4.12 Circuit Type ...................................................................................................... 4-32

vi
Section Page
4.13 Fuse Size ......................................................................................................... 4-34 4.14 Cable Shielding ................................................................................................ 4-35 4.15 DC Concurrence of Hot Short-Induced Spurious Operations ........................... 4-37
5. INTER-CABLE DIRECT CURRENT CIRCUITS ................................................. 5-1
5.1 Traditional Inter-Cable Failure Analysis for DESIREE-FIRE Results ................. 5-1 5.2 Penlight Tests – Ground Fault Equivalent Hot Short .......................................... 5-5 5.3 Intermediate-Scale Tests – Ground Fault Equivalent Hot Short ......................... 5-6
6. SUMMARY OF FINDINGS ................................................................................. 6-1
6.1 Alternating Current Test Results (NEI/EPRI, CAROLFIRE, DESIREE-FIRE) .... 6-1 6.2 Direct Current Test Results (DESIREE-FIRE) .................................................... 6-3 6.3 Ground Equivalent Hot Shorts ............................................................................ 6-3
7. CONCLUSIONS AND FUTURE RESEARCH RECOMMENDATIONS .............. 7-1 8. REFERENCES ................................................................................................... 8-1 APPENDIX A: Penlight Ground Fault Equivalent Inter-Cable Failure Mode Evaluation ........... A-1 APPENDIX B: Supplemental Information for the CAROLFIRE Reports, Including Additional
Data Retrieval .................................................................................................... B-1

vii
LIST OF FIGURES Figure Page 1-1 Examples global approach failure mode column plot ............................................... 1-6 1-2 Box and whisker plot example .................................................................................. 1-6 2-1 CAROLFIRE AC MOV circuit ................................................................................... 2-3 2-2 Conductor count column plot, global approach, AC tests ........................................ 2-5 2-3 Conductor count box plot, duration, AC tests ........................................................... 2-6 2-4 Intermediate-scale cable raceway location .............................................................. 2-7 2-5 Thermal exposure conditions column plot, global approach, AC tests ..................... 2-8 2-6 Thermal exposure conditions box plot, duration, AC tests ....................................... 2-9 2-7 Cable orientation column plot, global approach, AC tests ...................................... 2-10 2-8 Cable orientation box plot, duration, AC tests ........................................................ 2-11 2-9 Raceway routing column plot, global approach, AC tests ...................................... 2-12 2-10 Raceway routing box plot, duration, AC tests ........................................................ 2-13 2-11 Cable bundle arrangements (3-, 4-, 6-, & 12-cable bundles) ................................. 2-13 2-12 Cable tray fill intermediate ...................................................................................... 2-13 2-13 Single layer cable fill ............................................................................................... 2-14 2-14 Raceway fill column plot, global approach, AC tests .............................................. 2-14 2-15 Raceway fill box plot, duration, AC tests ................................................................ 2-15 2-16 Insulation type column plot, global approach, AC tests .......................................... 2-16 2-17 Insulation type box plot, duration, AC tests ............................................................ 2-17 2-18 Insulation material column plot, global approach, AC tests .................................... 2-18 2-19 Insulation material box plot, duration, AC tests ...................................................... 2-19 2-20 Insulation-jacket type column plot, global approach, AC tests ............................... 2-20 2-21 Insulation-jacket type box plot, duration, AC tests ................................................. 2-21 2-22 CPT size column plot, global approach, AC tests .................................................. 2-22 2-23 CPT size box plot, duration, AC tests ..................................................................... 2-23 2-24 Circuit grounding column plot, global approach, AC tests ...................................... 2-24 2-25 Circuit grounding box plot, duration, AC tests ........................................................ 2-24 2-26 Wiring configuration column plot, global approach, AC tests ................................. 2-25 2-27 Wiring configuration box plot, duration, AC tests ................................................... 2-26 2-28 Conductor size column plot, global approach, AC tests ........................................ 2-27 2-29 Conductor size box plot, duration, AC tests ........................................................... 2-28 2-30 NEI/EPRI test 3 voltage plot - water spray ............................................................. 2-29 2-31 NEI/EPRI test 10 voltage response following water spray ..................................... 2-30 2-32 (a) CAROLFIRE and (b) DESIREE-FIRE intermediate-scale exposure
location designation .......................................................................................... 2-32 2-33 Concurrent hot shorts - Location A - 4 cables ........................................................ 2-33 2-34 Concurrent hot shorts - Location A - 2 cables ........................................................ 2-34 2-35 Concurrent hot shorts - upper hot gas layer - 4 cables .......................................... 2-35 3-1 NEI/EPRI inter-cable test tray fill .............................................................................. 3-1 3-2 CAROLFIRE inter-cable test tray fill ......................................................................... 3-2 3-3 NEI/EPRI cable configuration ................................................................................... 3-3

viii
Figure Page 4-1 Line drawing of the DC-SIM panel layout for a 1-inch coil circuit ............................. 4-2 4-2 Line drawing for the DC large coil circuit .................................................................. 4-4 4-3 Line drawing for DC MOV circuit .............................................................................. 4-6 4-4 Line drawing for DC SOV circuit ............................................................................... 4-7 4-5 Line drawing for DC SWGR 1 circuit ........................................................................ 4-9 4-6 Line drawing for DC SWGR 2 circuit ...................................................................... 4-10 4-7 Conductor count column plot, global approach, DC tests ...................................... 4-13 4-8 Conductor count box plot, duration, DC tests ......................................................... 4-14 4-9 Thermal exposure conditions column plot, global approach, DC tests .................. 4-15 4-10 Thermal exposure conditions box plot, duration, DC tests ..................................... 4-16 4-11 Raceway routing column plot, global approach, DC tests ...................................... 4-17 4-12 Raceway routing box plot, duration, DC tests ........................................................ 4-17 4-13 Circuit cable orientation within the cable trays for single fill ................................... 4-18 4-14 Circuit cable orientation for filled trays ................................................................... 4-19 4-15 Circuit cable orientation for partitioned trays .......................................................... 4-20 4-16 Circuit cable orientation for specialized trays ......................................................... 4-21 4-17 Raceway fill column plot, global approach, DC tests ............................................. 4-21 4-18 Raceway fill box plot, duration, DC tests ................................................................ 4-22 4-19 Insulation type column plot, global approach, DC tests ......................................... 4-23 4-20 Insulation type box plot, duration, DC tests ............................................................ 4-24 4-21 Insulation material column plot, global approach, DC tests ................................... 4-25 4-22 Insulation material box plot, duration, DC tests ...................................................... 4-26 4-23 Insulation-jacket type column plot, global approach, DC tests ............................... 4-27 4-24 Insulation-jacket type box plot, duration, DC tests ................................................. 4-28 4-25 Wiring configuration column plot, global approach, DC tests ................................. 4-29 4-26 Wiring configuration box plot, duration, DC tests ................................................... 4-30 4-27 Conductor size column plot, global approach, DC tests ......................................... 4-31 4-28 Conductor size box plot, duration, DC tests ........................................................... 4-31 4-29 Circuit type column plot, global approach, DC tests ............................................... 4-32 4-30 Circuit type box plot, duration, DC tests ................................................................. 4-33 4-31 Fuse size column plot, global approach, DC tests ................................................. 4-34 4-32 Fuse size box plot, duration, DC tests .................................................................... 4-35 4-33 Cable shielding column plot, global approach, DC tests ........................................ 4-36 4-34 Cable shielding box plot, duration, DC tests .......................................................... 4-37 4-35 Time plot of concurrent hot shorts for DESIREE-FIRE
intermediate-scale test 5 .................................................................................. 4-39 4-36 Plot of intermediate-scale test 5 for MOV and SOV cable locations ...................... 4-39 4-37 Concurrent hot shorts - test 6 ................................................................................. 4-40 4-38 Plot of intermediate-scale test 6 for 1-inch valve and switchgear cable
locations ........................................................................................................... 4-41 4-39 Concurrent hot shorts - test 8 ................................................................................. 4-42 4-40 Concurrent hot shorts - test 9 ................................................................................. 4-43 4-41 Time plot of concurrent spurious operations for DESIREE-FIRE among all test
circuits in Location A ........................................................................................ 4-44 4-42 Time plot of concurrent spurious operations for DESIREE-FIRE among all test
circuits in Location D ........................................................................................ 4-46

ix
Figure Page 4-43 Time plot of concurrent spurious operations for DESIREE-FIRE among
all Penlight test with exposure temperatures in the range of 325-375C......... 4-47 4-44 Time plot of concurrent spurious operations for DESIREE-FIRE among
all Penlight test with exposure temperatures in the range of 400-480C.......... 4-48 4-45 Time plot of concurrent spurious operations for DESIREE-FIRE among
all Penlight test with exposure temperatures in the range of 500-525C.......... 4-50 5-1 DESIREE-FIRE inter-cable configuration ................................................................. 5-1 5-2 DESIREE-FIRE inter-cable test results penlight test 47 ........................................... 5-2 5-3 DC MOV schematic showing current summation used in identifying
inter-cable shorting behavior .............................................................................. 5-4 5-4 Penlight cable tray typical loading, showing two electrically instrumented
cables and a thermal response (temperature recording) cable located in the center. .......................................................................................................... 5-5
5-5 Intermediate-scale test preliminary 1 cable loading configuration ............................ 5-7 5-6 Intermediate-scale test preliminary 2 cable loading configuration ............................ 5-8 5-7 Intermediate-scale test preliminary 2 – inter-cable shorting between
SOV-2 and MOV-2 ............................................................................................. 5-9 5-8 Intermediate-scale test 1 cable loading configuration ............................................ 5-10 5-9 Outstanding current hot shorting for intermediate-scale test 1 between
1-inch valve, large coil, and MOV-1 circuits ..................................................... 5-11 5-10 Intermediate-scale test 2 cable loading .................................................................. 5-12 5-11 Outstanding current shorting in intermediate-scale test 2, between
SOV-2 and MOV-2 ........................................................................................... 5-13 5-12 Intermediate-scale test 3 cable loading .................................................................. 5-14 5-13 Outstanding current shorting in intermediate-scale test 3,between
SOV-2 and SWGR-T ........................................................................................ 5-15 5-14 Outstanding current shorting in intermediate-scale test 3, between
1 inch valve and SWGR-T ................................................................................ 5-15 5-15 Intermediate-scale test 4 cable loading .................................................................. 5-16 5-16 Intermediate-scale test 5 cable loading .................................................................. 5-17 5-17 Outstanding current shorting in intermediate-scale test 5, between
SOV-1 and SWGR-T ........................................................................................ 5-18 5-18 Intermediate-scale test 6 cable loading .................................................................. 5-19 5-19 Intermediate-scale test 7 cable loading .................................................................. 5-20 5-20 Intermediate-scale test 8 cable loading .................................................................. 5-21 5-21 Outstanding current shorting in intermediate-scale test 8, between
MOV-1 and Lg Coil ........................................................................................... 5-22 5-22 Intermediate-scale test 9 cable loading .................................................................. 5-23 5-23 Intermediate-scale test 10 cable loading ................................................................ 5-24 5-24 Intermediate-scale test 11 cable loading ................................................................ 5-25 5-25 Intermediate-scale test 11 current summation ....................................................... 5-26 5-26 Intermediate-scale test 12 cable loading ................................................................ 5-27 5-27 Intermediate-scale test 12 current summation plot ................................................ 5-28 5-28 Ground fault detection voltage response for second large coil SO ........................ 5-30 5-29 Intermediate-scale test contingency A cable loading configuration ........................ 5-30


xi
LIST OF TABLES Table Page 1-1 Example of failure mode table .................................................................................. 1-5 2-1 AC threshold values used for MOV hot short & spurious operation
determinations .................................................................................................... 2-1 2-2 CAROLFIRE AC MOV circuit path configuration ...................................................... 2-3 2-3 Conductor count, global approach, AC tests ............................................................ 2-5 2-4 Conductor count, duration data, AC tests ................................................................ 2-6 2-5 Thermal exposure conditions, global approach, AC tests ........................................ 2-7 2-6 Thermal exposure conditions, duration data, AC tests ............................................. 2-8 2-7 Cable orientation, global approach, AC tests ........................................................... 2-9 2-8 Cable orientation, duration data, AC tests .............................................................. 2-10 2-9 Raceway routing, global approach, AC tests ......................................................... 2-11 2-10 Raceway routing, duration data, AC tests .............................................................. 2-12 2-11 Raceway fill, global approach, AC tests ................................................................. 2-14 2-12 Raceway fill, duration data, AC tests ...................................................................... 2-15 2-13 Breakdown of insulation material by type, AC tests ............................................... 2-16 2-14 Insulation type, global approach, AC tests ............................................................. 2-16 2-15 Insulation type, duration data, AC tests .................................................................. 2-16 2-16 Insulation material, global approach, AC tests ....................................................... 2-17 2-17 Insulation material, hot short only, duration data, AC tests .................................... 2-18 2-18 Insulation material spurious operation only, duration data, AC tests ..................... 2-19 2-19 Insulation-jacket type, global approach, AC tests .................................................. 2-20 2-20 Insulation-jacket type, duration data, AC tests ....................................................... 2-20 2-21 Test project CPT size ............................................................................................. 2-21 2-22 CPT size, global approach, AC tests ...................................................................... 2-22 2-23 CPT size, duration data, AC tests .......................................................................... 2-22 2-24 Circuit grounding, global approach, AC tests ......................................................... 2-23 2-25 Circuit grounding, duration data, AC tests .............................................................. 2-24 2-26 Wiring configurations .............................................................................................. 2-25 2-27 Wiring configuration, global approach, AC tests .................................................... 2-25 2-28 Wiring configuration, duration data, AC tests ......................................................... 2-26 2-29 Conductor size, global approach, AC tests ............................................................ 2-27 2-30 Conductor size, duration data, AC tests ................................................................. 2-27 2-31 Concurrent spurious operation durations – test location A (concurrence time
shown in seconds) .................................................................................................. 2-34 2-32 Concurrent spurious operations – upper hot gas layer .......................................... 2-36 3-1 NEI/EPRI inter-cable failure characteristics ............................................................. 3-3 3-2 CAROLFIRE AC inter-cable failure characteristics .................................................. 3-4 4-1 Analysis logic for 1-in valve penlight tests ................................................................ 4-3 4-2 Analysis logic for 1-in valve intermediate-scale tests ............................................... 4-3 4-3 Analysis logic for large coil penlight and intermediate-scale tests ........................... 4-5 4-4 Analysis logic for MOV Penlight and intermediate-scale tests ................................. 4-6 4-5 Analysis logic for SOV Penlight and intermediate-scale tests .................................. 4-8

xii
Table Page 4-6 Analysis logic for SWGR Penlight tests and intermediate-scale ............................ 4-11 4-7 Analysis logic for SWGR Intermediate Scale Tests 1, 3, 5, 6, 7, 8, 9, 10,
Cont 1, and Cont 2 ........................................................................................... 4-12 4-8 Conductor count, global approach, DC tests .......................................................... 4-13 4-9 Conductor count, duration data, DC tests .............................................................. 4-14 4-10 Thermal exposure conditions, global approach, DC tests ...................................... 4-15 4-11 Thermal exposure conditions, duration data, DC tests .......................................... 4-16 4-12 Raceway routing, global approach, DC tests ......................................................... 4-16 4-13 Raceway routing, duration data, DC tests .............................................................. 4-17 4-14 Raceway fill, global approach, DC tests ................................................................. 4-21 4-15 Raceway fill, duration data, DC tests ..................................................................... 4-22 4-16 Breakdown of insulation material by type, DC tests ............................................... 4-23 4-17 Insulation type, global approach, DC tests ............................................................. 4-23 4-18 Insulation type, duration data, DC tests ................................................................. 4-24 4-19 Insulation material, global approach, DC tests ....................................................... 4-25 4-20 Insulation material, duration data, DC tests ........................................................... 4-25 4-21 Insulation-jacket type, global approach, DC tests .................................................. 4-26 4-22 Insulation-jacket type, duration data, DC tests ....................................................... 4-27 4-23 DC test data wiring configurations .......................................................................... 4-28 4-24 Wiring configuration, global approach, DC tests .................................................... 4-29 4-25 Wiring configuration, duration data, DC tests ......................................................... 4-29 4-26 Conductor size, global approach, DC tests ............................................................ 4-30 4-27 Conductor size, duration data, DC tests ................................................................. 4-31 4-28 Circuit type, global approach, DC Tests ................................................................. 4-32 4-29 Circuit type hot short only, duration data, DC tests ................................................ 4-33 4-30 Circuit type spurious operation only, duration data - DC tests ............................... 4-33 4-31 Fuse size, global approach, DC tests ..................................................................... 4-34 4-32 Fuse size, duration data, DC tests ......................................................................... 4-35 4-33 Cable shielding, global approach, DC tests ........................................................... 4-36 4-34 Cable shielding, duration data, DC tests ................................................................ 4-36 4-35 Listing of concurrent spurious operations during intermediate-scale
DC testing ......................................................................................................... 4-38 4-36 Test data for Location A of DESIREE-FIRE for cases where concurrent
spurious operations occurred ........................................................................... 4-44 4-37 Test data for Location B of DESIREE-FIRE for cases where concurrent
spurious operations occurred ........................................................................... 4-45 4-38 Test data for Location D of DESIREE-FIRE for cases where concurrent
spurious operations occurred ........................................................................... 4-46 4-39 Test data for DESIREE-FIRE cases where concurrent spurious operations
occurred during Penlight exposures in the range of 325 - 375C ..................... 4-47 4-40 Test data for DESIREE-FIRE cases where concurrent spurious operations
occurred during Penlight exposures in the range of 400 - 480C ..................... 4-49 4-41 Test data for DESIREE-FIRE cases where concurrent spurious operations
occurred during Penlight exposures in the range of 500-525C ....................... 4-50 4-42 Test data for DESIREE-FIRE cases where concurrent spurious operations
occurred during Penlight exposures among tests not binned together in the analysis presented previously................................................................. 4-52

xiii
Table Page 5-1 Results of inter-cable shorting during Penlight DESIREE-Fire tests ........................ 5-6 5-2 Intermediate-scale preliminary test #1 ..................................................................... 5-7 5-3 Intermediate-scale preliminary test #2 ..................................................................... 5-8 5-4 Intermediate-Scale test #1 ..................................................................................... 5-10 5-5 Intermediate-scale test #2 ...................................................................................... 5-12 5-6 Intermediate-scale test #3 ...................................................................................... 5-14 5-7 Intermediate-scale test #4 ...................................................................................... 5-16 5-8 Intermediate-scale test #5 ...................................................................................... 5-17 5-9 Intermediate-scale test #6 ...................................................................................... 5-19 5-10 Intermediate-scale test #7 ...................................................................................... 5-20 5-11 Intermediate-scale test #8 ...................................................................................... 5-21 5-12 Intermediate-scale test #9 ...................................................................................... 5-23 5-13 Intermediate-scale test #10 .................................................................................... 5-24 5-14 Intermediate-scale test #11 .................................................................................... 5-26 5-15 Intermediate-scale test #12 .................................................................................... 5-29 5-16 Intermediate-scale contingency test #A ................................................................. 5-31 5-17 Intermediate-scale contingency test #B ................................................................. 5-31 5-18 Summary of initial failure mode for inter-cable test circuits .................................... 5-32

xv
EXECUTIVE SUMMARY Background NRC regulatory requirements, guidance, and staff technical positions regarding post-fire safe-shutdown are contained in various NRC documents. One objective of the fire protection requirements and guidance is to provide reasonable assurance that fire-induced failure of associated circuits that could prevent the operation, or cause maloperation, of equipment necessary to achieve and maintain post-fire safe-shutdown will not occur. In the late 1990s the NRC began to receive a series of licensee event reports (LERs) identifying plant-specific problems related to potential fire-induced electrical circuit failures that could prevent operation or cause maloperation of equipment necessary to achieve and maintain hot shutdown. The NRC documented its concerns in Information Notice (IN) 99-17, “Problems Associated with Post-Fire Safe-Shutdown Circuit Analysis.” The NRC determined that the issue should be treated generically and contracted with Brookhaven National Laboratory (BNL) to develop a post-fire safe-shutdown analysis letter report (ML023430533). In 2001, the industry (under the direction of the Nuclear Energy Institute (NEI) and the Electric Power Research Institute (EPRI)) performed a series of cable functionality fire tests to be used to develop the guidance later included in NEI 00-01, “Guidance for Post-Fire Safe-Shutdown Analysis” (ML023010376). These NEI/EPRI tests are the first set of test data used in the analysis for this report. An expert panel reviewed the results of the NEI testing and documented their insights on fire-induced failures of electrical cables in EPRI Technical Report 1006961, “Spurious Operation of Electrical Circuits Due to Cable Fires: Results of an Expert Elicitation,” dated May 2002. In February 2003, the NRC facilitated a public workshop primarily driven by the new NEI/EPRI report to exchange information for identifying circuit configurations fitting into the following three bins (ML03062006):
Bin 1 – the most risk-significant associated circuit configurations Bin 2 – other associated circuit configurations that require further research Bin 3 – low-risk-significant associated circuit configurations
The outcome of the facilitated workshop was the issuance of Regulatory Issue Summary 2004-03, “Risk-Informed Approach for Post-Fire Safe-Shutdown Associated Circuit Inspections” (ML040620400). Of interest to the research community were “Bin 2” items that required additional data as a basis for either including or excluding these configurations from the inspection procedures. The basis for the Bin 2 items was subsequently provided by an NRC-sponsored testing program conducted by Sandia National Laboratories, referred to as the “Cable Response to Live Fire (CAROLFIRE)” project. This project provides the second major testing data set to be used in this report. The results of the CAROLFIRE project were published in 2008 and documented in NUREG/CR-6931, Volumes 1 - 3. Concurrent with the CAROLFIRE testing, a nuclear utility conducted its own fire-induced circuit failure testing on an armored cable that is used extensively in its plants. The results of this testing, although proprietary, established that control circuits under direct current (DC) power may fail differently than those tested previously in the CAROLFIRE and NEI/EPRI tests, which were powered solely by alternating current (AC) configurations. As a result of these different

xvi
failure characteristics and the large number of risk-significant control circuits powered using DC, the NRC sponsored a confirmatory testing project to evaluate the likelihood and the failure characteristics of DC-powered control circuits. These test results are documented in NUREG/CR-7100, “Direct Current Electrical Shorting In Response to Exposure Fire (DESIREE-FIRE),” published in 2012 and is the third major set of experimental data that was used in this report. The three major test projects conducted over a ten year period provide a substantial amount of information to base technical recommendations on the functionality of electrical cables under thermal fire conditions. In 2011, during an electrical expert Phenomena Identification and Ranking Table (PIRT) meeting, it was determined that the current format of data presented in the test report could not support the PIRT objectives without a large amount of redundant effort. To make the PIRT effort more efficient, the NRC undertook an initiative to collect and analyze past cable fire testing data for insights on various parameter effects. This report documents the analysis of the test data from three major fire test programs which evaluated cable electrical performance under thermal (fire exposure) conditions. This report supports the PIRT by providing an analysis of test data in an objective and factual manner to support the panel’s discussion of parameters affecting the failure modes of electrical cables under fire-induced damaging conditions. The contents of this report were discussed during the electrical expert PIRT panel meetings. Data Analysis Overview The general purpose of the analysis is to evaluate the entire data set to identify parameters that may influence fire-induced failure modes. The analysis conducted in this report attempts to present the experimental data in a factual and clear format to allow for the identification of any influencing factors. The majority of the data is used to evaluate influencing parameters for intra-cable faults (i.e., fire-induced cable damage that results in the failure of conductors within a cable). A small fraction of the data has applicable information regarding inter-cable (cable-to-cable) interactions; however, the minimal data set limits the effectiveness of using a systematic approach to evaluate the test results for inter-cable interactions. Important parameters of the inter-cable data are simply presented instead. This report documents the intra-cable results using a substantial number of tables and graphical techniques. Graphical tools help to gain insights on the data set related to testing assumptions, relationship identification, and outlier detection. The use of graphical tools relies on column plots to present the failure mode likelihood data (i.e., fuse clears, hot shorts, spurious operations) and box plots to present the hot short duration data. Presenting the consolidated test information in tabular and graphical forms aided in the determination of any trends in the data. General conclusions are made, and any potential causes are identified.

xvii
Conclusions The data consolidation and analysis documented in this report identify several important fire-induced circuit phenomena. The systematic review of the AC and DC data has identified raceway fill, thermal exposure conditions, fuse size, circuit type, cable construction, and raceway routing as parameters that can influence the likelihood of experiencing a specific intra-cable failure mode and/or influence the length of intra-cable fire-induced hot short duration. This analysis has also identified areas in the data set where additional information would be beneficial to better understand how variations in parameters affect the circuit response under fire conditions. Information pertaining to fire-induced inter-cable (cable-to-cable) failure data is sparse; however, the available data is presented for both AC and DC circuits. The results show that while the likelihood of experiencing these failures is lower than it is for intra-cable, there are cases where inter-cable hot shorts were experienced. Most of this data comes from the CAROLFIRE and NEI/EPRI test data sets. The DESIREE-FIRE test data has revealed a newly observed failure mode in which multiple shorts to ground (from ungrounded systems) cause spurious operation in a circuit. This failure mode has been identified as “ground fault equivalent hot short,” and is the only inter-cable failure mode observed in the DESIREE-FIRE testing program. The only cable-to-cable shorts observed in the DC testing occurred through the ground plane. This unique failure mode may require some industry attention for circuits routed in dedicated conduits. Depending on the physical configurations in the plants, there may be some scenarios where safety significant electrical cables routed in dedicated conduits may be damaged by a fire, and, depending on the types of cables in the area, the ground fault equivalent hot short may be capable of causing hot short-induced spurious operations for a specific circuit.


xix
ACKNOWLEDGEMENTS The authors would like to offer their thanks and appreciation to the many individuals who provided support and comments during the development of this report. First we acknowledge the contributions of the NRC-RES/EPRI electrical expert Phenomena Identification and Ranking Table (PIRT) panel members. Their contributions and review resulted in a higher quality product that will help its readers to make informed decisions, both now and in the future. The electrical PIRT panel members include:
Harold Barrett Robert Daley Steven Nowlen Gabriel Taylor
David Crane Daniel Funk Thomas Gorman Andy Ratchford
Rick Wachowiak of EPRI also made numerous contributions that improved this report and provided an added level of insight, and also facilitated this work via the NRC-RES/EPRI Memorandum of Understanding (MOU) Addendum to Fire Risk. Working with EPRI under the MOU collaborative research agreement has allowed for the use of the EPRI fire-induced test data set, which has greatly supplemented the amount of data related to fire-induced cable failure phenomena. The authors would also like to thank the individuals at Sandia National Laboratories (SNL) who performed and documented the testing and answered numerous questions during the analysis of the data and the development of this report. The authors would like to thank Mark Henry Salley for supporting the development of this report and providing the resources needed to complete this effort. The authors are also grateful for the individuals at the NRC who worked on this report, and would like to extend their gratitude specifically to Mollie Semmes. Finally, we would like to thank the internal and external stakeholders who took the time to provide comments and suggestions on the draft of this report when it was published in the Federal Register (77FR37717) on June 22, 2012:
Thomas Gorman, PPL Susquehanna, LLC Michael D. Jesse, Exelon Generation Company, LLC Manomohan Subudhi, Brookhaven National Laboratory


xxi
ACRONYMS AND ABBREVIATIONS AC alternating current ADAMS Agencywide Document and Access Management System AT active target AWG American Wire Gauge BNL Brookhaven National Laboratories /C conductor CAROLFIRE Cable Response to Live Fire CPT control power transformer CSPE chlorosulfonated polyethylene DAQ Data Acquisition System DC direct current DESIREE-FIRE Direct Current Electrical Shorting in Response to Exposure Fire EPR ethylene propylene rubber EPRI Electric Power Research Institute FR-Kerite flame-retardant kerite™ HGL hot gas layer HS hot short IN Information Notice IR insulation resistance IRMS insulation resistance measurement system IT intermediate-scale test LER Licensee Event Report MOV motor-operated valve NEC National Electric Code NEI Nuclear Energy Institute NFPA National Fire Protection Association NPP nuclear power plant NRC Nuclear Regulatory Commission NRR Office of Nuclear Reactor Regulation PE polyethylene PIRT Phenomena Identification and Ranking Table PRA probabilistic risk assessment PT passive target PVC polyvinyl chloride RES Office of Nuclear Regulatory Research

xxii
SO spurious operation SCDU surrogate circuit diagnostic unit SNL Sandia National Laboratories SOV solenoid-operated valve SR silicone rubber SR-V silicone rubber vitalink SWGR switchgear TEF Tefzel™ TP thermoplastic TS thermoset VA volt-amp XLPE cross-linked polyethylene XLPO cross-linked polyolefin
1-1
1. INTRODUCTION
1.1 Background In 1997, U.S. Nuclear Regulatory Commission (NRC) staff began to notice that an increasing number of licensee event reports (LERs) were identifying plant-specific problems related to potential fire-induced electrical circuit failures. These problems were documented in Information Notice (IN) 99-17, “Problems Associated with Post-Fire Safe-Shutdown Circuit Analysis.” The NRC determined that this issue should be treated generically and began working with stakeholders to understand the issue. The NRC contracted with Brookhaven National Laboratories (BNL) to develop a post-fire safe-shutdown analysis letter report (Agencywide Document Access and Management System (ADAMS) Accession No. ML023430533). Meanwhile, the nuclear industry, working with the Electric Power Research Institute (EPRI) under the direction of the Nuclear Energy Institute (NEI), performed a series of cable functionality fire tests to better understand the failure modes of cables and circuits under fire conditions. Following the completion of the NEI testing, the NRC hosted a facilitated public workshop1 in Rockville, MD to discuss and gather stakeholder input on a proposed risk-informed post-fire safe-shutdown circuit analysis inspection. The workshop grouped circuit issues into three bins. Bin 1 contained the most risk-significant associated circuit configurations, Bin 2 included configurations that required additional research before a risk-significance determination could be made, and Bin 3 contained low-risk-significant associated circuits of concern. Bin 2 items included:
A. Inter-cable shorting for thermoset cables B. Inter-cable shorting between thermoplastic and thermoset cables C. Configurations requiring three or more cable failures D. Multiple spurious operations in control circuits with properly sized control power
transformers (CPTs) E. Fire-induced hot shorts that must last more than 20 minutes to impair a plant’s ability to
achieve hot shutdown F. Cold shutdown circuits
To provide the needed information to disposition the Bin 2 items into either of the other two bins, following the NEI/EPRI testing, the NRC sponsored a testing project at Sandia National Laboratories (SNL). The SNL project was entitled “Cable Response to Live Fire (CAROLFIRE),” and it provided enough data on five of the six Bin 2 circuit configurations that a determination of risk-significance could be made. Test data was not required to resolve RIS 2004-03, Bin 2, Item F. CAROLFIRE also provided data that resulted in the development of a better predictive model for cable thermal response in deterministic fire models. Around the same time that the CAROLFIRE testing was being conducted, Duke Energy Corporation, a U.S. nuclear utility, performed its own fire-induced circuit failure testing on a unique armor-type cable used extensively in its plants. Although the test results from this program are proprietary, the NRC was able to witness these tests and gain the unique insights of the testing. 1 The facilitated public workshop was an open forum meeting between the NRC staff and its stakeholders where the discussion was facilitated by an independent third party.

1-2
The results of the Duke testing indicated that risk-significant circuits operating on direct current (DC) may experience unique failure modes when compared to alternating current (AC) circuits (ML052900252, ML071200168). The NRC and the industry also experienced difficulties in developing methods and conditional probabilities for DC circuits based solely on the results of AC testing. To evaluate these concerns, the NRC sponsored a confirmatory testing project with SNL to evaluate the spurious operation likelihood associated with ungrounded DC control circuits exposed to fire conditions. This project was titled “Direct Current Electrical Shorting In Response to Exposure Fire (DESIREE-FIRE).” The DC testing identified three unique failure characteristics of DC control circuits. First, the physical cable failures were more energetic than they were in the AC tests, with sparks and electrical arching readily visible to the test engineer. Second, open circuits were noted to occur as the first failure mode. Third, fuse sizing played a role in the duration of the hot short failures. In some cases the hot short durations lasted for longer than 20 minutes. It is important to note that one additional testing program was completed to specifically evaluate the thermal failure temperature threshold of a unique cable insulation material manufactured by Kerite. This unique insulation material, “FR-Kerite” has shown poor insulation resistance characteristics at elevated temperature in past testing. As such, the NRC guidance indicated using a generic thermoplastic failure threshold when analyzing the FR-Kerite performance, instead of the higher temperature failure threshold for thermoset materials. Chemically, FR-Kerite is a thermoset material. However it also exhibits thermoplastic properties such as self-healing. Under its collaborative research agreement with EPRI, the NRC was able to obtain samples of 1970’s vintage FR-Kerite cables. Because of its unique construction, having insulation thicknesses much greater than typical electrical cables found in U.S nuclear power plants, the results from this fourth testing project have not been included in this report or analysis. Rather, limited data on FR-Kerite cables obtained from the DESIREE-FIRE project were evaluated here. The results and conclusions from the FR-Kerite test program can be found in a separate report, NUREG/CR-7102, “Kerite Analysis in Thermal Environment of FIRE (KATE-Fire): Test Results.” Following the completion of this testing, the NRC (in collaboration with EPRI) convened a panel of electrical experts with a background in nuclear and fire protection engineering to evaluate the various parameters that affect fire-induced cable failures. This electrical expert Phenomena Identification and Ranking Table (PIRT) panel experienced difficulties in making informed decisions due to the massive amount of test data on which to base its decisions. As a result, the NRC began an effort among its staff and the staff at SNL to systematically evaluate and present the experimental data in a clearer format to assist the PIRT panel in making informed decisions. This report documents that effort.

1-3
1.2 Objective There have been numerous testing projects aimed at evaluating the fault modes of electrical cables and circuits exposed to fire conditions. Only one of these projects thoroughly evaluated specific aspects of a small number of the test results. The objective of this report is to provide a simplistic presentation of all of the available test data, using various circuit parameters to identify any correlations among fault modes and any correlations among hot short duration. The core set of parameters selected by the PIRT panel for comparison of the intra-cable results includes:
Conductor Count Thermal Exposure Conditions Cable Orientation (AC only) Raceway Routing Raceway Fill Insulation Type Insulation Material Insulation-Jacket Type
CPT Size (AC only) Circuit Grounding (AC only) Wiring Configuration Conductor Size Circuit Type (DC only) Fuse Size (DC only) Cable Shielding (DC only)
In addition to these parameters, the report documents a review of the data for inter-cable failures, effects of suppression on circuit response, multiple circuit concurrent hot shorting events, and a phenomenon observed in the DC testing, identified as the “ground fault equivalent hot short.” Conducting the evaluation in this systematic manner allows for a better understanding of the data and identification of the areas in which additional data may be needed, and also supports the electrical expert PIRT work. The focus of this report is to document the data analysis that was conducted to support the PIRT panel. Brookhaven National Laboratory will document the results of a PRA expert elicitation quantification of fire-induced spurious operation likelihood and duration in Volume 2 of NUREG/CR-7150. Limited statistical methods and no probabilistic risk assessment methods were employed in the evaluation, just factual inference of the data.
1.3 The Approach The data used in developing this report was obtained from the NEI/EPRI cable testing report [4], along with the NRC-sponsored CAROLFIRE (NUREG/CR-6931)[1-3] and DESIREE-FIRE (NUREG/CR-7100) testing project [5]. It is assumed that the reader is familiar with those reports, and only brief descriptions of the testing will be provided in this report. A reader unfamiliar with this testing is urged to review the test reports to better understand the testing methods and results. A database was generated from the information provided in the reports and associated electronic data files. The database included all pertinent information regarding the circuit configuration and failure modes/characteristics. The cable failure data were obtained from the actual data files and cross-referenced with the results documented in the associated reports. This provided an increased level of quality assurance to ensure that the electronic files and data report information were consistent, thereby minimizing the likelihood of information transfer errors. Once the database was populated with information found to be important for this project, it was sorted by parameters of interest so that specific information could be collected, reviewed, and reported.

1-4
Staff members from the NRC’s Office of Nuclear Regulatory Research (RES) were responsible for analyzing the AC test data from NEI/EPRI and CAROLFIRE testing, while staff from SNL processed and reviewed the DC test data. The intent was to have two groups complete the work in parallel to reduce time and increase efficiency. Throughout the process, NRC-RES and SNL staff coordinated with each other to ensure a high level of consistency and quality among the split effort. To ensure the quality of the developed database, NRC-RES staff other than those performing the original data analysis effort performed spot check of the database with the actual data files and corresponding reports. No errors were found in the cases examined. The analysis focuses on presenting the test data in a manner that will assist the electrical expert PIRT panel members in making informed decisions regarding the ranking of various circuit parameters and key phenomena. This information was determined by identifying the number of specific failure modes (fuse clear, hot shorts, and spurious operations), given a particular circuit or cable parameter. For this analysis, the following definitions developed by the PIRT panel were used to classify fire-induced circuit failures: Hot Short: Individual conductors of the same or different cables that come in contact with
each other and that may result in an impressed voltage or current on the circuit being analyzed. (Regulatory Guide 1.189)
For the purposes of the PIRT, only a hot short that is of sufficient quality to actuate the end device is of interest. Spurious Operation2,3:
A circuit failure mode wherein an operational mode of the circuit is initiated (in full or in part) due to failure(s) in one or more of the circuit’s components (including cables). For example, such modes include a pump (starting or stopping) or a valve spuriously repositioning.
Duration: The time (reported in seconds) that a particular hot short or spurious operation
persisted. In cases where sequential hot shorts or spurious operations occurred one after another, the durations of all occurrences were summed to obtain a total duration, which was then reported (i.e., the reported total duration was not necessarily continuous).
1.3.1 Presentation of failure mode data There are three primary circuit failure modes of interest to the electrical expert PIRT panel: fuse clear failures, hot shorts, and hot short-induced spurious operation. These failure modes are provided in this report, using what is referred to as the “global approach,” which evaluates failure modes in a binary fashion. This binary approach defines the first failure mode as being either a fuse clear or a hot short. For a given cable/circuit combination, either a fuse clears or a hot short occurs. To facilitate a better understanding of the fraction of hot shorts that are spurious operations, the spurious operation data are also reported separately, but it must be understood that the hot short data includes spurious operations by definition. Therefore,
2 Definition of “Spurious Operation” was quoted from NUREG/CR-7150, Volume 1, “Joint Assessment of Cable Damage and Quantification of Effects from Fire (JACQUE-FIRE).” This definition differs from Regulatory Guide 1.189, and NEI-00-01, Rev. 2. 3 “Spurious Operation” and “Spurious Actuation” are used synonymously throughout this report.

1-5
for the global approach in reporting failure mode data, the number of hot shorts is always by definition larger than or equal to the number of spurious operations. In general, fire-induced circuit testing has shown that a damaged cable will eventually short to a common ground and cause the protective fuses to clear. In this report, in must be clear that the fuse clear category only counts fuse clear failures from the first failure mode. For example, if a circuit experienced a spurious operation at 100 seconds and then experienced a fuse clear at 130 seconds, this report would count the hot short and spurious operation, but not the fuse clear. Specifics on how the failure modes are counted and reported are presented in Section 2.1 for AC circuits and in Section 4.1 for DC circuits. Another aspect of this analytical approach, relative to the spurious operation count, is best shown with another example. Start with a circuit that experiences a hot short on a conductor that is not associated with a device that can cause a spurious operation (e.g., indicating lamp – a passive target). Sometime in the future, another hot short occurs, this time on a conductor that can cause a spurious operation. In this case, the hot short and the spurious operation would be included in the count (i.e., # hot shorts = 1, # spurious operations = 1). Note that the hot short count is not two, even though two hot shorts have occurred in an individual circuit (i.e., one hot short for the passive target and one hot short for the active target). The analysis was done in this manner to ensure that if a spurious operation occurred, it would be counted and reported. In reality, when circuits fail from fire-induced exposures, it is common for a single circuit to experience multiple hot shorts. An example of how the global approach failure mode information is presented in this report is shown in Table 1-1 and Figure 1-1. Table 1-1 documents the number and types of failure modes for each scenario, while Figure 1-1 shows this information graphically in a column chart. In this example, there are three different scenarios (A-C), and the columns identify the number of individual failure modes associated with the specific scenario. The first failure mode is a “fuse clear” failure. This refers to failures in which the circuit failed in such a way as to cause the protective fuse to clear, meaning that no hot shorts occurred. The next failure mode represents the number of spurious operations. This information identifies the number of circuits that experienced hot short-induced spurious operations. The next column, “Hot Shorts,” represents the number of circuits that experienced a hot short. If we take Scenario A as an example, six spurious operations and 13 hot shorts occurred. However, of those 13 hot shorts, six were spurious operations (by definition); thus, seven of the hot shorts in Scenario A were associated with conductors that, when energized, would not result in a spurious operation (e.g., indicating lamps, spare conductors, etc). The column plots also have the associated percentages at the top of each column.
Table 1-1. Example of failure mode table Scenario A Scenario B Scenario C Fuse Clear 5 20 10Hot Short 13 5 17Spurious Operation 6 5 15HS/SO Possible 18 25 27

1-6
Figure 1-1. Examples global approach failure mode column plot 1.3.2 Failure mode duration presentation of data To provide a realistic and simple graphical representation of the duration data set, this report provides hot short and spurious operation duration box plots, also known as box and whisker plots. An example of a box and whisker plot is provided in Figure 1-2. The example data set used to prepare this example plot is a continuous set of integers ranging from 21 to 80.
q1 35.75 min 21 median 50.5 max 80 q3 65.25
Figure 1-2. Box and whisker plot example
The duration of hot shorts and spurious operations were evaluated on a conductor by conductor basis. In this way, the duration of each hot short was tabulated by evaluating each conductor voltage and current profile for each test and summing the duration of the hot short(s) for each conductor. The conductor durations were then used to produce the box plots. Since spurious operations are a form of hot short, this report presents hot short duration box plots that represent both hot short and spurious operation durations, while the spurious operation duration
Scenario A Scenario B Scenario C
Cou
nt
0
10
20
30
40Fuse Clear Hot Short Spurious OperationHS/SO Possible
100%
100% 10
0%
28%
72%
33%
80%
20%
20%
37%
63%
55%
0
10
20
30
40
50
60
70
80
90
Data Set
q1
min
median
max
q3
maximum
lowerquartile
upperquartile
25th percentile
50th percentile
75th percentile

1-7
box plots only account for conductors that are associated with an end device which actually spurious operated. Box plots show a measure of central location (median), two measures of dispersion (the interquartile range, defined as the difference between the first and third quartiles), the skew, and potential outliers. Box plots do this by using the minimum and maximum values, along with the first, second, and third quartiles of the data set. Quartiles are related to percentiles in that the first quartile (designated q1) is the 25th percentile. The second quartile (q2) is the 50th percentile, and is also referred to as the median. The third quartile (q3) is the 75th percentile of the data. It should be noted that no distributions are assumed in presenting data using box plots. The box plots identify the minimum and maximum values in the data set. Lines from these two points are referred to as the whiskers, and connect to the boxes’ limits. The boxes’ lower and upper limits indicate the first and third quartiles, respectively. The median is located within the box and is a reference point for identifying any skewness in the data set. As a general rule, any whisker which is three times longer than the length of the box most likely indicates an outlier. As you will see in the test result sections below, the duration data has several long duration outliers that make it difficult to interpret any variations of the core data. Rather than remove these long duration data points, the authors have reduced the plot ranges (y-axis) to provide a better representation of the data variations, with the maximum values designated at the top of the plot. Tables are included with these box plots to provide all of the information numerically, in tabular form. There are numerous methods for calculating quartiles. For simplicity, the authors chose to use the built-in “quartile” function of Microsoft Excel. Excel uses the following equations to calculate quartiles: 1 ∗ 1 ∗ 2 (Equation 1-1) 1 ∗ (Equation 1-2) Where n = number of values y = observation number (when values are arranged in ascending order) p = percentile j = integer g = decimal x() = specific value in ascending list These equations can be simplified into the following form for the first, second, and third quartiles:
1st quartile (q1): ¼*(n+3)th observation 2nd quartile (median): ½*(n+1) th observation 3rd quartile (q3): ¼*(3*n+1)th observation.

1-8
1.4 Report Organization Section 2 presents the AC data taken from the NEI/EPRI, CAROLFIRE, and DESIREE-FIRE testing projects, evaluating the various intra-cable failure parameters where data was available. A summary of the systematic parameter evaluation is presented in the latter portion of Section 2, along with evaluations of the effects of suppression and hot short concurrence. Section 3 provides a review of inter-cable failures observed during testing and the authors’ identification of any influencing parameters. This discussion identifies what was done in the EPRI and NRC testing programs to provide tests that could be used to evaluate the likelihood of inter-cable fire-induced hot shorts of AC circuits. Section 4 presents the DC data taken from the DESIREE-FIRE testing project, evaluating the various intra-cable failure parameters. This analysis complements the information from Section 2 on the AC data, but also evaluates several additional parameters. This section also includes a summary of the systematic evaluation of the DC data, along with a review of concurrent hot shorts that occurred in the intermediate-scale testing of DC circuits. Section 5 provides a summary of test data related to inter-cable interactions for AC circuits, similar to what was done in Section 3. The larger portion of Section 5 involves the evaluation of what is being called “ground equivalent hot shorts,” where multiple cables experience hot shorts. Section 6 provides a summary of findings for the entire report. Section 7 contains the report conclusions. Section 8 provides references. Appendix A contains data on the penlight ground fault equivalent inter-cable failure mode evaluation. Appendix B contains supplemental information for the CAROLFIRE reports, including additional data retrieval.

2-1
2. INTRA-CABLE – ALTERNATING CURRENT CIRCUITS
2.1 AC Data Analysis Approach An alternating current (AC) motor-operated valve (MOV) circuit was the primary circuit used in the NEI/EPRI and Cable Response to Live Fire (CAROLFIRE) testing projects to evaluate the likelihood of spurious operations. A small set of tests in the Direct Current Electrical Shorting in Response to Exposure Fire (DESIREE-FIRE) project also used the AC MOV circuitry. The AC MOV circuit typically had passive targets representing indicating lamps, two active targets (forward and reverse motor starter contactor), spare conductors, one to two energized (source) conductors, and at least one common return. The definition of a hot short is important to this work. As stated previously, only a hot short that is of sufficient quality to actuate the end device is of interest. Thus, low-quality hot shorts that would not cause the circuit to respond would not be of interest. Therefore, threshold values are defined as identifying the energy levels (voltage or current) that would be required to cause the active and passive targets to change state. This information is presented in Table 2-1, identifying the failure threshold values for the AC MOV circuit. Active targets are considered to be those cable conductors which are connected to one of the two MOV contactors. If these active target conductors become energized during fire-induced cable failure with sufficient voltage and current, the contactors will pull in, and, in real plant systems, the motor will become energized to move in either the open or close direction, depending upon which contactor becomes energized. For the AC test data, a hot short on a passive target or on a spare conductor was counted when that electrical conductor achieved a voltage level of 80V. The choice of 80V is based on the authors’ judgment and discussion with the Phenomena Identification and Ranking Table (PIRT) panel. For an indication lamp, 80V is sufficient to illuminate the lamp, and for an ungrounded spare the 80V threshold was thought to be sufficient to eliminate the likelihood that the measurement would derive from induced voltages on the spare conductor. Table 2-1. AC threshold values used for MOV hot short & spurious operation
determinations
NEI/EPRI CAROLFIRE DESIREE-FIRE
Active Targets Pick-up Voltage 80V 72V 80V
Drop-out Voltage 60V 65V 60V
Passive Targets Voltage 80V 80V 80V
Spare Voltage 100V 100V 100V
For continuous hot shorts, the duration time was calculated from the start of a hot short to the end, which was typically a fuse clear. In several cases, a circuit will experience several successive hot shorts on the same conductor. In these cases, the duration is based on the sum of the individual durations. For example, assume that conductor number three of circuit A experienced three hot shorts lasting 10, 15, and 5 seconds respectively; the duration reported would be 30 seconds, based on the authors’ judgment and discussions among the PIRT panel. This is considered to be a conservative approach, but also realistic for components, such as a motor-operated valve, that would not return to their original state following the clearing of the hot short/spurious operation, requiring a finite stroke time to open or close.

2-2
Once all of the information from the tests was entered into the spreadsheet, the data was reviewed for circuit configurations that fell outside of the majority of the test data. These outlier circuit configurations were removed from further use in the study. For instance, in CAROLFIRE, there were several tests that were designed to evaluate the likelihood of inter-cable shorting. Since this analysis is only concerned with intra-cable interactions, the inter-cable data was removed from this analysis, but is used in Section 3 to evaluate inter-cable hot shorting. In some of the CAROLFIRE and several of the NEI/EPRI tests, the cables did not fail. In the cases where the cables are not driven to thermal failure, there is no information on the failure modes to be learned. Thus, the test circuits that did not fail were removed from further use in this study. The final type of data points that were removed from the spreadsheet were instances where the circuit was instrumented in such a way that it was impossible for the electrical protective device (fuse) to clear or configure, so that the only method that would allow a fuse clear would be a short to an external ground. The majority of these cases are from the DESIREE-FIRE testing, where a flame-retardant Kerite™ (FR-Kerite) cable was tested using AC diagnostics to evaluate the thermal failure temperature. Here, only source conductors and active target conductors were included in the test cables. As such, there were no common return paths within the cable that would cause a fuse clear, which could only occur when an energized conductor came in contact with a ground plane at low resistance. Although configurations in the plants may exist when there is no common power source return in a cable with sources and targets, the authors believed that this data would skew the results, especially for hot short likelihood and duration. As such, these data points were removed, and were not used in this study. The last point to make clear is the manner in which the data is presented in the report. Specifically, there are several ways to present the fault mode data in terms of counting hot shorts. The discussion that follows provides clarification on the methods that were used in this report. Figure 2-1 is a schematic of the surrogate circuit diagnostic unit (SCDU) used in CAROLFIRE to represent an AC MOV motor starter circuit. Similar circuits were used in the NEI/EPRI and DESIREE-FIRE testing projects. In Figure 2-1, there are two energized source conductors, shown as circuit paths 1 and 2. A resistor used to represent an indication lamp is considered to be a passive target (PT), and is connected to circuit path 4. Circuit paths 5 and 6 are connected to the forward and reverse motor starter contactors, “K1” and “K2.” These two paths are considered active targets (AT). Circuit path 7 is connected to the common power supply return, and circuit path 8 is considered to be an ungrounded spare conductor.
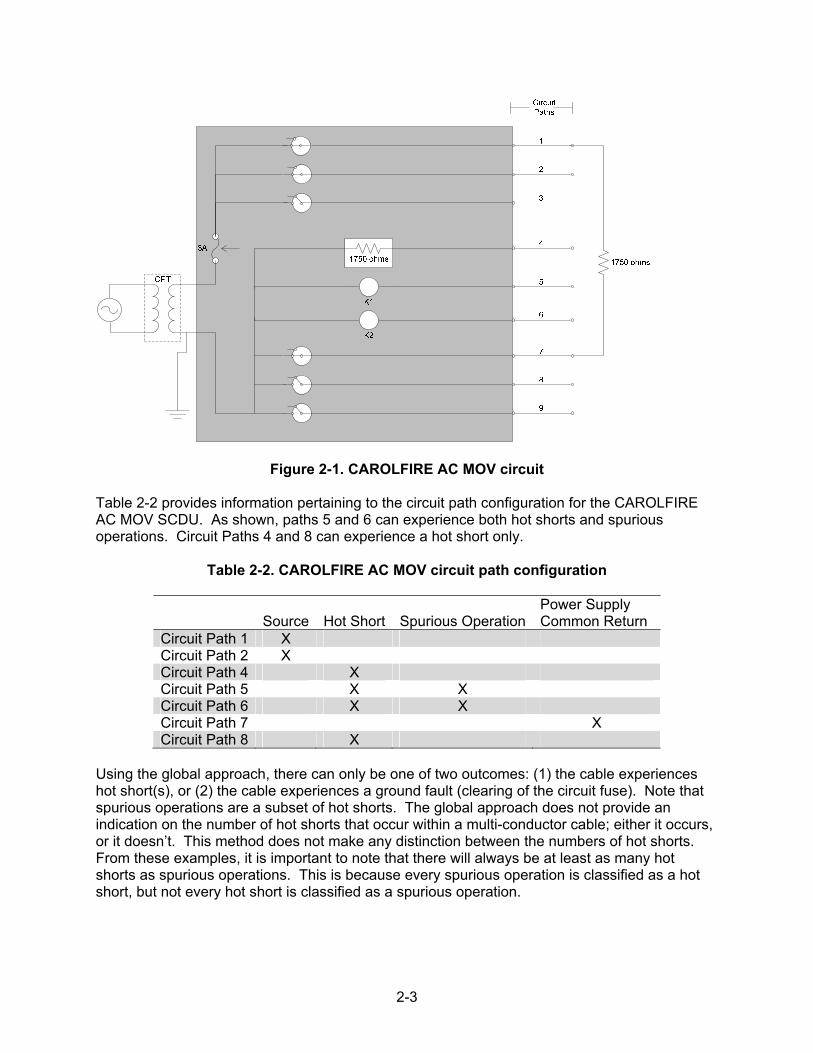
2-3
Figure 2-1. CAROLFIRE AC MOV circuit Table 2-2 provides information pertaining to the circuit path configuration for the CAROLFIRE AC MOV SCDU. As shown, paths 5 and 6 can experience both hot shorts and spurious operations. Circuit Paths 4 and 8 can experience a hot short only.
Table 2-2. CAROLFIRE AC MOV circuit path configuration
Source Hot Short Spurious OperationPower Supply Common Return
Circuit Path 1 X Circuit Path 2 X Circuit Path 4 X Circuit Path 5 X X Circuit Path 6 X X Circuit Path 7 X Circuit Path 8 X
Using the global approach, there can only be one of two outcomes: (1) the cable experiences hot short(s), or (2) the cable experiences a ground fault (clearing of the circuit fuse). Note that spurious operations are a subset of hot shorts. The global approach does not provide an indication on the number of hot shorts that occur within a multi-conductor cable; either it occurs, or it doesn’t. This method does not make any distinction between the numbers of hot shorts. From these examples, it is important to note that there will always be at least as many hot shorts as spurious operations. This is because every spurious operation is classified as a hot short, but not every hot short is classified as a spurious operation.

2-4
For example, let’s assume that the AC MOV circuit shown in Figure 2-1 is used in a test, and that the following failure modes occurred in this case:
@ 954 seconds – circuit path 4 experienced a hot short @ 1005 seconds – circuit path 6 experienced a hot short @ 1013 seconds – circuit path 6 experienced a hot short @ 1020 seconds – the circuit fuse cleared
In this example, using the global approach to counting hot shorts and spurious operations, there was one hot short, one spurious operation, and no fuse clears. In reality there were three hot shorts, two spurious operations, and one fuse clear. Again, the global approach looks at the circuit failure modes in a binary fashion. This point is important for understanding the information that follows in this section and in Section 4. With regard to calculating duration of the hot shorts and hot short induced spurious operations, more information is required to calculate the duration using the method outlined above. Using the previous example, the duration of the hot short and spurious operation is presented using the following information:
circuit path 4, hot shorts as follows; o 954 seconds – hot short starts o 1020 seconds - hot short ends
circuit path 6 experienced a hot short induced spurious operation as follows; o 1005 seconds - spurious operation begins o 1010 seconds - spurious operation ends o 1013 seconds - spurious operation begins o 1020 seconds - spurious operation ends
For circuit path 4, since only one fire-induced hot short occurred, the duration is calculated as the hot short end time (1020s) minus the hot short start time (954s) resulting a hot short duration of 66 seconds. For circuit path 6, multiple hot short-induced spurious operations occur on the same end device. Here the duration is calculated for each individual spurious operation and all of the individual durations are summed together to arrive at a total duration for circuit path 6. This is shown in Equation 2-1. Circuit Path 6 duration: (1010 s – 1005 s) + (1020 s – 1013 s) = 12 seconds Equation 2-1 The last point to make regarding the analysis of the AC test data is that some of CAROLFIRE and DESIREE-FIRE tests also employed SNL’s patented Insulation Resistance Measurement System (IRMS), which was operated using AC power. This system provides measurements of a monitored electrical cable’s insulation resistance as a function of time during fire-induced cable failure. The IRMS can provide detailed information as to how the individual conductors are failing; however, it does not represent any type of electrical circuit used in a nuclear power plant. Several concepts regarding the use of the IRMS data to evaluate failure modes were discussed during the electrical expert PIRT meetings, but none were technically accurate enough to be used to supplement the data analysis documented here. The remainder of this section presents the AC test data evaluated by the various parameters outlined earlier. Each parameter discusses how the data was binned and then presents the failure mode likelihood, followed by information on the hot short duration.

2-5
2.2 Conductor Count The effects of the conductor count on failure modes are evaluated here. The test data included multi-conductor cables with 3, 5, 6, 7, 8, and 9 conductors. The PIRT members suggested that the conductor count bins be labeled “1/C,” “2-6/C,” “7-9/C,” “10-15/C,” and “Greater than 15/C.” Table 2-3 provides the failure mode likelihood data, separated into conductor count ranges. There is no data publically available for 1/C cables, or for cables with conductor counts greater than 10/C.
Table 2-3. Conductor count, global approach, AC tests
Global Approach 1/C 2-6/C 7-9/C 10-15/C >15/C Fuse Clear - 4 41 - - Hot Short - 2 65 - - Spurious Operation - 2 56 - - HS/SO Possible - 6 106 - -
Figure 2-2 presents the information from the above tables in column format. These figures show that a large portion of data has been collected in the 7-9 conductor range, making it difficult to assess the influence that conductor count has on hot short and spurious operation likelihood.
Figure 2-2. Conductor count column plot, global approach, AC tests Table 2-4 presents data related to the durations of hot shorts and spurious operations, divided into the same conductor count ranges used above. Figure 2-3 presents this data visually, in a box plot. Again, the sparse data limits the amount of information that can be obtained relating to the influence of conductor count on hot short and spurious operation likelihood.
1/C 2-6/C 7-9/C 10-15/C >15/C
Cou
nt
0
20
40
60
80
100
120
140Fuse Clear Hot Short Spurious OperationHS/SO Possible
100%
53%61
%39
%
100%
33%
33%
67%

2-6
Table 2-4. Conductor count, duration data, AC tests Hot Short Spurious Operation 1/C 2-6/C 7-9/C 10-15/C >15/C 1/C 2-6/C 7-9/C 10-15/C >15/C q1 - 3 8 - - - 4 10 - - min - 1 1 - - - 1 1 - - median - 6 27 - - - 8 33 - - max - 15 1345 - - - 15 456 - - q3 - 10 79 - - - 11 81 - - mean - 7 69 - - - 8 61 - -
Figure 2-3. Conductor count box plot, duration, AC tests
2.3 Thermal Exposure Conditions The test data used to evaluate the thermal exposure parameter is separated into four general exposure conditions, radiant, flame, plume, and hot gas layer (HGL). Figure 2-4 shows the intermediate-scale testing rig used in the CAROLFIRE and DESIREE-FIRE testing projects. It is important to note that the locations were identified differently in the two testing projects, and that the lower exterior HGL locations in the CAROLFIRE project (i.e., B and D) were not used in the DESIREE-FIRE testing project. Care was taken during the analysis to ensure that the naming conventions did not cause the different exposure locations to be combined within the same bin. Flame exposures were considered to be any electrically monitored cable in location A. In addition, if location A was filled with cables to provide a fuel source during an experiment, the locations directly above location A (C for CAROLFIRE and B for DESIREE-FIRE) would also be considered flame exposure locations. Plume exposure locations were considered to be locations C and F in CAROLFIRE and locations B and D in DESIREE-FIRE unless designated as flame locations, as discussed previously. HGLs were considered to be those locations outside of the flame and plume locations. Therefore, HGL exposure bins included locations B, D, E, and G for CAROLFIRE, and locations C and E for DESIREE-FIRE. In addition, the penlight exposure provided a radiated thermal exposure to the cables, and all of the Penlight
0
25
50
75
100
1/C 2‐6/C 7‐9/C 10‐15/C >15/C 1/C 2‐6/C 7‐9/C 10‐15/C >15/C
Hot Short Spurious Operation
Seconds
q1
min
median
max
q3
1345s 456s

2-7
data is separated into an individual bin labeled “radiant.” The exposure conditions classification used in the EPRI test report were adopted as reported.
CAROLFIRE DESIREE-FIRE
Figure 2-4. Intermediate-scale cable raceway location Table 2-5 and Figure 2-5 present the ground fault, hot short, and spurious operation data. This data shows some deviations between thermal exposure conditions with regard to ground faults, hot shorts, or spurious operations. Here the flame region has a lower likelihood of experiencing a fuse clear fault and a higher likelihood of experiencing hot shorts and spurious operations. The limited number of AC circuit radiant energy tests (five in total) are all from the AC tests conducted during the DESIREE-FIRE project. Three of these cable samples were of the FR-Kerite variety, and the remaining two samples were cross-linked polyethylene (XLPE)-insulated.
Table 2-5. Thermal exposure conditions, global approach, AC tests
Global Approach Flame Plume HGL Radiant Fuse Clear 7 15 19 4 Hot Short 18 22 26 1 Spurious Operation 17 17 23 1 HS/SO Possible 25 37 45 5

2-8
Figure 2-5. Thermal exposure conditions column plot, global approach, AC tests Table 2-6 and Figure 2-6 present the duration data, separated by thermal exposure conditions of flame, plume, and HGL exposures. The box and whisker plot shows that there may be a correlation between hot short/spurious operation duration and thermal exposure conditions. For flame exposures, the durations are very short, lasting between 1 and 32 seconds. The plume thermal exposure conditions have durations with a slightly longer and wider range of 6 to 120 seconds4. The hot gas layer thermal exposures have the largest range of duration, running from 1 to 456 seconds. This observation is consistent with the physical response of the cables to these exposure conditions. In a flame impingement exposure, there is a very intense thermal insult on the cables and the insulation degrades rapidly, thus progressing from the onset of electrical failure to final circuit failures (fuse clear) in a short time frame. As the exposure conditions become less intense (i.e., plume then HGL exposures), the degradation of the conductor insulation is slower and the failures do not cascade to full failure as rapidly.
Table 2-6. Thermal exposure conditions, duration data, AC tests
Hot Short Spurious Operation Flame Plume HGL Radiant Flame Plume HGL Radiant q1 2.3 17.5 20.7 0.6 4.2 24 28.9 0.6 min 0.2 5.8 0.4 0.6 0.2 6 0.8 0.6 median 7.3 45.6 78.8 0.6 8 47.4 78.8 0.6 max 31.6 1345 456 0.6 31.6 126 456 0.6 q3 20 72 169.7 0.6 24.6 60 120.7 0.6 mean 11.1 80.6 106.6 0.6 12.7 51.1 103.4 0.6
4 Note that one duration for the hot short plume data set was 1345 seconds. This data point has been removed from the generalized discussion, but is important when considering maximum test data durations.
Flame Plume HGL Radiant
Co
unt
0
10
20
30
40
50
60Fuse Clear Hot Short Spurious OperationHS/SO Possible
100%
46%59
%
41%
100%
68%
72%
28%
100%
51%58
%
42%
100%
20%
20%80
%

2-9
Figure 2-6. Thermal exposure conditions box plot, duration, AC tests
2.4 Cable Orientation Available test data consists of cable arrangement in the vertical and horizontal orientations. However, only one test project (NEI/EPRI) included testing cables in the vertical orientation, and the majority of the test data is for cables oriented horizontally. As such, there is too little information on fire-induced cable failures in the vertical orientation to allow for comparisons. Table 2-7 and Figure 2-7 present the data, which is separated by cable orientation.
Table 2-7. Cable orientation, global approach, AC tests
Global Approach Horizontal Vertical Total Fuse Clear 42 3 45 Hot Short 65 2 67 Spurious Operation 56 2 58 HS/SO Possible 107 5 112
0
50
100
150
200
Flame Plume HGL Radiant Flame Plume HGL Radiant
Hot Short Spurious Operation
Seconds q1
min
median
max
q3
1345s 456s 456s

2-10
Figure 2-7. Cable orientation column plot, global approach, AC tests Table 2-8 and Figure 2-8 present the duration information based on cable orientation binning. Again, the minimal amount of data in the vertical position inhibits an evaluation of how cable orientation affects hot short duration.
Table 2-8. Cable orientation, duration data, AC tests
Hot Short Spurious Operation Horizontal Vertical Horizontal Vertical q1 7 11 10 12 min 1 6 1 6 median 27 15 32 18 max 1345 120 456 120 q3 77 44 79 69 mean 69 39 60 48
Horizontal Vertical
Cou
nt
0
20
40
60
80
100
120
140Fuse Clear Hot Short Spurious OperationHS/SO Possible
100%
100%
39%
61%
52%
60%
40%
40%

2-11
Figure 2-8. Cable orientation box plot, duration, AC tests
2.5 Raceway Routing Open ladder-back cable trays, rigid steel conduits, and air drop configurations were all used during testing. However, the use of cable trays was predominant, and the lack of sufficient data in the air drop and conduit configurations makes it difficult to determine the effects of raceway routing type on fire-induced circuit failures. In addition, no data is available for cable trays with solid bottom covers or vented covers. Table 2-9 and Figure 2-9 present the test data separated by raceway routing configurations and air, conduit, and tray configurations.
Table 2-9. Raceway routing, global approach, AC tests
Global Approach Air Conduit Tray Fuse Clear 0 2 43 Hot Short 2 2 63 Spurious Operation 2 2 54 HS/SO Possible 2 4 106
0
50
100
150
Horizontal Vertical Horizontal Vertical
Hot Short Spuriuos Operation
Seconds
q1
min
median
max
q3
1345s 456s

2-12
Figure 2-9. Raceway routing column plot, global approach, AC tests Table 2-10 and Figure 2-10 present the duration data separated by raceway routing configurations. This information indicates that air drop tests last longer than configurations using conduit or cable tray raceways. This observation is likely the result of the ground plane’s influence on the circuit’s ability to clear fuses. In an air drop test configuration, there is typically only one conductor that can cause a circuit to experience a fuse clear. This is a common power supply return (the neutral from the power supply), and it is typically grounded. For a circuit to clear its protective fusing, a source conductor is required to come in contact with a common ground. In conduit and cable tray configurations, a more substantial ground plane exists for source conductors to contact during cable failure. Thus, the lack of ground plane is likely the cause of the longer durations in the air drop configurations. The effects of gravity, cable type, and cable clamps/ties may also affect the failure modes among horizontal and vertical configurations. Although this hypothesis seems reasonable, it should be stated that the air drop and conduit data are scarce and additional data points may help reinforce this hypothesis.
Table 2-10. Raceway routing, duration data, AC tests
Hot Short Spurious Operation Air Conduit Tray Air Conduit Tray q1 79 18 7 179 46 9 min 28 3 1 34 23 1 median 247 48 24 261 75 30 max 320 126 1345 296 126 456 q3 295 86 65 295 100 62 mean 195 56 62 213 75 53
Air Conduit Tray
Cou
nt
0
20
40
60
80
100
120
140Fuse Clear Hot Short Spurious OperationHS/SO Possible
100%
100%
100%
0% 100%
100%
50%
50%
50%
41%
59%
51%

2-13
Figure 2-10. Raceway routing box plot, duration, AC tests
2.6 Raceway Fill Numerous cable raceway fill configurations were used during testing. To sort the data, three configuration groups were selected based on the testing configurations, namely bundles, intermediate fill, and single cable fill. Figure 2-11, Figure 2-12, and Figure 2-13 provide illustrations of the bundles, intermediate and single cable fill, respectively. Note that no tests involved cable trays or conduits filled to their maximum loading per the national electric code (NEC – NFPA 70). Even though the NEI/EPRI test configurations used a 7/c cable surrounded by three single conductors, that configuration has not been considered a bundle in this work, as it was loaded into cable trays with numerous other fill cables, as shown in Figure 2-12 and Figure 2-13.
Figure 2-11. Cable bundle arrangements (3-, 4-, 6-, & 12-cable bundles)
Figure 2-12. Cable tray fill intermediate
0
50
100
150
200
250
300
350
AIR CONDUIT TRAY AIR CONDUIT TRAY
Hot Short Spurious Operation
Seconds q1
min
median
max
q3
1345s 456s

2-14
Figure 2-13. Single layer cable fill Table 2-11 and Figure 2-14 present the failure mode data binned by raceway fill. One observation from this data is that the bundle data deviate from the intermediate and single cable arrangement in both ground faults and hot short/spurious operation occurrences. The data shows that the occurrence of a ground fault is roughly twice as likely (~52-53%) for the intermediate and single cable configurations as it is for a bundle configuration (~26%). The lower likelihood of a ground fault has a dependent effect on the occurrence of a hot short or spurious operation in the bundle configurations versus the other two configurations. One possibility is that the bundle configurations typically involve electrical cables at the top of the cable bundle and are shielded from the cable tray by fill cables that are not monitored for electrical response. Thus, for grounded circuits, which make up the majority of the test data, there is a barrier between the electrically monitored cable and the cable tray/conduit, thus reducing the ground plane influence and decreasing the likelihood of a ground fault. Again, the ground plane may influence failure mode likelihoods.
Table 2-11. Raceway fill, global approach, AC tests
Global Approach Bundle Intermediate Single Fuse Clear 13 16 16 Hot Short 37 14 15 Spurious Operation 35 11 11 HS/SO Possible 50 30 31
Figure 2-14. Raceway fill column plot, global approach, AC tests
Bundle Intermediate Single
Cou
nt
0
20
40
60Fuse Clear Hot Short Spurious OperationHS/SO Possible
100%
100%
100%70
%
74%
26% 53
%
47%
37% 52
%
48%
35%

2-15
Table 2-12 and Figure 2-15 present the hot short and spurious operation duration data separated by raceway fill categories (bundle, intermediate, and single). From this data, there is some indication that the intermediate fill duration data differs from that of the other two configurations; however, the reasoning behind this observation is unclear. One possibility is that the fill cables act as a heat sink and/or shield for the target cables from the thermal exposure, thus lowering the thermal exposure condition for the electrically monitored cables.
Table 2-12. Raceway fill, duration data, AC tests Hot Short Spurious Operation Bundle Intermediate Single Bundle Intermediate Single q1 7 18 11 8 24 7 min 1 1 1 1 1 1 median 25 54 21 30 57 21 max 453 1345 198 296 456 198 q3 62 120 63 62 111 75 mean 56 126 43 51 95 51
Figure 2-15. Raceway fill box plot, duration, AC tests
2.7 Insulation Type The insulation type parameter separates insulation materials into two polymer types, thermoset (TS) and thermoplastic (TP). Table 2-13 provides a breakdown of how insulation materials were classified by insulation type. Section 2.8 of this report provides a comparison of failure characteristics based on insulation materials. Table 2-14 and Figure 2-16 present the test data separated by cable conductor insulation type, TS and TP. A comparison of the failure modes between the TS and TP data sets indicate that there is no substantial difference in fuse clear, hot short, or spurious operations.
0
100
200
300
Bundle Intermediate Single Bundle Intermediate Single
Hot Short Spurious Operation
Seconds
q1
min
median
max
q3

2-16
Table 2-13. Breakdown of insulation material by type, AC tests
Thermoset Materials (TS) Thermoplastic Materials (TP) EPR – ethylene propylene rubber PE – polyethylene FR-Kerite – Flame Retardant Kerite™ PVC – polyvinyl chloride SR – Silicone Rubber TEF – Tefzel SR-V – Silicone Rubber Vitalink™ XLPE – cross-linked polyethylene XLPO – cross-linked polyolefin
Table 2-14. Insulation type, global approach, AC tests Global Approach TP TS Fuse Clear 17 28 Hot Short 22 45 Spurious Operation 20 38 HS/SO Possible 39 73
Figure 2-16. Insulation type column plot, global approach, AC tests Table 2-15 and Figure 2-17 present the duration data for test configurations segregated by cable conductor insulation type. Although the mean duration times are slightly higher for TP materials (73-80 seconds) than for TS materials (53-61 seconds), the inter-quartile range for the data presented in the box and whisker plot in Figure 2-17 shows no trend between TS and TP insulation types.
Table 2-15. Insulation type, duration data, AC tests
Hot Short Spurious Operation TP TS TP TS q1 5 11 6 15 min 1 1 1 1 median 23 28 24 39 max 456 1345 456 231 q3 100 72 64 81 mean 80 61 73 53
TP TS
Cou
nt
0
20
40
60
80Fuse Clear Hot Short Spurious OperationHS/SO Possible
100%
100%
44%56% 51%
38%
62%52%

2-17
Figure 2-17. Insulation type box plot, duration, AC tests
2.8 Insulation Material In the previous section, the data was segregated by insulation type. In this section, the data expanded to insulation type classifications to show how insulation materials differ. Table 2-16 and Figure 2-18 present the ground fault, hot short, and spurious operation data segregated by cable conductor insulation material.
Table 2-16. Insulation material, global approach, AC tests
TS TP EPR XLPE SR FR-Kerite PE PVC TEF Fuse Clear 11 11 3 2 9 4 4 Hot Short 23 19 1 1 9 9 4 Spurious Operation 16 19 1 1 7 9 4 HS/SO Possible 34 30 4 3 18 13 8
0
50
100
150
TP TS TP TS
Hot Short Spurious Operation
Seconds
q1
min
median
max
q3
456s 1345s 456s 231s

2-18
Figure 2-18. Insulation material column plot, global approach, AC tests As shown in the figures above, there is minimal data for silicone rubber (SR) and FR-Kerite. Thus, interpreting the results is difficult, and it will not be attempted here. Figure 2-18 indicates that the ethylene propylene rubber (EPR) material differs from the others in that there is a relatively larger gap between hot shorts and spurious operations (about 20%). The other materials show a nearly unified correlation between hot short and spurious operations based on the global analysis approach. Over 50% of the EPR data comes from the NEI/EPRI test set, and that test set-up may influence these results. However, the direct reasoning behind this difference is unclear to the authors. A comparison of the remaining cable conductor insulation materials shows similar results related to ground fault, hot short, and spurious operation likelihoods. Table 2-17, Table 2-18, and Figure 2-19 present the duration data segregated by cable insulation material. Note that SR and FR-Kerite have been removed due to a lack of data. One interesting aspect of this duration data is the small inter-quartile range for polyvinyl chloride (PVC)-insulated conductors versus the other two TP cable types, polyethylene (PE) and Tefzel™ (TEF). Both PE and TEF insulation materials show the longest average durations, which was reflected in the previous section. However, PVC insulation materials have a very short duration.
Table 2-17. Insulation material hot short only, duration data, AC tests
TS TP EPR XLPE PE PVC TEF q1 12 11 18 1 33 min 1 1 1 1 8 median 60 30 55 4 168 max 324 1345 453 32 456 q3 90 49 233 10 203 mean 64 65 117 8 158
EPR XLPE SR FR-Kerite PE PVC TEF
Cou
nt
0
10
20
30
40Fuse Clear Hot Short Spurious OperationHS/SO Possible
10
0%
10
0%
10
0%
10
0%
100
%
10
0%1
00
%
68
%4
7%
32
%
37
%6
3%
63
%
75
%2
5%
25
%
67
%3
3%
33
%
50
%
39
%50
%
31
%6
9%
69
%
50
%50
%50
%

2-19
Table 2-18. Insulation material spurious operation only, duration data, AC tests
TS TP EPR XLPE PE PVC TEF q1 12 19 27 1 33 min 2 1 3 1 10 median 62 38 55 6 126 max 198 231 296 32 456 q3 100 54 114 14 264 mean 63 50 95 10 172
Figure 2-19. Insulation material box plot, duration, AC tests
2.9 Insulation-Jacket Type Combinations The previous two sections evaluated the effects of conductor insulation type and materials. The next logical parameter to evaluate would be cable jacket materials and polymer types. Although this was done initially, a review by the electrical expert PIRT panel found that the analysis was less than useful, and it was suggested that the synergistic effects of cable jacket type and cable insulation type should be evaluated instead. This section provides that evaluation by looking at the insulation/jacket polymer type combinations available from the test data. This evaluation creates three bins, which include cables with (1) TP insulation and TP jacket, (2) TS insulation and TS jacket, and (3) TS insulation and TP jacket (mixed cable type). Table 2-19 and Figure 2-20 present the failure mode likelihood information, while Table 2-20 and Figure 2-21 reference the duration data for these configurations. The likelihood information provides little value in identifying any influence by insulation/jacket types on a particular failure mode. The duration evaluation indicates that the TS-TS cables have longer durations in general than the TP-TP and TS-TP configurations, based on the mean and the inter-quartile range.
0
100
200
300
400
EPR XLPE PE PVC TEF EPR XLPE PE PVC TEF
TS TP TS TP
Hot Short Spurious Operation
Secnods q1
min
median
max
q3
453s1345s
456s 456s

2-20
Table 2-19. Insulation-jacket type, global approach, AC tests
Global Approach TP-TP TS-TS TS-TP Fuse Clear 17 20 8 Hot Short 22 36 9 Spurious Operation 20 29 9 HS/SO Possible 39 56 17
Figure 2-20. Insulation-jacket type column plot, global approach, AC tests
Table 2-20. Insulation-jacket type, duration data, AC tests Hot Short Spurious Operation TP-TP TS-TS TS-TP TP-TP TS-TS TS-TP q1 5 12 7.6 6 16.7 14.45 min 0.2 0.4 0.2 0.2 0.6 0.8 median 23.3 43.2 24 24 47.6 27.1 max 456 1345 62.4 456 231 62.4 q3 96.6 94.6 32.9 64.2 96.3 43.05 mean 79.8 76.1 23.1 73.4 61.9 28.8
TP-TP TS-TS TS-TP
Cou
nt
0
10
20
30
40
50
60Fuse Clear Hot Short Spurious OperationHS/SO Possible 10
0%
44% 56
%
51%
36%
64%
52%
100%
100%
47%
53%
53%

2-21
Figure 2-21. Insulation-jacket type box plot, duration, AC tests
2.10 CPT Size Several differently sized control power transformers (CPTs) were used in the testing to evaluate the effects of CPT size on fire-induced circuit response. Table 2-21 provides information on the size of CPTs used during the various testing projects. At the time of this writing, the authors were not able to determine the size of the CPTs used in the NEI/EPRI testing project; thus, this data has been separated into its own bin for this review.
Table 2-21. Test project CPT size
75VA 100VA 150VA 200VA Unknown Size No CPTNEI/EPRI X X CAROLFIRE X X X X DESIREE-FIRE X X X X
Table 2-22 and Figure 2-22 provide the circuit fault modes based on variously sized CPTs used during testing. The limited number of tests (two in total) using the 75VA CPT, and the fact that one test cleared the fuse while the other resulted in a spurious operation; provide little information on this configuration’s effect on failure mode. The 100VA and 150VA data are very similar to the ~32-33% ground fault mode likelihood and the ~65-67% hot short/spurious operation likelihood. The 200VA CPT and no CPT data are also similar to the ground fault likelihood of ~40-41% and the spurious operation likelihood of ~50-53%. The NEI/EPRI data doesn’t conform to the fault mode characteristics of the SNL data, as it shows a much higher likelihood of ground faults (~59%), a lower likelihood of hot shorts (~41%), and a much lower likelihood of spurious operations (~18%). Although there are many aspects within the NEI/EPRI testing that could lead to these results, the authors are unable to pinpoint the exact cause of the differences between the NEI/EPRI test data and the other data.
0
100
200
TP‐TP TS‐TS TS‐TP TP‐TP TS‐TS TS‐TP
Hot Short Spurious Operation
Seconds
q1
min
median
max
q3
456s 1345s 456s 231s

2-22
Table 2-22. CPT size, global approach, AC tests
Global Approach 75VA 100VA 150VA 200VA
Unknown Size (EPRI)
None
Fuse Clear 1 5 10 7 10 12 Hot Short 1 10 21 10 7 18 Spurious Operation 1 10 20 9 3 15 HS/SO Possible 2 15 31 17 17 30
Figure 2-22. CPT size column plot, global approach, AC tests Table 2-23 and Figure 2-23 present the duration data segregated by CPT size. The data shows that the hot short and spurious operation duration for cases where no CPT is used is on average longer than when a CPT is used. In general, there is not much difference between the CPT size and the duration of the hot short or the spurious operation.
Table 2-23. CPT size, duration data, AC tests
Hot Short 75VA 100VA 150VA 200VA EPRI None q1 21 4 5 7 12 18 min 9 1 1 1 6 1 median 32 38 24 10 21 57 max 52 453 320 238 198 1345 q3 42 65 54 41 57 120 mean 31 67 53 47 50 108 Spurious Operation 75VA 100VA 150VA 200VA EPRI None q1 37 5 9 7 24 22 min 32 1 1 1 18 6 median 42 38 30 10 54 60 max 52 97 296 231 198 456 q3 47 62 61 42 120 114 mean 42 37 56 46 83 83
75VA 100VA 150VA 200VA Unknown Size None
Co
unt
0
10
20
30
40Fuse Clear Hot Short Spurious OperationHS/SO Possible
10
0%
100
%
10
0%6
5%
100
%
10
0%
10
0%
50
%5
0%
50
%
33
%6
7%
67
%
32
%6
8%
41
%5
9%
53
%
59%
41%
18
%
40
%6
0%
50
%

2-23
Figure 2-23. CPT size box plot, duration, AC tests
2.11 Circuit Grounding This section explores how circuit grounding affects fire-induced AC circuit response by examining the effects of having a grounded versus an ungrounded AC power supply on the fault mode likelihood during fire exposures. For grounded AC circuits that are powered from a CPT, the neutral on the secondary side of the CPT would be connected to the ground. For a grounded AC circuit not using a CPT, but connected directly to outlet power, the neutral would be grounded. The circuit ground connection for the experiments is the same ground plane associated with the cable raceway, cable trays, and conduits. Ungrounded AC circuits tested in the NRC tests are identical to the grounded circuits with the one exception of the common return of the power supply not being connected to ground. No data from circuits powered by a DC power supply has been included in this section. Table 2-24 and Figure 2-24 provide the ground fault, spurious operation, and hot short fault mode information. The data indicates that circuits that are ungrounded have a higher likelihood of experiencing a hot short (~85%) than a circuit that is grounded (~58%). Looking at the data in the fuse clearing aspects, a grounded circuit has a higher chance of clearing a fuse (~42%) than an ungrounded circuit (~15%). For the grounded configurations, 3% of the fuse clears are attributed to seven test points that used armored cable. DC testing by NEI/EPRI, Duke Energy Corporation, and the U.S. Nuclear Regulatory Commission (NRC) has shown that when an armored cable is used in a grounded circuit, the likelihood of experiencing a fuse clear failure is approximately 1.
Table 2-24. Circuit grounding, global approach, AC tests
Global Approach Un-Grounded Grounded Fuse Clear 2 41 Hot Short 11 56 Spurious Operation 11 47 HS/SO Possible 13 97
0
100
200
300
75VA
100VA
150VA
200VA
EPRI
None
75VA
100VA
150VA
200VA
EPRI
None
Hot Short Spurious Operation
Seconds q1
min
median
max
q3
453s 320s 1345s 456s

2-24
Figure 2-24. Circuit grounding column plot, global approach, AC tests Table 2-25 and Figure 2-25 present the duration data segregated by circuit grounding (grounded versus ungrounded). The data indicates that the grounded circuits have a slightly higher average duration time, but the ranges of durations shown in Figure 2-25 indicates few differences.
Table 2-25. Circuit grounding, duration data, AC tests Hot Short Spurious Operation Grounded Ungrounded Grounded Ungrounded q1 8 7 10 16 min 1 1 1 1 median 24 29 31 33 max 1345 224 456 121 q3 84 62 84 71 Mean 74 44 63 45
Figure 2-25. Circuit grounding box plot, duration, AC tests
Not Gnd Gnd
Cou
nt
0
20
40
60
80
100
120Fuse Clear Hot Short Spurious OperationHS/SO Possible
100%
15% 85
%
85%
42%
58%
48%
100%
0
40
80
120
160
Gnd UnGnd Gnd UnGnd
Hot Short Spurious Operation
Seconds
q1
min
median
max
q3
1345s 224s 456s

2-25
2.12 Wiring Configuration Wiring configuration refers to the number of sources, targets, and neutrals/grounds located within a cable of interest. This parameter evaluation does not evaluate circuit-to-conductor connection patterns within a cable. EPRI conducted an evaluation of conductor connection patterns and determined that the “source-centered” configuration resulted in the highest likelihood of a circuit experiencing a hot short. The NRC-sponsored CAROLFIRE and DESIREE-FIRE projects typically connected circuits in the source-centered configuration. Thus, there is little to no new data to provide an evaluation of conductor connection patterns. Table 2-26 provides a breakdown of the three wiring configurations and the number of source, target, and common return conductors in each configuration. A vast majority of the tests used a common configuration with two (2) energized source conductors, four (4) target conductors (passive targets, active targets, and spares), and one (1) common power supply return conductor (either a ground or a neutral, depending on circuit grounding configuration). Table 2-27 and Figure 2-26 present the spurious operation likelihood information by wiring configuration.
Table 2-26. Wiring configurations
# Sources # Targets # Returns Configuration 1 2 4 1 Configuration 2 2 3 1 Configuration 3 2 2 1
Table 2-27. Wiring configuration, global approach, AC tests
Global Approach Config. 1 Config. 2 Config. 3 Fuse Clear 41 1 3 Hot Short 65 1 1 Spurious Operation 56 1 1 HS/SO Possible 106 2 4
Figure 2-26. Wiring configuration column plot, global approach, AC tests
Config. 1 Config. 2 Config. 3
Cou
nt
0
20
40
60
80
100
120Fuse Clear Hot Short Spurious OperationHS/SO Possible
100%
39%
61%
53%
50%
50%
50%
100%
100%
75%
25%
25%

2-26
The duration data is difficult to interpret for this parameter due to the lack of data for configurations 2 and 3. Table 2-28 and Figure 2-27 present the duration data based on wiring configuration.
Table 2-28. Wiring configuration, duration data, AC tests Hot Short Spurious Operation Config. 1 Config. 2 Config. 3 Config. 1 Config. 2 Config. 3 q1 7 8 1 10 15 1 min 1 6 1 1 15 1 median 27 10 1 33 15 1 max 1345 15 1 456 15 1 q3 79 12 1 81 15 1 mean 69 10 1 61 15 1
Figure 2-27. Wiring configuration box plot, duration, AC tests
2.13 Conductor Size Control cables used in nuclear power plants (NPPs) are typically constructed with # 12 or # 14 American wire gauge (AWG) conductors. From the test data, only one AC MOV test used a cable conductor size outside of this range, and it was a 3/C # 8 AWG cable using a modified MOV circuit. To evaluate this parameter, the conductor size data was segregated into three bins, <12 AWG, 12 AWG, and 14 AWG. All of the 14 AWG data came from the NEI/EPRI testing project. The 12 AWG bin contains test data from all three test projects, and the single <12 AWG data point came from the CAROLFIRE project. Table 2-29 and Figure 2-28 present the test data segregated by conductor size in tabular and graphical format. From this data, there is no direct indication that conductor size has any effect on the hot short likelihood. However, a comparison of the spurious operation likelihood between 12 AWG and 14 AWG (NEI/EPRI tests) indicates that there is a lower likelihood for 14 AWG conductor cables to experience a spurious operation. Although this is what the data shows, the
0
20
40
60
80
100
Config. 1 Config. 2 Config. 3 Config. 1 Config. 2 Config. 3
Hot Short Spurious Operation
Seconds
q1
min
median
max
q3
1345s 456s

2-27
authors believe that some other parameter is influencing this outcome, possibly the EPRI CPT circuit data, which showed low spurious operation probability.
Table 2-29. Conductor size, global approach, AC tests
Global Approach <12 AWG 12 AWG 14 AWG Fuse Clear 1 30 14 Hot Short 0 47 20 Spurious Operation 0 43 15 HS/SO Possible 1 77 34
Figure 2-28. Conductor size column plot, global approach, AC tests Table 2-30 and Figure 2-29 present the duration data based on the conductor size bins. The data indicates that the smaller 14 AWG conductor cables have a longer duration (60 second median) than 12 AWG conductor-sized cables (24-27 second median).
Table 2-30. Conductor size, duration data, AC tests Hot Short Spurious Operation <12 AWG 12 AWG 14 AWG <12 AWG 12 AWG 14 AWG q1 - 7 15 - 8 18 min - 1 1 - 1 6 median - 24 60 - 27 60 max - 453 1345 - 296 456 q3 - 55 120 - 56 120 mean - 52 115 - 49 94
<12 AWG 12 AWG 14 AWG
Cou
nt
0
20
40
60
80
100Fuse Clear Hot Short Spurious OperationHS/SO Possible
100%
100%
0% 0%
39%
61%
56%
100%
100%
41% 59
%
44%

2-28
Figure 2-29. Conductor size box plot, duration, AC tests
2.14 Water Based Fire Suppression Effects on AC Circuit Failures The effect of water spray on thermally fragile cables was only explored in a minimal set of tests. During the NEI/EPRI tests, a single sprinkler head was located in the ceiling corner of the fire test enclosure above the cable tray bend in the general fire location. The sprinkler was manually activated, and it was not used in every test. There were also a few tests in which manual water suppression was applied using a garden hose. In CAROLFIRE, a single open head sprinkler was installed near the ceiling center of the intermediate-scale test structure, on a pendant about 150 mm (6 in.) long. The water flow was manually initiated using a small electric pump and only initiated in those tests where one or more of the cables had not experienced electrical failure (silicone rubber). No water suppression was used in the DESIREE-FIRE testing. Water spray was observed to cause spurious operations in only one NEI/EPRI test, Test 3. In this case, a spurious operation did coincide with water spray, and persisted for approximately 24 seconds before a fuse clear occurred. This test cable was located at the center of the top layer of a two-layer cable fill test. Figure 2-30 provides a voltage plot of test circuit 3 for NEI/EPRI Test #3, showing the spurious operation on the target conductor, Wire #4 but only hot shorts on non-spurious operation target Wire #5 and Wire #7.
0
40
80
120
160
200
<12 AWG 12 AWG 14 AWG <12 AWG 12 AWG 14 AWG
Hot Short Spurious Operation
Seconds
q1
min
median
max
q3
453s 1345s 296s 456s

2-29
Figure 2-30. NEI/EPRI test 3 voltage plot - water spray In Test 10 of the EPRI program, water spray was applied during an ongoing spurious operation. The application of water terminated the spurious operation (cleared for 42 seconds), followed by a brief operation of a target conductor (6 seconds), followed by a fuse clear failure. These electrical interactions are shown in Figure 2-31. In two other tests, water spray showed marginal effects on the cable electrical response. In one case, an induced voltage had built upon the spare conductor. When water spray was initiated, the induced voltage was rapidly lost. In the other case, very minimal current spikes (~0.05 amps) were observed in the 1/C cables, coincident with water application. The reader is encouraged to refer to the EPRI test report for more information.
Time (s)
4500 4520 4540 4560 4580 4600 4620 4640 4660
Vol
tage
(V
)
-20
0
20
40
60
80
100
120
1407/C Wire #1 7/C Wire #2 7/C Wire #4 7/C Wire #5 7/C Wire #7
Application of Water

2-30
Figure 2-31. NEI/EPRI test 10 voltage response following water spray The CAROLFIRE intermediate-scale tests used the water sprinkler in five tests (IT5, IT6, IT9, IT10, IT13). In all of these tests, the only cable types operating at the time of manual sprinkler activation were the Silicone Rubber or Vita-Link cables. In one instance, the sprinkler activation caused an SR cable to fail in a manner that resulted in a spurious operation. All other cables exposed to the water spray were connected to the insulation resistance measurement system. Of those seven cables, six resulted in a short circuit of less than 1,000 ohms5. A single cable experienced a short circuit of less than 1,000 ohms, followed momentarily by some insulation resistance recovery above 1,000 ohms. Another complicating matter for evaluating water spray effects on cable response is that water suppression was applied near the end of the testing, and many of the circuits had already experienced fuse clear circuit failures. Although there is data available on the effects of water spray on thermally fragile cables, an understanding of the cables’ response to water at earlier stages of cable damage is unavailable at this time.
5 1,000 ohms was used as the insulation resistance threshold for failure of a cable. Insulation resistance measurements under 1,000 ohms indicate that insulation is not capable of performing its design function.
Time (s)
4400 4600 4800 5000 5200 5400 5600 5800
Vo
ltage
(V
)
0
20
40
60
80
100
120
1401/C Wire #1 1/C Wire #2 1/C Wire #3
Water Applied

2-31
2.15 AC Circuit Concurrence of Hot Short-Induced Spurious Operations
Concurrence of hot short-induced spurious operations, as discussed in this report, occurs when more than one circuit (or cable) experiences individual spurious operations at the same time (i.e., concurrence). The AC test circuit configurations eliminated the possibility of a single cable causing multiple concurrent hot short-induced spurious operations. Thus, when reviewing the test results, two cables must experience a hot short-induced spurious operation at the same time to be considered concurrent. In all of the AC testing to date, the concurrence of spurious operations or hot shorts has not been observed within any individual test. In some cases, the concurrence between two circuits was missed by only a few seconds, but, given the strict definition of concurrent hot short-induced spurious operations, this phenomenon was not observed in any AC circuit testing. There are several reasons that this phenomenon was not observed in testing. First, only a limited number of cables/circuits can be instrumented electrically during each test. The NRC/SNL small-scale radiant testing was limited to two electrically instrumented cables per test, while the larger scale testing (both industry- and NRC-sponsored) was limited to four surrogate AC MOV circuits for the AC testing. Secondly, the exposure conditions for the majority of the test were fairly intense, as the tests were designed to cause failure within 10-30 minutes for a risk-significant scenario. These intense exposures resulted in the cables quickly cascading through failure modes, as well as shorter spurious operation durations. Thirdly, a variety of cable types were tested (especially in the NRC/SNL testing), and each cable type has a unique thermal failure threshold; thus, even with fairly uniform exposure conditions for multiple cables, the failure times may never align in the testing because of differing cable thermal failure thresholds. Lastly, the larger scale testing allowed for a variety of thermal exposure conditions due to the locations of the cables relative to the heat source and their locations within a tray loaded with cables. For instance, a cable located on the bottom row of cables in an open ladder-back cable tray in a fire plume will be exposed to more intense thermal conditions than a cable in the same cable tray, but insulated from the fire conditions by other cables. During a PIRT panel meeting, it was suggested that the NRC/SNL tests could be combined based on exposure location in the intermediate-scale test apparatus to evaluate their likelihood of concurrence. As the thermal exposures were kept fairly constant among the NRC/SNL intermediate-scale tests (~200kW), this concept was explored. To complete this comparison, the intermediate-scale test data from CAROLFIRE and the intermediate-scale AC test data from DESIREE-FIRE were combined and separated by location. As shown in Figure 2-32, the locations were labeled differently between projects, so care was taken to ensure that labeling differences did not lead to binning errors. Symmetrical cable locations were grouped together as one location because of identical exposure conditions. For example, in the CAROLFIRE configuration in Figure 2-32(a), locations E and G were grouped together, as well as locations C and E of the DESIREE-FIRE configuration in Figure 2-32(b). However, locations C and F of CAROLFIRE and locations B and D of DESIREE-FIRE were not grouped together because the plume transition zone near the top location (F in CAROLFIRE, D in DESIREE-FIRE) likely has different exposure conditions than the location directly below. Trays grouped by location would be exposed to the same fire conditions, heat release rate, and location relative to the wall. The data from all AC NRC tests was then analyzed to find times when multiple hot short-induced spurious operations occurred in the

2-32
same physical location at the same time (i.e., concurrence). The data was also processed to account for the electrical and mechanical interlocks that would typically be used in NPP applications, but were not used during testing. For instance, the MOV starters have two active targets that, if energized by a fire-induced hot short, would be classified as hot-short induced spurious operations by the testing protocol. In reality, however, only one MOV contactor can be energized at a time. Thus, the data was post-processed to represent circuit response in NPP applications where the interlocks would be used.
(a)
(b)
Figure 2-32. (a) CAROLFIRE and (b) DESIREE-FIRE intermediate-scale exposure location
designation Analyzing the data in this manner confirms that concurrent hot short-induced spurious operations were observed in CAROLFIRE/DESIREE-FIRE location A and CAROLFIRE location G/E (DESIREE-FIRE location C/E), “upper hot gas layer,” when the individual test data was grouped together. Conductors C5 and C6 are the active targets in the AC MOV circuits, which represent spurious operations/hot short targets. The draft version of this report contained concurrence of conductors C4 and C8, which are the passive targets and represent only hot short targets. A public comment noted that the inclusion of the hot short data made the results difficult to interpret and provided little value in evaluating multiple spurious operations. As such, the data for conductors C4 and C8 has been removed from the plots. At location A, two sets of concurrence were identified, as shown in Figure 2-33 and Figure 2-34. The blue diamonds in these figures indicate the start of a hot short-induced spurious operation, the red squares indicate the end, and the line between them represents the duration. A concurrence occurs when hot shorts within different cables have overlapping times. The information on the horizontal axis indicates:
test series (C = CAROLFIRE), testing scale (IT = Intermediate, P = Penlight), test number, circuit number (CK#), and the conductor that experienced the hot short (C#).

2-33
Figure 2-33. Concurrent hot shorts - Location A - 4 cables Figure 2-33 shows the first set of concurrences to be identified, which included four cables, none of which were the same cable type (XLPO/XLPO6, EPR/CPE, TEF/TEF, and XLPE/PVC). The data set representing location A consisted of 25 test cables, which resulted in 17 spurious operations. Of the 17 operations involving the four cables, there were 10 instances where two cables experienced hot short-induced spurious operations concurrently. Five of these 10 instances involved three cables. Concurrences that only involve spurious operation targets are identified in Table 2-31, along with the durations of these concurrences. In this table, the test circuits are identified on the vertical and horizontal axes, and any concurrences are identified by a number that represents the duration (in seconds) of the concurrence. This table also presents the start and stop times for the individual circuit spurious operations at the bottom of the table. In Table 2-31, for example, a value of 2.6 in the top row indicates that test “C-IT-6-CK4-C5” and test “C-IT-7-CK2-C5” experienced a concurrent spurious operation for 2.6 seconds. This value can be confirmed by looking at the individual circuit spurious operation start and stop times: “C-IT-6-CK4-C5” experienced a spurious operation starting at 268.8 seconds and ending at 272.8 seconds, while “C-IT-7-CK2-C5” experienced a spurious operation starting at 250.4 seconds and ending at 271.4 seconds. Thus, from 268.8 to 271.4 seconds, both circuits experienced spurious operations. It should also be pointed out that the table is presented such that the values to the right of the diagonal shaded boxes mirror the values to the left of the diagonal shaded boxes. The last column in the table presents the number of cables involved in concurrent operations. For instance, the top row indicates that three cables were involved in concurrent spurious operations (SOs). These three cables were identified as “C-IT-6-CK4-C5,” “C-IT-7-CK2-C5,” and “C-IT-11-CK4-C6.”
6 A typical convention for identifying a cable’s insulation and jacket materials is to write the insulation material first, followed by the jacket material. For example, XLPE/PVC is a cross-link polyethylene (XLPE) insulated cable with a polyvinyl chloride (PVC) jacket.
220.0
230.0
240.0
250.0
260.0
270.0
280.0
Time (s)
start
stop

2-34
Table 2-31. Concurrent spurious operation durations – test Location A
(concurrence time shown in seconds)
Tes
t ID
C-I
T-6
-CK
4-C
5
c-IT
-6-C
K4-
C6
C-I
T-7
-CK
2-C
5
C-I
T-7
-CK
2-C
6
C-I
T-1
0-C
K3-
C5
C-I
T-1
1-C
K4-
C5
C-I
T-1
1-C
K4-
C6
C-I
T-1
1-C
K4-
C5
C-I
T-1
1-C
K4-
C6
# of
con
curr
ent
cabl
e S
Os
Test ID C-IT-6-CK4-C5 - 2.6 - - - - - 4 3C-IT-6-CK4-C6 - 4.8 - - - - - 4.8 3C-IT-7-CK2-C5 2.6 4.8 - - 2.8 1 2.8 10.8 3C-IT-7-CK2-C6 - - - 7.8 7.8 - - - 3C-IT-10-CK3-C5 - - - 7.8 - - - - 2
C-IT-11-CK4-C5 - - 2.8 7.8 - - - - 2C-IT-11-CK4-C6 - - 1 - - - - - 2C-IT-11-CK4-C5 - - 2.8 - - - - - 2C-IT-11-CK4-C6 4 4.8 10.8 - - - - - 3
Start Time 268.8 264.0 250.4 227.2 225.0 242.6 253.2 254.2 260.6 Stop Time 272.8 268.8 271.4 250.4 235.0 253.2 254.2 257.0 276.0
Duration 4.0 4.8 21.0 23.2 10.0 10.6 1.0 2.8 15.4 Figure 2-34 presents the second set of concurrences that occurred in location A. Here, again, different cable types were involved (XLPE/PVC and PE/PVC). There is only one instance in which multiple spurious operations occurred concurrently. Here circuit three of Test 7 experiences a spurious operation at the same time as circuit two of Test 8.
Figure 2-34. Concurrent hot shorts - Location A - 2 cables
375
380
385
390
395
400
405
410
415
C‐IT‐7‐CK3 c5 C‐IT‐8‐CK2 c5
Time (s)
start
stop

2-35
The other instance in which concurrent hot shorting was identified in this analysis was in the upper hot gas layer exposure locations (CAROLFIRE location G/E, DESIREE-FIRE location C/E). In these locations the data represents 20 test cables. Of these 20 cases, 12 spurious operations occurred, with 14 instances of concurrence. The only set of concurrences included four cables, of which three were of the same construction (PE/PVC) and the other was PVC/PVC. All were of the thermoplastic polymer variety. Figure 2-35 presents a plot of the hot short-induced spurious operation durations, and Table 2-32 provides a listing of the circuits involved in spurious operation concurrences and associated durations. The durations of these concurrences are longer than those in Location A, likely due to the difference in thermal exposure conditions.
Figure 2-35. Concurrent hot shorts - upper hot gas layer - 4 cables
625
675
725
775
825
875
925
975
1025
1075
1125
C‐IT‐11‐CK2 c5
C‐IT‐12‐CK2 c6
C‐IT‐9‐CK4 c5
C‐IT‐9‐CK4 c6
C‐IT‐10‐CK1 c5
C‐IT‐10‐CK1 c6
C‐IT‐10‐CK1 c6
C‐IT‐10‐CK1 c6
Time (s)
stop
start
(0.8s)

2-36
Table 2-32. Concurrent spurious operations – upper hot gas layer
Tes
t ID
C-I
T-1
1-C
K2-
C5
C-I
T-9
-CK
4-C
5
C-I
T-1
2-C
K2-
C6
C-I
T9-
CK
4-C
6
C-I
T10
-CK
1-C
6
C-I
T-1
0-C
K1-
C6
C-I
T-1
0-C
K1-
C5
C-I
T-1
0-C
K1-
C6
# of
con
curr
ent
cabl
e S
O’s
Test ID C-IT-11-CK2-C5 38.2 97.4 47.4 0.8 31 10.8 - 4 C-IT-9-CK4-C5 38.2 25.8 - - - - - 3 C-IT-12-CK2-C6 97.4 25.8 47.4 0.8 53 81.4 46.4 4 C-IT-9-CK4-C6 47.4 - 47.4 20.4 6.8 - - 4 C-IT-10-CK1-C6 0.8 - 0.8 20.4 - - - 4 C-IT-10-CK1-C5 31 - 53 6.8 - - - 4 C-IT-10-CK1-C6 10.8 - 81.4 - - - - 3 C-IT-10-CK1-C6 - - 46.4 - - - - 2
Start Time (s) 658.0 776.2 788.6 814.4 841.4 855.0 875.2 910.2 Stop Time (s) 886.0 814.4 1084.8 861.8 842.2 908.0 956.6 956.6
Duration (s) 228.0 38.2 296.2 47.4 0.8 62.0 81.4 46.4 The rest of the locations showed no instances of concurrence. Four tests were run using CAROLFIRE location B/D, ten tests were run using CAROLFIRE location C (DESIREE-FIRE location B), and fourteen tests were run using CAROLFIRE location F (DESIREE-FIRE location D). None of these tests produced any instances of hot short concurrences. Section 4.15 provides the concurrent hot shorting for the dc circuits tested in the DESIREE-FIRE project.

3-1
3. INTER-CABLE – ALTERNATING CURRENT CIRCUITS The evaluation of circuit failure results becomes increasingly complex when more than one cable is involved in the electrical failure. Cable-to-cable interactions are referred to as “inter-cable,” and, for an inter-cable hot short to occur, a source conductor in one cable must come into electrical contact with a target conductor in a different cable. The number of recorded cable-to-cable interactions from the AC tests is significantly lower than the number of intra-cable interactions (within a cable). Thus, testing to date has provided only a small pool of data from which to draw conclusions about the effects of parameters on the likelihood and duration of these inter-cable interactions. Even with these limitations, there are some conclusions that can be drawn from the data. These conclusions are presented below and may provide some insight into the influencing factors of inter-cable electrical interactions. This section will not systematically evaluate parameter effects on the fire-induced circuit failure response, as was done in the previous section for the intra-cable evaluation. All of the major testing projects (Electric Power Research Institute/Nuclear Energy Institute (NEI/EPRI), Cable Response to Live Fire (CAROLFIRE), and Direct Current Electrical Shorting In Response to Exposure Fire (DESIREE-FIRE)) provide at least two test configurations to evaluate the occurrence of inter-cable failures. In most cases, the voltage and current measurements from the simulated circuit could be evaluated to determine whether any inter-cable interactions occurred. In addition, separate circuit configurations were used in all test programs to specifically focus on understanding, and, in some cases, stacking the odds to trigger inter-cable interaction. The following provides a description of how the tests were conducted and what results were achieved. Figure 3-1 provides an illustration of how the cables were oriented within a cable tray for the inter-cable tests during the NEI/EPRI program. Cables 1-3 were monitored for electrical response, with cables 1 and 3 containing both energized source conductors and target conductors, while cable 2 only contained target conductors. The target conductors were connected to burden resistors to simulate a load. The black cables in Figure 3-1 represent fill cables that were not monitored for electrical response, but were used as a buffer between the electrically monitored cables and the metallic cable tray. These fill cables likely reduced the likelihood of an energized source coming in contact with the ground plane and causing a fuse clear failure.
Figure 3-1. NEI/EPRI inter-cable test tray fill Two NEI/EPRI tests used this configuration, and both tests showed similar results. The voltage and current readings indicate that the cables failed internally prior to any external interactions between cables. Since this configuration didn’t represent system circuits used in plants, it is

3-2
difficult to determine whether or not inter-cable interactions would have caused hot shorts of sufficient quality to result in a component repositioning in an actual plant system. The CAROLFIRE inter-cable test set-up was slightly different in that all of the conductors in two multi-conductor cables were energized as sources and a third multi-conductor cable had all of its conductors connected to a motor starter contactor, a target. Thus, the CAROLFIRE circuit could detect inter-cable interactions, but was unable to recognize when conductors internal to the multi-conductor cables had failed. The CAROLFIRE inter-cable test set-up is shown in Figure 3-2.
Figure 3-2. CAROLFIRE inter-cable test tray fill Twelve inter-cable circuit trials were used in a total of four intermediate-scale fire tests during CAROLFIRE. Three of these circuits were left ungrounded, resulting in no possibility for the circuit fuse to clear. Because of this configuration, hot shorts/spurious operations were inevitable, and, in all three instances, prolonged spurious operations did occur. Of the remaining nine test circuits, seven experienced fuse clear faults. The remaining two circuits, both from test IT-3, experienced some inter-cable induced voltages, although this was not sufficient to cause a spurious operation. The CAROLFIRE inter-cable failure data does not provide a strong basis for understanding the inter-cable shorting phenomenon. In actual fires involving energized control cables for safety significant systems, there is a competing factor between the conductors internal to the failing cable and any inter-cable interactions. It is unfortunate that the CAROLFIRE results could not provide more insights into this competitive factor. As discussed above, all three testing programs used surrogate motor-operated valve (MOV) circuits to monitor cable electrical response during a fire test. A review of this data can provide information on how the cable fails internally versus failing externally. However, before looking at this data, it is important to understand some of the differences between the NEI/EPRI and U.S. Nuclear Regulatory Commission/Sandia National Laboratories (NRC/SNL) test arrangements. First, the industry tests used a configuration in which a 7/C cable was surrounded by three individual 1/C insulated conductors (without jacketing), zip-tied to the 7/C cable. This configuration is shown in Figure 3-3. The 7/C cable contained source, target, spare, and neutral conductors, while the exterior single conductors were either an energized source or an active target. All energized conductors were powered by the same source (wall power or control power transformer (CPT)). It should be noted that this configuration is not commonly found in U.S. nuclear power plants (NPPs). If single conductor cables are used, they will typically have a protective jacket over the single conductor insulation. The NEI/EPRI testing simply used an unjacketed insulated conductor that was stripped from a multi-conductor cable. That said, the results are still valuable and may be considered more conservative in that this configuration may

3-3
increase the likelihood of inter-cable interactions because of the lack of jacket and the use of cable ties to keep the single conductors in close proximity to the 7/C cable.
Figure 3-3. NEI/EPRI cable configuration The NEI/EPRI test results indicate that of the 17 test circuit device spurious operations that experienced inter-cable spurious operation(s), seven were between the 1/C cables. In four cases, the 7/C cable acted as a source to a 1/C cable target, and, in six cases, a 1/C cable energized a target conductor in a 7/C cable. Table 3-1 presents the results of the NEI/EPRI inter-cable results.
Table 3-1. NEI/EPRI inter-cable failure characteristics
Test ID Source Cable
(#/C, wire, insulation)Target Cable
(#/C, wire, insulation)Duration (seconds)
Test 3, Circuit 1, Device 3 1/C – S1 (TS) 1/C – S3 (TS) 6 Test 4, Circuit 2, Device 3 1/C – S2 (TP) 1/C – S3 (TP) 66 Test 4, Circuit 3, Device 3 1/C – S2 (TP) 1/C – S3 (TP) 342 Test 4, Circuit 4, Device 1 1/C – S1&S2 (TP) 7/C – W5 (TP) 54 Test 4, Circuit 4, Device 2 1/C – S1&S2 (TP) 7/C – W4 (TP) 12
Test 4, Circuit 4, Device 3 7/C – W2 (TP) &
1/C – S2 (TP) 1/C – S3 (TP) 318
Test 6, Circuit 1, Device 1 1/C – S2 (TP) 7/C – W5 (TP) 192 Test 6, Circuit 1, Device 2 1/C – S2 (TP) 7/C – W4 (TP) 282 Test 6, Circuit 1, Device 3 1/C – S2 (TP) 1/C – S3 (TP) 492 Test 6, Circuit 2, Device 3 7/C – W2 (TP) 1/C – S3 (TP) 606 Test 8, Circuit 1, Device 3 1/C – S2 (TS) 1/C – S3 (TS) 18 Test 9, Circuit 4, Device 3 1/C – S2 (TS) 1/C – S3 (TS) 6 Test 10, Circuit 2, Device 3 1/C – S1 (TS) &
7/C – W2 (TS) 1/C – S3 (TS) 804
Test 10, Circuit 4, Device 3 1/C – S2 (TS) 1/C – S3 (TS) 486 Test 12, Circuit 3, Device 3 7/C – W1 (TS) 1/C – S3 (TS) 12 Test 17, Circuit 1, Device 1 1/C – S2 (TP) 7/C W5 (TP) 66 Test 17, Circuit 1, Device 2 1/C – S2 (TP) 7/C W4 (TP) 66 In the CAROLFIRE testing, multi-conductor cables were connected to individual surrogate circuit diagnostic units (SCDUs) and arranged in 3- or 6-cable triangular bundles. The results from the CAROLFIRE SCDU testing where inter-cable interactions were observed are shown in

3-4
Table 3-2. CAROLFIRE did not use NEI configuration. All inter-cable interactions were from adjacent cables.
Table 3-2. CAROLFIRE AC inter-cable failure characteristics
Test ID Source Cable (Circuit, Insulation)
Target Cable (Circuit, Insulation)
Duration (seconds)
Test IP 4, Circuit 1* Circuit 2, TP 7/C – W6, TP 1 Test IP 4, Circuit 3* Circuit 2, TP 7/C – W5 & W6, TP 1 Test IP 4, Circuit 4 Circuit 2, TP 7/C – W6, TP 1 Test 1, Circuit 4* Circuit 1, TS 7/C – W4 (HS), TS 1 Test 7, Circuit 2* Circuit 3, TS 7/C – W4 (HS), TS 1 Test 8, Circuit 2* Circuit 3, TS 7/C – W4 (HS), TP 44
* Indicates inter-cable interactions occurring after the circuit fuse cleared.
In the CAROLFIRE project, the insulation resistance measurement system (IRMS) was used during Penlight radiant exposure tests and during the intermediate-scale testing. The IRMS can detect the onset of inter-cable shorting behavior, can measure the relative timing of inter-cable shorting versus both intra-cable shorting and shorts to the external ground, and can measure the duration of inter-cable shorts (i.e., how long an inter-cable conductor-to-conductor short remains independent of the external ground) [NUREG/CR-6931, V1]. The CAROLFIRE tests did detect some cases of inter-cable shorting between thermoset (TS) cables; however, only one of these cases involved a clear-cut case of a sustained inter-cable short circuit between two TS cables (IRMS in Test IT-1) that could have led to a spurious operation. In other cases, the interactions were secondary or tertiary failure modes for at least one of the two involved cables. However, the test data clearly showed that TS-to-TS interactions are plausible, although the likelihood of risk-relevant interactions appears to be low, especially in comparison to the likelihood of intra-cable interactions leading to spurious operation [NUREG/CR-6931].

4-1
4. INTRA-CABLE – DIRECT CURRENT CIRCUITS All of the fire-induced DC circuit failure data and information available for the analysis documented in this report came from the U.S. Nuclear Regulatory Commission (NRC)–sponsored Direct Current Electrical Shorting In Response to Exposure Fire (DESIREE-FIRE) project. A substantial amount of effort was required to convert the dc data into a usable format for this work. The formatting was handled by Sandia National Laboratories (SNL), and led to identification of several errors documented in the draft test report for the DESIREE-FIRE project. These errors were subsequently corrected in the final version of NUREG/CR-7100, “Direct Current Electrical Shorting In Response to Exposure Fire (DESIREE-FIRE): Test Results.” The only dc test data removed from the analysis were instances where the cable did not reach a failure point at the end of the test. The majority of these cases were for the Kerite cable testing, where it was important to stop the test prior to cable failure to evaluate the physical damage to the cable materials. Tests excluded from further analysis in this report included the following:
D-P-27-MOV1 D-P-27-MOV2 D-P-26-SOV1 D-P-26-SOV2
D-P-38-SOV1 D-P-38-SOV2 D-IT-P1-1-Vlv D-IT-P1-LargeCoil
Section 4.1 details the specific set points used to clean up the data and a brief description of the five dc circuits. The rest of the section provides failure mode likelihood and duration information based on specific parameters, as was done for the AC test data.
4.1 DC Data Analysis Approach The analysis for the dc is discussed in this section. The data that was analyzed corresponds to the experiments performed under the DESIREE-FIRE testing program [5]. For the intra-cable experiments, there were five different circuit types (1-in Valve, Large Coil, motor-operated valve (MOV), solenoid-operated valve (SOV), and switchgear (SWGR)); the analysis for each will be discussed here in detail. The dc data required additional review and processing to ensure a consistent method of determining the specific failure points of concern. To accomplish this, threshold voltage levels were identified for specific conductors that corresponded with a specific failure mode. This information is presented below. These voltage levels were then used on the specific circuit data to generate state diagrams, which present a clear view of the circuit status, gleaned from the noisy data signals collected during testing. It was from these state diagrams that the failure mode timelines and duration information were imported into the database. Each circuit is discussed below, along with the criteria for evaluating each conductor for specific failure modes. 4.1.1 1-inch valve control circuit The 1-inch valve circuit that was tested is shown below in Figure 4-1. As seen in the figure, seven conductors were monitored during the test. From these seven conductors, the electrical measurement data were analyzed based on the information displayed in Table 4-1 and Table 4-2 for the penlight and intermediate-scale tests, respectively. There is a slight difference in the logic for the penlight and intermediate-scale tests, due to the fact that the switches (normally
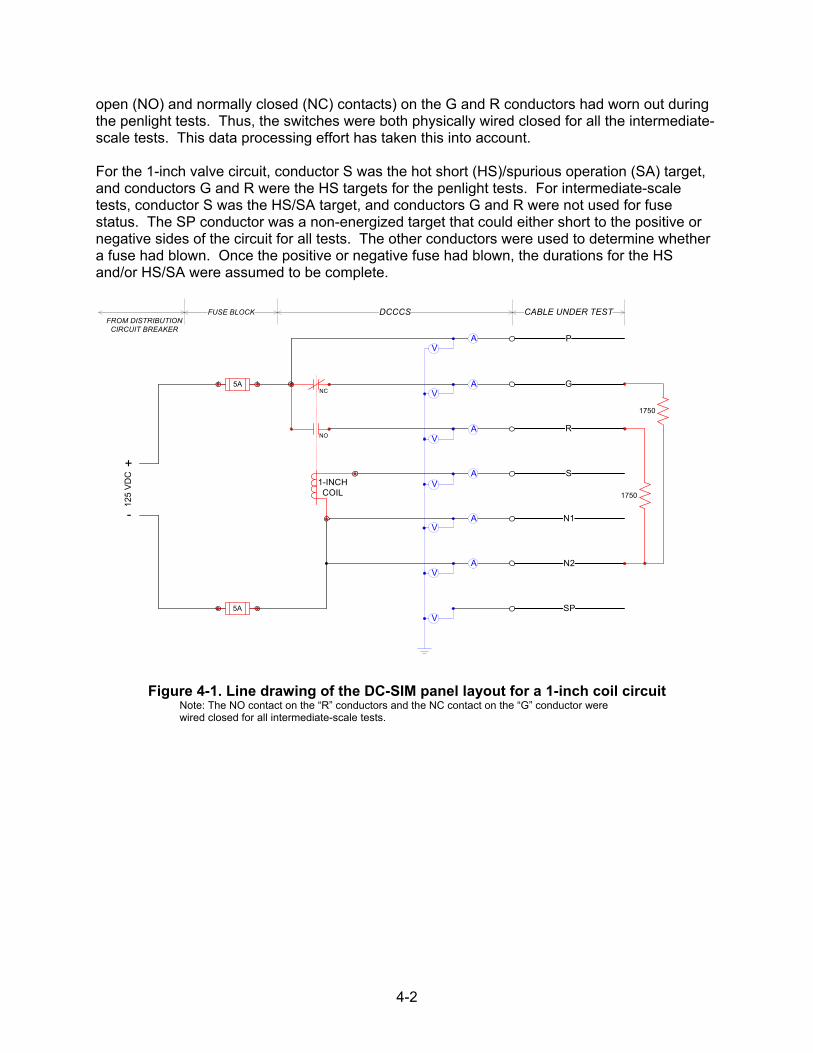
4-2
open (NO) and normally closed (NC) contacts) on the G and R conductors had worn out during the penlight tests. Thus, the switches were both physically wired closed for all the intermediate-scale tests. This data processing effort has taken this into account. For the 1-inch valve circuit, conductor S was the hot short (HS)/spurious operation (SA) target, and conductors G and R were the HS targets for the penlight tests. For intermediate-scale tests, conductor S was the HS/SA target, and conductors G and R were not used for fuse status. The SP conductor was a non-energized target that could either short to the positive or negative sides of the circuit for all tests. The other conductors were used to determine whether a fuse had blown. Once the positive or negative fuse had blown, the durations for the HS and/or HS/SA were assumed to be complete.
Figure 4-1. Line drawing of the DC-SIM panel layout for a 1-inch coil circuit Note: The NO contact on the “R” conductors and the NC contact on the “G” conductor were wired closed for all intermediate-scale tests.
P
G
R
S
N1
N2
SP
A
A
A
A
A
V
V
V
V
V
V
V5A
1-INCHCOIL
1750
1750
+
-
125
VD
C
DCCCS CABLE UNDER TESTFROM DISTRIBUTION
CIRCUIT BREAKER
FUSE BLOCK
5ANC
NOA

4-3
Table 4-1. Analysis logic for 1-in valve Penlight tests
Conductor Spurious Operation (Status 2)
Hot Short (Status 1)
Normal (Status 0)
Fuse Clear or Spare Conductor Short (Status -1)
P VPModified>100V VPModified<10V [Positive Fuse Clear]
G S=2 & VGModified>100V [Hot Short]
VGModified>100V
R S≠2 & VRModified>100V [Hot Short]
VRModified<10V
S VSModified>48 V [Hot Short-Induced Spurious Operation]
VSModified<48 V
N1 VN1Modified<10V VN1Modified>100V [Negative Fuse Clear]
N2 VN2Modified<10V VN2Modified>100V [Negative Fuse Clear]
SP VSp Raw >30V [Short to Positive]
VSpRaw ~ 0V
VSp Raw <-30V [Short to Negative]
Raw – voltage reference is ground Modified – voltage level is approximately battery negative
Table 4-2. Analysis logic for 1-in valve intermediate-scale tests
Conductor Spurious Operation (Status 2)
Hot Short (Status 1)
Normal (Status 0)
Fuse Clear or Spare Conductor Short (Status - 1)
P VPModified>100V VPModified<10V [Positive Fuse Clear]
G VGModified>100V VGModified<10V [Positive Fuse Clear]
R VRModified>100V VRModified<10V [Positive Fuse Clear]
S VSModified>48 V [Hot Short-Induced Spurious Operation]
VSModified<48 V
N1 VN1Modified<10V VN1Modified>100V [Negative Fuse Clear]
N2 VN2Modified<10V VN2Modified>100V [Negative Fuse Clear]
SP VSp Raw >30V
[Short to Positive] VSpRaw ~ 0V
VSp Raw <-30V [Short to Negative]

4-4
4.1.2 Large coil control circuit The large coil circuit that was tested is shown below in Figure 4-2. As seen in the figure, there are seven conductors that were monitored during the test. For those seven conductors, the electrical measurement data was analyzed based on the information displayed in Table 4-3 for all tests. For this, circuit conductor S was the HS/SA target, and conductor R was an HS target for all tests. The SP conductor was a non-energized target that could either short to the positive or negative sides of the circuit for all tests. The other conductors were used to determine whether a fuse had blown. Once the positive or negative fuse had blown, the durations for the HS and/or HS/SA were assumed to be complete.
Figure 4-2. Line drawing for the DC large coil circuit
P
G
R
S
N1
N2
SP
A
A
A
A
A
V
V
V
V
V
V
V10A
LARGECOIL
1750
1750
+
-
125
VD
C
DCCCS CABLE UNDER TESTFROM DISTRIBUTION
CIRCUIT BREAKER
FUSE BLOCK
10A

4-5
Table 4-3. Analysis logic for large coil Penlight and intermediate-scale tests
Conductor Spurious Operation (Status 2)
Hot Short (Status 1)
Normal (Status 0)
Fuse Clear or Spare Conductor Short (Status - 1)
P VPModified>100V VPModified<10V [Positive Fuse Clear]
G VGModified>100V VGModified<10V [Positive Fuse Clear]
R VRModified>60V [Hot Short]
VRModified<60V
S
VSModified>60 V [Hot Short-Induced Spurious Operation]
VSModified<60 V
N1 VN1Modified<10V VN1Modified>100V [Negative Fuse Clear]
N2 VN2Modified<10V VN2Modified>100V [Negative Fuse Clear]
SP VSp Raw >30V
[Short to Positive] VSpRaw ~ 0V
VSp Raw <-30V [Short to Negative]
4.1.3 dc MOV control circuit The MOV circuit that was tested is shown below in Figure 4-3. As seen in the figure, there are seven conductors that were monitored during the test. Those seven conductors’ electrical measurement data was analyzed based on the information displayed in Table 4-4 for all tests. Each test had two MOV circuits designated as MOV1 and MOV2. Conductors YO1 and YC1 for MOV1 were HS/SA and HS targets. With MOV1, there were mechanical interlocks that caused YC1 to lock out if YO1 was engaged; thus, if YO1 had an HS/SA while YC1 got an HS, YC1 would not engage. Conductors G and R were HS targets. The SP conductor was a non-energized target that could short to either the positive or the negative side of the circuit for all tests. The other conductors were used to determine whether a fuse had blown. Once the positive or negative fuse had blown, the durations for the HS and/or HS/SA were assumed to be complete.

4-6
Figure 4-3. Line drawing for DC MOV circuit
Table 4-4. Analysis logic for MOV Penlight and intermediate-scale tests
Conductor Spurious Operation (Status 2)
Hot Short (Status 1)
Normal (Status 0)
Fuse Clear or Spare Conductor Short (Status - 1)
G VYO1Modified>100V
& VGModified>100V
VGModified>100V
N VNModified<10V VNModified>100V
[Negative Fuse Clear]
P VPModified>100V VPModified<10V [Positive Fuse Clear]
R VYO1Modified>100V
& VRModified>100V VRModified>100V
YC1 (MOV1) VYC1Modified>89.3V & IYC1>0.06A
YO1=2 & VYC1Modified>89.3V
VYC1Modified<10V & VYO1Modified<10V
YC1 (MOV2) VYC1Modified>50.7V & YO1 ≠ 2
YO1=2 & VYC1Modified>50.7V
VYC1Modified<10V & VYO1Modified<10V
YO1 (MOV1) VYO1Modified>29.0V & IYO1>0.06A
YC1=2 & VYO1Modified>29.0V
VYC1Modified<10V & VYO1Modified<10V
YO1 (MOV2) VYO1Modified>50.7V & IYO1>0.06A
YC1=2 & VYO1Modified>50.7V
VYC1Modified<10V & VYO1Modified<10V
SP VSp Raw >30V [Short to Positive]
VSpRaw ~ 0V VSp Raw <-30V [Short to Negative]
G
P
YC1
YO1
R
N
SP
A
A
A
A
V
V
V
V
V
V
V
NC
NC
1750
+
-
125
VD
C
O
NO
NC
C
A
A
1750
DCCCS CABLE UNDER TESTFROM DISTRIBUTION
CIRCUIT BREAKER
FUSE BLOCK
10A
10A
A
A
B
C

4-7
4.1.4 Small pilot SOV control circuit The SOV circuit that was tested is shown below in Figure 4-4. As seen in the figure, there are seven conductors that were monitored during the test. Those seven conductors’ electrical measurement data was analyzed based on the information displayed in Table 4-5 for all tests. For this circuit conductor, S2 was the HS/SA target, and conductor R was an HS target for all tests. The SP conductor was a non-energized target that could short to either the positive or the negative side of the circuit for all tests. The other conductors were used to determine whether a fuse had blown. Once the positive or negative fuse had blown, the durations for the HS and/or HS/SA were assumed to be complete.
Figure 4-4. Line drawing for DC SOV circuit
S1
G
R
S2
N
SP
PA
A
A
A
A
V
V
V
V
V
V
V
5A
5A
SOV
1750
1750
+
-
125
VD
C
DCCCS CABLE UNDER TESTFROM DISTRIBUTION
CIRCUIT BREAKER
FUSE BLOCK

4-8
Table 4-5. Analysis logic for SOV penlight and intermediate-scale tests
Conductor Spurious Operation (Status 2)
Hot Short (Status 1)
Normal (Status 0)
Fuse Clear or Spare Conductor Short (Status - 1)
P,G,S1 VModified>100V VModified<10V [Positive Fuse Clear]
N VNModified<10V VNModified>100V [Negative Fuse Clear]
R VRModified>60V [Hot Short]
VRModified<60V
S2 VS2Modified>56.05V
VS2Modified<60V
SP VSp Raw >30V [Short to Positive]
VSpRaw ~ 0V
VSp Raw <-30V [Short to Negative]
4.1.5 Medium-voltage circuit breaker dc control circuit There were two different medium-voltage circuit breakers (SWGR) circuits used during DESIREE testing. As mentioned in the report, there was a problem with the first breaker during intermediate-scale Test #8. The first SWGR circuit is displayed in Figure 4-5, with the instrumentation’s data analysis displayed in Table 4-6. The internal manufacturer wired this SWGR in reverse, which is depicted in Figure 4-5. The wiring did not affect the functionality of the SWGR, the only difference being that the red light was not energized. Table 4-6 has a different set-up than the tables for the previous circuits analyzed. The SWGR circuits were more complex to analyze, resulting in the different format. Conductors G, T, and C1 were hot short targets, while T and C1 were used to determine whether the breaker had tripped or closed (HS/SA target). The duration for the HS/SA was never more than one time step. Conductor R was treated as a energized spare. The two SP conductors were non-energized targets that could short to either the positive or the negative side of the circuit for all tests. The other conductors were used to determine whether a fuse had blown. Once the positive or negative fuse had blown, the durations for the HS and/or HS/SA were assumed to be complete. The second SWGR circuit is displayed in Figure 4-6, with the instrumentation’s data analysis displayed in Table 4-7. The only difference with this SWGR in terms of the data analysis logic was that R was an HS target and not an energized spare. It is also noted in Table 4-6 and Table 4-7 that there were two cables tested for each SWGR test. One cable was connected to the close circuit, and the other was connected to the trip circuit. The conductors associated with each are identified in the tables.

4-9
Figure 4-5. Line drawing for DC SWGR 1 circuit

4-10
Figure 4-6. Line drawing for DC SWGR 2 circuit

4-11
Table 4-6. Analysis logic for SWGR Penlight tests and intermediate-scale
Conductor Logic Statements (adjusted voltage used)
Notes
Clo
se C
able
C1 If(VC1<10V, “EtC”, if(45V< VC1<75V, “Floating,” if VC1>100V, “HS,” “HS or Floating”))
EtC means enable to close. If a fuse clears on the close circuit, this conductor state becomes Not_EtC (not enable to close). HS means hot short.
PC If(VP>100V, “Normal,” “Pos. Fuse Blown”)
N1 If(VN1<10V, “Normal,” “Neg. Fuse Blown”)
Trip
Cab
le
G If(VG<10V, “G_On”, “G_Off”) If the green light is off and T is floating, then there is a hot short.
R If(VR<60V, “HS,” “Normal”) Internal wiring was reversed; R was treated as a hot spare.
PT If(VPT>100V, “Normal,” “Pos. Fuse Blown”)
N2 If(VN2<10V, “Normal,” “Neg. Fuse Blown”)
T If(VT<10V, “EtT”, if( VT>100V, “HS,” “Floating”))
EtT means enable to trip. If a fuse clears on the trip circuit, this conductor state becomes Not_EtT (not enable to trip).
SP1 If(VS1<30V, “Short_to_-,” If(VS1>90V, “Short_to_+,” “Floating/Normal”))
SP2 If(VS2<30V, “Short_to_-,” If(VS1>90V, “Short_to_+,” “Floating/Normal”))
Breaker Position Breaker position was determined by analysis of the conductors’ behavior, as well as of the experimental field notes. This was necessary because of the interdependencies between the trip and close circuits.

4-12
Table 4-7. Analysis logic for SWGR intermediate scale tests 1, 3, 5, 6, 7, 8, 9, 10, Cont.
1, and Cont. 2
Conductor
If Statements (adjusted voltage used)
Notes
Clo
se C
able
C1 If(VC1<10V, “EtC,” if(45V< VC1<75V, “Floating,” if VC1>100V, “HS,” “HS or Floating”))
EtC means enable to close. If a fuse clears on the close circuit, this conductor state becomes Not_EtC (not enable to close). HS means hot short.
PC If(VP>100V, “Normal,” “Pos. Fuse Blown”)
N1 If(VN1<10V, “Normal,” “Neg. Fuse Blown”)
Trip
Cab
le
G If(VG<10V, “G_On,” “G_Off”) If the green light is off and T is floating, then there is a hot short.
R If(VR<10V, “R_On,” “R_Off”) If the red light is on and T is floating, then there is a hot short.
PT If(VPT>100V, “Normal,” “Pos. Fuse Blown”)
N2 If(VN2<10V, “Normal,” “Neg. Fuse Blown”)
T If(VT<10V, “EtT,” if( VT>100V, “HS,” “Floating”))
EtT means enable to trip. If a fuse clears on the trip circuit, this conductor state becomes Not_EtT (not enable to trip).
SP1 If(VS1<30V, “Short_to_-,” If(VS1>90V, “Short_to_+,” “Floating/Normal”))
SP2 If(VS2<30V, “Short_to_-,” If(VS1>90V, “Short_to_+,” “Floating/Normal”))
Breaker Position Breaker position was determined by analysis of the conductors’ behavior, as well as of the experimental field notes. This was necessary because of the interdependencies between the trip and close circuits.

4-13
4.2 Conductor Count The test data used to evaluate the effect cable conductor count has on failure modes included multi-conductor cables with 2-6, 7-9, and 10-15 conductors. Table 4-8 provides summaries of the dc test data, separated into these three conductor count ranges. These ranges were suggested by the electrical Phenomena Identification and Ranking Table (PIRT) expert panel. Figure 4-7 provides a graphical representation of this data.
Table 4-8. Conductor count, global approach, DC tests
Global Approach 1/C 2-6/C 7-9/C 10-15/C >15/C Fuse Clear - 1 22 1 - Hot Short - 4 142 5 - Spurious Operation - 3 89 2 - HS/SO Possible - 5 164 6 -
Figure 4-7. Conductor count column plot, global approach, DC tests These fire-induced cable failure mode plots provide little insight into how conductor count affects the likelihood of any one failure mode. This is partially due to the abundance of conductor count data available for 7/C cables, as well as the fact that the data shows consistent results among the three bins even with minimal data for the other two bins. Table 4-9 and Figure 4-8 provide dc test data for hot short and spurious operation durations, separated by these same conductor count ranges.
1/C 2-6/C 7-9/C 10-15/C >15/C
Co
unt
0
50
100
150
200Fuse Clear Hot Short Spurious OperationHS/SO Possible
100%
54%
87%
100%
60%
80%
20%
100%13
%
17%
83%
33%

4-14
Table 4-9. Conductor count, duration data, DC tests
Hot Short Spurious Operation 1/C 2-6/C 7-9/C 10-15/C >15/C 1/C 2-6/C 7-9/C 10-15/C >15/C q1 - 101.5 14 18 - - 203.5 10 105 - min - 1 1 7 - - 193 1 105 - median - 193 47 63 - - 214 31 105 - max - 1082 8545 2873 - - 235 6417 105 - q3 - 265 254 242 - - 224 80 105 - mean - 302 409 471 - - 214 195 105 -
Figure 4-8. Conductor count box plot, duration, DC tests
4.3 Thermal Exposure Conditions This section presents the dc data evaluated by thermal exposure conditions’ effects on fire-induced failure modes. The thermal exposure conditions include flame, hot gas layer (HGL), plume, and radiant conditions. The flame, hot gas layer, and plume data are from the intermediate-scale testing, while the radiant test data are from the Penlight (small-scale) radiant testing. These thermal exposure conditions are discussed in more detail in Section 2.3. Table 4-10 provides summaries of the dc test data failure mode evaluation by thermal exposure conditions, while Figure 4-9 presents this information graphically.
0
50
100
150
200
250
300
350
400
450
500
2‐6/C 7‐9/C 10‐15/C 2‐6/C 7‐9/C 10‐15/C
Hot Short Spurious Operation
q1
min
median
max
q3
1082s 8545s 2873s 6417s

4-15
Table 4-10. Thermal exposure conditions, global approach, DC tests Global Approach Flame Plume HGL Radiant Fuse Clear 9 3 5 7 Hot Short 43 25 13 70 Spurious Operation 26 11 5 52 HS/SO Possible 52 28 18 77
Figure 4-9. Thermal exposure conditions column plot, global approach, DC tests The failure mode data indicates that the HGL exposure data is an outlier compared to the other exposure conditions. The HGL test data shows a lower likelihood of experiencing a spurious operation (28%) and a higher chance of having the circuit protective fusing clear (28%). It is interesting to note that it was believed that the Penlight radiant exposure simulated an HGL exposure, due to the high radiative heat transfer that occurs in a sooty HGL. This assumption may be accurate for comparisons of the thermal conditions, but the failure mode data does not show this relation. This data tends to indicate that fire-induced cable failure modes do not follow this same logic, and, more specifically, that the radiant failure mode likelihood data is similar to the plume and flame exposure condition failure mode results. This may be due to the high intensity of the radiant exposure. Table 4-11 and Figure 4-10 present the dc test’s hot short and spurious operation duration data, separated by thermal exposure conditions. The data shows a weak trend (based on the median of the data) for shorter duration hot shorts in flame and radiant exposures as opposed to HGL exposure, with the plume exposure durations lying somewhere in the middle. There is a similar trend in the AC test data results (Section 2.3).
Flame Plume HGL Radiant
Cou
nt
0
20
40
60
80
100Fuse Clear Hot Short Spurious OperationHS/SO Possible
100%
39%
89%
11%
100%
50%
83%
17% 10
0%
28%78
%
28%
100%
68%
91%
9%

4-16
Table 4-11. Thermal exposure conditions, duration data, DC tests
Hot Short Spurious Operation
Flame Plum
e HGL Radiant Flame Plume HGL Radiant
q1 16.4 27.5 57.95 12 13 10.7 34.8 10 min 2 2 7 1 3 3.4 26 1 median 40 154 115 43 34 20.6 70 31 max 2873 2590 4871 8545 124 198.4 115 6417 q3 119.2 740 714 210 66.7 60.5 90.0 98.3 mean 61.6 468.7 587.8 428.4 45.1 146.6 111.9 301.0
Figure 4-10. Thermal exposure conditions box plot, duration, DC tests
4.4 Raceway Routing The two raceway routing configurations used during testing were open ladder-back cable trays and rigid steel conduit configurations that were tested in DESIREE-FIRE. The dominant use of ladder-back cable tray configurations makes it difficult to determine the effects that these configurations have on cable failure. A summary of these results is shown in Table 4-12 and Figure 4-11. The data evaluated shows no difference in failure mode between cable tray and conduit configurations for dc circuits.
Table 4-12. Raceway routing, global approach, DC tests
Global Approach Conduit Tray Fuse Clear 4 20 Hot Short 18 133 Spurious Operation 13 81 HS/SO Possible 22 153
0
100
200
300
400
500
600
700
800
Flame Plume HGL Radiant Flame Plume HGL Radiant
Hot Short Spurious Operation
Seconds q1
min
median
max
q3
2590s 8545s4871s 6417s2873s

4-17
Figure 4-11. Raceway routing column plot, global approach, DC tests Table 4-13 and Figure 4-12 present the data that was evaluated for raceway routing against hot short and spurious operation durations. The interquartile range, shown in Figure 4-12, is wider for the hot short durations than for the spurious operation durations, with the median for hot shorts being about 13-17 seconds longer.
Table 4-13. Raceway routing, duration data, DC data Hot Short Spurious Operation Conduit Tray Conduit Tray q1 14.1 16.0 16.4 10.0 min 1 1 3 1 median 56 50 39 33.5 max 2804 8545 431 6417 q3 278.5 255 87 90 mean 405.8 408.8 80.8 212.0
Figure 4-12. Raceway routing box plot, duration, DC tests
CONDUIT TRAY
Cou
nt
0
20
40
60
80
100
120
140
160
180Fuse Clear Hot Short Spurious OperationHS/SO Possible
100%
100%
14%86%
68%13%
87%
53%
0
100
200
300
400
500
CONDUIT TRAY CONDUIT TRAY
Hot Short Spurious Operation
Seconds
q1
min
median
max
q3
8545s2804s 6417s

4-18
4.5 Cable Orientation DESIREE-FIRE only tested cables in the horizontal orientation; thus, no comparison can be made on this parameter for dc circuits.
4.6 Raceway Fill The dc test data was evaluated based on the raceway fill conditions (single, medium, partitioned) and their effect on the failure mode. The single cable raceway fill configurations are shown below in Figure 4-13. Most of this single-fill data came from the Penlight tests, with a few data points coming from the intermediate-scale tests. If two single cables were in a raceway (e.g., Figure 4-14, Fill Tray H), it was also considered a single cable fill. Cables next to a partitioned cable group but separate (e.g., Bundle Trays D & H), as shown in Figure 4-15 with the single cable off to the right, were also considered single cables for this specific analysis. Besides the few instances mentioned above, all fill trays represented in Figure 4-14 and Figure 4-16 were analyzed as medium-fill, and the fill trays represented in Figure 4-15 were analyzed as partitioned cable tray raceway fill. In Section 2.6, bundles represent cable groups held together by tie wraps. Tie wraps were not used in the dc testing to group cables together; instead, thin steel right-angle plates were connected to the cable tray rungs.
Figure 4-13. Circuit cable orientation within the cable trays for single fill

4-19
Figure 4-14. Circuit cable orientation for filled trays
Tray Fill A Tray Fill B
Tray Fill C Tray Fill D
Tray Fill E Tray Fill F
Tray Fill G Tray Fill H
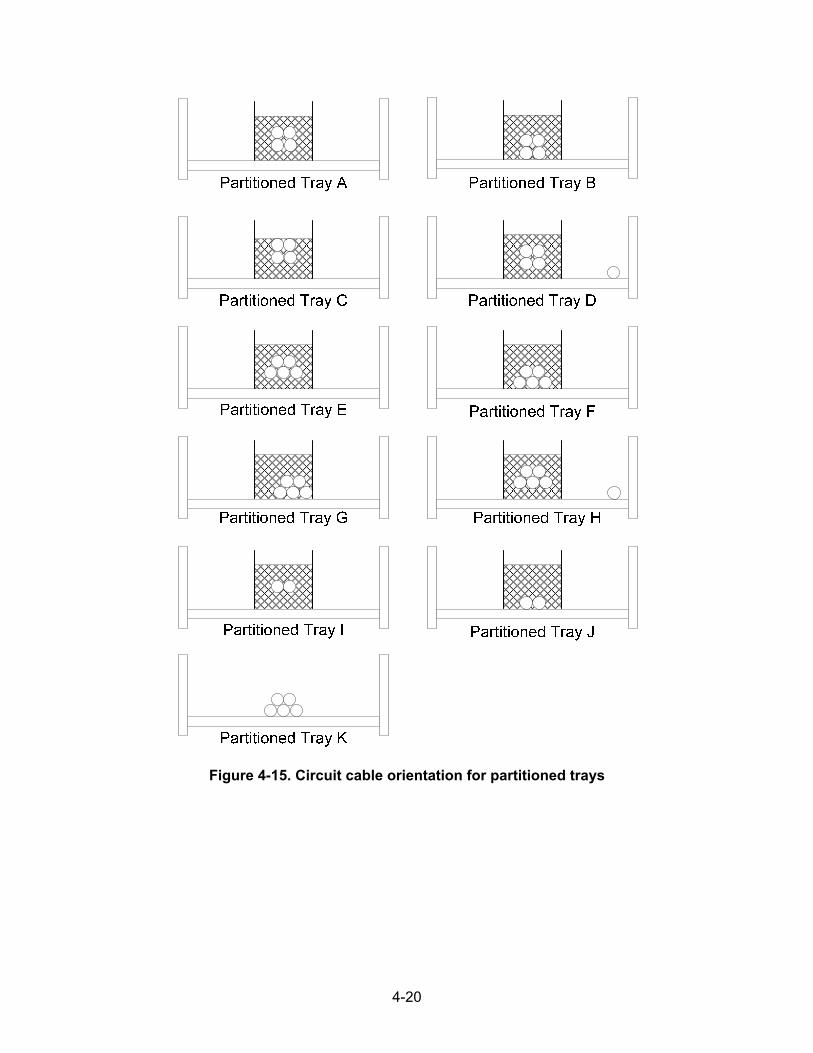
4-20
Figure 4-15. Circuit cable orientation for partitioned trays

4-21
Figure 4-16. Circuit cable orientation for specialized trays Table 4-14 provides summaries of the dc failure mode test data, separated by raceway fill type. The graphical representation of this data is shown in Figure 4-17. As shown in these figures, there is not a significant effect on failure modes based on raceway fill configurations. One observation of note is the slightly lower likelihood of experiencing a spurious operation in the partitioned tray configuration. However, this was not observed in the medium-full configurations, making it difficult to explain this result as the shielding effect of the other cables surrounding the monitored cables.
Table 4-14. Raceway fill, global approach, DC tests
Global Approach Partitioned Medium Single Fuse Clear 8 6 10 Hot Short 35 39 77 Spurious Operation 16 21 57 HS/SO Possible 43 45 87
Figure 4-17. Raceway fill column plot, global approach, DC tests
1 2 TC 3 4
Specialized Tray A
TC 21
TC 3 TC 4
Specialized Tray B
TC 2 TC3TC 1
Specialized Tray C
Partitioned Medium Single
Cou
nt
0
20
40
60
80
100Fuse Clear Hot Short Spurious OperationHS/SO Possible
100%
100%
100%
37%
81%
19%
13%
87%
47%
11%
66%
89%

4-22
The duration data was also evaluated against the raceway fill configurations. The analysis results are shown below in Table 4-15 and Figure 4-18. No trend was identified for the duration data based on raceway fill.
Table 4-15. Raceway fill, duration data, DC tests
Hot Short Spurious Operation Bundle Medium Single Bundle Medium Single q1 31 17.6 12.6 14.4 13 10.2 min 2 2 1 3 2 1 median 115 42 46 34 35 31 max 4871 2873 8545 198 124 6417 q3 675 124 240.5 73.6 82.5 97.2 mean 530 219 444 53 47 289
Figure 4-18. Raceway fill box plot, duration, DC tests
0
100
200
300
400
500
600
700
Bundle Medium Single Bundle Medium Single
Hot Short Spurious Operation
Seconds
q1
min
median
max
q3
6417s8545s4871s

4-23
4.7 Insulation Type The insulation type parameter separates insulation materials into two categories of polymer types, thermoset (TS) and thermoplastic (TP). Table 4-16 provides a breakdown of how insulation materials are classified by insulation type. Table 4-17 and Figure 4-19 present the failure mode test data separated by cable conductor insulation type, TS and TP. Section 4.8 provides information on failure characteristics based on insulation materials, and Section 4.9 presents the data segregated by insulation and jacket type combinations.
Table 4-16. Breakdown of insulation material by type, DC tests
Thermoset Materials (TS) Thermoplastic Materials (TP) EPR – ethylene propylene rubber PE – polyethylene FR-Kerite – Flame Retardant Kerite™ PVC – polyvinyl chloride XLPE – cross-linked polyethylene TEF – Tefzel XLPO – cross-linked polyolefin
Table 4-17. Insulation type, global approach, DC tests Global Approach TP TS Fuse Clear 16 7 Hot Short 48 99 Spurious Operation 36 55 HS/SO Possible 64 106
Figure 4-19. Insulation type column plot, global approach, DC tests The data indicates that insulation type has little effect on the likelihood of spurious operation, but has a minor effect on the likelihood of experiencing a fuse clear failure. Here the TS insulation has a lower likelihood of experiencing a fuse clear (7%), and, thus, a higher likelihood of experiencing a hot short than a TP-insulated cable. Once again, as was shown in the AC test results, there is no difference between cable insulation types relative to the likelihood of experiencing a spurious operation.
TP TS
Cou
nt
0
20
40
60
80
100
120Fuse Clear Hot Short Spurious OperationHS/SO Possible
100%
100%
25%
75%
56%
7%
93%
52%

4-24
The insulation type data was used to determine its effect on failure mode durations, which is shown below in Table 4-18 and Figure 4-20. The TP-insulated cables showed slightly longer hot short and spurious operation duration, based on the median and inter-quartile range.
Table 4-18. Insulation type, duration data, DC tests
Hot Short Spurious Operation TP TS TP TS q1 23.3 12.8 27.5 5.0 min 1 1 1 1 median 79 42 90 22 max 6417 8545 6417 1195
q3 372.8 212.2 142.6 36.8 mean 476 376 420 57
Figure 4-20. Insulation type box plot, duration, DC tests
4.8 Insulation Material The next cut-set evaluates the different types of cable insulation materials. The cable insulation materials used during the dc testing were ethylene propylene rubber (EPR), cross-linked polyethylene (XLPE), flame-retardant kerite™ (FR-Kerite), polyethylene (PE), polyvinyl chloride (PVC), and Tefzel™ (TEF), which can also be separated into TS and TP materials. These materials were analyzed for a better understanding of their effects on cable failure modes, as shown in Table 4-19. This data is presented graphically in Figure 4-21. The data suggests that conductors insulated with PE or PVC have a higher likelihood (20% and 17%, respectively) of experiencing a fuse clear failure than the other materials. It is interesting to note that both PE and PVC are TP materials, and that TEF, another TP material, experienced zero fuse clear failures, while the TS material also experienced a low number of fuse clear failures (~6%).
0
100
200
300
400
500
TP TS TP TS
Hot Short Spurious Operation
Duration
q1
min
median
max
q3
6417s 1195s8545s 6417s

4-25
Table 4-19. Insulation material, global approach, DC tests
Global Approach TS TP EPR XLPE FR-Kerite PE PVC TEFFuse Clear 1 4 1 15 1 0Hot Short 17 66 15 35 5 8Spurious Operation 5 41 8 26 4 6HS/SO Possible 18 70 16 50 6 8
Figure 4-21. Insulation material column plot, global approach, DC tests This data set was analyzed with the failure durations summarized in Table 4-20 and displayed in Figure 4-22. The data shows that the PVC- and EPR-insulated cables have a very short duration; however, only a limited number of PVC cables were tested (6 total).
Table 4-20. Insulation material, duration data, DC tests Hot Short Spurious Operation TS TP TS TP EPR XLPE PE PVC TEF EPR XLPE PE PVC TEF q1 7.3 12.3 33.9 1.3 17 3.9 10 28 1 425min 1 1 1 1 2 3 1 10 1 91median 53 38 95 13 72 5 23 90 1 759max 724 4871 6417 84 1433 34 115 6417 1 1427q3 149 115 676 28.8 290 9.5 37 124 1 1093mean 146 289 575 22 293 10 28 409 1 759
EPR XLPE FR-Kerite PE PVC TEF
Co
unt
0
20
40
60
80Fuse Clear Hot Short Spurious OperationHS/SO Possible
100
%
100
%
10
0%
100
%
10
0%
10
0%
28
%9
4%
6% 6
%9
4%
59
%
6%
94
%5
0%
30
%7
0%
52
%
17
% 83%
67
% 10
0%
75%
0%

4-26
Figure 4-22. Insulation material box plot, duration, DC tests
4.9 Insulation-Jacket Type Combinations The test data was next evaluated based on the combination of cable insulation and jacket types. There are three combinations identified from the data, namely (1) thermoplastic-insulated, thermoplastic-jacketed, (2) thermoset-insulated, thermoset-jacketed, and (3) thermoset-insulated, thermoplastic-jacketed. Table 4-21 provides summaries of the dc test data, divided into these three categories. This information is displayed in column plots in Figure 4-23, which shows that when TS-TS cables are compared to TP-TP cables, the failure mode likelihood data is similar to the results obtained from the comparison of the insulation type. It is probable and logical that insulation material is the dominant influencing factor for the failure mode likelihood. The TS-TP category comprises a single cable type, namely, the armored cable provided through the NRC-RES/EPRI Memorandum of Understanding (MOU). The failure modes show a high likelihood of experiencing a spurious operation and hot short. These results are consistent with industry testing of armored cable. The high percentage of spurious operation and hot shorts is a result of an ungrounded power supply and electrical interactions with the armor during fire-induced failure.
Table 4-21. Insulation-jacket type, global approach, DC tests Global Approach TP-TP TS-TS Armored (TS-TP) Fuse Clear 16 6 0 Hot Short 48 70 12 Spurious Operation 36 41 9 HS/SA Possible 64 76 12
0
200
400
600
800
1000
1200
EPR XLPE PE PVC TEF EPR XLPE PE PVC TEF
TS TP TS TP
Hot Short Spurious Operation
Secnods q1
min
median
max
q3
1433s6417s 6417s 1427s4871s

4-27
Figure 4-23. Insulation-jacket type column plot, global approach, DC tests The durations for the hot shorts and spurious operations for the jacket types were evaluated using the global approach. The data is presented in Table 4-22 with the box plots shown in Figure 4-24. Similar to what was shown in the insulation type analysis of Section 4.7, the TP-TP material cables show longer duration than the TS-TS cables. The mechanism for this phenomenon is unclear to the authors, but it may be the insulation polymer material’s sequence of physical thermal degradation.
Table 4-22. Insulation-jacket type, duration data, DC tests Hot Short Spurious Operation TP-TP TS-TS Armored (TS-TP) TP-TP TS-TS Armored (TS-TP)q1 23.3 14 19.8 27.5 9 4.8 min 1 1 1 1 1 4 median 79 42 39 90 24 21 max 6417 8545 2590 6417 1195 42 q3 372.8 255.8 182 142.6 37 37.5 mean 476 429 298 420 73 22
TP-TP TS-TS Armored (TS-TP)
Cou
nt
0
20
40
60
80
100Fuse Clear Hot Short Spurious OperationHS/SO Possible 10
0%
25%
75%
56%
8%
92%
54%
100%
0%
100%
75%
100%
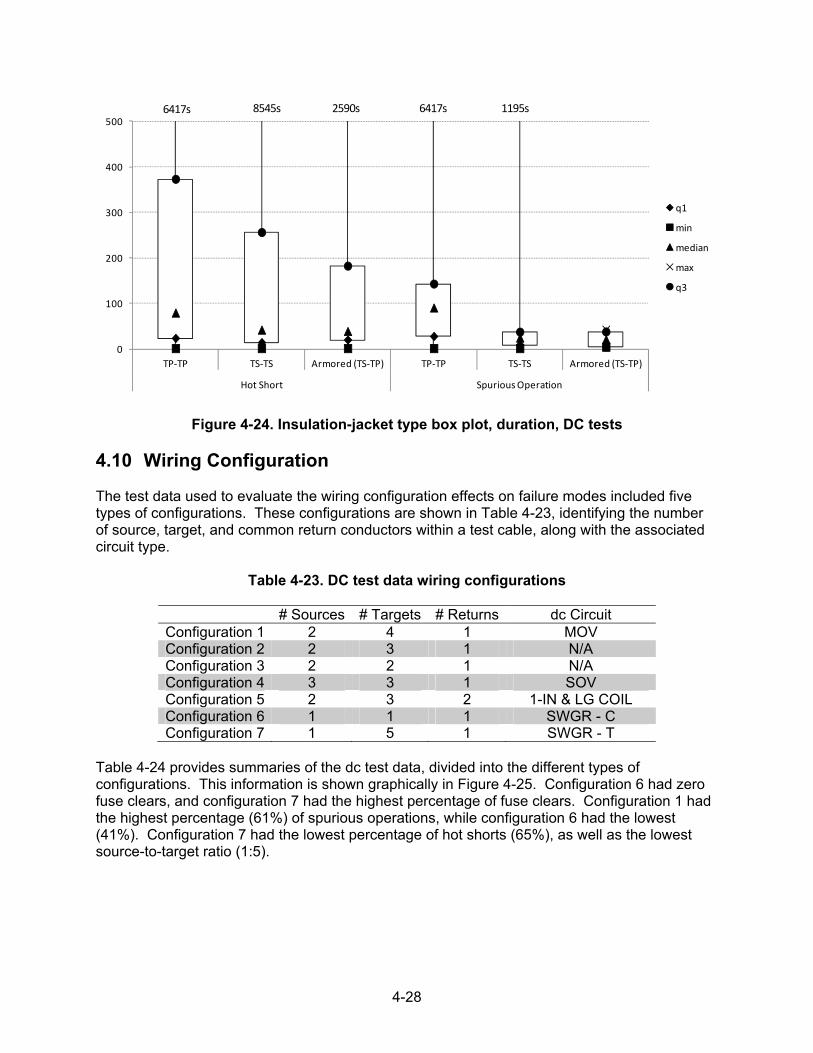
4-28
Figure 4-24. Insulation-jacket type box plot, duration, DC tests
4.10 Wiring Configuration The test data used to evaluate the wiring configuration effects on failure modes included five types of configurations. These configurations are shown in Table 4-23, identifying the number of source, target, and common return conductors within a test cable, along with the associated circuit type.
Table 4-23. DC test data wiring configurations # Sources # Targets # Returns dc Circuit Configuration 1 2 4 1 MOV Configuration 2 2 3 1 N/A Configuration 3 2 2 1 N/A Configuration 4 3 3 1 SOV Configuration 5 2 3 2 1-IN & LG COIL Configuration 6 1 1 1 SWGR - C Configuration 7 1 5 1 SWGR - T
Table 4-24 provides summaries of the dc test data, divided into the different types of configurations. This information is shown graphically in Figure 4-25. Configuration 6 had zero fuse clears, and configuration 7 had the highest percentage of fuse clears. Configuration 1 had the highest percentage (61%) of spurious operations, while configuration 6 had the lowest (41%). Configuration 7 had the lowest percentage of hot shorts (65%), as well as the lowest source-to-target ratio (1:5).
0
100
200
300
400
500
TP‐TP TS‐TS Armored (TS‐TP) TP‐TP TS‐TS Armored (TS‐TP)
Hot Short Spurious Operation
q1
min
median
max
q3
6417s 8545s 6417s2590s 1195s

4-29
Table 4-24. Wiring configuration, global approach, DC tests Global Approach Config. 1 Config. 4 Config. 5 Config. 6 Config. 7 Fuse Clear 4 7 5 0 8 Hot Short 50 35 29 22 15 Spurious Operation 33 19 19 9 14 HS/SO Possible 54 42 34 22 23
Figure 4-25. Wiring configuration column plot, global approach, DC tests This data set was analyzed to determine wiring configuration influence on hot short duration. This is shown below in Table 4-25 and Figure 4-26. It should be noted that the durations for spurious operations for configurations 6 and 7 are not calculated, as mentioned above. Since these are the close and trip circuits of the switchgear, the duration is less than a second, and is never continuous; therefore, it is not relevant to this analysis. Configuration 6 had a significantly longer median for hot short duration.
Table 4-25. Wiring configuration, duration data, DC tests
Hot Short Config. 1 Config. 4 Config. 5 Config. 6 Config. 7 q1 11 17.5 13.2 35.2 8.9 min 1 1 1 2 1 median 37 59 46.5 176 76
max 8545 724 1143 4871 1397
q3 173.2 96.2 121.8 1085.8 709 mean 405 110 195 736 351 Spurious Operation Config. 1 Config. 4 Config. 5 Config. 6 Config. 7 q1 10.8 23 7 N/A N/A min 1 3 1 N/A N/A median 33.5 37 13 N/A N/A max 6417 198.4 1052 N/A N/A q3 96.0 69.6 90 N/A N/A mean 286 53 129 N/A N/A
Config. 1 Config. 4 Config. 5 Config. 6 Config. 7
Co
unt
0
10
20
30
40
50
60Fuse Clear Hot Short Spurious OperationHS/SO Possible
10
0%
10
0%
10
0%
10
0%
100%
61
%
93
%
7%
17
%
83
%
45
%
15
%
85
%
56
%
0%
10
0%
41
%
61
%
65%
35
%

4-30
Figure 4-26. Wiring configuration box plot, duration, DC tests
4.11 Conductor Size The test data was used to evaluate the effect that conductor size has on failure modes (12 AWG vs. 14 AWG). Table 4-26 provides summaries of the dc test data, divided into the different conductor sizes. The majority of the test data is for 12 WG cables, with only 8% being of the 14 AWG variety. The global approach does not result in any significant differences among failure modes as a result of cable conductor size. Figure 4-27 provides the graphical representation of the failure mode characteristics for cable conductor size.
Table 4-26. Conductor size, global approach, DC tests Global Approach 12 AWG 14 AWG Fuse Clear 23 1 Hot Short 138 13 Spurious Operation 86 8 HS/SA Possible 161 14
0
400
800
1200
1600
Config. 1 Config. 4 Config. 5 Config. 6 Config. 7 Config. 1 Config. 4 Config. 5 Config. 6 Config. 7
Hot Short Spurious Operation
Seconds
q1
min
median
max
q3
4871s 6417s8537s

4-31
Figure 4-27. Conductor size column plot, global approach, DC tests Table 4-27 and Figure 4-28 display the data that was analyzed based on conductor size for failure mode durations. The data shows that the 14 AWG cables experience longer-lasting hot shorts and spurious operations, which is based on a limited set of data for the 14 AWG cables.
Table 4-27. Conductor size, duration data, DC tests
Hot Short Spurious Operation 12 AWG 14 AWG 12 AWG 14 AWG q1 14 20.8 11 15.5 min 1 1 1 1 median 47 194 33 193 max 6417 8545 6417 1195 q3 211.2 898.5 80 270.5 mean 355 965 186 280
Figure 4-28. Conductor size box plot, duration, DC tests
12 AWG 14 AWG
Cou
nt
0
20
40
60
80
100
120
140
160
180Fuse Clear Hot Short Spurious OperationHS/SO Possible
100%
14%
86%
100%
7%
93%
57%
53%
0
200
400
600
800
1000
1200
1400
12 AWG 14 AWG 12 AWG 14 AWG
Hot Short Spurious Operation
Seconds
q1
min
median
max
q3
8545s6417s 6417s

4-32
4.12 Circuit Type This cut-set separates the test data by circuit type (MOV, SOV, SWGR, 1-inch, and Large Coil). These circuits are explained above in Section 4.1. Table 4-28 presents the data for the circuit type’s effect on failure mode occurrence. Figure 4-29 presents this data graphically. The MOV and 1-inch valve circuits show a higher likelihood for spurious operation at 76% than the SOV, switchgear, and large coil circuit at 55%, 51%, and 53%, respectively. No specific mechanism for this has been identified. Circuit type has no significant bearing on the likelihood of fuse clears and hot shorts.
Table 4-28. Circuit type, global approach - DC tests Global Approach MOV SOV SWGR 1-inch Large Coil Fuse Clear 4 7 8 2 3 Hot Short 50 35 37 15 14 Spurious Operation 33 19 23 12 7 HS/SO Possible 54 42 45 17 17
Figure 4-29. Circuit type column plot, global approach, DC tests The circuit types were also evaluated to determine whether circuit type had an effect on failure mode durations. This information is displayed below in Table 4-29 and Table 4-30, and is shown graphically in Figure 4-30. It should be noted that in Table 4-30 the duration for SWGR spurious operations were not analyzed for this data set because the duration of a breaker tripping or closing in only about one time step in data collection would skew the duration data. Hot short duration is unaffected by the circuit design, and the durations of hot shorts have been reviewed. The switchgear and large coil circuits have the longest median hot short durations (136.5s and 71.5s respectively). The large coil has the longest median spurious operation duration (52s), while the 1-inch coil has the shortest median spurious operation duration (13s). No specific mechanism for this has been identified.
MOV SOV SWGR 1-Inch Large Coil
Co
unt
0
20
40
60Fuse Clear Hot Short Spurious OperationHS/SO Possible
100
%
10
0%
10
0%
100
%
10
0%
61
%
93
%
7% 1
7%
83%
45%
18%
82
%
51
%
12
%
88
%
71
%
18
%8
2%
41
%

4-33
Table 4-29. Circuit type hot short only, duration data, DC tests Hot Short MOV SOV SWGR 1-inch Large Coil q1 11 17.5 32.2 11.0 21.5 min 1 1 1 1 3 median 37 59 136.5 33 75.5 max 8545 724 4871 855 1143 q3 173.2 96.2 1082.8 91.5 124 mean 405 110 695 154 239
Table 4-30. Circuit type spurious operation only, duration data, DC tests Spurious Operation MOV SOV SWGR 1-inch Large Coil q1 10.8 23 N/A 9.8 4.3 min 1 3 N/A 1 3 median 33.5 37 N/A 12.5 90 max 6417 198.4 N/A 811 1052 q3 96 69.6 N/A 37.2 111 mean 286 53 N/A 90 197
Figure 4-30. Circuit type box plot, duration, DC tests
0
200
400
600
800
1000
1200
1400
MOV SOV SWGR 1‐Inch Large Coil MOV SOV SWGR 1‐Inch Large Coil
Hot Short Spurious Operation
Seconds
q1
min
median
max
q3
4871s 6417s8545s

4-34
4.13 Fuse Size The effects of fuse size on failure mode likelihood and duration were evaluated at the request of the PIRT panel. Although this evaluation only slightly differentiated the data from the previous evaluation based on the circuit type, the PIRT panel thought that the effects of fuse size on failure mode and duration could be significant and warranted an evaluation here. The dc testing data is the only data that was binned by fuse size, and there were four (4) fuse sizes used in the circuits tested in the dc testing program (DESIREE-FIRE). Table 4-31 presents the failure mode data, and Figure 4-31 presents the information from the tables in column plots. The data for the 35A and 15A fuse bins are entirely from the switchgear circuit and the trip and close portions of that circuit, respectively. The 35A bin is an outlier, based on its lack of fuse clear failures and lower likelihood of spurious operation (41%). The lack of fuse clear failures is likely a result of finite insulation impedance during fire-induced failures, limiting the fault current enough that it doesn’t exceed the fuse clear limits.
Table 4-31. Fuse size, global approach, DC tests Global Approach 35A 15A 10A 5A Fuse Clear 0 8 7 9 Hot Short 22 15 64 50 Spurious Operation 9 14 40 31 HS/SO Possible 22 23 71 59
Figure 4-31. Fuse size column plot, global approach, DC tests The effects of fuse size on duration are presented in Table 4-32, and a box plot is provided in Figure 4-32 to graphically illustrate this information. There is a clear trend (based on median and inter-quartile range) indicating that, as the fuse size decreases, so does the duration of the hot shorts and spurious operations.
35A 15A 10A 5A
Co
unt
0
20
40
60
80Fuse Clear Hot Short Spurious OperationHS/SO Possible
100
%
100%
10
0%
41
%
10
0%
0%
35
% 61
%
65
%
10
%
90
%
56
%
85
%
53
%
15
%
10
0%

4-35
Table 4-32. Fuse size, duration data, DC tests
Hot Short Spurious Operation 35A 15A 10A 5A 35A 15A 10A 5Aq1 35.2 8.9 12 12.3 N/A N/A 10 12min 2 1 1 1 N/A N/A 1 1median 176 76 42 43 N/A N/A 36 33 max 4871 1397 8545 855 N/A N/A 6417 811 q3 1085.8 709 171.8 96 N/A N/A 98.5 64 mean 736 351 382 123 N/A N/A 273 68
Figure 4-32. Fuse size box plot, duration, DC tests
4.14 Cable Shielding This section evaluates the effect a cable shield has on the failure modes of electrical cables exposed to damaging thermal conditions. The data that represents the cable shield category is from two different cables. The first is a cable donated to the testing program by JNES. The shield in this cable is described in NUREG/CR-7100:
“The cable included a spiral-wound copper shield wrap approximately 0.23 mm (0.009 in) thick. Both inside and outside this shield wrap was a counter-wrapped thin natural fiber fabric strip (e.g., a cotton canvas type material).”
The other shield-wrapped cable was a FR-Kerite insulated cable with a zinc shield wrap, described in NUREG/CR-7102 as follows:
“A zinc tape is spiral-wound directly beneath the jacketing material and two fabric wraps separate the insulated conductors from the zinc material.”
‐100
100
300
500
700
900
1100
1300
1500
35A 15A 10A 5A 35A 15A 10A 5A
Hot Short Spurious Operation
Seconds
q1
min
median
max
q3
4871s 8545s 6417s
Not A
pplicable
Not A
pplicable

4-36
Thus, these two cable constructions represent shield wraps with substantial physical characteristics and not shield wraps made from aluminized Mylar, a shield wrap commonly found in instrumentation cable noise reduction. Also, this section is only intended to evaluate the shield, and all armored cable data has been removed from this analysis. Table 4-33 and Figure 4-33 present the failure mode likelihood data in tabular and graphical form. The results of this analysis show no significant difference for the global approach based on cable shielding.
Table 4-33. Cable shielding, global approach, DC tests Global Approach Shield No Shield Fuse Clear 2 22 Hot Short 10 141 Spurious Operation 6 88 HS/SO Possible 12 163
Figure 4-33. Cable shielding column plot, global approach, DC tests The effects of shielding on hot short durations are presented below in Table 4-34 and Figure 4-34. This comparison doesn’t present any characteristics that differentiate the length of hot short durations among cables with or without shields.
Table 4-34. Cable shielding, duration data, DC tests Hot Short Spurious Operation Shield No Shield Shield No Shield q1 18 14 80.9 10.8 min 1 1 9 1 median 161 47 149 32 max 2873 8545 235 6417 q3 268.5 252 203.5 82.5 mean 398 409 135 198
Shield No Shield
Cou
nt
0
20
40
60
80
100
120
140
160
180Fuse Clear Hot Short Spurious OperationHS/SO Possible
100%
100%17%
83% 50%
13%
87%
54%

4-37
Figure 4-34. Cable Shielding box plot, duration, DC tests
4.15 DC Concurrence of Hot Short-Induced Spurious Operations Concurrence of hot short-induced spurious operations, as discussed in this report, occurs when more than one circuit (or cable) experiences individual hot shorts at the same time (i.e., concurrence). The intermediate-scale tests performed in DESIREE-FIRE consisted of 12 tests, which included six to seven DC circuits per test. This section documents how the test results were analyzed to identify times when hot short-induced spurious operations occurred concurrently. The DESIREE-FIRE project tested five different types of dc surrogate circuits: solenoid-operated valves (SOVs), motor-operated valves (MOVs), 1-inch valve solenoids, large coils similar in size to a power-operated relief valve, and a medium-voltage circuit breaker, referred to as switchgear (SWGR). The testing included two SOV and two MOV circuits, resulting in a total of eight circuits (SOV-1, SOV-2, MOV-1, MOV-2, 1-inch valve, large coil, and switchgear trip and close circuits). Most circuits were included in every intermediate-scale test. Since the intermediate-scale tests have the most realistic fire exposure conditions, this information has the most applicability to plant configuration, and is the focus of this discussion. Two approaches were taken to evaluate the concurrence of the DC data set. The first approach evaluates the DC data set for concurrence of spurious operations within a single test. The second approach is identical to what was done for the AC results and evaluates the data from all tests, but within specific fire exposure locations. Note that the draft version of this report only evaluated the former, and a public comment received on that draft noted the value of performing a similar analysis of the DC data for comparison purposes. This analysis has been added to the final report and is presented at the end of this section, following the analysis of concurrence among individual DC tests.
0.0
100.0
200.0
300.0
400.0
500.0
Shield No Shield Shield No Shield
Hot Short Spurious Actuation
Duration
q1
min
median
max
q3
2873s 6417s8545s

4-38
Analysis of spurious operation concurrence within individual tests Table 4-35 presents a listing of the four tests in which concurrent spurious operations occurred. Although all concurrences occurred between cables of the same insulation type, the testing configurations only tested one cable type per test; thus, the possibility of concurrence among different cable insulation types was never present. Table 4-35. Listing of concurrent spurious operations during intermediate-scale DC
testing (concurrences that occurred during an individual test)
Test # Circuit
Experiencing Concurrent SO
Duration of individual SO
(seconds)
Duration of Concurrent
SO (seconds)
Cable Physical Location
Cable Insulation
Type
5 SOV-2 SOV-1
211 12
3 D
B in Conduit TP TP
5 SOV-2
DC MOV-1 Open 211 16
16 D
B in Conduit TP TP
6 1-inch valve
SWGR-Close 89 1
1 C
B in Conduit TP TP
6 1-inch valve SWGR-Trip
89 1
1 C
B in Conduit TP TP
8 Large coil
SOV-1 123 90
90 A A
TP TP
8 Large coil
DC MOV-1 close 123 95
9 A A
TP TP
9 SOV-1
DC MOV-1 close 112
7 7
B B
TS TS
9 SOV-1
DC MOV-1 close 112
1 1
B B
TS TS
The following discussion provides additional information related to the individual concurrent hot shorts in each test identified in Table 4-35. The plots that follow identify the circuit, times of failure, and concurrence duration of the hot short. The figures show the start of a hot short, represented as a diamond, while the squares indicate the end and the black lines represent the duration of a hot short. The information on the horizontal axis of the figure indicates the circuit-naming convention:
test series (D = DESIREE) testing scale (IT = Intermediate) test number the circuit that experienced the hot short

4-39
Figure 4-35. Time plot of concurrent hot shorts for DESIREE-FIRE intermediate-scale test 5
Figure 4-35 depicts the DC hot short concurrence between SOV-2, SOV-1, and MOV-1 for intermediate-scale Test #5. It is important to note the physical location of the cables because thermal exposure conditions can influence the timing of cable failure. The SOV-2 cable is located in position D (upper plume), while the SOV-1 and MOV-1 cables are both located in a conduit in position B (lower plume). As referenced in Table 4-35, SOV-2 and SOV-1 have concurrent spurious operation duration of three seconds, while SOV-2 and MOV-1 have concurrent spurious operation duration of 16 seconds. Figure 4-36 provides the temperature profile for the two cable locations that experienced concurrent hot shorts. The vertical line represents the time of failure.
Figure 4-36. Plot of intermediate-scale test 5 for MOV and SOV cable locations
Time (s)
0 500 1000 1500 2000 2500 3000
Te
mpe
ratu
re (
C)
0
200
400
600
800
B Position - Conduit - Middle D Position - Middle
635 C
584 C

4-40
To summarize the data presented in Figure 4-36 and Table 4-35, intermediate-scale test #5 experienced two concurrent hot shorts among three circuits; the cables are physically located in Location D and Location B (inside the conduit). All of the cable insulation is thermoplastic. Figure 4-36 plots temperature versus time for MOV and SOV cable locations in intermediate-scale test #5. According to Figure 4-36, the cables located in the B Position fail at approximately 600 °C, whereas the cable located in the D Position fails at approximately 630 °C. This indicates the importance of understanding thermal exposure conditions and the effect that they have on concurrent failure timing. Although the cables are in different locations, each has a similar temperature profile, which leads to failure at approximately the same time. Figure 4-37 depicts the DC hot short concurrence between the1-inch valve circuit and switchgear circuits for intermediate-scale Test #6. There are two data points for the SWGR circuits, since one is for the close function and the other for the trip function. The 1-inch valve cable is located in position C (hot gas layer), while the switchgear close and trip cables are both located inside a conduit at position B (lower plume). As referenced in Table 4-35, the 1-inch valve and switchgear (close) circuits have concurrent spurious operation duration of one second, as do the 1-inch valve and switchgear (trip) circuits.
Figure 4-37. Concurrent hot shorts - test 6
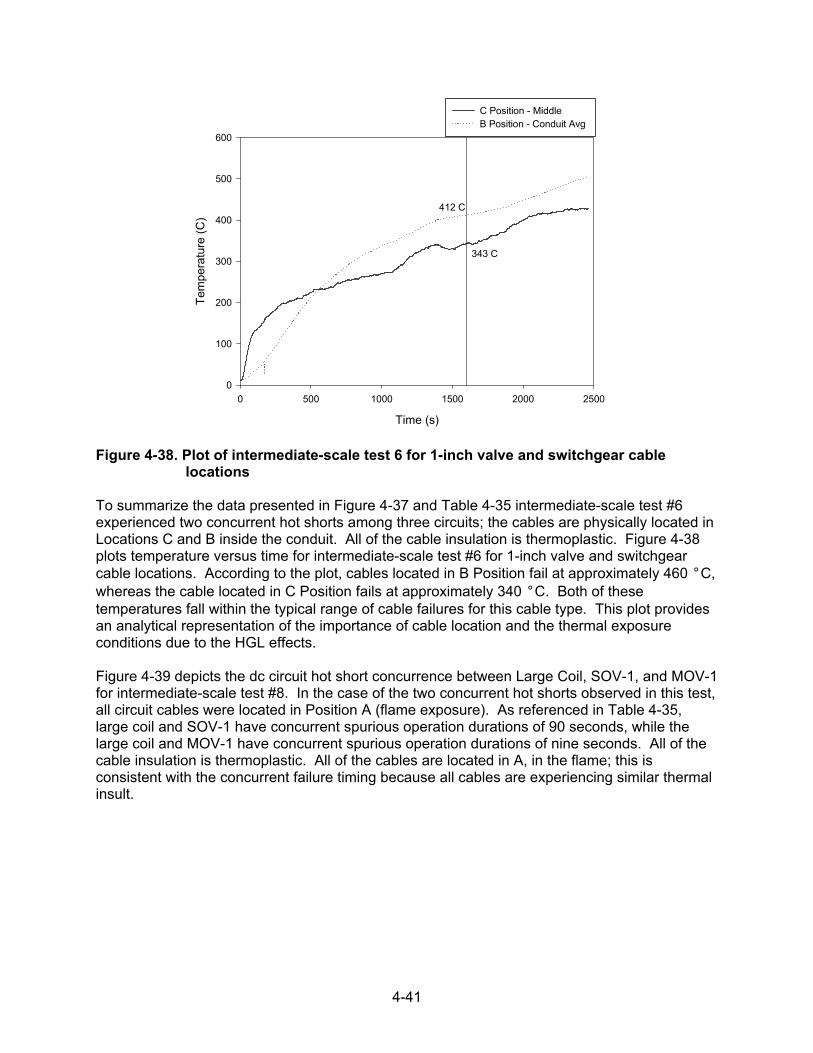
4-41
Figure 4-38. Plot of intermediate-scale test 6 for 1-inch valve and switchgear cable
locations To summarize the data presented in Figure 4-37 and Table 4-35 intermediate-scale test #6 experienced two concurrent hot shorts among three circuits; the cables are physically located in Locations C and B inside the conduit. All of the cable insulation is thermoplastic. Figure 4-38 plots temperature versus time for intermediate-scale test #6 for 1-inch valve and switchgear cable locations. According to the plot, cables located in B Position fail at approximately 460 °C, whereas the cable located in C Position fails at approximately 340 °C. Both of these temperatures fall within the typical range of cable failures for this cable type. This plot provides an analytical representation of the importance of cable location and the thermal exposure conditions due to the HGL effects. Figure 4-39 depicts the dc circuit hot short concurrence between Large Coil, SOV-1, and MOV-1 for intermediate-scale test #8. In the case of the two concurrent hot shorts observed in this test, all circuit cables were located in Position A (flame exposure). As referenced in Table 4-35, large coil and SOV-1 have concurrent spurious operation durations of 90 seconds, while the large coil and MOV-1 have concurrent spurious operation durations of nine seconds. All of the cable insulation is thermoplastic. All of the cables are located in A, in the flame; this is consistent with the concurrent failure timing because all cables are experiencing similar thermal insult.
Time (s)
0 500 1000 1500 2000 2500
Tem
per
atur
e (
C)
0
100
200
300
400
500
600
C Position - Middle B Position - Conduit Avg
412 C
343 C

4-42
Figure 4-39. Concurrent hot shorts - test 8 Figure 4-40 depicts the dc hot short concurrence as falling between SOV1 and MOV1 for intermediate-scale test #9. In this test, all cables involved in the concurrent hot shorts were located in the same tray, namely Position B (lower plume). As referenced in Table 4-35, SOV1 and MOV1 have concurrent spurious operation durations of seven seconds, while SOV1 and MOV1 have concurrent spurious operation durations of one second. All of the cable insulation is thermoset. All of the cables are located in B, in the plume; this is consistent with the concurrent failure timing as a result of being exposed to similar thermal insults.

4-43
Figure 4-40. Concurrent hot shorts - test 9 Analysis of concurrence among all tests for a specific exposure location As mentioned above, a comment on the draft version of this report suggested that the data should be analyzed to evaluate the concurrence of spurious operations among all tests for specific fire exposure locations, as was done for the AC results. For the intermediate-scale tests, the data from all tests was binned in exposure locations A, B, and D. Locations C and E are geometrically identical, and were grouped into one bin. Since the DC test data used the surrogate circuits in the penlight exposure (AC data did not), that data was also analyzed and binned by the following shroud temperature ranges: Bin 1 consisted of data from cables exposed to 325 – 375C shroud temperatures, Bin 2 had a temperature range of 400 – 480C, and Bin 3 had a temperature range of 500 – 525C. There was no strict rule or basis for the selection of these bins. However, binning was chosen to make the analysis simpler, and on the assumption that cables exposed to high heat flux (i.e., penlight shroud temperatures) should fail earlier than cables exposed to lower heat fluxes. Additionally, binning makes the presentation of the data cleaner and easier to understand. However, cables tend to exhibit aleatory uncertainty with regard to their thermal fragility (i.e., cables don’t all fail at the same temperature); thus, to provide a complete analysis of the concurrence observed during testing, the last part of this analysis evaluates concurrences among data in these bins. Location A in the DESIREE-FIRE tests places cables in a flame exposure location, as shown in Figure 2-32. Location A had a total of 14 cables instrumented for circuit response during all of the DESIREE-FIRE tests, of which eight experienced spurious operations. Of those eight test cases, five were involved in a total of six concurrent spurious operations, and are presented in Figure 4-41 and Table 4-36.

4-44
Figure 4-41. Time plot of concurrent spurious operations for DESIREE-FIRE among all
test circuits in Location A Table 4-36. Test data for Location A of DESIREE-FIRE for cases where concurrent
spurious operations occurred
Tes
t ID
D-I
T-8
-SO
V1
D-I
T-2
-SO
V2
D-I
T-8
-MO
V1
D-I
T-2
-MO
V2
D-I
T-8
-LG
CO
IL
# of
con
curr
ent
cabl
e S
O’s
Test ID D-IT-8-SOV1 22 - - 92 3 D-IT-2-SOV2 22 56 - 34 4 D-IT-8-MOV1 - 56 7 10 4 D-IT-2-MOV2 - - 7 - 2 D-IT-8-LGCOIL 92 34 10 - 4
Start Time (s) 960 1030 1054 1116 940 Stop Time (s) 1052 1110 1123 1139 1064
Duration (s) 92 80 69 23 124
900
950
1000
1050
1100
1150
D‐IT‐8‐SOV1 D‐IT‐2‐SOV2 D‐IT‐8‐MOV1 D‐IT‐2‐MOV2 D‐IT‐8‐LrgCl
Start
Stop

4-45
Location B in the DESIREE-FIRE tests places cables in a flame/plume exposure location dependent on the cable loading in Location A, as shown in Figure 2-32. Location B had a total of 38 cables instrumented for circuit response during all of the DESIREE-FIRE tests, of which 23 tests resulted in spurious operations. Of those 23 tests, 11 were involved in a total of six concurrent spurious operations, and are presented in Table 4-37. Due to the concurrence durations and the range of failure times among tests, a graph of these results is not presented. Table 4-37. Test data for Location B of DESIREE-FIRE for cases where concurrent
spurious operations occurred
Tes
t ID
D-I
T-7
-SO
V1
D-I
T-C
2-T
RP
D-I
T-C
2-C
LS
D-I
T-5
-LG
CO
IL
D-I
T-6
-TR
P
D-I
T-1
-1”V
LV
D-I
T-3
-SO
V2
D-I
T-1
-LG
CO
IL
D-I
T-3
-CLS
D-I
T-9
-SO
V1
D-I
T-9
-MO
V2
# of
con
curr
ent
cabl
e S
O’s
Test ID D-IT-7-SOV1 1 1 - - - - - - - - 3D-IT-C2-TRP 1 - - - - - - - - - 2D-IT-C2-CLS 1 - - - - - - - - - 2D-IT-5-LGCOIL - - - 1 - - - - - - 2
D-IT-6-TRP - - - 1 - - - - - - 2D-IT-1-1”VLV - - - - - 30 - - - - 2D-IT-3-SOV2 - - - - - 30 - - - - 2D-IT-1-LGCOIL - - - - - - - 1 - - 2
D-IT-3-CLS - - - - - - - 1 - - 2D-IT-9-SOV1 - - - - - - - - - 10 2D-IT-9-MOV1 - - - - - - - - - 10 2
Start Time (s) 302 334 354 819 850 1358 1361 1446 1460 2584 2613 Stop Time (s) 364 335 355 909 851 1391 1397 1465 1461 2689 2623
Duration (s) 62 1 1 90 1 33 36 19 1 105 10 The data from locations C and E was combined, due to geometric similarities with respect to the fire exposure conditions. As such, these two locations consisted of 18 circuit trials, in which 7 spurious operations occurred. Of the seven spurious operations, none were concurrent. Location D in the DESIREE-FIRE tests places cables in a plume exposure location, as shown in Figure 2-32. Location D had a total of 28 cables instrumented for circuit response during all of the DESIREE-FIRE tests, during which 16 circuits experienced spurious operations. Of these 16 spurious operations, eight were involved in a total of four concurrent spurious operations, and are presented in Figure 4-42 and Table 4-38.

4-46
Figure 4-42. Time plot of concurrent spurious operations for DESIREE-FIRE among all
test circuits in Location D Table 4-38. Test data for Location D of DESIREE-FIRE for cases where concurrent
spurious operations occurred
Tes
t ID
D-I
T-5
-MO
V2
D-I
T-9
-SO
V2
D-I
T-1
-MO
V2
D-I
T-1
0-1”
Vlv
D-I
T-1
2-Lg
Coi
l
D-I
T-3
-MO
V1
D-I
T-1
1-S
OV
2
D-I
T-3
-SO
V1
# of
con
curr
ent
cabl
e S
O’s
Test ID D-IT-5-MOV2 23 - - - - - - 2D-IT-9-SOV2 23 - - - - - - 2D-IT-1-MOV2 - - 9 - - - - 2D-IT-10-1”Vlv - - 9 - - - - 2D-IT-12-LgCoil - - - - 3 - - 2D-IT-3-MOV1 - - - - 3 - - 2D-IT-11-SOV2 - - - - - - 21 2D-IT-3-SOV1 - - - - - - 21 2
Start Time (s) 1500 1552 2617 2635 2746 2784 2858 2860 Stop Time (s) 1575 1581 2663 2644 2798 2787 2917 2881
Duration (s) 75 29 46 9 52 3 59 21
1400
1600
1800
2000
2200
2400
2600
2800
3000
Stop
Start

4-47
For the penlight test cases exposed to shroud temperature in the range of 325 - 375C a total of 25 cables were instrumented for circuit response, 17 circuits experienced spurious operations. Of these 17 spurious operations, Figure 4-43 and Table 4-39 present the 11 test cases that were involved in a total of 13 concurrent spurious operations.
Figure 4-43. Time plot of concurrent spurious operations for DESIREE-FIRE among all
Penlight test with exposure temperatures in the range of 325-375C Table 4-39. Test data for DESIREE-FIRE cases where concurrent spurious operations
occurred during Penlight exposures in the range of 325 - 375C
Tes
t ID
D-P
-9-S
OV
2
D-P
-12-
MO
V1
D-P
-9-S
OV
2
D-P
-30-
MO
V2
D-P
-11-
LgC
oil
D-P
-11-
1”V
lv
D-P
-30-
MO
V1
D-P
-JP
N1-
CLS
D-P
-JP
N3-
MO
V2
D-P
-44-
MO
V1
D-P
-44-
MO
V2
# of
con
curr
ent
cabl
e S
O’s
Test ID
D-P-9-SOV2 28 23 - - - - - - - - 3 D-P-12-MOV1 28 23 - - - - - - - - 3 D-P-9-SOV2 23 23 - - - - - - - - 3 D-P-30-MOV2 - - - 1052 811 91 1 193 - - 6 D-P-11-LgCoil - - - 1052 811 91 1 - - - 5 D-P-11-1”Vlv - - - 811 811 91 - - - - 4 D-P-30-MOV1 - - - 91 91 91 - - - - 4 D-P-JPN1-CLS - - - 1 1 - - - - - 3 D-P-JPN3-MOV2 - - - 193 - - - - - - 2 D-P-44-MOV1 - - - - - - - - - 225 2 D-P-44-MOV2 - - - - - - - - - 225 2
Start Time (s) 827 863 864 1076 1089 1108 1435 1977 2308 9073 10043 Stop Time (s) 891 1066 887 2503 2141 1919 1526 1978 2501 10268 10349
Duration (s) 64 203 23 1427 1052 811 91 1 193 1195 306
0
2000
4000
6000
8000
10000
12000
Stop
Start

4-48
For the penlight test cases exposed to shroud temperature in the range of 400 - 480C a total of 36 cables instrumented for circuit response, 23 circuits experienced spurious operations. Of these 23 spurious operations, Figure 4-44 and Table 4-40 present the 15 test cases that were involved in a total of 12 concurrent spurious operations.
Figure 4-44. Time plot of concurrent spurious operations for DESIREE-FIRE among all
Penlight test with exposure temperatures in the range of 400-480C
470
490
510
530
550
570
590
610
630
650
Stop
Start

T
able
4-4
0. T
est
dat
a fo
r D
ES
IRE
E-F
IRE
cas
es w
her
e co
ncu
rren
t sp
uri
ou
s o
per
atio
ns
occ
urr
ed d
uri
ng
P
enlig
ht
exp
osu
res
in t
he
ran
ge
of
400
- 48
0C
Test ID
D-P-8-MOV1
D-P-20-SOV1
D-P-20-SOV2
D-P-7-MOV1
D-P-2-SOV2
D-P-25-MOV2
D-P-25-MOV2
D-P-4-TRP
D-P-22-MOV1
D-P-22-MOV2
D-P-6-1”Vlv
D-P-25-MOV1
D-P-5-LgCoil
D-P-5-LgCoil
D-P-4-CLS
# of concurrent cable SOs
Tes
t ID
D-P
-8-M
OV
1
9 3
--
--
--
- -
--
--
3D
-P-2
0-S
OV
1 9
17
4
--
--
--
--
--
-4
D-P
-20-
SO
V2
3 17
3413
--
--
- -
--
--
5D
-P-7
-MO
V1
- 4
34
15
-
- -
- -
- -
- -
- 4
D-P
-1-S
OV
2 -
- 13
15
20
- -
- -
- -
- -
- 4
D-P
-2-S
OV
2 -
- -
-20
3
53
3 -
--
--
6D
-P-2
5-M
OV
2 -
- -
--
3
--
- -
--
--
2D
-P-2
5-M
OV
2 -
- -
--
5-
3
3 -
--
--
4D
-P-4
-TR
P
- -
- -
- 3
- 3
4
1 -
- -
- 5
D-P
-22-
MO
V1
- -
- -
- 3
- 3
4
33
1 9
3 -
8D
-P-2
2-M
OV
2 -
- -
- -
- -
- 1
33
1
11
3 1
7D
-P-6
-1”V
lv
- -
- -
- -
- -
- 1
1
- -
- 3
D-P
-25-
MO
V1
- -
- -
--
--
-9
11-
3
-4
D-P
-5-L
rgC
oil
- -
- -
--
--
-3
3-
3
-4
D-P
-4-C
LS
- -
- -
--
--
--
1-
--
2
Sta
rt T
ime
(s)
501
502
508
521
542
559
580
584
586
586
589
598
613
616
625
S
top
Tim
e (s
) 51
1 52
555
555
757
958
958
358
959
0 62
2 63
159
962
461
962
6D
urat
ion
(s)
10
2347
3637
303
54
36
421
113
1
4-49

4-50
For the penlight test cases exposed to shroud temperature in the range of 500 - 525C a total of 12 cables instrumented for circuit response, nine circuits experienced spurious operations. Of these nine spurious operations, Figure 4-45 and Table 4-41 present the six test cases that were involved in a total of three concurrent spurious operations.
Figure 4-45. Time plot of concurrent spurious operations for DESIREE-FIRE among all
Penlight test with exposure temperatures in the range of 500-525C Table 4-41. Test data for DESIREE-FIRE cases where concurrent spurious operations
occurred during Penlight exposures in the range of 500 - 525C
Tes
t ID
D-P
-37-
MO
V1
D-P
-35-
CLS
D-P
-37-
MO
V2
D-P
-34-
SO
V1
D-P
-41-
MO
V2
D-P
-41-
MO
V1
# of
con
curr
ent
cabl
e S
O’s
Test ID D-P-37-MOV1 1 - - - - 2 D-P-35-CLS 1 - - - - 2 D-P-37-MOV2 - - 12 - - 2 D-P-34-SOV1 - - 12 - - 2 D-P-41-MOV2 - - - - 54 2 D-P-41-MOV1 - - - - 54 2
Start Time (s) 1681 1693 1724 1728 2463 2702 Stop Time (s) 1712 1694 1740 1743 2894 2756
Duration (s) 31 1 16 15 431 54 The above information completes the evaluation of penlight data for individual bins, however, since there was no strict rule for developing these bins, among other reasons stated previously,
1600
1800
2000
2200
2400
2600
2800
3000
Start
Stop

4-51
the following and final concurrence analysis evaluates concurrent spurious operations occurring between test cases in different bins. Of the 73 penlight tests, 51 spurious operations occurred. Out of the 51 spurious operations, there were 76 instances of concurrent spurious operations and of those 76 concurrences, 34 instances of concurrent spurious operation occurred between test cases in different bins. Thus, the binning provided a method to easily present the data, but the basis for selecting the bins is weak. Table 4-42 presents the cases where spurious operation concurrence was identified between test cases in different bins. The “*” symbol is used in the table to indicate spurious operation concurrence for test cases in the same bin, thus, the table below does not represent duplicate concurrences previously presented. Conclusions Upon reviewing the test data for AC and DC circuits with respect to the observation of concurrence, several insights have been gained. First the lack of concurrence within any individual AC intermediate-scale test provides no bases for excluding plausibility of this phenomena. The experimental arrangement of cables within the test apparatus somewhat biased the results to decrease the possibility of observing concurrent spurious operations. This was because of the limited number of cables instrumented for circuit response (four SCDUs) and the placement of cables in different locations or in the same locations but with different bundling configurations caused the cables to receive different thermal exposures. What would be more commonly found in NPP applications would be cable raceways loaded with cables of the same insulation type (TS, TP) and exposures to the same thermal insult. With this arrangement groups of cables within the same cable tray would be exposed to almost identical thermal conditions and with similar cable failure thresholds it is likely that concurrent spurious operations would be observed. The DC results provided a better understanding of the concurrent spurious operation phenomena. Here up to eight cables could be instrumented for circuit response per test and of the five exposure locations within the testing apparatus, typically only two locations were used. This resulted in multiple cables in the same location being exposed to similar thermal conditions. The flame (location A) concurrence in the intermediate-scale DC tests reflect the data obtained from the DC Penlight experiments showing the likelihood of concurrent spurious operations to be in the range of 36-52%. For the DC intermediate-scale locations other than location A (flame) the results showed a lower likelihood of concurrence, in the range of 29%. This result is difficult to explain, but is likely linked to the likelihood of individual spurious operation results presented previously in section 2 and 4 when evaluation the parameter effect of thermal exposure conditions where it was shown that the likelihood of spurious operation for the flame and radiant exposures were higher than the plume or hot gas layer results. The final insight gained from this review of the data was that the duration of spurious operations can influence the likelihood of concurrent spurious operations. This finding is easily understood and Table 4-42 shows instances where long duration spurious operations resulted in numerous concurrent spurious operations (e.g., D-P-MOV2, D-P-11-LgCoil, D-P-11-1”Vlv).

Tab
le 4
-42.
Tes
t d
ata
for
DE
SIR
EE
-FIR
E c
ases
wh
ere
con
curr
ent
spu
rio
us
op
erat
ion
s o
ccu
rred
du
rin
g
Pen
ligh
t ex
po
sure
s am
on
g t
ests
no
t b
inn
ed t
og
eth
er in
th
e an
alys
is p
rese
nte
d p
revi
ou
sly.
*
indi
cate
s a
conc
urre
nt s
purio
us o
pera
tion
that
wa
s be
twe
en te
sts
with
in th
e sa
me
bin
and
capt
ured
in th
e bi
n an
alys
is a
bove
.
Test ID
D-P-20-SOV1
D-P-20-SOV2
D-P-31-SOV1
D-P-1-SOV2
D-P-2-SOV2
D-P-33-MOV2
D-P-22-MOV1
D-P-22-MOV2
D-P-32-Cls
D-P-25-MOV1
D-P-32-Trp
D-P-12-MOV1
D-P-21-Cls
D-P-30-MOV2
D-P-11-lrgCl
D-P-11-1"Vlv
D-P-50-MOV2
D-P-41-MOV2
D-P-30-MOV1
D-P-36-1"Vlv
D-P-37-MOV1
D-P-35-Cls
D-P-37-MOV2
D-P-34-SOV1
D-P-JPN3-MOV2
D-P-41-MOV2
D-P-JPN3-MOV1
D-P-41-MOV1
D-P
-20-
SO
V1
*3
‐‐
‐‐
‐‐
‐‐
‐‐
‐‐
‐‐
‐‐
‐‐
‐‐
‐‐
‐‐
‐
D-P
-20-
SO
V2
*3
*‐
‐‐
‐‐
‐‐
‐‐
‐‐
‐‐
‐‐
‐‐
‐‐
‐‐
‐‐
‐
D-P
-31-
SO
V1
33
‐‐
‐‐
‐‐
‐‐
‐‐
‐‐
‐‐
‐‐
‐‐
‐‐
‐‐
‐‐
‐
D-P
-1-S
OV
2‐
*‐
*1
‐‐
‐‐
‐‐
‐‐
‐‐
‐‐
‐‐
‐‐
‐‐
‐‐
‐‐
D-P
-2-S
OV
2‐
‐‐
*1
*‐
‐‐
‐‐
‐‐
‐‐
‐‐
‐‐
‐‐
‐‐
‐‐
‐‐
D-P
-33-
MO
V2
‐‐
‐1
1‐
‐‐
‐‐
‐‐
‐‐
‐‐
‐‐
‐‐
‐‐
‐‐
‐‐
‐
D-P
-22-
MO
V1
‐‐
‐‐
*‐
*1
*1
‐‐
‐‐
‐‐
‐‐
‐‐
‐‐
‐‐
‐‐
‐
D-P
-22-
MO
V2
‐‐
‐‐
‐‐
*1
*1
‐‐
‐‐
‐‐
‐‐
‐‐
‐‐
‐‐
‐‐
‐
D-P
-32-
Cls
‐‐
‐‐
‐‐
11
‐‐
‐‐
‐‐
‐‐
‐‐
‐‐
‐‐
‐‐
‐‐
‐
D-P
-25-
MO
V1
‐‐
‐‐
‐‐
**
‐1
‐‐
‐‐
‐‐
‐‐
‐‐
‐‐
‐‐
‐‐
‐
D-P
-32-
Trp
‐‐
‐‐
‐‐
11
‐1
‐‐
‐‐
‐‐
‐‐
‐‐
‐‐
‐‐
‐‐
‐
D-P
-12-
MO
V1
‐‐
‐‐
‐‐
‐‐
‐‐
‐1
‐‐
‐‐
‐‐
‐‐
‐‐
‐‐
‐‐
‐
D-P
-21-
Cls
‐‐
‐‐
‐‐
‐‐
‐‐
‐1
‐‐
‐‐
‐‐
‐‐
‐‐
‐‐
‐‐
‐
D-P
-30-
MO
V2
‐‐
‐‐
‐‐
‐‐
‐‐
‐‐
‐*
*24
99*
1331
116
15*
*‐
‐
D-P
-11-
lrgC
l‐
‐‐
‐‐
‐‐
‐‐
‐‐
‐‐
**
2499
*13
311
1615
‐‐
‐‐
D-P
-11-
1"V
lv‐
‐‐
‐‐
‐‐
‐‐
‐‐
‐‐
**
2499
*13
311
1615
‐‐
‐‐
D-P
-50-
MO
V2
‐‐
‐‐
‐‐
‐‐
‐‐
‐‐
‐24
2424
‐‐
‐‐
‐‐
‐‐
‐‐
‐
D-P
-41-
MO
V2
‐‐
‐‐
‐‐
‐‐
‐‐
‐‐
‐99
9999
‐‐
‐‐
‐‐
‐‐
‐‐
‐
D-P
-30-
MO
V1
‐‐
‐‐
‐‐
‐‐
‐‐
‐‐
‐*
**
‐‐
‐‐
‐‐
‐‐
‐‐
‐
D-P
-36-
1"V
lv‐
‐‐
‐‐
‐‐
‐‐
‐‐
‐‐
1313
13‐
‐‐
‐‐
‐‐
‐‐
‐‐
D-P
-37-
MO
V1
‐‐
‐‐
‐‐
‐‐
‐‐
‐‐
‐31
3131
‐‐
‐‐
*‐
‐‐
‐‐
‐
D-P
-35-
Cls
‐‐
‐‐
‐‐
‐‐
‐‐
‐‐
‐1
11
‐‐
‐‐
*‐
‐‐
‐‐
‐
D-P
-37-
MO
V2
‐‐
‐‐
‐‐
‐‐
‐‐
‐‐
‐16
1616
‐‐
‐‐
‐‐
*‐
‐‐
‐
D-P
-34-
SO
V1
‐‐
‐‐
‐‐
‐‐
‐‐
‐‐
‐15
1515
‐‐
‐‐
‐‐
*‐
‐‐
‐
D-P
-JP
N3-
MO
V2
‐‐
‐‐
‐‐
‐‐
‐‐
‐‐
‐*
‐‐
‐‐
‐‐
‐‐
‐‐
38‐
‐
D-P
-41-
MO
V2
‐‐
‐‐
‐‐
‐‐
‐‐
‐‐
‐*
‐‐
‐‐
‐‐
‐‐
‐‐
38235
*
D-P
-JP
N3-
MO
V1
‐‐
‐‐
‐‐
‐‐
‐‐
‐‐
‐‐
‐‐
‐‐
‐‐
‐‐
‐‐
‐235
54
D-P
-41-
MO
V1
‐‐
‐‐
‐‐
‐‐
‐‐
‐‐
‐‐
‐‐
‐‐
‐‐
‐‐
‐‐
‐‐
54
Start
502508518542559574586589607613620
8639621076
1089
1108
1241
1307
1435
1611
1681
1693
1724
1728
2308
2463
2632
2702
Stop
5255555215795895756226316086246211066
9632503
2141
1919
1265
1406
1526
1624
1712
1694
1740
1743
2501
2894
2867
2756
Duration
2347
337
301
3642
111
1203
11427
1052
811
2499
9113
311
1615
193
431
235
54
4-52

5-1
5. INTER-CABLE – DIRECT CURRENT CIRCUITS
5.1 Traditional Inter-Cable Failure Analysis for DESIREE-FIRE Results
As was done in other testing projects, the Direct Current Electrical Shorting in Response to Exposure Fire (DESIREE-FIRE) project attempted to evaluate inter-cable interactions using multiple methods. To explicitly explore this failure mode, an inter-cable test configuration was used. In addition, the data (voltage and current measurements) from the surrogate circuits could be analyzed post-test to evaluate inter-cable shorting behavior. The inter-cable test configuration used during the DESIREE-FIRE testing focused on arranging the cables to evaluate the likelihood of proper polarity in inter-cable shorting. These tests stacked the deck by placing the cables on an insulated marinite board located in a cable tray and having multiple source cables surrounding a single target cable. This configuration is shown in Figure 5-1, with a target cable co-located in the center of the arrangement and two positive source cables and two negative source cables located on the side and above a target cable. The target cable conductors were all connected to a network of resistors and monitored for voltage response only (no current transducers were used). Each source conductor was powered by one side of a nominal 125Vdc battery and protected with a 10-amp fuse.
Figure 5-1. DESIREE-FIRE inter-cable configuration Thirteen intermediate-scale and four penlight tests were conducted using the five-cable inter-cable arrangement shown above. Of those tests, only one showed weak signs of multiple external shorts to separate conductors within the target cable. This particular case is shown in Figure 5-2, where the maximum induced voltage difference is roughly 20Vdc. In all other tests, the data shows that internal faults occurred prior to inter-cable faulting of the target cable.
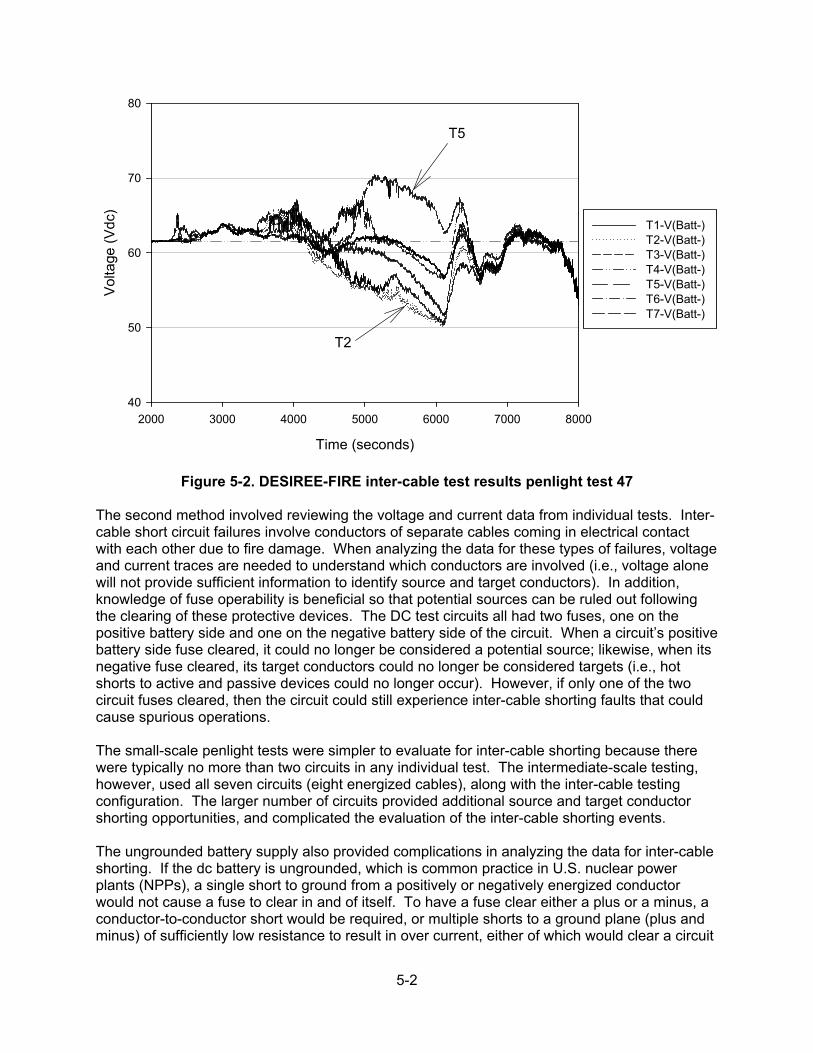
5-2
Figure 5-2. DESIREE-FIRE inter-cable test results penlight test 47 The second method involved reviewing the voltage and current data from individual tests. Inter-cable short circuit failures involve conductors of separate cables coming in electrical contact with each other due to fire damage. When analyzing the data for these types of failures, voltage and current traces are needed to understand which conductors are involved (i.e., voltage alone will not provide sufficient information to identify source and target conductors). In addition, knowledge of fuse operability is beneficial so that potential sources can be ruled out following the clearing of these protective devices. The DC test circuits all had two fuses, one on the positive battery side and one on the negative battery side of the circuit. When a circuit’s positive battery side fuse cleared, it could no longer be considered a potential source; likewise, when its negative fuse cleared, its target conductors could no longer be considered targets (i.e., hot shorts to active and passive devices could no longer occur). However, if only one of the two circuit fuses cleared, then the circuit could still experience inter-cable shorting faults that could cause spurious operations. The small-scale penlight tests were simpler to evaluate for inter-cable shorting because there were typically no more than two circuits in any individual test. The intermediate-scale testing, however, used all seven circuits (eight energized cables), along with the inter-cable testing configuration. The larger number of circuits provided additional source and target conductor shorting opportunities, and complicated the evaluation of the inter-cable shorting events. The ungrounded battery supply also provided complications in analyzing the data for inter-cable shorting. If the dc battery is ungrounded, which is common practice in U.S. nuclear power plants (NPPs), a single short to ground from a positively or negatively energized conductor would not cause a fuse to clear in and of itself. To have a fuse clear either a plus or a minus, a conductor-to-conductor short would be required, or multiple shorts to a ground plane (plus and minus) of sufficiently low resistance to result in over current, either of which would clear a circuit
Time (seconds)
2000 3000 4000 5000 6000 7000 8000
Vo
ltage
(V
dc)
40
50
60
70
80
T1-V(Batt-) T2-V(Batt-) T3-V(Batt-) T4-V(Batt-) T5-V(Batt-) T6-V(Batt-) T7-V(Batt-)
T5
T2

5-3
protective device. However, because the dc circuit had two fuses per circuit, one on the positive side and one on the negative side, the fuses would not always clear simultaneously. Thus, in about half of the cases, only one fuse in a particular circuit would clear at any time. This single-fuse clearing would eliminate the possibility of intra-cable shorting, but the side of the circuit whose fuse did not clear would still be functional from an inter-cable shorting perspective. For example, if circuit A experienced a low-resistance short when its positive side fuse cleared, but its negative fuse remained intact, then this circuit could still experience a short from another conductor in another cable, which could lead to a spurious operation if the respective conductors shorted together. The purpose of this lengthy discussion is to identify a unique failure mode that has not been observed thus far in the associated testing. With a common ungrounded power supply, the ground plane (cable trays, conduit, and ground conductors) can act as an electrical conductive pathway to aid in inter-cable shorting. This observation results in the need to analyze hot shorts and spurious operations more closely to identify the failure mode type (inter- or intra-cable). In the AC tests, the control power transformer (CPT) was typically grounded (as is done in the majority of U.S. NPPs), and any energized conductor experiencing a low-resistance short to the reference ground (due to fire damage) would experience a high-current rush, resulting in the clearing of an upstream protective device (fuse or circuit breaker) and the de-energizing of the circuit. To aid in identifying inter-cable shorting, a simple yet beneficial approach was taken. For an individual circuit (MOV-1, SOV-2, Lg Coil, etc.), the current within that circuit was summed, that is, the currents coming from the positive battery terminal were added and the currents returning to the negative battery terminal were subtracted. Figure 5-3 and Equation 5-1 provide the graphical and mathematical representations of this approach. Under normal conditions, Kirchoff’s current law states that the currents within a circuit sum up to zero. This law also holds under intra-cable-only circuit failures, in that the current within the circuit/cable remains inside the cable, and the sum is equal to zero. However, when inter-cable interactions occur, the current from one circuit leaves the electrical circuit and enters another; thus, for the inter-cable case, the individual circuit currents do not sum up to zero, and there is a net current (negative if the circuit is receiving currents from some other circuit, positive if the circuit is supplying currents to some other circuit).

5-4
Figure 5-3. DC MOV schematic showing current summation used in identifying inter-
cable shorting behavior isum_dcMOV = iP + iG + iR - ( iYC1 + iYO1 + iN ) Equation 5-1 Although this method provides an efficient tool to quickly identify which circuits were involved in inter-cable shorting, there are a few drawbacks. First, this method only shows which circuits were involved, and not which conductors. To compensate for this, the analyst must review the data from the respective circuits and determine which conductors were involved. Secondly, in the intermediate-scale testing, the inter-cable circuit was included, but it was not monitored for current. Thus, in some cases the analysis could not identify the source of the inter-cable short, although it can be assumed that the source was the inter-cable circuit. Thirdly, there were a few circuits (small SOVs in particular) that had a very low operating current (0.042A) when energized. Although they were typically discernible in the analysis, they were not as apparent as the other circuits’ inter-cable shorts. Fourthly, there may be cases where a circuit is leaking current and gaining current from other circuits simultaneously; these interactions can cancel each other out, and can lead to difficulties in identifying the inter-cable short. Lastly, there were several cases where a single circuit shorted abruptly to the common ground plane and caused several circuit protective devices to clear without direct indication of which circuit initiated the event. It is assumed that because there were multiple simultaneous fuse clears, there was a very abrupt current spike, followed by fuse clearing, which the data acquisition system (DAQ) was unable to capture. As a result of these aspects, the analysis for this section is focused on identifying spurious operations that resulted from inter-cable (cable-to-cable) shorting. There were some cases where it was possible to determine how individual circuit fuses cleared via inter-cable shorting; that information is noted in the summary tables. At this time, an evaluation of inter-cable hot shorting of the passive targets has not been conducted, mainly due to the low-level currents required to energize these devices and the complications associated with the auxiliary contacts and reed switches used to control the passive target sources.

5-5
The following two sections present the inter-cable analysis of the surrogate circuit data for the small-scale Penlight and intermediate-scale open-flame tests. Due to the number of circuits used in the intermediate-scale testing and the use of actual flaming combustions, those results are analyzed in more detail than they are in the penlight tests, where only two circuits were co-located within the same cable tray. The intermediate-scale results also show unique failures in which cables located within a rigid steel conduit interact with other cables located in cable trays at different locations.
5.2 Penlight Tests – Ground Fault Equivalent Hot Short Penlight tests for the DESIREE-FIRE project typically consisted of two cables, each connected to an individual circuit. The only exception for this type of configuration was the medium-voltage circuit breaker test, where two cables were connected to one circuit. In all tests using a cable tray, the cables were not in physical contact with anything except the cable tray. A cable instrumented for thermal response was typically placed between the two cables instrumented for electrical response, as shown in Figure 5-4. Thus, any inter-cable interactions are a direct result of cable interactions with the cable tray. In conduit tests, the two electrically monitored cables may be in physical contact, and a more detailed evaluation of any inter-cable interactions is necessary.
Figure 5-4. Penlight cable tray typical loading, showing two electrically instrumented
cables and a thermal response (temperature recording) cable located in the center.
The Penlight results of the ground equivalent hot shorting analysis are documented in Appendix A. A summary of this analysis is presented here in Table 5-1.

5-6
Table 5-1. Results of inter-cable shorting during Penlight DESIREE-Fire tests. Test # Failure Mode Description PT-8 MOV-2 hot short to “R” conductor from MOV-1 “P” conductor at 478 seconds
(duration = 3 seconds). PT-12 Interactions between MOV-1 “N” conductor and MOV-2 “P” conductor. This is a
case of a high-resistance short between conductors connected to positive and negative battery potential.
PT-22 Four separate ground fault equivalent spurious operations occurred in this test. MOV-1 Open coil SO for 2 seconds, short from MOV-2 “G” conductor (starts at 585s) MOV-1 Open coil SO for 2 seconds, short from MOV-2 “G” conductor (starts at 589s) MOV-1 Open coil SO for 40 seconds, short from MOV-2 “G” conductor (starts at 593s) MOV-2 Open coil SO for 38 seconds, short from MOV-1 “G” conductor (starts at 595s)
PT-33 Interactions between MOV-1 “P” conductor and MOV-2 “N” and “YC” conductors (No SO or HS occur).
PT-37 MOV-2 Close coil SO for 16 seconds, short from MOV-1 “G” conductor to MOV-2 “YC” conductor.
PT-41 Two separate ground fault equivalent spurious operations occurred in this test. MOV-2 Close coil SO for 6 seconds, short from MOV-1 “G” conductor to MOV-2 “YC” conductor (starts at 2753s) MOV-1 Open coil SO for 1 second, short from MOV-2 “G” conductor to MOV-1 “YO” Interactions between MOV-1 “P” conductor and MOV-2 “N” conductor were also observed for approximately 9 seconds, starting at 2825 seconds.
PT-49 MOV-2 Open coil SO for <1 second, source is difficult to identify due to other conductor interactions among cable trays.
PT-50 MOV-2 Close coil SO for 22s, short from MOV-1 “G” conductor to MOV-2 “YC” conductor. Inter-cable interactions also cause a fuse clear on MOV-2 circuit.
PT-JPN3 False indication on MOV-1 Red lamp ON, due to inter-cable shorting with MOV-2. PT-20 SOV-2 SO for 20 seconds, short from SOV-1 “G” conductor (starts at 508s). PT-28 SOV-2 SO for 297secodns, short from SOV-1 “P” conductor (starts at 3393s). PT-31 False indication on SOV-2 Green lamp ON, due to inter-cable shorting with SOV-1. PT-11 Two separate ground equivalent hot shorts were observed in this test.
Large coil SO for 52 seconds, short from 1-inch valve “G” and “R” conductors 1-inch valve SO for 798 seconds, short from large coil “P” conductor
PT-40 Large coil SO for 64 seconds, short from 1-inch valve “G” and R” conductors (starts at 4100s).
PT-4 SWGR-trip SO (breaker opens), short from SWGR-Close “N1” conductor. PT-JPN2 False indication Red lamp ON, inter-cable interaction between SWGR-Trip “R”
conductor and SWGR-Close “N1” conductor.
5.3 Intermediate-Scale Tests – Ground Fault Equivalent Hot Short 5.3.1 Preliminary Test #1 Figure 5-5 presents an illustration of the test set-up for preliminary test #1. Location A contains fill cable that is represented by the gray area located within the cable tray, and is located directly

5-7
above the fire source (200 kW propene diffusion sand burner). Location B contains two cables connected to the switchgear trip and close coil circuitry, location C contains two cables connected to two separate AC surrogate circuit diagnostic units (SCDUs), location D contains the inter-cable test configuration of cables, and location E contains two cables connected to the 1-inch valve and the large coil. During testing, the openings in the hood in which the cable trays and conduits are located are enclosed with a ceramic fiber material to develop and maintain a hot gas layer that is sufficient to damage the cables. The illustration does not show ceramic fiber.
Figure 5-5. Intermediate-scale test preliminary 1 cable loading configuration Table 5-2 presents the failure mode sequence of events of preliminary test #1. The AC SCDU and inter-cable testing results are not discussed. Cables in location E did not fail during the test.
Table 5-2. Intermediate-scale preliminary test 1 Time (s) Failure Observation 502 SWGR-C SA 504 SWGR-C Fuse Clear – Positive 515 SWGR-T Fuse Clear – Negative 540 SWGR-C Fuse Clear – Negative (INTER-CABLE with SWGR-T cond. ‘P’) NOTE: 1-inch valve and Lg Coil circuit did not fail max temp (~380 C for both
TS cables) 5.3.2 Preliminary Test #2 Figure 5-6 and Table 5-3 provide an illustration of the intermediate-scale layout and a summary of the test circuit failure sequence, respectively. Bold font is used to identify inter-cable interactions. Figure 5-7 presents the summed current plots for all circuits in this test. This plot indicates that MOV-2 open coil experiences an inter-cable hot short-induced spurious operation
Location C
Location B
Location D Location E
Location A
LEGENDSG-T : Switchgear TripSG-C : Switchgear CloseS1 : SOV-1S2 : SOV-2M1: MOV-1M2: MOV-2LC : Large Coil1V : 1-inch Valveac1-4 : SCDU circuits+/- : power source cable 35A
NOT TO SCALE
Inter-cable Circuit
SG-C SG-T
1V LCac3 ac4

5-8
from SOV-2. Although the cables associated with MOV-2 and SOV-2 are in the same cable tray, they are not in physical contact with each other; thus, the only means for this interaction is by ground plane equivalent hot short failure mode. In this specific spurious operation, conductors “S1,” “P,” and “G” of the SOV-2 circuit are supplying power to the MOV-2 open coil contact conductor.
Figure 5-6. Intermediate-scale test preliminary 2 cable loading configuration
Table 5-3. Intermediate-scale preliminary test 2 Time (s) Failure Observation 312 SOV-1 Fuse Clear – Positive 343 MOV-1 Fuse Clear – Positive & Negative 820 – 1221 MOV-2 SO Open Coil
INTER-CABLE shorting with SOV-2 conductor S1, P, G 888 – 1221 MOV-2 HS Close Coil (likely from inter-cable) 953 – 1020 SOV-2 SO (voltage but no corresponding current – unlikely an SO per SNL
report) 1020 SOV-2 Fuse Clear – Negative 1221 MOV-2 Fuse Clear – Negative 1221 SOV-2 Fuse Clear – Positive

5-9
Figure 5-7. Intermediate-scale test preliminary 2 – inter-cable shorting between SOV-2
and MOV-2 5.3.3 Test 1 Figure 5-8 and Table 5-4 present an illustration of the intermediate-scale cable layout and the circuit response summary information, with inter-cable interactions shown in boldface type. Figure 5-9 provides an indication that the 1-inch valve circuit experienced interactions with the large coil and MOV-1 circuits. Upon closer review of the test data, it was determined that conductor “P” of the 1-inch valve circuit energized the conductor “S” of the large coil circuit, causing an inter-cable spurious operation. Shortly after the large coil spurious operation cleared, MOV-1 conductor YO1 on the open coil was energized by the same “P” conductor of the 1-inch valve circuit, causing spurious operation on the MOV-1 circuit. The 1-inch valve source conductor “P” energized two individual conductors in different cables and separate raceways. In addition, review of the ground fault circuitry measurements indicates that the positive side of the battery was grounded during these interactions. These results provide a clear indication that the ground plane was involved during both inter-cable hot shorts.
Time (s)
800 900 1000 1100 1200 1300
Cu
rre
nt (
A)
-0.20
-0.15
-0.10
-0.05
0.00
0.05
0.10
0.15
0.201-inch Valve Large Coil MOV-1 MOV-2 SOV-1 SOV-1 SOV-2 Switchgear

5-10
Figure 5-8. Intermediate-scale test 1 cable loading configuration
Table 5-4. Intermediate-scale test 1 Time (s) Failure Observation 1361-1377 1-inch Valve SA 1375 SOV-1 Fuse Clear – Negative 1382 – 1384 1-inch Valve SA 1396 1-inch Fuse Clear – Negative 1449 Lg Coil SA
INTER-CABLE from 1-inch valve conductor P via Ground 1452 Lg Coil SA
INTER-CABLE from 1-inch valve conductor P via Ground 1460 – 1463 Lg Coil SA
INTER-CABLE from 1-inch valve conductor P via Ground 1467 Lg Coil Fuse Clear – Negative 1475 – 1558 MOV-1 SO Open Coil
INTER-CABLE from 1-inch valve conductors P and G via Ground 1516 – 1558 MOV-1 HS Close Coil 1558 MOV-1 Fuse Clear – Negative 1560 1-inch Valve Fuse Clear – Positive 2196 SWGR-C Fuse Clear – Negative 2269 MOV-1 Fuse Clear – Positive 2295 SOV-1 Fuse Clear – Positive 2512-2523 SOV-2 SA 2617 – 2661 MOV-2 HS Close Coil 2649 SOV-2 Fuse Clear – Positive & Negative 2654 – 2661 MOV-2 SO Open Coil 2663 MOV-2 Fuse Clear – Positive & Negative 2934 Lg Coil Fuse Clear – Positive 3938 – 4028 SWGR-T HS

5-11
Figure 5-9. Outstanding current hot shorting for intermediate-scale test 1 between 1-inch
valve, large coil, and MOV-1 circuits 5.3.4 Test 2 Table 5-5 presents the circuit failure chronologically. No inter-cable hot shorts occurred during this test. However, the cause of the fuse clear on SOV-2 is a result of inter-cable shorting between the SOV-2 and MOV-2 cables. These two cables were located in the same cable tray in the middle of the tray cable fill (see Figure 5-10). Review of the ground fault circuit data indicates that the battery negative was shorted to ground prior to the SOV-2 fuse clear. Thus, it is likely that the “N” conductor in SOV-2 shorted to ground initially, followed by MOV-2’s “P” conductor shorting to ground, resulting in an increased current, which would have caused the fuse in SOV-2 to clear. The current summation plot showing these interactions is presented in Figure 5-11.
Time (s)
1350 1400 1450 1500 1550 1600
Cu
rren
t (A
)
-4
-2
0
2
41-inch Valve Large Coil MOV-1 MOV-2 SOV-1 SOV-2 Switchgear

5-12
Figure 5-10. Intermediate-scale test 2 cable loading
Table 5-5. Intermediate-scale test 2 Time (s) Failure Observation 1030-1109 SOV-2 SA 1116 - 1142 MOV-2 HS Close 1145 - 1152 MOV-2 HS Close 1145 - 1152 MOV-2 HS Open 1156 - 1175 MOV-2 HS Close 1156 - 1173 MOV-2 HS Open 1164 SOV-2 Fuse Clear – Positive and Negative
Due to INTER-CABLE shorting with MOV-2 conductor P via Gnd 3909-3977 SOV-1 SA 3979 SOV-1 Fuse Clear – Negative 3975 1-inch Valve Fuse Clear – Positive 4247 - 4362 MOV-1 SO Open 4492 Lg Coil Fuse Clear - Negative
Location C
Location B
Location D Location E
Location A
LEGENDSG-T : Switchgear TripSG-C : Switchgear CloseS1 : SOV-1S2 : SOV-2M1: MOV-1M2: MOV-2LC : Large Coil1V : 1-inch ValveIC : Inter-cable circuit
S2M2
M1 S1
LC1V
NOT TO SCALE
Inter-cable Circuit

5-13
Figure 5-11. Outstanding current shorting in intermediate-scale test 2, between SOV-2
and MOV-2 5.3.5 Test 3 Three circuits were involved in inter-cable hot shorting during Intermediate-Scale Test #3. Figure 5-12 illustrates the cable loading arrangement, and Table 5-6 provides a circuit fault summary for Intermediate-Scale test 3. SOV-2 experienced two spurious operations as a result of an inter-cable hot short from the Switchgear Trip circuit cable located in a conduit. Because the switchgear cables were isolated from the other cables by their location in a conduit, the only possible way for this shorting to occur was through the ground plane. Figure 5-13 provides the current sum method plot showing the SOV-2 and switchgear circuit interactions. Following the SOV-2 spurious operations, the 1-inch valve circuit also experienced two spurious operations. Upon review of the voltage and current data, both 1-inch valve spurious operations were also caused by inter-cable shorting through the ground plane from the switchgear trip circuit. Figure 5-14 provides the current sum method plot showing the 1-inch valve and switchgear interaction.
Time (s)
1100 1120 1140 1160 1180 1200
Cu
rren
t (A
)
-5
0
5
101-inch Valve Large Coil MOV-1 MOV-2 SOV-1 SOV-2 Switchgear

5-14
Figure 5-12. Intermediate-scale test 3 cable loading
Table 5-6. Intermediate-scale test 3 Time (s) Failure Observation 1078 – 1090 MOV-2 SO Open Coil 1097 – 1128 MOV-2 SO Open Coil 1108 MOV-2 HS Close Coil 1111 – 1113 MOV-2 HS Close Coil 1127 MOV-2 HS Close Coil 1130 MOV-2 Fuse Clear – Positive 1168 MOV-2 Fuse Clear – Negative 1262 SOV-2 Fuse Clear – Positive 1361 – 1363 SOV-2 SO
INTER-CABLE from SWGR-T conductor P via Ground 1375 – 1406 SOV-2 SO
INTER-CABLE from SWGR-T conductor P via Ground 1419 SOV-2 Fuse Clear – Negative 1460 – 1468 SWGR-C SO 1468 SWGR-C Fuse Clear Positive and Negative 2188 – 2221 1-inch Valve SO
INTER-CABLE from SWGR-T conductor P via Ground 2226 – 2229 1-inch Valve SO
INTER-CABLE from SWGR-T conductor P via Ground 2231 1-inch Valve Fuse Clear – Negative 2286 1-inch Valve Fuse Clear – Positive 2288 Lg Coil Fuse Clear – Positive & Negative
INTER-CABLE SWGR-T conductor PT 2784 – 2787 MOV-1 SO Open Coil 2787 MOV-1 SO Fuse Clear – Positive and Negative 3066 SOV-1 Fuse Clear – Positive and Negative
Location C
Location B
Location D Location E
Location A
LEGENDSG-T : Switchgear TripSG-C : Switchgear CloseS1 : SOV-1S2 : SOV-2M1: MOV-1M2: MOV-2LC : Large Coil1V : 1-inch Valve
S2M2SG-C
M1 S1
SG-T
LC1V
NOT TO SCALEInter-cable Circuit

5-15
Figure 5-13. Outstanding current shorting in intermediate-scale test 3, between SOV-2
and SWGR-T
Figure 5-14. Outstanding current shorting in intermediate-scale test 3, between 1 inch
valve and SWGR-T
Time (s)
1340 1360 1380 1400 1420
Cu
rren
t (A
)
-4
-2
0
2
41-inch Valve Large Coil MOV-1 MOV-2 SOV-1 SOV-2 Switchgear
Time (s)
2140 2160 2180 2200 2220 2240
Cu
rre
nt (
A)
-1.0
-0.5
0.0
0.5
1.01-inch Valve Large Coil MOV-1 MOV-2 SOV-1 SOV-2 Switchgear

5-16
5.3.6 Test 4 No inter-cable spurious operations were observed during this test. Figure 5-15 provides a cable loading illustration, and Table 5-7 provides the chronology of circuit failures. The fuse clearing for the 1-inch valve circuit and the large coil circuit were caused by inter-cable shorting from the inter-cable circuit.
Figure 5-15. Intermediate-scale test 4 cable loading
Table 5-7. Intermediate-scale test 4 Time (s) Failure Observation 1530 1-inch valve Fuse Clear – Positive 1585 SOV-1 Fuse Clear – Positive – inter-cable with 1-inch valve conductor N 1671 Lg coil Fuse Clear – Positive
INTER-CABLE shorting from 1-inch valve conductor “N” 1671 1-inch valve Fuse Clear – Negative
INTER-CABLE shorting from Lg coil conductor “G” 1859 – 1895 MOV-1 SO Open Coil 1895 MOV-1 Fuse Clear – Positive and Negative 4766 SWGR-C Fuse Clear – Positive and Negative 4974 MOV-2 Fuse Clear – Positive and Negative 5216 – 5249 SOV-2 SO 5249 SOV-2 Fuse Clear – Positive and Negative 5305 SOV-1 Fuse Clear – Negative 5307 Lg coil Fuse Clear – Negative
Location C
Location B
Location D Location E
Location A
LEGENDSG-T : Switchgear TripSG-C : Switchgear CloseS1 : SOV-1S2 : SOV-2M1: MOV-1M2: MOV-2LC : Large Coil1V : 1-inch ValveIC : Inter-cable circuitac1-4 : SCDU circuits
ac1 ac2
ac4ac3
NOT TO SCALE
Inter-cable Circuit
M1 S1 1VLC
M2 S2 SG-C SG-T

5-17
5.3.7 Test 5 Figure 5-16 provides intermediate-scale test 5 cable loading, while Table 5-8 presents the circuit failure mode information in chronological order. As shown in Figure 5-17, SOV-1 experienced an inter-cable hot short at 1637 seconds from the SWGRSWGR-T circuit, which resulted in a spurious operation of the SOV-1 circuit. Conductor “PT” of the switchgear trip circuit shorted to ground, as did the SOV-1 coil conductor “S.” These two cables were located in different areas of the enclosure, and SOV-1 was actually located in a rigid steel conduit. Thus, these interactions required the ground plan. No other inter-cable spurious operations were identified.
Figure 5-16. Intermediate-scale test 5 cable loading
Table 5-8. Intermediate-scale test 5 Time (s) Failure Observation 655 1-inch valve Fuse Clear – Negative 819 – 908 Lg Coil SA 908 1-inch Valve Fuse Clear – Positive 910 Lg Coil Fuse Clear – Negative and Positive 1424-1429 SWGR-C SO Close 1429 SWGR-C Fuse Clear – Positive 1500 – 1573 MOV-2 Hot Short Close Coil 1510 – 1532 MOV-2 Hot Short Open Coil 1542 – 1573 MOV-2 Hot Short Open Coil 1556 SOV-1 Fuse Clear – Positive 1575 MOV-2 Fuse Clear – Positive and Negative 1596 SWGR-C Fuse Clear – Negative 1637 – 1649 SOV-1 SA
INTER-CABLE shorting from SWGR-T conductor PT 1646 – 1658 SOV-2 SA
Location C
Location B
Location D Location E
Location A
LEGENDSG-T : Switchgear TripSG-C : Switchgear CloseS1 : SOV-1S2 : SOV-2M1: MOV-1M2: MOV-2LC : Large Coil1V : 1-inch ValveIC : Inter-cable circuitac1-4 : SCDU circuits
LC1VS1
M2 S2
M1
SG-TSG-C
NOT TO SCALE
Inter-cable Circuit
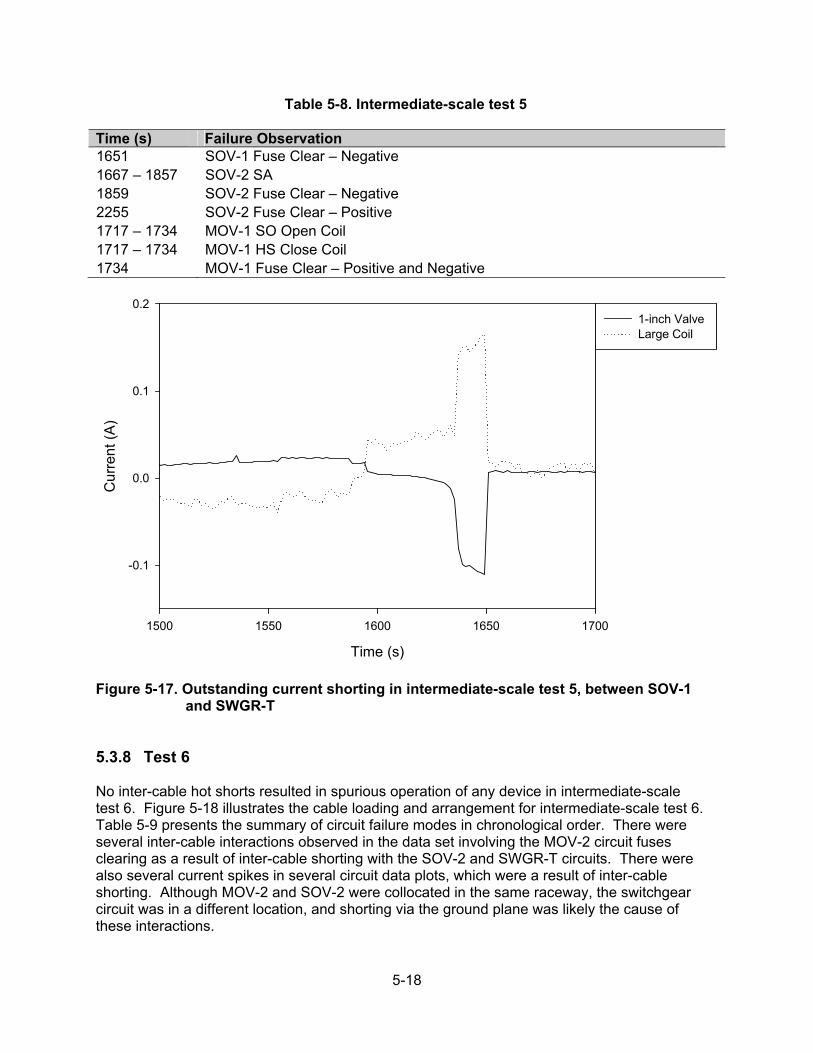
5-18
Table 5-8. Intermediate-scale test 5 Time (s) Failure Observation 1651 SOV-1 Fuse Clear – Negative 1667 – 1857 SOV-2 SA 1859 SOV-2 Fuse Clear – Negative 2255 SOV-2 Fuse Clear – Positive 1717 – 1734 MOV-1 SO Open Coil 1717 – 1734 MOV-1 HS Close Coil 1734 MOV-1 Fuse Clear – Positive and Negative
Figure 5-17. Outstanding current shorting in intermediate-scale test 5, between SOV-1
and SWGR-T 5.3.8 Test 6 No inter-cable hot shorts resulted in spurious operation of any device in intermediate-scale test 6. Figure 5-18 illustrates the cable loading and arrangement for intermediate-scale test 6. Table 5-9 presents the summary of circuit failure modes in chronological order. There were several inter-cable interactions observed in the data set involving the MOV-2 circuit fuses clearing as a result of inter-cable shorting with the SOV-2 and SWGR-T circuits. There were also several current spikes in several circuit data plots, which were a result of inter-cable shorting. Although MOV-2 and SOV-2 were collocated in the same raceway, the switchgear circuit was in a different location, and shorting via the ground plane was likely the cause of these interactions.
Time (s)
1500 1550 1600 1650 1700
Cu
rren
t (A
)
-0.1
0.0
0.1
0.21-inch Valve Large Coil

5-19
Figure 5-18. Intermediate-scale test 6 cable loading
Table 5-9. Intermediate-scale test 6 Time (s) Failure Observation 191 SOV-2 Fuse Clear – Negative 230 MOV-2 Fuse Clear – Negative
INTER-CABLE with SOV-2 850 SWGR-T SO [Breaker Open] 1168 SOV-2 Fuse Clear – Positive 1170 MOV-2 Fuse Clear – Positive
INTER-CABLE with SWGR-T conductor N2 1317 Lg Coil Fuse Clear – Positive and Negative 1400 – 1502 SOV-1 SO 1480 – 1507 MOV-1 SO Close Coil 1534 – 1567 Short between SOV-1 conductor G and SWGR-C conductor N1 1567 SOV-1 Fuse Clear – Positive and Negative 1548 – 1637 1-inch Valve SO 1603-1607 SWGR-C SO [Breaker Close] 1603-1607 SWGR-T SO [Breaker Open] 1638 1-inch Valve Fuse Clear – Negative 1728 SWGR-C and SWGR-T Fuse Clear – Negative 5.3.9 Test 7 No inter-cable hot shorts were identified in intermediate-scale test 7. Figure 5-19 and Table 5-10 provide the cable loading configurations and summarize the circuit failure modes in chronological order. Ground plane influences can be associated with the concurrent fuse
Location C
Location B
Location D Location E
Location A
LEGENDSG-T : Switchgear TripSG-C : Switchgear CloseS1 : SOV-1S2 : SOV-2M1: MOV-1M2: MOV-2LC : Large Coil1V : 1-inch Valveac1-4 : SCDU circuits
S2M2
SG-C
1V LC
SG-T
S1M1
NOT TO SCALE
Inter-cable Circuit

5-20
clearing of MOV-1, MOV-2, and SOV-2 1286 seconds into the test. At this point, the battery transitioned from being grounded on its positive side to being grounded on its negative side.
Figure 5-19. Intermediate-scale test 7 cable loading
Table 5-10. Intermediate-scale test 7 Time (s) Failure Observation 302 – 363 SOV-1 SO 324 MOV-1 Fuse Clear – Negative 363 SOV-1 Fuse Clear – Positive and Negative 466 SOV-2 Fuse Clear – Negative 535 MOV-2 Fuse Clear – Negative 1095 SWGR-T SO [Breaker Open] 1258 SWGR-C Fuse Clear – Negative 1286 MOV-1 Fuse Clear – Positive 1286 MOV-2 Fuse Clear – Negative 1286 SOV-2 Fuse Clear Positive 1388 SWGR-T Fuse Clear – Negative 1426 Lg Coil Fuse Clear – Negative 1713 – 1762 1-inch Valve SO 1762 1-inch Valve Fuse Clear – Negative 5.3.10 Test 8 Figure 5-20 shows the cable loading configuration for intermediate-scale test 8 while Table 5-11 contains the failure mode summary information, presented in chronological order. One inter-cable hot short was observed, which resulted in the spurious operation of MOV-1 close coil. This short occurred when the G conductor of the large coil cable came into electrical contact
Location C
Location B
Location D Location E
Location A
LEGENDSG-T : Switchgear TripSG-C : Switchgear CloseS1 : SOV-1S2 : SOV-2M1: MOV-1M2: MOV-2LC : Large Coil1V : 1-inch Valveac1-4 : SCDU circuits
S1M1LC
SG-C SG-T
1V
S2M2
NOT TO SCALEInter-cable Circuit
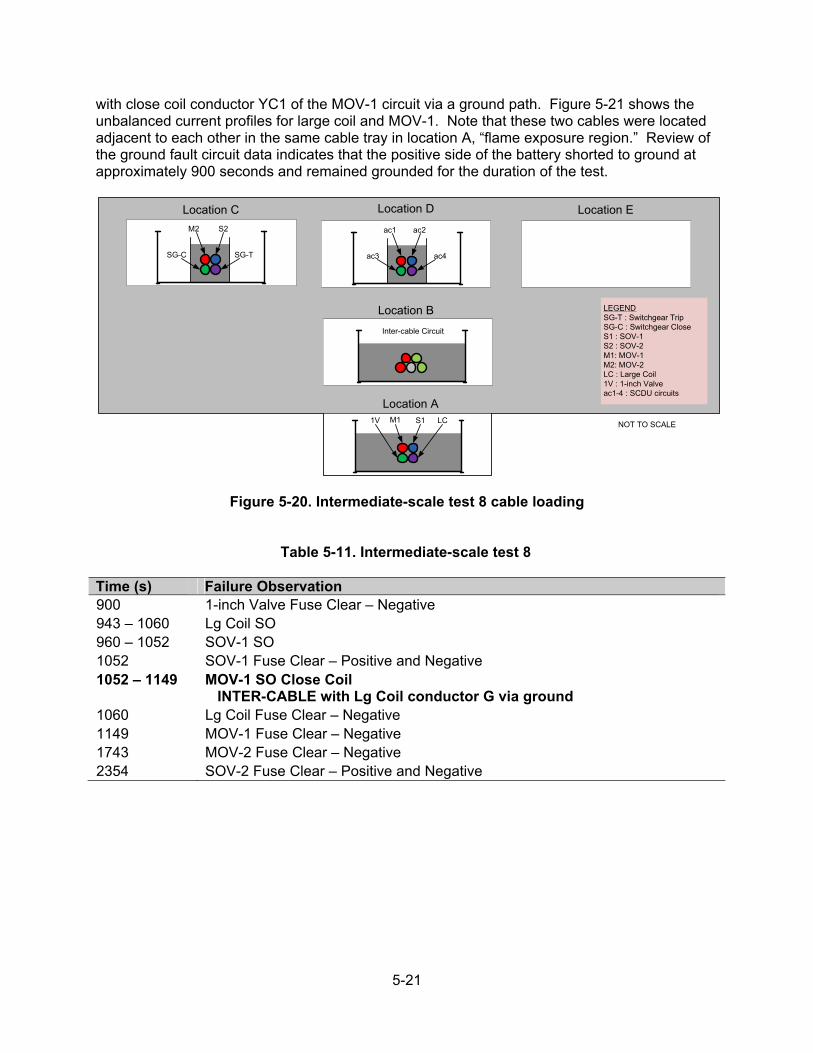
5-21
with close coil conductor YC1 of the MOV-1 circuit via a ground path. Figure 5-21 shows the unbalanced current profiles for large coil and MOV-1. Note that these two cables were located adjacent to each other in the same cable tray in location A, “flame exposure region.” Review of the ground fault circuit data indicates that the positive side of the battery shorted to ground at approximately 900 seconds and remained grounded for the duration of the test.
Figure 5-20. Intermediate-scale test 8 cable loading
Table 5-11. Intermediate-scale test 8 Time (s) Failure Observation 900 1-inch Valve Fuse Clear – Negative 943 – 1060 Lg Coil SO 960 – 1052 SOV-1 SO 1052 SOV-1 Fuse Clear – Positive and Negative 1052 – 1149 MOV-1 SO Close Coil
INTER-CABLE with Lg Coil conductor G via ground 1060 Lg Coil Fuse Clear – Negative 1149 MOV-1 Fuse Clear – Negative 1743 MOV-2 Fuse Clear – Negative 2354 SOV-2 Fuse Clear – Positive and Negative
Location C
Location B
Location D Location E
Location A
LEGENDSG-T : Switchgear TripSG-C : Switchgear CloseS1 : SOV-1S2 : SOV-2M1: MOV-1M2: MOV-2LC : Large Coil1V : 1-inch Valveac1-4 : SCDU circuits
M2 S2
SG-TSG-C
NOT TO SCALE
Inter-cable Circuit
M1 S1 LC1V
ac1 ac2
ac4ac3

5-22
Figure 5-21. Outstanding current shorting in intermediate-scale test 8, between MOV-1
and Lg Coil 5.3.11 Test 9 Figure 5-22 presents the cable loading configuration for intermediate-scale test 9, and Table 5-12 provides the chronological order of the failure modes identified during this test. Three inter-cable spurious operations were observed during this test. MOV-2 open coil went through spurious operation for 24 seconds via inter-cable shorting from conductors “G” and “P” of the large coil circuit. Note that these two cables are set in different locations in the hood: MOV-2 is in location D, while the large coil circuit is in the cable tray immediately below in Location B. At 1552 seconds into the test, the SOV-2 circuit experienced an inter-cable spurious operation from the same source conductors as MOV-2 (namely conductors “G” and “P” from the large coil circuit). This spurious operation lasted for 28 seconds. Again, both cables involved in the shorting were set in different cable tray locations. The third and final inter-cable spurious operation occurred when the MOV-1 close coil actuated after being energized by the switchgear trip circuit. This spurious operation lasted for 16 seconds. In this case, the cables involved were located in the same cable tray and were not adjacent to each other, but were separated by a fill cable.
Time (s)
1000 1050 1100 1150 1200
Cur
rent
(A
)
-1.0
-0.5
0.0
0.5
1.01-inch Valve Large Coil MOV-1 MOV-2 SOV-1 SOV-2 Switchgear

5-23
Figure 5-22. Intermediate-scale test 9 cable loading
Table 5-12. Intermediate-scale test 9 Time (s) Failure Observation 628 – 638 1-inch Valve SA 765 Lg Coil Fuse Clear – Negative 765 1-inch Valve Fuse Clear – Positive and Negative 1253 – 1277 MOV-2 SO Open Coil
INTER-CABLE shorting with Lg Coil conductors G & P via ground 1278 MOV-2 Fuse Clear – Negative 1552 – 1580 SOV-2 SA
INTER-CABLE shorting with Lg Coil conductors G & P via ground 1583 SOV-2 Fuse Clear – Negative 1602 Lg Coil Fuse Clear – Positive – Short w/SWGR-T cond. N2 via ground 1604 SOV-2 Fuse Clear – Positive – Short w/SWGR-T cond. N2 via ground 1605 MOV-2 Fuse Clear – Positive – Short w/SWGR-T cond. N2 via ground 1920 SWGR-C Fuse Clear – Positive 2420 SWGR-C Fuse Clear – Negative – Short w/SOV-1 cond. P via ground 2584 – 2696 SOV-1 SO 2611 – 2627 MOV-1 SO Close Coil
INTER-CABLE shorting with SWGR-T conductor P via ground 2638 MOV-1 Fuse Clear – Negative 2699 SOV-1 Fuse Clear – Positive and Negative – Short w/SWGR-T cond. P
Location C
Location B
Location D Location E
Location A
LEGENDSG-T : Switchgear TripSG-C : Switchgear CloseS1 : SOV-1S2 : SOV-2M1: MOV-1M2: MOV-2LC : Large Coil1V : 1-inch Valveac1-4 : SCDU circuits
NOT TO SCALE
Inter-cable Circuit
TC
TC TC
1V
LC M1 S1
TC
M2S2 SG-C
SG-T

5-24
5.3.12 Test 10 The cable configuration used in intermediate-scale test 10 is shown in Figure 5-23, and the chronological order of the cable failures is presented in Table 5-13. The results show that there were three spurious operations and one hot short as a result of ground fault equivalent shorting. In all four instances, the source of the interactions could not be identified; however, this test configuration has the inter-cable testing configuration in location A, directly above the fire. This experimental set-up likely caused the inter-cable source conductors (which were not monitored for current) to short to the ground plane and aid in the four cases of inter-cable shorting. The first inter-cable spurious operation involved the MOV-2 close coil. It actuated at 2798s for 37 seconds, and the cable associated with this circuit was set in location B, directly above location A, where the inter-cable test configuration was located. The second inter-cable spurious operation occurred in location C and involved the MOV-1 open coil, which actuated at 3579s for 15 seconds.
Figure 5-23. Intermediate-scale test 10 cable loading
Table 5-13. Intermediate-scale test 10 Time (s) Failure Observation 2502 SOV-2 Fuse Clear – Negative 2635 – 2644 1-inch Valve SO 2646 1-inch Valve Fuse Clear – Positive and Negative 2798 – 2835 MOV-2 SO Close Coil
INTER-CABLE unknown source – likely inter-cable test circuit 2890 Lg Coil Fuse Clear – Positive and Negative 3108 SWGR-T SO [Breaker Open] 3177 SWGR-C Fuse Clear – Positive 3236 SWGR-C Fuse Clear – Negative 3579 – 3594 MOV-1 SO Open Coil
Location C
Location B
Location D Location E
Location A
LEGENDSG-T : Switchgear TripSG-C : Switchgear CloseS1 : SOV-1S2 : SOV-2M1: MOV-1M2: MOV-2LC : Large Coil1V : 1-inch Valveac1-4 : SCDU circuits
TC
TC
1V
LC
NOT TO SCALEInter-cable Circuit
TC
TC
S1
M1
TC TC TC
M2 SG-T/C S2

5-25
Table 5-13. Intermediate-scale test 10 Time (s) Failure Observation
INTER-CABLE unknown source – likely inter-cable test circuit 3594 – 3646 MOV-1 SO Close Coil
INTER-CABLE unknown source – likely inter-cable test circuit 3594 – 3605 MOV-1 HS Open Coil
INTER-CABLE unknown source – likely inter-cable test circuit 3646 SOV-2 Fuse Clear – Positive 3646 SOV-1 Fuse Clear – Positive and Negative 3646 MOV-1 Fuse Clear – Positive The inter-cable interactions that occurred during intermediate-scale test #10 could not be linked to any of the circuits that monitored current. Thus, these inter-cable interactions are likely a result of interactions from the inter-cable circuit, which was not equipped with current-monitoring transducers. These inter-cable interactions occurred in the MOV-2 and MOV-1 circuits. 5.3.13 Test 11 Intermediate-scale test 11 experienced one inter-cable ground equivalent hot short. Figure 5-24 illustrates the cable loading configuration for test 11, and Table 5-14 presents the chronological fault mode sequence. The SOV-2 circuit went through spurious operation 2858s into the test, and was powered by the “P” conductor of the large coil circuit. This interaction is shown in Figure 5-25, where the large coil circuit is supplying power (positive current) and the SOV-2 circuit is absorbing power (negative current). The cables that are connected to this circuit are located in different exposure locations; SOV-2 is in location D, directly above the large coil cable in location B. The different locations and a review of the ground fault detection circuit response, which shows that the battery positive shorted to ground at approximately 1440 seconds, indicate that this inter-cable interaction is a result of ground equivalent hot shorting.
Figure 5-24. Intermediate-scale test 11 cable loading
Location C
Location B
Location D Location E
Location A
LEGENDSG-T : Switchgear TripSG-C : Switchgear CloseS1 : SOV-1S2 : SOV-2M1: MOV-1M2: MOV-2LC : Large Coil1V : 1-inch Valveac1-4 : SCDU circuits+/- : power source cable
NOT TO SCALE
Inter-cable Circuit
M1 S1 LC1V
M2 S2
TC
ac1ac3
+/-
ac2

5-26
Table 5-14. Intermediate-scale test 11
Time (s) Failure Observation 1179 – 1197 MOV-1 SO Open Coil 1182 – 1197 MOV-1 HS Close Coil 1197 MOV-1 Fuse Clear – Positive and Negative 1310 – 1312 1-inch Valve SO 1319 – 1323 1-inch Valve SO 1429 1-inch Valve Fuse Clear – Negative 1432 Lg Coil SO 1437 Lg Coil Fuse Clear – Negative 1569 SOV-1 Fuse Clear – Positive and Negative 2749 MOV-2 Fuse Clear – Negative – short with Lg Coil cond. P & G 2858 – 2917 SOV-2 SA
INTER-CABLE shorting from Lg Coil conductors P 2917 SOV-2 Fuse Clear – Negative 3351 MOV-2 Fuse Clear – Positive 3352 SOV-2 Fuse Clear – Positive
Figure 5-25. Intermediate-scale test 11 current summation
Time (s)
2840 2860 2880 2900 2920
Cur
rent
(A
)
-0.3
-0.2
-0.1
0.0
0.1
0.2
0.31-inch Valve Large Coil MOV-1 MOV-2 SOV-1 SOV-2

5-27
5.3.14 Test 12 The cable loading configuration for this test is shown in Figure 5-26. Intermediate-scale test 12 experienced four inter-cable hot short-induced spurious operations. The source of the first two spurious operations could not be identified, and, due to the location of the inter-cable test configuration (location A), it is likely that the source came from this circuit. The other possible source is a 35A +/- cable that was used to evaluate the response of the high-current transducers. The current transducers did not pick up any current measurements; however, the laboratory had difficulties getting these high-current transducers to function properly, so, although it is unlikely that the 35A +/- cable was the source of the inter-cable interactions, the lack of reliable data for the large 500A current transducers does not completely rule out the 35A +/- cable. Fuses of the inter-cable circuit cleared at approximately 3125 seconds. After this time, the remaining two inter-cable spurious operations occurred, and the source cables for these interactions could be identified. The last piece of information that pointed to the inter-cable test cables being the source of the first two inter-cable spurious operations was that the inter-cable test configuration was located in Location A, as was done in intermediate-scale test 10, which also experienced inter-cable shorting that could not identify the source cables. From all of these observations, it is highly probable that the source cable for the first two inter-cable shorting events is from the inter-cable test configuration in location A.
Figure 5-26. Intermediate-scale test 12 cable loading Current summation plots are presented in Figure 5-27(a-d) for each of the inter-cable spurious operations. As shown in Figure 5-27(a) and (b), there is no source current in these plots from any of the surrogate circuits. Figure 5-27(c) and (d) show the source current from the 1-inch and large coil circuits, respectively. It is interesting to note that in Figure 5-27(d), the large coil cable is shorting via the ground to MOV-1 and 1-inch valve circuit, but no spurious operation results.
Location C
Location B
Location D Location E
Location A
LEGENDSG-T : Switchgear TripSG-C : Switchgear CloseS1 : SOV-1S2 : SOV-2M1: MOV-1M2: MOV-2LC : Large Coil1V : 1-inch Valveac1-4 : SCDU circuits+/- : power source cable 35A
S2M2
TC
TC
M1
1V
NOT TO SCALEInter-cable Circuit
ac1 ac2
LC
S1
TC
ac3
+/-

5-28
Figure 5-27. Intermediate-scale test 12 current summation plot Table 5-15 presents the circuit failure mode summary for intermediate-scale test 12. The first inter-cable ground fault equivalent hot short-induced spurious operation involved energizing the MOV-2 close coil. The MOV-2 circuits-associated cable is in Location B, while the probable source (the inter-cable test configuration) is located directly below in Location A. Even if the 35A +/- cable is the source, it is located in a different tray than the MOV-2 circuit, specifically in location C in the hot gas layer exposure. The next inter-cable spurious operation involves the
Time (s)
2100 2150 2200 2250 2300 2350 2400
Cur
rent
(A
)
-1.0
-0.5
0.0
0.5
1.0
1-inch Large Coil MOV-1 MOV-2 SOV-1 SOV-2 SwGr
Time (s)
2700 2720 2740 2760 2780 2800 2820 2840
Cur
rent
(A
)
-6
-4
-2
0
2
4
6
Time (s)
2860 2880 2900 2920 2940 2960 2980
Cur
rent
(A
)
-6
-4
-2
0
2
4
6
Time (s)
3100 3110 3120 3130 3140 3150 3160
Cur
rent
(A
)
-8
-6
-4
-2
0
2
4
6
8
(a) (b)
(c) (d)

5-29
large coil circuit at 2746 seconds. This cable is located at the highest exposure position in the plume (location D). The probable source cable is the inter-cable test configuration located in the flame exposure, Location A. For the last two instances of spurious operation, it was possible to identify the source cables. The third ground equivalent hot short-induced spurious operation involved the 1-inch valve cable providing the source power to energize the large coil. In this case, both cables are in location D, and are located adjacent to each other (they make physical contact). The interactions between the ground plane and the battery potentials, as shown in Figure 5-28, indicate that this failure is associated with ground-plane interactions, so it is unlikely that this spurious operation was a cable-to-cable failure, and more likely that it was a ground equivalent hot short-induced spurious operation.
Table 5-15. Intermediate-scale test 12 Time (s) Failure Observation 2233 – 2340 MOV-2 SO Close Coil
INTER-CABLE unknown source (not from 35A +/- cable) 2314 SOV-2 Fuse Clear – Negative 2343 MOV-2 Fuse Clear – Positive and Negative 2540 SOV-2 Fuse Clear – Positive 2746 – 2797 Lg Coil SO
INTER-CABLE unknown source (not from 35A +/- cable) 2901 – 2939 Lg Coil SO
INTER-CABLE 1-inch Valve conductor R via ground 2939 1-inch Valve Fuse Clear – Positive 3031 MOV-1 Fuse Clear – Positive 3129 1-inch Valve Fuse Clear – Negative – shorting with Lg Coil 3131 – 3136 SOV-1 SO
INTER-CABLE Lg Coil conductor P via ground 3141 SOV-1 Fuse Clear – Positive and Negative 3143 Lg Coil SO 3146 – 3154 Lg Coil SO 3155 Lg Coil Fuse Clear – Positive

5-30
Figure 5-28. Ground fault detection voltage response for second large coil SO 5.3.15 Contingency test A Contingency test A evaluated the anti-pump circuit of the medium-voltage switchgear and only two cables co-located in the same cable tray (location B) connected to the trip and close circuitry. This test’s cable loading configuration is shown in Figure 5-29, and a summary of the failure behavior is provided in Table 5-16. There were no inter-cable hot short-induced spurious operations observed during this test.
Figure 5-29. Intermediate-scale test contingency A cable loading configuration
Time (seconds)
2890 2900 2910 2920 2930 2940 2950
Vol
tage
(V
dc)
-150
0
150
Fire Time (s) vs Ground_VT7_1 Fire Time (s) vs Ground_VTU_1 Fire Time (s) vs Ground_VTU_2

5-31
Table 5-16. Intermediate-scale contingency test A Time (s) Failure Observation Note: Breaker is closed, and jumper is installed between C1 (close coil) and
PC (positive power conductor); this is to evaluate anti-pump ckt 406 SWGR-T SO [Breaker open] 408 SWGR-C SO (self-induced due to jumper) [Breaker closed] 409 SWGR-T SO [Breaker open] 423 SWGR-C Fuse Clear – Negative 5.3.16 Contingency test B Contingency test B is a repeat of contingency test A. The experimental set-up is the same as before, and is shown in Figure 5-29 above. Table 5-17 provides the circuit failure mode summary, indicating that no inter-cable hot short-induced spurious operations were observed during this test.
Table 5-17. Intermediate-scale contingency test B Time (s) Failure Observation 337 SWGR-T Fuse Clear – Negative 354 SWGR-C Fuse Clear – Positive 458 SWGR-C Fuse Clear – Negative 5.3.17 Intermediate Scale – Inter-cable hot short induced spurious operation
conclusions Table 5-18 summarizes the failure modes for each test by breaking down the initial failure mode into either intra-cable spurious operation, ground fault equivalent spurious operation, or a fuse clear. The table identifies the number of each failure type, and also lists the circuits that experienced those failures immediately below the number. It is interesting to note that a fair portion of inter-cable hot short-induced spurious operations occurred in the intermediate-scale testing. In particular, these types of failures occurred between cable trays located in different thermal exposure conditions. The fact that location E was only used in one test (Test 4) causes the authors to question whether there would have been more hot short inter-cable spurious operation with similar exposure conditions and cable loading configurations in locations C and E. Had these two locations used similar cable types and loading, this may have resulted in cable failures occurring within a similar time frame, and may have resulted in more inter-cable interactions. This is strictly the authors’ observation, and no data is available to confirm this hypothesis. However, this observation does bring into question the conservatism of the number of inter-cable hot short interactions that may have resulted in more realistic scenarios. The number of ground fault equivalent hot short induced spurious operations would depend on the cable loading within the affected fire area, the associated components that the cables are connected to, and the availability of a common power supply among the affected cables.

5-32
Table 5-18. Summary of initial failure mode for inter-cable test circuits
Test # Intra-cable SO
Inter-cable SO (Gnd equivalent SO) Fuse Clear
1 3 1-inch, MOV-2, SOV-2
2 Lg Coil, MOV-1
2 SOV-1, SWGR
2 3 MOV-1, MOV-2, SOV-2
0
3 1-inch, Lg Coil, SOV-1
3 3 MOV-1, MOV-2, SWGR
2 1-inch, SOV-2
2 Lg Coil, SOV-1
4 2 MOV-1, SOV-2
0
5 1-inch, Lg Coil, MOV-2, SOV-1, SWGR
5 5 Lg Coil, MOV-1, MOV-2, SOV-2, SWGR
1 SOV-1
1 1-inch
6 4 1-inch, MOV-1, SOV-1, SWGR
0
3 MOV-2, SOV-2, SWGR
7 3 1-inch, SOV-1, SWGR
0
4 Lg Coil, MOV-1, MOV-2, SOV-2
8 2 Lg Coil, SOV-1
1 MOV-1
3 1-inch, MOV-2, SOV-2
9 2 1-inch, SOV-1
3 MOV-1, MOV-2, SOV-2
2 Lg Coil, SWGR
10 2 1-inch, SWGR
2 MOV-1, MOV-2
3 Lg Coil, SOV-1, SOV-2
11 4 1-inch, Lg Coil, MOV-1, SWGR
1 SOV-2
2 MOV-2, SOV-1
12 0
3 Lg Coil, MOV-2, SOV-1
4 1-inch, MOV-1, SOV-2, SWGR
Avg. 2.75/test 40.25% of population
1.25/test 18.25% of population
3.83/test 41.5% of population
6-1
6. SUMMARY OF FINDINGS
6.1 Alternating Current Test Results (NEI/EPRI, CAROLFIRE, DESIREE-FIRE)
Section 2 evaluated the experimental alternating current (AC) data by looking at various physical attributes that may influence the likelihood of an AC circuit experiencing a particular fire-induced fault mode, and also by evaluating the effects that these parameters have on hot short duration. This evaluation has proven difficult in numerous instances because the experimental set-up was based on configurations typically encountered in U.S. nuclear power plants (NPPs). Thus, in many cases, there is a large amount of data for one particular bin or configuration and minimal to no data to allow other configurations to provide an adequate comparison. The following parameters showed this to be true for the AC circuit fire-induced fault mode likelihood evaluation:
Conductor count (95% of data for 7-9/C count) Cable orientation (95% of data for horizontal orientation) Raceway routing (95% of data for cable tray; 3% conduit; 2% air drop) Circuit grounding (88% of data is for grounded circuits) Wiring configuration (95% of data has two sources, four targets, and one return)
This review also showed that additional data may be useful in providing a more detailed evaluation of thermal exposure conditions. Here radiant exposures only contribute to 4.5% of the data set. Note that these recommendations only identify areas where additional data is needed to provide more information to better understand the associated physical configuration effect of the parameter under evaluation. These recommendations are not based on the applicability of the parameter’s actual use in U.S. NPPs. For instance, although it may be beneficial to have more data on ungrounded circuits to better evaluate their fault modes and hot short durations, it is likely that only a small portion of U.S. NPPs actually use ungrounded AC configurations. In this instance, priorities and resources may be better served collecting data to evaluate the effects of other parameters, such as cable orientation or cables in conduits. Parameters that showed signs of influencing the fault mode likelihood of fire-induced damage include:
Thermal exposure conditions o In the flame region, there is a higher likelihood of experiencing hot shorts (72%)
and spurious operations (68%) than there is in the plume (46% SA, 59% HS) or hot gas layer (51% SA, 58% HS) exposures.
Raceway fill o Bundle configurations show a higher likelihood of hot shorts (74%) and spurious
operations (70%) than cable trays with intermediate fill (47% HS, 37% SA) or single fill (48% HS, 35% SA).
An interesting observation from analysis of the data is the fact that thermoset (TS)- and thermoplastic (TP)-insulated cables have nearly the same likelihood of experiencing a spurious operation. The NEI/EPRI data report identifies that thermoset insulated cables spuriously operated 26 out of 126 trials (20.6%), while the thermoplastic insulated cables spuriously

6-2
operated 19 out of 39 trials (48.7%). During the EPRI expert elicitation panel, one member identified this cable insulation material influence on spurious operation likelihood as a moderate dependence for intra-cable and significant for inter-cable hot shorts, while other members were silent on the insulation material influence on spurious operation likelihood. However, the EPRI expert elicitation report states the following with regard to the differences between thermoset and thermoplastic cables;
“It is important to point out that, once cable damage has occurred, be it manifested as a hot short or as another phenomenon, the probability of spurious actuation given cable damage (PSACD) does not display significant differences between thermoset and thermoplastic cables”
NUREG/CR-6850 adopted the conclusion from the EPRI expert elicitation report that insulation type does not influence spurious operation likelihood. At the beginning of the electrical expert PIRT panel a common belief among the panel members was that the two cable insulation types would have different likelihood of experiencing hot short-induced spurious operations; however, the data presented in this report does not substantiate this effect, and in fact shows that TP-insulated cables have a 51% likelihood of spurious operation, while TS-insulated cables have a 52% likelihood, based on the data. After the material contained in this report was presented to the PIRT panel, they agreed unanimously that insulation type has no effect on spurious operation likelihood. Therefore, the data presented here and the PIRT panel’s conclusions suggest that insulation type makes no difference to the likelihood of experiencing one failure mode over another for the intra-cable category, although the polymer properties do influence the thermal failure point, that is, the point where the cable begins to degrade physically. In addition to evaluating the fault mode likelihoods, this report also explored the parameter effects on the duration of hot shorts and spurious operations. Those parameters where the data indicated an effect on the duration of hot shorts or spurious operations included:
Thermal exposure conditions o As the thermal exposure conditions become less intense, the durations of the hot
shorts/spurious operations increase. Raceway routing
o Data indicated that air drops and conduit raceways have a longer duration than cable trays; however, there is only a limited data set for the air drop (2 tests) and conduit (4 tests) configurations.
Raceway fill o Intermediate raceway loading configurations have longer-lasting hot
shorts/spurious operations than the other two configurations (bundle, single). Conductor size
The data shows that cables with 14 AWG conductors experience longer durations than cables with 12 AWG conductors.

6-3
6.2 Direct Current Test Results (DESIREE-FIRE) Section 4 evaluated the experimental data by looking at various physical attributes that may influence the likelihood of a DC circuit experiencing a particular fire-induced fault mode, and also by evaluating the effects that these parameters have on hot short duration of dc circuits. The entire dc test data set came from a single test series, namely, the U.S. Nuclear Regulatory Commission (NRC)-sponsored DESIREE-FIRE project. As a result of this being the first and only testing of dc circuits, not every configuration could be tested with the limited amount of resources available to perform the testing. This resulted in a number of configurations that lacked a sufficient variety of configurations to provide comparisons for the parameter under evaluation in this effort. Examples include:
Conductor count (94% 7-9/C, 3% 2-6/C, and 3% 10-15/C) Cable orientation (100% of dc data utilized horizontal orientation) Raceway routing (87% cable tray, 13% conduit, 0% air drop) Conductor size (92% for #12 AWG conductors) Cable shielding (93% non-shielded cable)
Parameters that showed signs of influencing the fault mode likelihood of fire-induced damage include:
Raceway Fill (bundled configurations showed lower likelihood of spurious operations) Armor (non-grounded circuits result in high spurious operation likelihood) Circuit Type (motor-operated valve (MOV) circuit has larger likelihood of experiencing a
spurious operation – two active targets) In the evaluation of the dc test data, the following parameters showed signs of influencing hot short duration:
Insulation type (TP longer than TS) Insulation/Jacket type (TP-TP longest, followed by TS-TS, followed by TS-TP) Conductor size (12 AWG has shorter durations than 14 AWG) Fuse Size (larger fuses have longer hot short durations)
6.3 Ground Equivalent Hot Shorts The analysis of the dc testing results has shown that shorts through ground plane or common conductors are possible, provided that the circuits involved are ungrounded and use a common power supply. Although this phenomenon was only observed in dc tests, it is likely that similar results would have occurred in the AC testing, had that testing been set up in a similar manner. Since the NRC AC tests only had one circuit ungrounded, there was no chance for such a failure mode to present itself in the NRC AC tests. This testing is the first observation of the ground equivalent hot short phenomenon. This phenomenon was theorized in NUREG/CR-6834, “Circuit Analysis – Failure Mode and Likelihood Analysis,” as multiple shorts to ground. However, little to no evidence was available at that time to substantiate the likelihood of such events.

6-4
The results from the DESIREE-FIRE testing now show that these events occurred quite frequently during the intermediate-scale testing. An important concept to take away from the data is that a maximum of eight circuits could be instrumented in each test, thus limiting the likelihood of multiple circuits shorting to ground at the same time to cause these ground fault equivalent hot shorts. Had the cable trays been loaded to the more typical loading configurations found in plants, it could be postulated that a higher percentage of ground equivalent hot shorts would have occurred. Another complicating factor is the fact that most dc circuits have fuses on both ends of the circuit. Thus, clearing a single fuse does not eliminate the possibility of experiencing a short to ground that may interact with another circuit shorted to ground. The last thought on this phenomenon is that some licensees have placed safety-significant cables in dedicated conduits to provide some sort of separation or protection. The dc testing results have shown that, from a fire-induced failure standpoint, these cables are still vulnerable to ground equivalent hot shorts.

7-1
7. CONCLUSIONS AND FUTURE RESEARCH RECOMMENDATIONS Fire-induced circuit failure testing has evolved over the years, and today’s focus on obtaining realistic test results to advance the state-of-the-art in fire probabilistic risk assessment (PRA) has allowed the scientific community to better understand the failure modes of fire-induced electrical cable damage. The consolidation of the three major fire testing programs has allowed for a better understanding of key circuit parameters that can affect the likelihood of a circuit experiencing a particular failure mode and the duration of hot shorts. This report has identified that cable armor, raceway fill configurations, and circuit type can influence the fire-induced failure modes of electrical cable. To better understand the effect armor has, it is suggested that additional testing be conducted on armor and cables with metallic shields or drain wires. This consolidation has identified that concurrent hot shorts can occur and have occurred during testing. The opportunities for concurrent hot shorts to occur are increased when fire conditions exist to cause cable to fail at the same time. The information presented here shows that even different cable insulation types can experience concurrent spurious operation hot shorts due to different thermal exposure conditions causing the different cable types to fail during the same timeframe. This work has determined that multiple cable shorts to ground are plausible failure modes, and should be addressed in both deterministic and performance-based methods. Provided that an ungrounded power supply is used (such as is common for station batteries), the fire damage to control circuits powered from the same common power supply can result in shorts to ground causing system spurious operations. Although this failure mode was identified in NUREG/CR-6834,”Circuit Analysis – Failure Mode and Likelihood Analysis,” it wasn’t until the DESIREE-Fire results were thoroughly reviewed that this failure mode was actually identified as actually occurring. This report has also identified areas where additional data would provide a better understanding of a parameter’s effect on a cable failure mode. Such areas include, expanding the range of conductor count within a multi-conductor control cable. The core set of data collected thus far has focused on 7-9/C cables. In the field, large multi-conductor cables commonly referred to as “trunk cables” are used to transmit control signals from the main control room to relay rooms, and auxiliary control rooms. There is no publicly available data on the fire-induced failures of these types of cables which commonly have 37 or more conductors per cable. The variation of cable types and failure criteria has also been limited in past testing. The majority of the cables tested was of a control type, and even when instrumentation or power cables were tested, the failure criteria were not tailored to the specific thresholds that would constitute a failure of the associated system in the field. As such the authors believe that there should be a fire testing standard developed to standardize the testing methods and acceptance/failure criteria of when cables experience functional failure. This standard would likely reduce the costs associated with testing and allow for an entity such as EPRI or NEI to collect such data for improvement of fire PRA estimation of conditional probabilities of cable damage. With the exception of a limited set of the NEI/EPRI test data, the cables were tested in a horizontal straight configuration. In field applications, there are commonly cable runs in vertical

7-2
and inclined configurations as well as bends and t-connections. Future testing should consider such configurations. A large majority of the AC testing has been limited to testing grounded AC circuits as this is a common configuration found in the field. However, the authors are aware of some plants that use ungrounded AC systems, and, as such, it is suggested that future research include a larger portion of typical ungrounded AC circuits to generate a more substantial set of data from which to develop conclusions. In particular, the likelihood of hot short and subsequent hot short durations for common ungrounded AC circuit designs should be evaluated. In addition, the AC data is sparse, and the use of conduits and any AC grounded/ungrounded tests should include conduit raceways to better understand the applicability of the current methodology in NUREG/CR-6850, relative to the credit given for reducing the likelihood of spurious operation when a cable is routed in conduit.
8-1
8. REFERENCES NRC NUREG/CR-6931, Vol. 1, “Cable Response to Live Fire (CAROLFIRE) Volume 1: Test Descriptions and Analysis of Circuit Response Data,” April 2008. NRC NUREG/CR-6931, Vol. 2, “Cable Response to Live Fire (CAROLFIRE) Volume 2: Cable Fire Response Data for Fire Model Improvement,” April 2008. NRC NUREG/CR-6931, Vol. 3, “Cable Response to Live Fire (CAROLFIRE) Volume 3: Thermally-Induced Electrical Failure (THIEF) Model,” April 2008. EPRI TR1003326, “Characterization of Fire-Induced Circuit Faults, Results of Cable Fire Testing,” December 2002. NRC NUREG/CR-7100, “Direct Current Electrical Shorting in Response to Exposure Fire (DESIREE-FIRE): Test Result” April 2012. Freund, J. and Perles, B., “A New Look at Quartiles of Ungrouped Data,” The American Statistician, Volume 41, Number 3, pgs 200-203, 1978. Anixter wire and cable handbook. NRC NUREG-1475, “Applying Statistics,” March 2011. NRC NUREG/CR-6834, “Circuit Analysis – Failure Mode and Likelihood Analysis,” September 2003 NRC NUREG/CR-6850, “EPRI/NRC-RES Fire PRA Methodology for Nuclear Power Facilities, Volume 2: Detailed Methodology” September 2005.

Appendix A: Penlight Ground Fault Equivalent Inter-Cable Failure Mode Evaluation


A-1
A. Penlight Ground Fault Equivalent Inter-Cable Failure Mode Evaluation
This section is going to review the inter-cable interactions for the direct current (DC) penlight tests. They will be discussed based on circuit (solenoid-operated valve (SOV), motor-operated valve (MOV), Large Coil, 1-inch valve, and switchgear (SWGR)). Since these tests were performed in Penlight, the only route for inter-cable interaction is through the ground via the cable tray. The tests displayed in this section are the tests that displayed inter-cable interactions.
A.1 Penlight MOV Tests A.1.1 Penlight MOV Test #8 The first MOV test to display inter-cable interactions was Penlight Test #8. The timeline for this experiment is shown below in Table A-1. Figure A-1 shows the outstanding current plot for this test, displaying inter-cable interactions between MOV-1 and MOV-2. Figure A-2 and Figure A-3 display the current plots for MOV-1 and MOV-2, respectively, during the same time period as the outstanding current displayed in Figure A-1. From this, it is apparent that the red lamp on MOV-2 is flickering between times 478-480 because of the inter-cable interaction with MOV-1 conductor P via the ground plane.
Table A-1: Penlight test #8 sequence of events
Time (s) Event/Observation
0 Penlight on
300 Cable Ignition
465-514 Chatter – MOV-2 – Open & Close Coils
467-513 False Indication – MOV-2 – Green & Red lamps flicker ON/OFF
478-480 MOV-2 Red lamp flicker due to inter-cable interactions with MOV-1 conductor P via ground.
498-502 Chatter – MOV-1 Open Coil
502 False Indication – MOV-1 – Green Flickers Off/On
505-538 False Indication – MOV-1 – Green lamp OFF
514 Fuse Clear – MOV-2
538-546 MOV-1 SO – Open Coil (8s duration) False Indication – MOV-2 – Green lamp ON & Red lamp OFF
546 Fuse Clear – MOV-1
780 Penlight off

A-2
Figure A-1: Outstanding current shorting in Penlight MOV test #8
Figure A-2: Penlight MOV-1 test #8 current plot
Time (s)
476 478 480 482 484
Cur
rent
(A
)
-0.3
-0.2
-0.1
0.0
0.1
0.2
8-MOV1 8-MOV2
Time (s)
476 478 480 482 484
Cur
rent
(A
)
-0.2
-0.1
0.0
0.1
0.2
0.3
MOV1-PMOV1-NMOV1-G MOV1-R MOV1-YO MOV1-YC

A-3
Figure A-3: Penlight MOV-2 test #8 current plot A.1.2 Penlight MOV Test #12 The timeline for Penlight MOV Test #12 is shown below in Table A-2. Highlighted in red type are the inter-cable interactions between MOV-1 conductor N and MOV-2 conductor P via the ground plane. These low-current interactions did not cause any failure mode effects. This is represented graphically in Figure A-4, which shows the outstanding current shorting for this test. Figure A-5 and Figure A-6 display the conductors’ current for MOV-1 and MOV-2, respectively.
Table A-2: Penlight test #12 sequence of events
Time (s) Event/Observation
0 Penlight on
863-1066 MOV-1 SO – Open Coil (203s duration)
863-966 False Indication (Red off - No Voltage Pickup on R)
945-1062 HS MOV-1 – Close Coil
990-1066 Grounding of Positive battery lead
1066 Fuse Clear MOV-1 – Positive
1066 Grounding of Negative battery lead
1066 Current increase to 0.08A on Negative of MOV-2
1323-2321 Inter-cable interactions off and on between MOV-1 conductor N and MOV-2 conductor P via ground
1335 Penlight off
1350 Fuse Clear – MOV-2 – Negative
1635 Penlight turned back on
2350 Fuse Clear – MOV-1 – Negative
2400 Penlight off
Time (s)
476 478 480 482 484
Cur
rent
(A
)
-0.2
0.0
0.2
0.4
0.6
0.8
1.0
MOV2-P MOV2-N MOV2-G MOV2-R MOV2-YO MOV2-YC

A-4
Figure A-4: Outstanding current shorting in Penlight MOV test #12
Figure A-5: Penlight MOV-1 test #12 current plot
Time (s)
1200 1400 1600 1800 2000 2200 2400
Cur
rent
(A
)
-0.3
-0.2
-0.1
0.0
0.1
0.2
0.3
0.4
MOV1 MOV2
Time (s)
1200 1400 1600 1800 2000 2200 2400
Cur
rent
(A
)
-0.02
0.00
0.02
0.04
0.06
0.08
0.10
0.12
0.14
0.16
MOV1-PMOV1-NMOV1-G MOV1-R MOV1-YO MOV1-YC

A-5
Figure A-6: Penlight MOV-2 test #12 current plot A.1.3 Penlight MOV Test #22 The sequence of events for Penlight MOV Test #22 is presented below in Table A-3. As shown, there are four spurious operations caused by inter-cable interactions. These are highlighted in red in Table A-3. Figure A-7 displays the outstanding current shorting for this test relative to the time frame of those four spurious operations. The specific conductors causing the inter-cable interactions were identified from the conductors’ current plots for MOV-1 and MOV-2 (Figure A-8 and Figure A-9, respectively),.
Table A-3: Penlight test #22 sequence of events
Time (s) Event/Observation
0 Penlight on
174 Smoke observed
285-572 Cable ignition of the outer jacket material
585-592 Intermittent grounding of battery positive and negative
585-587 SA MOV-1 – Open Coil (2s duration) due to inter-cable interactions between MOV-1 conductor YO and MOV-2 conductor G via ground
586-595 Chatter – MOV-1 & MOV-2 – Open & Close coils
589-591 SA MOV-1 – Open Coil (2s duration) due to inter-cable interactions between MOV-1 conductor YO and MOV-2 conductor G via ground
595-631 Grounding of positive lead
593-633
SA MOV-1 – Open Coil (40s duration) due to inter-cable interactions between MOV-1 conductor YO and MOV-2 conductor G via ground Battery Positive shorts to ground
595-633
SA MOV-2 – Open Coil (38s duration) due to inter-cable interactions between MOV-2 conductor YO and MOV-1 conductor G via ground False Indication – MOV-2 – Green lamp ON
Time (s)
1200 1400 1600 1800 2000 2200 2400
Cur
rent
(A
)
-0.02
0.00
0.02
0.04
0.06
0.08
0.10
0.12
0.14
0.16
MOV2-P MOV2-N MOV2-G MOV2-R MOV2-YO MOV2-YC
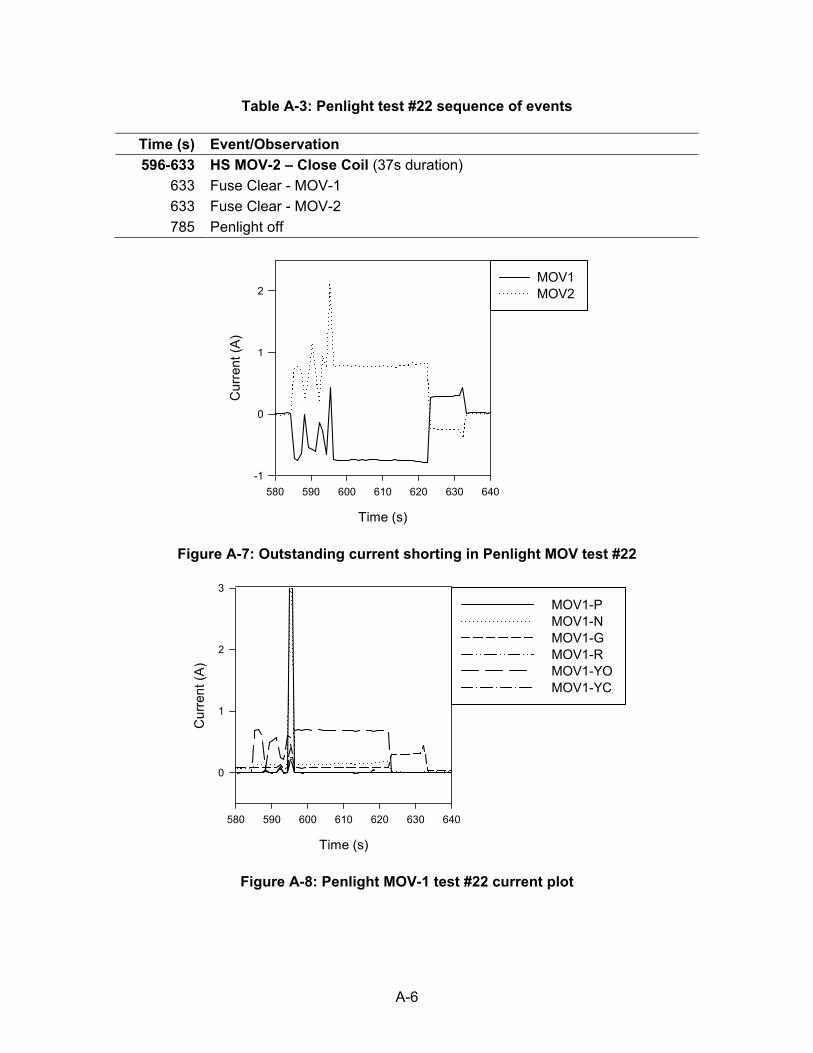
A-6
Table A-3: Penlight test #22 sequence of events
Time (s) Event/Observation
596-633 HS MOV-2 – Close Coil (37s duration)
633 Fuse Clear - MOV-1
633 Fuse Clear - MOV-2
785 Penlight off
Figure A-7: Outstanding current shorting in Penlight MOV test #22
Figure A-8: Penlight MOV-1 test #22 current plot
Time (s)
580 590 600 610 620 630 640
Cur
rent
(A
)
-1
0
1
2MOV1 MOV2
Time (s)
580 590 600 610 620 630 640
Cur
rent
(A
)
0
1
2
3
MOV1-PMOV1-NMOV1-G MOV1-R MOV1-YO MOV1-YC

A-7
Figure A-9: Penlight MOV-2 Test #22 current plot A.1.4 Penlight MOV Test #33 For Penlight MOV Test #33, the sequence of events is displayed in Table A-4. As shown, there is one inter-cable interaction between MOV-1 and MOV-2 that does not cause any cable failure modes to occur. This is shown to display a sharp single spike in the outstanding current calculation (Figure A-10). From this current spike and looking at Figure A-11 and Figure A-12 (MOV-1’s and MOV-2’s conductors’ current plots, respectively), the inter-cable interaction was identified as occurring between MOV-1 conductor P with MOV-2 conductors N and YC via the ground plane.
Table A-4: Penlight test #33 sequence of events
Time (s) Event/Observation
0 Penlight on
538-626 Battery Negative Shorts to Ground
575 Fuse Clear – MOV-2
611-626 HS MOV-1 – Close coil – no corresponding current
620-621 Inter-cable interactions with MOV-1 conductor P with MOV-2 conductor N, and YC via ground
627 Fuse Clear – MOV-1
705 Penlight off
Time (s)
580 590 600 610 620 630 640
Cur
rent
(A
)
0
1
2
3
MOV2-P MOV2-N MOV2-G MOV2-R MOV2-YO MOV2-YC
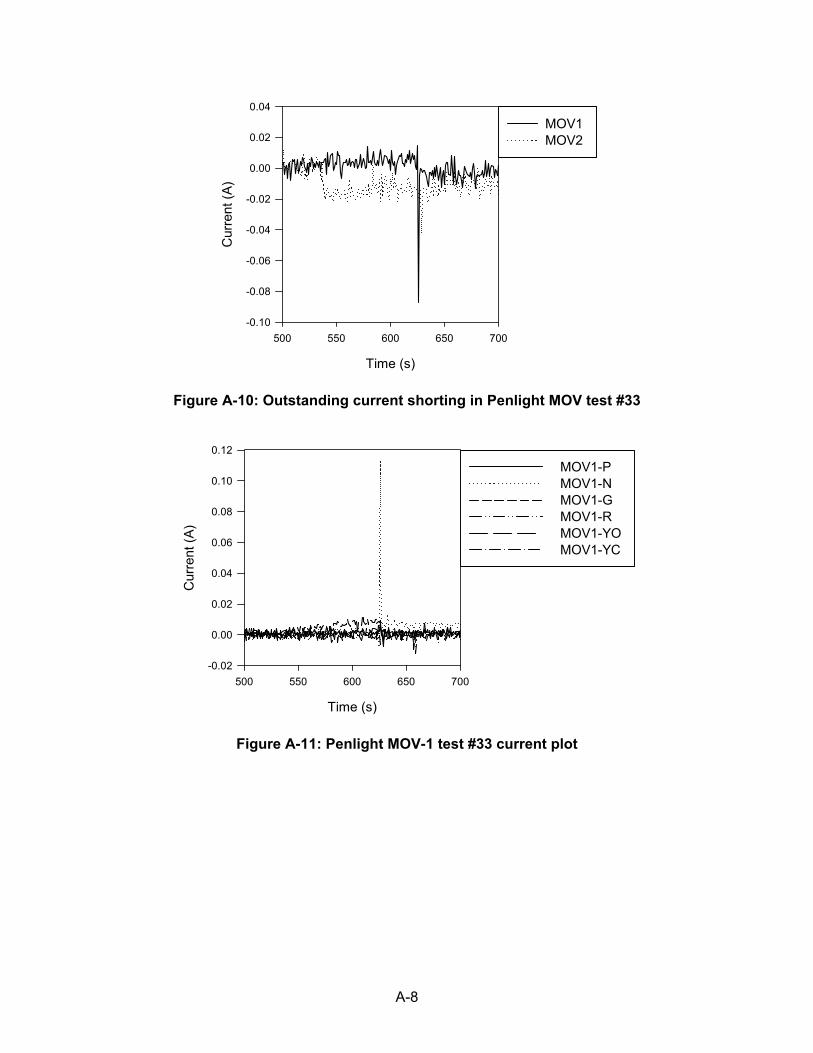
A-8
Figure A-10: Outstanding current shorting in Penlight MOV test #33
Figure A-11: Penlight MOV-1 test #33 current plot
Time (s)
500 550 600 650 700
Cur
rent
(A
)
-0.10
-0.08
-0.06
-0.04
-0.02
0.00
0.02
0.04
MOV1 MOV2
Time (s)
500 550 600 650 700
Cur
rent
(A
)
-0.02
0.00
0.02
0.04
0.06
0.08
0.10
0.12
MOV1-PMOV1-NMOV1-G MOV1-R MOV1-YO MOV1-YC

A-9
Figure A-12: Penlight MOV-2 test #33 current plot A.1.5 Penlight MOV Test #37 For Penlight MOV Test #37, there was one spurious operation caused by inter-cable interactions. This is highlighted below in Table A-5 in the sequence of events for this test. Figure A-13 displays the outstanding current calculation for MOV-1 and MOV-2. From this plot, it is noted that there are inter-cable interactions during the time of the spurious operation on MOV-1 close coil. From Figure A-14 and Figure A-15 (MOV-1 and MOV-2 conductor current plots respectively), the inter-cable interaction is between MOV-1 conductor G and MOV-2 conductor YC via the ground plane.
Table A-5: Penlight test #37 sequence of events
Time (s) Event/Observation
0 Penlight on
1681-1711 SA MOV-1 – Close Coil (30s duration)
1692-1712 False Indication – MOV-1 – Red ON (note: auxiliary contact failure)
1712 Fuse Clear – MOV-1
1723-1739 SA MOV-2 – Close Coil (16s duration) Inter-cable interactions between MOV-1 conductor G and MOV-2 conductor YC via ground
1731-1739 False Indication – MOV-2 – Red ON (note: auxiliary contact failure)
1740 Fuse Clear - MOV-2
1830 Penlight off
Time (s)
500 550 600 650 700
Cur
rent
(A
)
-0.04
-0.02
0.00
0.02
0.04
0.06
0.08
0.10
0.12
MOV2-P MOV2-N MOV2-G MOV2-R MOV2-YO MOV2-YC

A-10
Figure A-13. Outstanding current shorting in Penlight MOV Test #37
Figure A-14. Penlight MOV-1 Test #37 current plot
Time (s)
1600 1650 1700 1750 1800 1850
Cur
rent
(A
)
-0.2
0.0
0.2
0.4
0.6
0.8
1.0
MOV1 MOV2
Time (s)
1600 1650 1700 1750 1800 1850
Cur
rent
(A
)
-0.2
0.0
0.2
0.4
0.6
0.8
1.0
MOV1-PMOV1-NMOV1-G MOV1-R MOV1-YO MOV1-YC

A-11
Figure A-15. Penlight MOV-2 Test #37 current plot A.1.6 Penlight MOV Test #41 The sequence of events for Penlight MOV Test #41 is presented below in Table A-6. As shown, there are two spurious operations caused by inter-cable interactions and one inter-cable interaction that does not cause an immediate failure mode effect. These are highlighted in red in Table A-6. Figure A-16 displays the outstanding current shorting for this test relative to the time frame of those four spurious operations. The specific conductors causing the inter-cable interactions were identified from the conductors’ current plots for MOV-1 and MOV-2 (Figure A-17 and Figure A-18, respectively).
Table A-6. Penlight Test #41 sequence of events.
Time (s) Event/Observation
0 Penlight on
317 Smoke observed
1307-1405 SA MOV-2 – Close Coil (98s duration)
2462-2894 HS MOV-2 – Open Coil
2560-2649 Battery Negative shorts to ground
2562 – 2895 Cable thermocouple within conduit displaying off-normal readings
2626-2648 SA MOV-2 – Close Coil (22s duration)
2692-2755 Battery Positive shorts to ground
2699-2759 SA MOV-1 – Open Coil (60s duration)
2753-2759 SA MOV-2 – Close Coil (6s duration) due to inter-cable interactions with MOV-1 conductor G via ground.
2755-2790 Battery Negative shorts to ground
2776-2777 SA MOV-1 – Open Coil (1s duration) weak signs of inter-cable interactions with MOV-2 conductor G via ground.
Time (s)
1600 1650 1700 1750 1800 1850
Cur
rent
(A
)
-0.2
0.0
0.2
0.4
0.6
0.8
1.0
MOV2-P MOV2-N MOV2-G MOV2-R MOV2-YO MOV2-YC

A-12
Table A-6. Penlight Test #41 sequence of events.
Time (s) Event/Observation
2776-2838 HS MOV-1 – Open & Close coils – 118 & 112 Vdc, respectively
2790-2791 SA MOV-1 – Open Coil (1s duration)
2790-2840 Battery Positive shorts to ground
2825-2834 Inter-cable interactions with MOV-1 conductor P and MOV-2 conductor N via ground.
2837-2838 SA MOV-1 – Open Coil (1s duration)
2839 Fuse Clear – MOV-1
2872-2874 SA MOV-2 – Close Coil (2s duration)
2894 Fuse Clear – MOV-2
3255 Penlight off
Figure A-16. Outstanding current shorting in Penlight MOV Test #41
Time (s)
2700 2720 2740 2760 2780 2800 2820 2840
Cur
rent
(A
)
-1.0
-0.5
0.0
0.5
1.0
MOV1 MOV2

A-13
Figure A-17. Penlight MOV-1 Test #41 current plot
Figure A-18. Penlight MOV-2 Test #41 current plot
Time (s)
2700 2720 2740 2760 2780 2800 2820 2840
Cur
rent
(A
)
-2
-1
0
1
2
3
4
MOV1-PMOV1-NMOV1-G MOV1-R MOV1-YO MOV1-YC
Time (s)
2700 2720 2740 2760 2780 2800 2820 2840
Cur
rent
(A
)
-0.4
-0.2
0.0
0.2
0.4
0.6
0.8
1.0
MOV2-P MOV2-N MOV2-G MOV2-R MOV2-YO MOV2-YC

A-14
A.1.7 Penlight MOV Test #49 The sequence of events for Penlight MOV Test #49 is presented below in Table A-7. As shown, there is one spurious operation and one fuse clear caused by inter-cable interactions. These are highlighted in red in Table A-7. Figure 19 displays the outstanding current shorting for this test relative to the time frame of those four spurious operations. The specific conductors causing the inter-cable interactions were identified from the conductors’ current plots for MOV-1 and MOV-2 (Figure 20 and Figure 21, respectively).
Table A-7. Penlight Test #49 sequence of events.
Time (s) Event/Observation
0 Penlight on
755 Liquid exiting TC cable
2400 Penlight increased to 440 °C
4394-4401 SA MOV-1 – Close Coil (7s duration)
4402 MOV-1 Fuse Clear
4402-4824 Battery Negative shorts to ground
4620 Penlight off
~4820 Interactions between MOV-1 and MOV-2 circuits
4823
SA MOV-2 – Open Coil (<1s duration) with intra-cable interactions with conductors P and N also with inter-cable interaction with MOV-1 conductor N via ground.
4824 MOV-2 Fuse Clear caused by inter-cable interactions between MOV-1 conductor N and MOV-2 conductors R and N.
Figure A-19. Outstanding current shorting in Penlight MOV Test #49
Time (s)
4800 4810 4820 4830 4840
Cur
rent
(A
)
-2
-1
0
1
2
MOV1 MOV2

A-15
Figure A-20. Penlight MOV-1 Test #49 current plot
Figure A-21. Penlight MOV-2 Test #49 current plot
Time (s)
4800 4810 4820 4830 4840
Cur
rent
(A
)
-0.5
0.0
0.5
1.0
1.5
2.0
MOV1-PMOV1-NMOV1-G MOV1-R MOV1-YO MOV1-YC
Time (s)
4800 4810 4820 4830 4840
Cur
rent
(A
)
0
1
2
3MOV2-P MOV2-N MOV2-G MOV2-R MOV2-YO MOV2-YC

A-16
A.1.8 Penlight MOV Test #50 The sequence of events for Penlight MOV Test #50 is presented below in Table A-8. As shown, there is one hot short and one fuse clear caused by inter-cable interactions. These are highlighted in red in Table A-8. Figure A-22 displays the outstanding current shorting for this test relative to the time frame of those four spurious operations. The specific conductors causing the inter-cable interactions were identified from the conductors’ current plots for MOV-1 and MOV-2 (Figure A-23 and Figure A-24, respectively).
Table A-8. Penlight Test #50 sequence of events.
Time (s) Event/Observation
0 Penlight on
420 Liquid exiting end of TC cable
822 Cable Ignition
1164-1181 False Indication MOV-2 – Red lamp ON
1242-1334 Battery Positive shorts to ground
1242-1264
SA MOV-2 – Close Coil (22s duration) caused by inter-cable interactions between MOV-2 conductor YC and MOV-1 conductor G via ground.
1267 Fuse Clear – MOV-2 caused by inter-cable interactions between MOV-2 conductor YC and N with MOV-1 conductor N via ground.
1279-1300 False Indication – MOV-1 – Red lamp ON
1334 Fuse Clear – MOV-1
1440 Penlight off
Figure A-22. Outstanding current shorting in Penlight MOV Test #50
Time (s)
1200 1220 1240 1260 1280 1300 1320 1340
Cur
rent
(A
)
-6
-4
-2
0
2
4
MOV1 MOV2

A-17
Figure A-23. Penlight MOV-1 Test #50 current plot
Figure A-24. Penlight MOV-2 Test #50 current plot A.1.9 Penlight MOV Test #JPN-3 For Penlight MOV Test #JPN-3, the sequence of events is displayed in Table A-9. As shown, there is one inter-cable interaction between MOV-1 and MOV-2 that caused the red light to turn on. The outstanding current shorting is displayed in Figure A-25 for MOV-1 and MOV-2. From this current spike and from looking at Figure A-26 and Figure A-27 (MOV-1 and MOV-2 conductor current plots, respectively), the inter-cable interaction was identified as occurring between MOV-1 conductor R with MOV-2 conductors N and P via the ground plane.
Time (s)
1200 1220 1240 1260 1280 1300 1320 1340
Cur
rent
(A
)
0
1
2
3
MOV1-PMOV1-NMOV1-G MOV1-R MOV1-YO MOV1-YC
Time (s)
1200 1220 1240 1260 1280 1300 1320 1340
Cur
rent
(A
)
0
1
2
3
4
MOV2-P MOV2-N MOV2-G MOV2-R MOV2-YO MOV2-YC

A-18
Table A-9. Penlight Test #JPN-3 sequence of events.
Time (s) Event/Observation
0 Penlight on
1974-2501 Battery Positive shorts to ground
2308-2502 SA MOV-2 – Open Coil (194s duration) HS MOV-2 – Close Coil
2318-2501 False Indication – MOV-2 – Green lamp ON
2320-2502 False Indication – MOV-1 – Red lamp ON due to inter-cable interactions with MOV-2 conductor N and P via ground.
2463 Cable Ignition
2502 Fuse Clear – MOV-2
2626-2759 False Indication – MOV-1 – Red lamp OFF & Green lamp ON
2626-2866 SA MOV-1 – Open Coil (240s duration)
2761-2866 Battery Negative shorts to ground False Indication – MOV-1 Red lamp OFF & Green lamp ON
2866 Fuse Clear – MOV-1
2930 Penlight off
Figure A-25. Outstanding current shorting in Penlight MOV Test #JPN-3
Time (s)
2200 2300 2400 2500 2600
Cur
rent
(A
)
-0.2
-0.1
0.0
0.1MOV1 MOV2

A-19
Figure A-26. Penlight MOV-1 Test # JPN-3 current plot
Figure A-27. Penlight MOV-2 Test # JPN-3 current plot
Time (s)
2000 2200 2400 2600 2800 3000
Cur
rent
(A
)
0.0
0.2
0.4
0.6
0.8
MOV1-PMOV1-NMOV1-G MOV1-R MOV1-YO MOV1-YC
Time (s)
2000 2200 2400 2600 2800 3000
Cur
rent
(A
)
0.0
0.1
0.2
0.3MOV2-P MOV2-N MOV2-G MOV2-R MOV2-YO MOV2-YC

A-20
A.2 Penlight SOV Tests This section will discuss the inter-cable interaction results for the Penlight SOV tests. The tests that showed inter-cable interactions will be discussed. There were some issues with some of the current transducers drifting during these tests, so the tests that clearly showed signs of inter-cable interactions are the ones described below. A.2.1 Penlight SOV Test #20 For Penlight SOV Test #20, the sequence of events is displayed in Table A-10. The spurious operation caused by the inter-cable interaction is highlighted in red. The outstanding current plot, the SOV-1 conductors’ current plot, and the SOV-2 conductors’ current plot are shown in Figure A-28, Figure A-29, and Figure A-30, respectively. From these three plots, the inter-cable interaction was determined to occur between SOV-2 conductor S2 and SOV-1 conductor G via the ground plane.
Table A-10. Penlight Test #20 sequence of events.
Time (s) Event/Observation
0 Penlight on
250 Cable Ignition
483-526 Battery Positive Shorts to Ground
484-526 SOV-1 False Indication Red lamp ON
502-526 SOV-1 SO (~0.078 A) [24s duration]
508-528 SOV-2 SO (~0.059 A) [20s duration] due to inter-cable interactions with SOV-1 conductor G via ground.
524-528 SOV-2 False Indication Red lamp ON
526 SOV-1 Fuse Clear
529-556 Battery Positive Shorts to Ground
530-556 SOV-2 SO (~0.082 A) [26s duration] and SOV-2 False Indication Red Lamp ON
556 SOV-2 Fuse Clear
646 Penlight off

A-21
Figure A-28. Outstanding current shorting in Penlight SOV Test #20
Figure A-29. Penlight SOV-1 Test #20 current plot
Time (s)
500 510 520 530 540 550
Cur
rent
(A
)
-0.2
-0.1
0.0
0.1
0.2
SOV1 SOV2
Time (s)
500 510 520 530 540 550
Cur
rent
(A
)
-0.2
0.0
0.2
0.4
0.6
0.8
1.0
SOV1-PSOV1-S1SOV1-GSOV1-S2SOV1-N

A-22
Figure A-30. Penlight SOV-2 Test #20 current plot A.2.2 Penlight SOV Test #28 For Penlight SOV Test #28, the sequence of events is displayed in Table A-11. The spurious operation caused by the inter-cable interaction is highlighted in red. The outstanding current plot, SOV-1 conductors’ current plot, and SOV-2 conductors’ current plot are shown in Figure A-31, Figure A-32, and Figure A-33, respectively. From these three plots, the inter-cable interaction was determined to occur between SOV-2 conductor S2 and SOV-1 conductor P via the ground plane.
Table A-11. Penlight Test #28 sequence of events.
Time (s) Event/Observation
0 Penlight on
2400 Penlight Increased to 350 °C
2958-3384 SOV-1 False Indication Red lamp ON
3360 Penlight Increased to 375 °C
3384 SOV-1 Fuse Clear
3393-3690 SOV-2 SO (~0.071 A) [297s duration] due to inter-cable interactions between MOV-2 conductor P
3597-3690 SOV-2 False Indication Red lamp ON
3690 SOV-2 Fuse Clear
3820 Penlight off
Time (s)
500 510 520 530 540 550
Cur
rent
(A
)
-0.2
0.0
0.2
0.4SOV2-P SOV2-S1SOV2-G SOV2-S2 SOV2-N

A-23
Figure A-31. Outstanding current shorting in Penlight SOV Test #28
Figure A-32. Penlight SOV-1 Test #28 current plot
Time (s)
3300 3400 3500 3600 3700 3800 3900
Cur
rent
(A
)
-0.08
-0.06
-0.04
-0.02
0.00
SOV1 SOV2
Time (s)
3300 3400 3500 3600 3700 3800 3900
Cur
rent
(A
)
-0.10
-0.05
0.00
0.05
0.10
0.15
SOV1-PSOV1-S1SOV1-GSOV1-S2SOV1-N

A-24
Figure A-33. Penlight SOV-2 Test #28 current plot A.2.3 Penlight SOV Test #31 For Penlight SOV Test #31, the sequence of events is displayed in Table A-12. The hot short caused by the inter-cable interaction is highlighted in red. The outstanding current plot, SOV-1 conductors’ current plot, and SOV-2 conductors’ current plot are shown in Figure A-34, Figure A-35, and Figure A-36, respectively. From these three plots, the inter-cable interaction was determined to occur between SOV-2 conductor R and SOV-1 conductor N via the ground plane.
Table A-12. Penlight Test #31 sequence of events.
Time (s) Event/Observation
0 Penlight on
414 Battery Positive Shorts to Ground
414-431 SOV-2 False Indication Green Lamp ON caused by inter-cable interactions with SOV-1 conductor N.
432 SOV-2 Fuse Clear
455-420 Battery Positive Shorts to Ground and SOV-1 False Indication Red lamp ON
517-520 SOV-1 SO (~0.084 A) [3s duration]
520 SOV-1 Fuse Clear
579 Penlight off
Time (s)
3300 3400 3500 3600 3700 3800 3900
Cur
rent
(A
)
-0.10
-0.05
0.00
0.05
0.10
0.15
SOV2-P SOV2-S1SOV2-G SOV2-S2 SOV2-N

A-25
Figure A-34. Outstanding current shorting in Penlight SOV Test #31
Figure A-35. Penlight SOV-1 Test #31 current plot
Time (s)
400 420 440 460 480 500
Cur
rent
(A
)
-0.08
-0.06
-0.04
-0.02
0.00
0.02
0.04
0.06
0.08
0.10
SOV1 SOV2
Time (s)
400 420 440 460 480 500
Cur
rent
(A
)
0.00
0.05
0.10
0.15 SOV1-PSOV1-S1SOV1-GSOV1-S2SOV1-N

A-26
Figure A-36 Penlight SOV-2 Test #31 current plot
A.3 Penlight large coil and 1-inch valve tests A.3.1 Penlight large coil and 1-inch valve Test #11 For the Penlight large coil and the 1-inch valve circuit in Test #11, the sequence of events is displayed in Table A-13. There were two spurious operations caused by inter-cable interactions, which are highlighted in red. The outstanding current plot, 1-inch valve conductors’ current plot, and large coil conductors’ current plot are shown in Figure A-37, Figure A-38, and Figure A-39, respectively. From these three plots, the first inter-cable interaction was determined to occur between large coil conductor S and 1-inch valve conductors G and R via the ground plane. The second inter-cable interaction was determined to occur between 1-inch valve conductor S and large coil conductor P via the ground plane.
Table A-13. Penlight Test #11 sequence of events.
Time (s) Event/Observation
0 Penlight on
1087-1141 Battery Positive shorts to ground
1089-1104 False Indication – 1-inch valve – Red lamp ON
1089-1141 SA – Large Coil (52s duration) – caused by inter-cable interaction with 1-inch valve conductor G and R via ground.
1109 SA – 1-inch valve (<1s duration) False Indication – 1-inch valve – Green lamp ON
1110-1130 False Indication – 1-inch valve – Red lamp ON
1130-1141 SA – 1-inch valve (11s duration) False Indication – 1-inch valve – Green lamp ON
1142-1455 Battery Negative shorts to ground
1142-1455 False Indication – 1-inch valve –Green lamp OFF
Time (s)
400 420 440 460 480 500
Cur
rent
(A
)
0.0
0.1
0.2
0.3
SOV2-P SOV2-S1SOV2-G SOV2-S2 SOV2-N

A-27
Table A-13. Penlight Test #11 sequence of events.
Time (s) Event/Observation
1456-1464 False Indication – 1-inch valve – Red lamp ON
1456-2457 SA – Large Coil (1001s duration)
1464-1835 False Indication – 1-inch valve – Green lamp ON
1464-2457 Battery Positive shorts to ground
1464-2262 SA – 1-inch valve (798s duration) due to inter-cable interaction between Large Coil conductor P via ground.
1534-2457 False Indication – 1-inch valve – Red lamp ON
1930-2262 False Indication – 1-inch valve – Green lamp ON
2262 Fuse Clear – 1-inch valve (10A)
2457 Fuse Clear – Large Coil (25A)
2495 Cable Ignition
2795 Penlight off
Figure A-37. Outstanding current shorting in Penlight 1-inch valve and large coil Test #11
Time (s)
1000 1500 2000 2500 3000
Cur
rent
(A
)
-4
-2
0
2
4
1-inch ValveLarge Coil

A-28
Figure A-38. Penlight 1-inch valve Test #11 current plot
Figure A-39. Penlight large coil Test #11 current plot A.3.2 Penlight Large Coil and 1-inch valve Test #40 For the Penlight Large Coil and the 1-inch valve Test #40, the sequence of events is displayed in Table A-14. There were two spurious operations caused by inter-cable interactions, which are highlighted in red. The outstanding current plot, 1-inch valve conductors’ current plot, and Large Coil conductors’ current plot are shown in Figure A-40, Figure A-41, and Figure A-42, respectively. From these three plots, the first inter-cable interaction was determined to occur between Large Coil conductor S and 1-inch valve conductors G and R via the ground plane. The second inter-cable interaction was determined to occur between Large Coil conductor S and 1-inch valve conductors N2 and S via the ground plane.
Time (s)
1000 1500 2000 2500 3000
Cur
rent
(A
)
-1
0
1
2
3
4
5
1-inch Valve - P1-inch Valve - G1-inch Valve - R1-inch Valve - N21-inch Valve - S1-inch Valve - N1
Time (s)
1000 1500 2000 2500 3000
Cur
rent
(A
)
0
1
2
3
4 Large Coil - PLarge Coil - GLarge Coil - N2Large Coil - SLarge Coil - N1

A-29
Table A-14. Penlight Test #40 sequence of events.
Time (s) Event/Observation
0 Penlight on
3345 Penlight increased to 475 °C
3985 Penlight increased to 500 °C
4063-4166 Battery Positive shorts to ground
4068-4166 False Indication – Large Coil – Red lamp ON
4100-4164 SA – Large coil (64s duration) due to inter-cable interaction between 1”Valve conductors G and R via ground.
4167-4312 Battery Negative shorts to ground
4167 Fuse Clear – 1-inch valve (10A)
4280 Penlight off
4314-4329 SA – Large coil (15s duration) cause by inter-cable interactions with 1-inch valve conductors N2 and S via ground.
4317-4329 False Indication – Large Coil – Red lamp ON
4330-4330 Battery negative shorts to ground
4330 Fuse Clear – Large coil (25A)
Figure A-40. Outstanding current shorting in Penlight 1-inch valve and large Coil Test #40
Time (s)
4000 4100 4200 4300 4400
Cur
rent
(A
)
-4
-2
0
2
4
1-inch ValveLarge Coil

A-30
Figure A-41. Penlight 1-inch valve Test #40 current plot
Figure A-42. Penlight large coil Test #40 current plot
Time (s)
4000 4100 4200 4300 4400
Cur
rent
(A
)
0
1
2
3
4
1-inch Valve - P1-inch Valve - G1-inch Valve - R1-inch Valve - N21-inch Valve - S1-inch Valve - N1
Time (s)
4000 4100 4200 4300 4400
Cur
rent
(A
)
0
1
2
3
4
Large Coil - PLarge Coil - GLarge Coil - N2Large Coil - SLarge Coil - N1

A-31
A.4 Penlight SWGR Tests The last set of penlight tests to be discussed is the SWGR tests for both the trip and close circuits. This section will discuss the SWGR tests where inter-cable interactions were identified. A.4.1 Penlight SWGR Test #4 For Penlight SWGR Test #4, the sequence of events is displayed in Table A-15. There was one spurious operation caused by inter-cable interactions, which is highlighted in red. The outstanding current plot, Close Circuit conductors’ current plot, and Trip Circuit conductors’ current plot are shown in Figure A-43, Figure A-44, and Figure A-45, respectively. From these three plots, the inter-cable interaction was determined to occur between Trip Circuit conductor PT and the Close Circuit conductor N1 via the ground plane.
Table A-15. Penlight Test #4 sequence of events.
Time (s) Event/Observation
0 Penlight on
299 Cable Ignition
550-597 False Indication Red lamp ON
568-640 Cable thermocouples providing abnormal results, perhaps due to the arcing behavior
577-581 False Indication Green lamp OFF
589-625 HS Trip Coil (Breaker remains Open)
598-625 False Indication Green lamp OFF
623-638 Positive Battery Lead Shorts to Ground
625 SA Close Coil (Breaker Closes)
625-626 HS Close Coil (Breaker remains Closed)
625-626 False Indication Red lamp OFF
626 SA Trip Coil (Breaker Opens)
626-632 False Indication Green lamp OFF
632 SA Close Coil (Breaker Closes)
632-634 HS Close Coil (Breaker remains Closed)
632-635 False Indication Red lamp OFF
635 SA Trip Coil (Breaker Opens) due to inter-cable interaction with SWGR Close Circuit conductor N1 via ground.
635-698 HS Trip Coil (Breaker remains Open)
635-700 False Indication Green lamp OFF
638 Fuse Clear Close Circuit (15A)
639-1638 Battery Negative shorts to ground
701-1440 False Indication Red lamp ON
719-728 HS Trip Coil (Breaker remains Open)
1441-1637 False Indication Green lamp OFF
1638 Penlight off

A-32
Figure A-43. Outstanding current shorting in Penlight SWGR Test #4
Figure A-44 Penlight SWGR Close Test #4 current plot
Time (s)
620 625 630 635 640 645 650
Cur
rent
(A
)
0
1
2
3
4
CloseTrip
Time (s)
620 625 630 635 640 645 650
Cur
rent
(A
)
0
1
2
3
4
Close - PCClose - N1

A-33
Figure A-45 Penlight SWGR Trip Test #4 current plot A.4.2 Penlight SWGR Test #JPN-2 For Penlight SWGR Test #JPN-2, the sequence of events is displayed in Table A-16. There was one false red lamp indication caused by inter-cable interactions, which is highlighted in red. The outstanding current plot, Close Circuit conductors’ current plot, and Trip Circuit conductors’ current plot are shown in Figure A-46, Figure A-47, and Figure A-48, respectively. From these three plots, the inter-cable interaction was determined to occur between Trip Circuit conductor R and the Close Circuit conductor N1 via the ground plane. This is a weak indication of an inter-cable interaction, and most of this current analysis may not have picked up all of these types of indications of inter-cable interactions.
Table A-16. Penlight Test #JPN-2 sequence of events.
Time (s) Event/Observation
0 Penlight on
978-1361 Voltage loss on Trip circuit “R” conductor (~100Vdc)
1322-1456 Battery Negative shorts to Ground
1362-1456
False Indication Red lamp ON This is an Inter-cable hot short between Trip cable “R” conductor and Close cable N1 conductor via ground
1457 Fuse Clear – Close Coil
1457-2071 Battery Positive shorts to Ground
2072-2120 False Indication Red lamp ON
2072-2111 Battery Negative shorts to Ground
2112-2430 Battery Positive shorts to Ground
2121-2430 False Indication Red lamp ON
2430 Penlight off
Time (s)
620 625 630 635 640 645 650
Cur
rent
(A
)
0
1
2
3
4
Trip - PTTrip - GTrip - RTrip - N2

A-34
Figure A-46. Outstanding current shorting in Penlight SWGR Test #JPN-2
Figure A-47. Penlight SWGR Close Test #JPN-2 current plot
Time (s)
1300 1350 1400 1450 1500
Cur
rent
(A
)
-0.10
-0.05
0.00
0.05
0.10
CloseTrip
Time (s)
1300 1350 1400 1450 1500
Cur
rent
(A
)
-0.02
0.00
0.02
0.04
0.06
0.08
0.10
0.12
0.14
Close - PCClose - N1
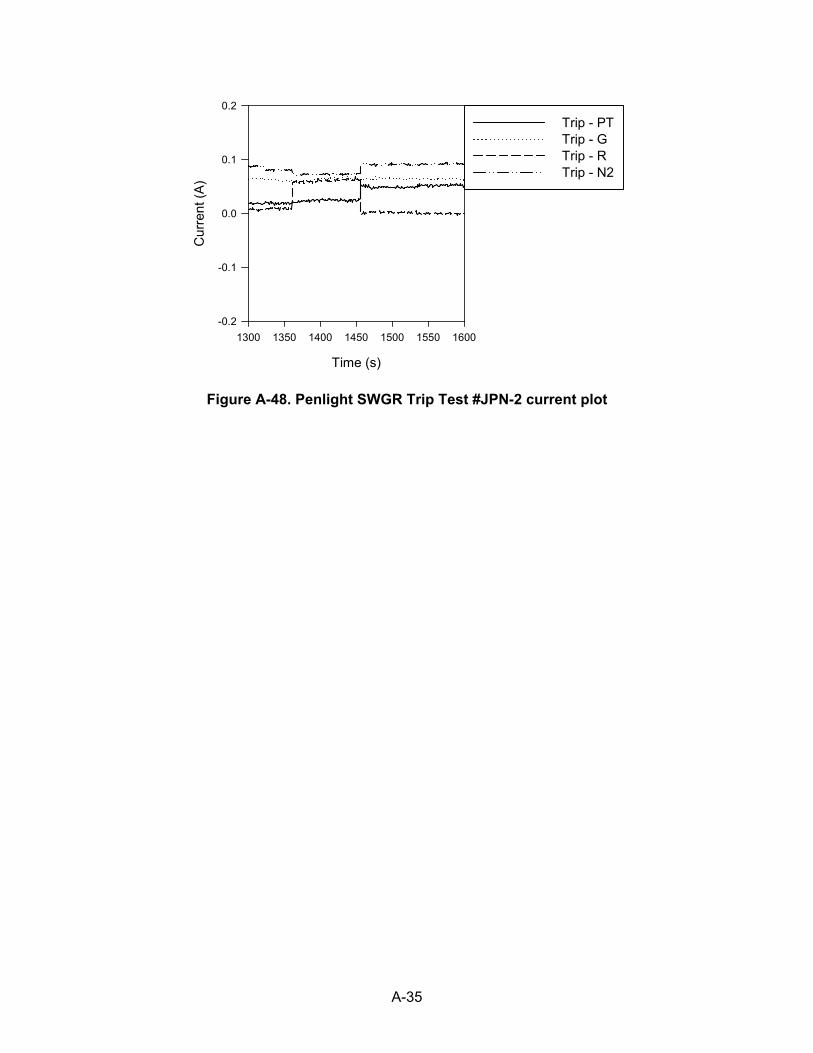
A-35
Figure A-48. Penlight SWGR Trip Test #JPN-2 current plot
Time (s)
1300 1350 1400 1450 1500 1550 1600
Cur
rent
(A
)
-0.2
-0.1
0.0
0.1
0.2
Trip - PTTrip - GTrip - RTrip - N2


Appendix B: Supplemental Information for the CAROLFIRE Reports, Including Additional Data Retrieval


B-1
B. Supplemental Information for the CAROLFIRE Reports, Including Additional Data Retrieval
B.1. Introduction This document is meant to help readers of the Cable Response to Live Fire (CAROLFIRE) reports7 to better understand the project, its diagnostic equipment, and certain of its data, including some that is not explicitly discussed in the reports. It is not intended to be a stand-alone document, and makes frequent reference to the CAROLFIRE reports and the extensive data files distributed with them. It is therefore essential that the referenced material be available to users of this document. This document provides a better explanation of certain aspects of the equipment and tests by collecting and organizing material that is scattered among different locations in Volumes 1 and 2, and it also presents additional details obtained from the Sandia National Laboratories (SNL) authors that are not in those volumes. CAROLFIRE utilized two different, complementary electrical performance monitoring systems, which together provided a comprehensive knowledge of fire damage to electric cables and its effects on electric circuits. The Insulation Resistance Measurement System (IRMS) provided a general overall knowledge of electric cable damage as the fire progressed by measuring the electrical insulation resistance (IR) between all pairs of conductors in the cable, and between each individual conductor and ground. IRMS measurements were totally independent of any circuit that might be connected to the cable in an actual nuclear power plant. The Surrogate Circuit Diagnostic System (SCDS) provided a detailed knowledge of the effects on one specific electric circuit of fire damage to an electric cable connected to that circuit. Both systems were necessary, because neither was capable of performing both functions by itself. B.2. The Insulation Resistance Measurement System (IRMS) B.2.1 Operating Principles The IRMS is described in detail in Appendix B of Volume 1. It determines the IR between a pair of conductors, each of which can be a single conductor or an electrically connected group of conductors, and between each of those conductors and the ground. It operates by energizing one conductor (the “source” conductor) with a known voltage source and then measuring the voltage across a known resistance connected in series with the source conductor, and also measuring the voltage across a separate known resistance connected in series with another conductor (the “target” conductor). It then switches the known voltage source to the opposite conductor (i.e., the former “target” becomes the “source,” and the former “source” becomes the “target”) and repeats the voltage measurements. The resulting two pairs of measurements, along with the known source voltage and the two known resistances, are mathematically sufficient to enable calculation of the above-specified IR values. The two pairs of measurements are made as described above (i.e., in immediate sequence—within two seconds8) to minimize errors resulting from the implicit mathematical assumption that all four voltages exist at the exact same moment.
7 “Cable Response to Live Fire (CAROLFIRE) Volume 1: Test Descriptions and Analysis of Circuit Response Data,” NUREG/CR-6931, Volume 1, April, 2008; and “Cable Response to Live Fire (CAROLFIRE) Volume 2: Cable Fire Response Data for Fire Model Development,” NUREG/CR-6931, Volume 2, April, 2008. 8 In earlier IRMS applications, (e.g., NUREG/CR-6776, “Cable Insulation Resistance Measurements Made During Cable Fire Tests,” June, 2002), IR measurements were made by connecting the source voltage to one conductor, sequentially measuring all other (i.e.,

B-2
B.2.2 Uncertainties Due to IRMS Cycle Time SNL developed and patented two IRMSs for CAROLFIRE—each can be connected to as many as 14 conductors, and has sufficient switching and data recording equipment to determine the IR values between all pairs of those conductors and between each of those conductors and the ground. Depending on the number of conductors being monitored, however, one cycle (i.e., one measurement of the IR values for all pairs) can take from seconds (e.g., ~42 sec) to a few minutes (e.g., ~3 min). Thus, in practice, it is desirable to limit the number of monitored conductors, because long cycle times limit the data’s time resolution. That is, any event that occurs just after measurement of an IR value that would have been affected by the event would not be measured and recorded until that IR is again measured during the next cycle. If any additional events occurred before that next IR measurement, only the composite result of all such events would be measured and recorded (i.e., they would not be resolved in time and recorded as separate events). An important example is if a hot short occurs between two conductors just after measurement of those conductors’ IR values, and then, just before the next measurement of their IR values, they short to ground. The occurrence of the hot short would be missed—all that would be measured and recorded is that the conductors were, at the time of the second IR measurement, shorted to each other and to ground. Another important example is if a hot short occurs between two conductors just before measurement of their IR values, and then, just after that same measurement, one of the conductors shorts to ground—this termination by grounding of the hot short would not be measured and recorded until the next cycle’s measurement, resulting in the recording of a much longer-lasting hot short than actually occurred. The inaccuracies in both of these examples occur because the time resolution of IRMS data is limited by its cycle time, which increases as the number of monitored conductors increases. This is one of the reasons that surrogate circuit diagnostic units (SCDUs, discussed later) were also used in CAROLFIRE—SCDUs have a vastly better time resolution (0.2 seconds cycle time), but they lack the IRMS’s ability to detect progressive cable deterioration well before ultimate cable failure. The IRMS and SCDU systems thus complement each other, and together provide the most complete knowledge of electric cable behavior in fires. B.2.3 Criteria for Spurious Operation (SA) The IRMS provided a stream of cable IR data indicating progressive degradation of the cables’ insulating ability. The numerical IR limit that should be considered sufficient to induce a spurious operation (SA) depends on the nature and sensitivity of the circuit. However, for CAROLFIRE, a specific criterion was applied to reflect a typical 120 VAC control circuit and to reflect the typical faulting behavior observed in previous testing. In particular, a control cable was considered to have caused an SO when it shorted to another conductor with an IR of less than or equal to 1000Ω. This IR limit was selected as a representative of expected failure onset conditions for control and instrument circuits because the typical behavior of such cables during fire exposure involves a fairly steady degradation of IR with rising temperature until the IR value degrades to some value considerably above 1000Ω, at which point the cable typically experiences rapid degradation to IR values typically under 100Ω. Thus, use of the 1000Ω
“target”) conductors, then switching the source voltage to the second conductor, etc. That method required more time to collect the two pairs of measurements needed, and resulted in increased uncertainties in IR during the transition phase.

B-3
failure criterion should acceptably represent this behavior9. The SO was considered to terminate when either conductor shorted to ground with an IR of less than or equal to 1000Ω. B.2.4 Presentation of IRMS Data The IRMS results are provided in the form of extensive shorting sequence tables. Chapter 6 of Volume 1 provides the Penlight Test (PT) IRMS tables, and Chapter 7.1 provides the Intermediate-Scale Test (IT) IRMS tables. The tables provide specific sequences of observed short circuits between pairs of conductors (or conductor groups) and between each conductor (or conductor group) and ground. The shorting sequence tables provide the most significant events (“highlights”) of each test, subject to the time resolution limits discussed previously. Full details are provided in the Excel data files on the CDs distributed with CAROLFIRE Volumes 1 and 2, and on the U.S. Nuclear Regulatory Commission (NRC) website. Those files include plots of the data, which can be enlarged on-screen. This method is recommended for viewing the data, because “hovering” over any plotted point will result in the appearance of its exact numerical coordinates, in addition to the plot showing how it fits into the overall test results. An example is provided in Figure 1, “IRMS Data Plot Example,” which represents one of the tests involving a single10 7-conductor cable. The relative location of the conductors in the cable is shown in Figure 2, “Seven-Conductor Cable,” which applies to all 7-conductor cables monitored during CAROLFIRE by either the IRMS or the SCDUs. B.2.5 IRMS Set-Up to Detect Inter-Cable Hot Shorts A primary interest of the CAROLFIRE project was the interactions between cables (inter-cable shorts), as opposed to interactions between conductors within a singe cable (intra-cable shorts, such as the above example, in which each of the seven conductors in a single 7-conductor cable was monitored by an IRMS channel). This indicated that many tests should involve a bundle or bundles of multi-conductor electric cables. It was not possible to connect each conductor within such bundles to an IRMS channel, because each IRMS unit can only accommodate a maximum of 14 channels (and because of the need to minimize cycle times, as previously discussed). Thus, the typical IRMS practice was to group conductors from each of several co-located (bundled) cables into two groups. For a 7-conductor cable (Figure 2), there was one central conductor surrounded by six cables forming an outer ring. The six outer conductors were collected into two groups of three conductors each, with each group comprising alternate conductors in the outer ring. In this way, the IRMS was able to determine when one conductor group shorted internally to the other conductor group in the same cable (intra-cable shorting), when each conductor group shorted to ground, and when either conductor group in one cable shorted to either conductor group in another cable (inter-cable shorting). The typical conductor grouping, using the Figure 2 conductor numbering scheme, is shown in Figure 3, “Grouping of Seven Conductors.” Note that for these bundled tests (in contrast to the single cable example given above), the central conductor (“1” in Figure 2) was not connected to the IRMS and was not grounded (i.e., was a “spare” conductor, and so was not connected to anything). In some
9 Instrument cables might begin to cause instrument errors at IR values above 1000Ω, but fire damage is expected to cause IR decreases to begin considerably above 1000Ω and then proceed rapidly, so the 1000Ω criterion should be reasonably acceptable. 10 This “single cable” designation can be misleading, because in all cases (except the “Spec 1” test described on pg. 77 of Volume 1) this actually means a single cable for electrical monitoring, plus a nearby (identical) single cable for thermal monitoring (i.e., two cables were actually used).

B-4
nuclear power plant (NPP) systems, spare conductors are grounded, so note that the CAROLFIRE IRMS data might be somewhat less representative of such cables11. Also note that for all tests involving the IRMS, the electrical raceway was grounded to a common ground, along with the IRMS power supply, and that none of the conductors or shields within the IRMS-monitored cables were grounded. Thus, conductor-to-ground IR values always indicated interactions between conductors and the raceway (i.e., cable tray or conduit). Given the above grouping of conductors, each cable was associated with two channels of the IRMS. In the data tables given in Chapters 6 and 7, this arrangement is designated by conductor labels that indicate the cable and IRMS channel. For example, Cable A was generally connected to IRMS channels 1 and 2, so the two Cable A conductor groups were referred to as “conductor A1” and “conductor A2.” Similarly, Cable B was generally connected to IRMS channels 3 and 4, so the two Cable B conductor groups were referred to as “conductor B3” and “conductor B4,” and so on for the rest of the monitored cables. Thus, if a data table entry says “conductors A1 and A2 shorted together” or “conductors B3 and B4 shorted together,” these entries indicate intra-cable, conductor group to conductor group shorts (i.e., between conductor groups within the same cable). If the entry says “conductors A1 and B1 shorted together,” however, this indicates an inter-cable short between conductor groups (i.e., between conductor groups in separate cables). Cable bundles with three, six, and twelve individual cables arranged as shown in Figure 4 were used in CAROLFIRE. B.2.6 Summary of IRMS Conductor-to-Conductor-Short Data As indicated above, the CAROLFIRE IRMS data are presented in Volume 1 in the form of extensive shorting sequence tables. These tables do not include summary tables like the ones provided for data from the CAROLFIRE surrogate circuit diagnostic units (SCDUs, discussed later in this document). Thus, for this document, the IRMS data were examined using the process described below, resulting in identification of 20 conductor-to-conductor-short data points in an IRMS summary table (attached). The IRMS data’s principal purpose was to indentify conductor-to-conductor-shorts that could likely cause spurious operations. Other conductor-to-conductor-shorts were of far less interest, and were not compatible with the SCDU data discussed later in this document. Therefore, the following process was applied to the IRMS shorting sequence tables: - Only data from primary events were selected—that is, if either conductor group involved had previously shorted to ground at less than or equal to 1000Ω, then the event was not listed in the summary table because existence of the ground would likely prevent the availability of sufficient power for a spurious operation. - The time when two conductor groups meeting the above condition shorted together at less than or equal to 1000Ω was taken as the short’s initiation time. If different times were given for the two conductor groups, the earlier of the two was used. - The time when either conductor group shorted to ground at less than or equal to 1000Ω was taken as the short’s termination time. If different times were given for the two conductor groups, the earlier of the two was used. However, the recorded time when conductor
11 Since thermal damage to cables begins on the outside and proceeds inward, effects of this difference should be minimized - most shorts to ground would likely occur to the outside raceway, not to any inside grounded conductor.

B-5
groups shorted to ground is subject to the uncertainties discussed in Section 2.7, which can be of considerable importance, especially for hot shorts with shorter durations. - The short’s duration time was defined as the difference between the above-described initiation and termination times. However, if the duration was less than one cycle, the short was not included in the summary table because of uncertainty resulting from the data’s time resolution (as discussed above). B.2.7 Termination Time Uncertainties in IRMS-detected Hot Shorts These uncertainties are explained using the data given on page 55 of Volume 1 as an example; the second and third lines of the table “Results for Test PT-34” are: 1304 seconds – Conductors A1 and A2 short together at 23Ω 130912-1332 seconds – Conductors A1 and A2 short to ground at 303 and 455Ω These two entries indicate that a hot short occurred sometime during the previous cycle (i.e., the 185 seconds prior to 1304 seconds), and that it still existed at the indicated time (1304 seconds). Furthermore, the entries indicate that the hot short continued to endure within the then-present cycle (i.e., after 1304 seconds) for between 5 and 28 additional seconds. According to previous explanations by the IRMS, however, the IR values between the conductors and between each of the conductors and the ground were all determined by the same voltage measurements, which were made within less than 2 seconds of the indicated time (1304 seconds). Thus, an uncertainty is indicated, because no relevant data would have been taken during those additional 5 to 28 seconds. However, looking in more detail at IRMS data recording processes reveals that relevant data was in fact taken during that time interval, as follows. In the Excel file for test PT-34, under the “Plot for Each Conductor” tab, the “Behavior of Cable A, Conductor 1” and the “Behavior of Cable A, Conductor 2” plots show the conductor-to-conductor IR for A1-A2 and for A2-A1 (both at exactly 1303.999999 seconds penlight time) to be exactly 22.75434601Ω. This matches the first line of the “Results” table copied above. The IR values to ground given on the two referenced plots near 1304 seconds also match the IR values given in the second line of the “Results” table copied above; A1’s IR is 302.67Ω (at 1309.7 seconds), and A2’s is 454.7Ω (at 1332.1 seconds). In the “key” block of the referenced plot for Cable A, Conductor 1, however, note that its IR to ground is referred to as “A1 – Grnd (min),” and that it appears below the column of entries A1 – A2, A1 – B3, A1 – B4, A1 – C5, and A1 – C6. Each of those five data pairs were taken at successively later times as the IRMS proceeded through its cycle, and each was used to make a separate “A1 – Grnd” IR calculation. Exact values for those successively later times can be obtained under the “A1-A2,” “A1-B3,” etc. tabs of the Excel data file. If all five times involving “A1” are noted and their average found, it is equal to 1309.7 sec, the “A1- Grnd (min)” time given in the “Results” table. Similarly, if the five successively later times for Cable A, Conductor 2 are obtained under the “A1-A2,” “A2-B3,” “A2-B4,” “A2-C5,” and “A2-C6” tabs and their average found, it is equal to 1332.1 sec, the “A2 – Grnd (min)” time given in the “Results” table.
12 Per the following discussion, this time is actually 1309.7 seconds and should have been shown as 1310 seconds in the “Results” table, but was erroneously rounded to 1309 seconds.

B-6
These details demonstrate that the short-to-ground data are presented as the minimum IR value from the several calculations of each conductor’s IR-to-ground, at the average of the times when those measurements were taken. This is the origin of the noted uncertainty. It’s also noted in passing that the Excel data plots given under the “conductor-to-conductor mins” tabs use the same data averages described above for short-to-ground times, presented in a slightly different manner. In the above example, if the ten times (five times involving A1 to ground and five times involving A2 to ground) are averaged, the resulting time (1320.9 seconds) is used under the “A-B mins” and the “A-C mins” tabs for the time of the minimum IR for “A to Ground.” In the above example, taking the uncertainties into account, what the data actually indicate is that sometime during the 185-second cycle preceding 1304 seconds, conductors A1 and A2 shorted to each other and also shorted to ground, but, due to the uncertainties, the data cannot support knowledge of which occurred first, nor of the time between them (if any). Thus, as stated previously, this hot short and others (some discussed below) given in the IRMS data that endured less than one cycle are not included in the attached IRMS data summary table. B.2.8 Effects of Cycle and Termination Time Uncertainties on Results The two strongest IRMS indications of inter-cable hot shorts from the Penlight tests cited in Volume 1, Section 6.11, page 77, “Summary of Penlight Test Results in the Bin 2 Context,” are called into question by the cycle length issue. That section states that tests PT-45 and PT-60 gave clear indications of inter-cable hot shorts, but the timing in both cases is such that it’s not possible to determine the time interval between the conductor-to-conductor shorts and the shorts to ground (which could be zero, making these invalid examples of “hot” shorts capable of causing an SA). Therefore, they were not included in the attached Inter-Cable section of the summary table. However, the two strongest IRMS indications of inter-cable hot shorts from the intermediate-scale tests (ITs) cited in Volume 1, Section 7.1.16, page 109, “Summary of Intermediate-scale IRMS Results,” appear to be valid. On the attached Inter-Cable section of the summary table, the first of those indications is for the IT-1 test for the conductor C5 to conductor B4 hot short with a duration of five minutes (according to data from the Volume 1 table at the bottom of page 83). Excel data indicates that even in the worst case (i.e., assuming the first conductor to short to ground does so one second after its last non-shorted measurement), the hot short endured for at least 144 seconds. Similarly, Excel data for the other IT-1 hot short on the summary table (the C5 to A1 short with duration 3.6 minutes, according to data from the Volume 1 table) show that it endured for at least 65 seconds. B.2.9 Recommendations for Future IRMS Improvements Since the above discussions concern uncertainties in the IRMS data principally caused by the IRMS’s rather long cycle times, it is worth noting that those uncertainties could be reduced for future IRMS applications without reducing the amount of data provided. The data provided are for IR values between adjacent IRMS-monitored cables, but measurements were made for IR values between all possible pairs of IRMS-monitored cables. For example, with reference to the “Six-Cable Bundle Arrangement” shown in Figure 4, IR values were provided between conductor groups in Cable A and the adjacent Cables B and C, but IR values were also measured (but not reported) between Cable A and non-adjacent Cables D, E, and F. This same degree of over measurement existed for the other corner cables D and F, but a lesser degree of over measurement existed for the side cables B, C, and E because they each had only one non-

B-7
adjacent cable. Re-programming the IRMS to eliminate the less important measurements would significantly shorten its cycle time and improve time resolution of the event sequences. B.3. Surrogate Circuit Diagnostic Units (SCDUs) B.3.1 Introduction CAROLFIRE’s second electrical performance-monitoring system utilized SCDUs, which are described in detail in Appendix C of Volume 1. The SCDUs provided an opportunity to assess how various simulated circuits responded to fire-induced cable failures. They could be configured to represent a range of circuits, although, in practice, most of the CAROLFIRE tests used a standard AC-powered motor-operated valve (MOV) control circuit such as those used in both the Nuclear Energy Institute/Electric Power Research Institute (NEI/EPRI) (2001) and Duke Energy Corporation (2006) test programs. Some tests varied the number of energized source conductors and/or the number of grounded conductors present in the tested cable. B.3.2 Differences Between the IRMS and the SCDU Tests These differences included: - most of the SCDU tests were configured with intra-cable shorting in mind, whereas most of the IRMS tests were configured with inter-cable shorting in mind; - each SCDU contained a specific circuit which was tested for the occurrence of an SA; thus, it was not subject to uncertainty resulting from the IRMS’s generic assumption that an IR of 1000Ω or less represented an SA; - all 64 channels of SCDU data were recorded every 0.2 seconds (i.e., the SCDU’s cycle time was 0.2 seconds), as compared to the IRMS’s cycle time of 185 seconds (or less, in a few cases); - most of the SCDU test cables contained a grounded conductor, whereas none of the IRMS cables contained a grounded conductor or shield; - each SCDU tested only for the actual occurrence of a hot short or SO due to cable failure; it seldom gave any indication of cable degradation prior to cable failure, whereas the IRMS provided a complete history of IR degradation between all pairs of adjacent conductors prior to cable failure. B.3.3 Individual SCDU Circuits SNL constructed four SCDUs for CAROLFIRE (Figure 5). Their permanent wiring was identical, with the exception that SCDU #1’s power supply was not grounded (it was grounded in the other three SCDUs). Although the electrical capacity of the Control Power Transformers (CPTs) used on the four SCDUs could be varied, in practice SCDUs #1 and #2 used 150 volt-amp (VA) CPTs, SCDU #3 used a 200 VA CPT, and SCDU #4 used a 100 VA CPT with the exception of four tests (IT-11, -12, -13, and -14) in which SCDU #4 was used without a CPT.

B-8
B.3.4 Application Configurations Each of the four SCDUs could be connected in any of the four configurations discussed below. B.3.4.1 SCDU-MOV-1 As stated previously, the most frequently used configuration was SCDU-MOV-1 (see Figure 5). A hot short between Circuit Paths 1 or 2 (conductors 1 or 2) and Circuit Paths 4, 5, or 6 (conductors 4, 3, or 7) would cause an SA. Note that Circuit Path 7 (conductor 5) was a return path to the power supply in all four SCDUs and was also grounded in SCDUs #2, #3, and #4, but not in SCDU #1 (this is one reason for the previous statement that “most of the SCDU test cables contained a grounded conductor”). The effect was that, for all four SCDUs, a hot short to Circuit Path 7 (conductor 5) would cause a fuse blow failure. However, whereas a single hot short to external ground (i.e., to the cable tray or conduit) would cause a fuse blow failure for SCDUs #2, #3, and #4, a single hot short to external ground would not cause a fuse blow failure for SCDU #1. Also, for SCDU #1, a short to ground on Circuit Paths 1 or 2 (conductors 1 or 2) and Circuit Paths 4, 5, or 6 (conductors 4, 3, or 7) would cause an SA, and a short to ground on Circuit Path 1 or 2 (conductor 1 or 2) and Circuit Path 7 (conductor 5) would cause a fuse blow. B.3.4.2 SCDU-MOV-1a This configuration resulted from an inadvertent hookup wiring error made on all four SCDUs for test IP-4 only. The effects of this error were minor, and, once discovered, were negated by corrections to the recorded data. B.3.4.3 SCDU Operation Circuit 1 This configuration was used only in test IT-3, which included SCDU #4, connected to a 3-conductor-plus-drain-wire cable. In this configuration, one of the three insulated conductors was connected to Circuit Path 1, which was energized (i.e., it became the single source conductor). The second insulated conductor was connected to Circuit Path 5, and the third insulated conductor was connected to Circuit Path 6, making two target conductors. The uninsulated drain wire was connected to Circuit Path 7 (grounded on SCDU #4). The other Circuit Paths were not connected to anything for this test (IT-3). This configuration, with a grounded drain wire within the cable, represented typical practice for cables with drain wires or shields. B.3.4.4 SCDU Inter-Cable Configuration (IC) Figure 6 shows the most frequently used (six-cable bundle) version of this configuration, which was used for a total of ten cable bundles in tests IT-2, IT-3, IT-4, and IT-5 (IT-2 also tested two twelve-cable bundles, which are discussed later). As shown in Figure 6, for all ten of the six-cable bundle IC tests, Circuit Path 1 was connected to all of the conductors of one 7-conductor cable, and Circuit Path 2 was connected to all of the conductors of another 7-conductor cable, thus creating two source cables. A third 7-conductor cable was used as the target cable and connected as shown: conductors 2 and 5 were connected to Circuit Path 4, conductors 3 and 6 were connected to Circuit Path 5, and conductors 4 and 7 were connected to Circuit Path 6. Conductor 1 (the center conductor) was not connected to anything, becoming an “unconnected spare.” Since no target conductor was connected to Circuit Path 7, there were no conductors in the fire test structure that connected directly to the CPT return path. There were conductors

B-9
that led from the fire to the return path, but they led through the 1750Ω ballast resistor (from Source 1, the normal undamaged situation), through the 1750Ω passive operation device, or through the K1 or K2 active operation devices, all of which had sufficient resistance to preclude a fuse blow (energizing any of the three operation devices was the definition of an SO event). This was a significant difference from the other three SCDU configurations (i.e., the two “MOV-1” and the “Operation Circuit 1” configurations), in which Circuit Path 7 (on all four SCDU circuits, both grounded and ungrounded) always served as a return path to the power supply from target conductor 5, as well as an internal ground for SCDUs #2, #3, and #4 (the grounded SCDUs). The three cables (two source cables and one target cable, as described above) were bundled as shown in the “Six-Cable Bundle Arrangement” part of Figure 4; Cables A and B were the source cables, Cable C was the target, and Cables D, E, and F (between Cables A, B, and C and the cable tray) were not connected to the SCDU and were not grounded, in keeping with their intended function of providing an additional level of isolation between the active cables and the grounded cable tray. For the above “IC” configurations using grounded SCDUs, hot shorts or spurious operations impacting the target cable could only occur given inter-cable shorting that remained independent of the external ground. Any short between an energized source conductor and the external ground (i.e., the raceway) would have caused a fuse blow. (Recall that there was no direct internal return path from the target conductors to the CPTs, so even for the grounded CPTs there was no internal ground). For the above “IC” configurations using the ungrounded SCDU #1, as with the grounded SCDUs, there was no direct internal return path to the CPTs, but, unlike the grounded SCDUs, there was also no external return path to the CPTs. Therefore, given fire damage to the cables, a fuse blow failure was not possible, and an SO was inevitable. An SO could result from direct interaction between either of the source cables and any of the three conductors in the target cable, or from multiple interactions with the ground (i.e., when either of the source cables shorted to ground and any of the three target conductors also shorted to ground). In principle, it might be possible to distinguish this latter case because voltage in the target conductor might tend to build slowly and never reach full source potential. As noted above, IT-2 also included two twelve-cable bundles. One bundle, consisting of twelve thermoset (TS) cables (cross-linked polyethylene/chlorosulfonated polyethylene (XLPE/CSPE), Cable ID #1013), was connected to SCDU Circuit #1 (ungrounded). The other bundle, consisting of a mixture of TS and thermoplastic (TP) cables (six XLPE/CSPE TS cables (Cable ID #10 - footnote 7 applies), and six polyethylene/polyvinyl chloride (PE/PVC) TP cables (Cable ID # 15)), was connected to SCDU Circuit #2 (grounded). The response of both SCDUs to the various cable interactions was identical to that described above for the ten six-cable bundles. The only differences were the size and extent of the conductors used. The “Twelve-Cable Bundle Arrangement” part of Figure 4, and Figure 6, “SCDU IC Configuration for Six-Cable Bundles,” provide material that was created for six cable bundle purposes, but which can nevertheless be used to illustrate the following text about twelve-cable bundles. For SCDU Circuit #1 (connected to the all-TS twelve-cable bundle), Circuit Path 1 (source 1) was connected to 21 conductors, consisting of all 7 of the conductors in Cables J, G, and B. Circuit Path 2 (source 2) was connected to 21 conductors, consisting of all 7 of the conductors
13 In Volume 1’s SCDU results table on page 115, the Cable ID # is incorrectly given as #3.

B-10
in Cables K, M, and C. Each of the three target paths (Circuit Paths 4, 5, and 6) was connected to all 7 of the conductors in a separate cable, H, A, or L, respectively. Thus, there were two sources, each consisting of all 21 conductors in three connected cables, and three targets, each consisting of all 7 conductors in a separate cable. Cables D, E, and F (between Cables G, B, C, M, and the cable tray) were not connected to the SCDU and were not grounded, in keeping with their intended function of providing an additional level of isolation between the active cables and the grounded cable tray. The above-described connections are consistent with the Excel datasheet for “Test IT_02 SCDU Data,” under the “Test Conditions” tab, in the “Circuit #1” column and the “Wiring Config:” row. For SCDU Circuit #2 (connected to the mixed TS and TP twelve-cable bundle), information presented in the Excel datasheet for “Test IT_02 SCDU Data,” under the “Test Conditions” tab, in the “Circuit #2” column and the “Wiring Config:” row, indicates that all six TP cables were connected. However, the information presented for IT-2 in Volume 2, page 110, indicates that Cables B, D, F, H, K, and M were the locations of the six TP cables14. Taken together, this means that two of the three “isolation” cables between the active cables and the tray (i.e., D and F) were connected to the SCDU. This would not have been consistent with the intended isolation function for the bottom row of cables (D, E, and F), and the SNL personnel who conducted the test stated that it was not something they would have done. After consulting all available records, the SNL personnel determined the most likely connections: Circuit Path 1 (source 1) was connected to all seven conductors in each of two TS and one TP cables (Cables J, G, and B, respectively); Circuit Path 2 (source 2) was connected to all seven conductors in each of two TP and one TS cables (Cables K, M, and C, respectively); Circuit Path 4 (Passive Target 4) was connected to all seven conductors in TP Cable H; and Circuit Paths 5 and 6 (Active Targets 5 and 6) were each connected to all seven conductors in TS Cables A and L, respectively. Cables D (TP), E (TS), and F (TP) were left unconnected to any Circuit Path (and were not grounded). B.3.5 Summary of SCDU Conductor-to-Conductor-Short Data The SCDU data is well organized and sufficiently detailed to enable its use for many purposes. For example, the tables on pages 113 to 126 in Volume 1 proceed in columns from the left, giving the test number, the SCDU circuit number, the circuit configuration, CPT size and whether or not it’s grounded, cable type, number of conductors, cable ID number, bundle size, and an event summary (i.e., narration of the SAs and fuse blows that occurred due to both intra- and inter-cable interactions). These items are discussed in this document, and should be understood to enable the selection of appropriate sets of data that avoid combining the results of vastly different tests. For example, an ungrounded SCDU in the IC configuration is quite different from a grounded SCDU in the MOV-1 configuration, and their data should be interpreted and used in significantly different ways. In addition, a two-page summary of the intra-cable interactions is presented on pages 131 and 132 in Volume 1 (the nine inter-cable interactions are presented in the detailed tables on pages 113 to 126, but are not repeated in the two-page summary). The Excel data files on the CDs distributed with CAROLFIRE Volumes 1 and 2 (and on the NRC website) provide detailed data recorded from the voltage and current transducers on Circuit Paths 1 through 8 (shown on Figures 5 and 6—note that Circuit Path 9 was not used, and was not monitored during any CAROLFIRE test). Since there was a voltage and a current
14 Cables A, C, E, G, J, and L were the six TS cables.

B-11
transducer on each of the eight Circuit Paths, and four SCDUs were used in each CAROLFIRE IT, a total of 64 data points were collected during the CAROLFIRE ITs using a 64-channel data recorder (SCDUs were not used during the CAROLFIRE Penlight tests). All 64 data points were recorded every 0.2 seconds, and have been preserved for archival purposes. During the time intervals in which cable degradation occurred (i.e., immediately before, during, and after SAs and fuse blows), all data is presented in the Excel data files. However, during other times, intervals of 30 seconds to a minute are typically presented. The detailed data at 0.2-second intervals can be of interest in the many places where hot shorts of SO events are reported in the Volume 1 event summary tables, particularly when durations of a second or less are noted.


UN
ITE
D S
TAT
ES
N
UC
LE
AR
RE
GU
LA
TO
RY
CO
MM
ISS
ION
WA
SH
ING
TO
N, D
C 20555-0001
--------------------O
FF
ICIA
L BU
SIN
ES
S

NU
REG
-2128 Final
Electrical Cable Test R
esults and Analysis D
uring Fire Exposure (ELECTR
A-FIRE)
September 2013


![Cable Fire Behaviour [Compatibility Mode]](https://static.fdocuments.us/doc/165x107/55cf92bb550346f57b9916a6/cable-fire-behaviour-compatibility-mode.jpg)