Electric vehicles – A model based assessment of future ...
14
EVS24 International Battery, Hybrid and Fuel Cell Electric Vehicle Symposium 1 EVS24 Stavanger, Norway, May 13-16, 2009 Electric vehicles – A model based assessment of future market prospects and environmental impacts Peter Mock, Dirk Hülsebusch, Jörg Ungethüm, Stephan A. Schmid German Aerospace Center (DLR), Institute of Vehicle Concepts, Pfaffenwaldring 38-40, 70569 Stuttgart, Germany, [email protected] Abstract Assessing future market prospects and environmental impacts of electric vehicles requires taking into account the competitive situation with regard to established conventional vehicle propulsion technologies. The Modelica library AlternativeVehicles is used to analyse energy consumption of battery (BEV), extended range electric (EREV) as well as fuel cell hybrid electric vehicles (FCHEV). Costs of technical measures for enhancing conventional vehicles, as well as cost curves for batteries and fuel cells are assessed. Using a newly developed model, VECTOR21, customer purchase decision is modeled to derive future market shares of propulsion technologies and fuels, taking into account energy consumption, energy prices and taxation as relevant influencing factors. Two different scenarios demonstrate the dependency of future market prospects on a set of general conditions. With electricity and hydrogen being produced from renewable energy sources, as well as implementation of strict regulations regarding CO 2 , BEV and FCHEV could achieve a market share of up to approx. 65 % on the German new passenger car market by 2030. CO 2 emissions of the vehicle stock could be reduced by approx. 65 % in this scenario. In a less ambitious scenario a market share of approx. 20 % is seen for BEV, with no application of FCHEV in the long run. CO 2 emissions of the vehicle stock could be reduced by approx. 40 % in this scenario. Keywords: modeling, passenger car, energy consumption, cost, market, environment 1 Introduction In order to assess future market prospects and environmental impacts of electric vehicles, it is necessary to not only focus on an analysis of individual concepts, but to furthermore compare different technologies and to analyze in detail the competitive situation with regard to established conventional vehicle propulsion technologies. For determining energy consumption of electric power-train concepts and for comparing the results with energy consumption and efficiency of conventional vehicle technologies, the Modelica library AlternativeVehicles is applied in chapter 2. Production costs and retail prices for a variety of vehicle technologies and individual assembly parts, in particular batteries and fuel cells, are assessed in chapter 3. Taking into account relevant influencing parameters, like energy consumption, energy prices, taxation and customer decision, concurrency of vehicle concepts is simulated using the VECTOR21 scenario model in chapter 3 and 4. The results include future market shares of electric vehicles as well as their influence on CO 2 emissions of the fleet. Focus of the examination is on passenger cars in Germany up to the year 2030.
Transcript of Electric vehicles – A model based assessment of future ...
EVS24 International Battery, Hybrid and Fuel Cell Electric Vehicle Symposium 1
EVS24 Stavanger, Norway, May 13-16, 2009
Electric vehicles – A model based assessment of future market prospects and environmental impacts
Peter Mock, Dirk Hülsebusch, Jörg Ungethüm, Stephan A. Schmid
German Aerospace Center (DLR), Institute of Vehicle Concepts, Pfaffenwaldring 38-40, 70569 Stuttgart, Germany, [email protected]
Abstract Assessing future market prospects and environmental impacts of electric vehicles requires taking into
account the competitive situation with regard to established conventional vehicle propulsion technologies.
The Modelica library AlternativeVehicles is used to analyse energy consumption of battery (BEV),
extended range electric (EREV) as well as fuel cell hybrid electric vehicles (FCHEV). Costs of technical
measures for enhancing conventional vehicles, as well as cost curves for batteries and fuel cells are
assessed. Using a newly developed model, VECTOR21, customer purchase decision is modeled to derive
future market shares of propulsion technologies and fuels, taking into account energy consumption, energy
prices and taxation as relevant influencing factors. Two different scenarios demonstrate the dependency of
future market prospects on a set of general conditions. With electricity and hydrogen being produced from
renewable energy sources, as well as implementation of strict regulations regarding CO2, BEV and FCHEV
could achieve a market share of up to approx. 65 % on the German new passenger car market by 2030. CO2
emissions of the vehicle stock could be reduced by approx. 65 % in this scenario. In a less ambitious
scenario a market share of approx. 20 % is seen for BEV, with no application of FCHEV in the long run.
CO2 emissions of the vehicle stock could be reduced by approx. 40 % in this scenario.
Keywords: modeling, passenger car, energy consumption, cost, market, environment
1 Introduction In order to assess future market prospects and environmental impacts of electric vehicles, it is necessary to not only focus on an analysis of individual concepts, but to furthermore compare different technologies and to analyze in detail the competitive situation with regard to established conventional vehicle propulsion technologies. For determining energy consumption of electric power-train concepts and for comparing the results with energy consumption and efficiency of conventional vehicle technologies, the Modelica library AlternativeVehicles is applied
in chapter 2. Production costs and retail prices for a variety of vehicle technologies and individual assembly parts, in particular batteries and fuel cells, are assessed in chapter 3. Taking into account relevant influencing parameters, like energy consumption, energy prices, taxation and customer decision, concurrency of vehicle concepts is simulated using the VECTOR21 scenario model in chapter 3 and 4. The results include future market shares of electric vehicles as well as their influence on CO2 emissions of the fleet. Focus of the examination is on passenger cars in Germany up to the year 2030.

EVS24 International Battery, Hybrid and Fuel Cell Electric Vehicle Symposium 2
2 Vehicle energy consumption Energy consumption and efficiency depend on many different factors like driving resistance, power train concept, dimensioning, driving style and use of auxiliaries. To analyze different power train concepts the Modelica library AlternativeVehicles has been developed (s. section 2.1). In section 2.2 three reference vehicle sizes, in accordance to the VECTOR21 model, are defined. Furthermore, assumptions for technological development (e.g. driving resistances) are made and driving cycles as well as auxiliary loads are chosen. In section 2.3 the simulation results for different segments, years and power train concepts are shown.
2.1 AlternativeVehicles library The Modelica library AlternativeVehicles (AV) has been developed by the DLR Institutes of Vehicles Concepts and Robotic / Mechatronics [1] and is based on the freely available VehicleInterfaces library (VI) which defines all major components of power trains including interfaces and basic models. The AV library is an addition to the commercial PowerTrain library which has also been developed by DLR [2]. It contains parameterized component models, like batteries, supercaps, fuel cell systems, electrical drives and thermal systems for modeling alternative power trains. Furthermore, ready to use vehicle models as hybrids, fuel cell hybrid, range extender and battery are included. Modelica is a free object oriented description language for modeling and simulation of dynamic multidisciplinary systems (electrical engineering, thermodynamics, mechanics and control). In Modelica different component models are linked by undirected physical connectors. E.g. an electric pin consists of a potential and flow variable which represent the electrical potential and current. Further information about Modelica can be found in [3], [4]. Figure 1 shows the graphical view of a fuel cell hybrid electric vehicle (FCHEV) model. The vehicle model is a forward oriented model. Acceleration and brake pedal position are controlled depending on the desired driving cycle and actual velocity. Inside the control module the acceleration pedal position is converted into a signal for controlling the electrical drive. The electrical drive is mainly modeled by a map which describes the relation between angular speed, torque and efficiency. Models for driving
resistances like aerodynamic drag, rolling-, climbing resistance and acceleration drag are placed within the chassis model. Main task of the battery is to supply and buffer energy during acceleration and deceleration phases.
Figure 1: Graphical layer of the FCHEV model
Battery and fuel cell systems have a key role regarding electrical power trains. E.g. a powerful battery is required because the fuel cell system needs a high response time to provide full power. Thus in the following sections these component models are explained more in detail.
2.1.1 Battery model Easiest way of modeling an electro-chemical cell is a serial connection of an ideal voltage source and ohmic resistor. Real electrical characteristics are much more comprehensive. To cover electro-chemical processes like double layer capacitance, charge transfer resistance, solid electrolyte interface and diffusion, a complex impedance based model has been implemented [5]. Figure 2 shows the electric equivalent circuit model of a Li-ion cell as an example. Beside electrical pins the equivalent circuit elements also have a thermic interface to model the thermal losses of the cell (s. red lines/squares in Figure 2).
Zw i
A
currentSenso...
signalVo...
+ -
varRi
RQ RQ
heat
Capa
cito
r
C_th
Maxi...po...
V
voltageSenso...
integratorSOC
I
k=1/C
Log ...x > ...x < ...or
pin_p
pin_n
SOC
I
heat_port
ata
Pmax
U
Figure 2: Electric equivalent circuit model of Li-ion cell
Main influencing parameters of Li-ion cells are state of charge (SOC), current and temperature.

EVS24 International Battery, Hybrid and Fuel Cell Electric Vehicle Symposium 3
E.g. the impedance magnitude has its maximum values at high and low state of charge. Therefore, impedance spectroscopy measurements have been carried out for different state of charges, dc currents and temperatures. On the basis of different impedance spectra, the model parameters were fitted by a complex nonlinear least square fitting (CNLS) algorithm. The CNLS algorithm fits the parameter of the equivalent circuit model as long as the differences between measured and simulated impedance values are minimal. All identified model parameters were stored in multidimensional maps which generate the model parameter to the corresponding SOC, current and temperature. Another contribution factor of battery technologies is their specific energy density. High or low energy densities correspond to high or low battery weight and volume. Prototypes of high power Li-ion battery systems reach energy densities of around 80 Wh/kg [6]. For the following vehicle simulations energy density of Li-Ion battery systems as in Table 1 is assumed. Table 1: Assumed technical attributes Li-ion batteries
Year Parameter Unit 2010 2020 2030
Battery energy density Wh/kg 80 115 150 Usable capacity - 50 % 60 % 70 %
2.1.2 Fuel cell system model For vehicle propulsion systems of passenger cars primarily the PEFC (Proton Exchange Fuel Cell) is utilized. The PEFC is driven with gaseous hydrogen at the anode and oxygen or air at the cathode supply. In vehicle applications almost exclusively ambient air at the cathode is used. The separation of anode and cathode gas is achieved through a thin membrane, which is permeable only for protons. Since the proton conductivity of the membrane strongly depends on water content, the working fluids are humidified in most cases. Therefore, to supply the PEFC an air compressor and a humidifier at cathode side are necessary. As hydrogen from the vehicle tank is supplied with sufficient high pressure regardless of tank technology, only a recirculation pump and a humidifier are necessary at anode side. Since the reaction water is needed to moisten the supply media, at least one water separator in the waste gas stream is necessary. However, gas humidifier and separator might be combined in a single apparatus (e.g. Nafion gas humidifiers). Figure 3 shows the graphical layer of a PEFC system model with the mentioned periphery. Calculation
of the dynamic behaviour of a PEFC system and calculation of the auxiliary energy consumption is possible using this model. E.g. control strategies for the air compressor and the recirculation pump may be developed. The auxiliary energy primarily is needed by the air compressor and to a lower degree by the hydrogen recirculation pump. Energy consumption of cooling pump, valves, sensors etc. is considered by a constant power demand.
mapBasedStackturboCompressor
incommi...
exhau...
incommi...
V
voltage...
A
current...
pow er
V
auxVolt...
A
current...
pow er1
airHumidifierer
h2Humidifierer
incomm
ingAirState
incomm
ingH2State
compressorDr...adaptor
recirculationPumpidealShortPipe
adapt...recircul...
h2Separ...
w ater...
airSepar...
idea
lSho
rtPip
e2
idealShortPipe4
h2Vessel
inertiaR...
J=J
inertiaC...
J=J
specifi...
rate...
r...
r...
Flow
voltage
current
pow er
auxPow er
auxCurrent
auxVoltage
controlBus
auxiliarySw itch
airHumidifiererSw itch
h2HumidifiererSw itch
compressorDriveControlLeverPosition
recirculationPumpControlLeverPosition
controlLeverPosition
controlLeverPosition
compressorBuses
recirculationBuses
fuelFlowco
ntro
lBus
Fuel
CellM
ount
fuelCellCo...
fuelCellBusfuelCellBus p_fc
n_fc
p_aux
n_aux
fuelCellControl...fuelCellControl...
compressorC...compressorC...
compressorB...
recirculationC...recirculationC...
recirculationB...
Figure 3: Top layer of a PEFC system model
For the simulation of complete driving cycles which last several minutes, this model is not suitable due to the high computation effort. A simplified model, assuming a well controlled fuel cell system is necessary, which is shown in figure 4. This quasi-stationary model is based on tables for stack voltage and auxiliary power demand. The calibration of this model was done using the more complex model of Figure 3 and checked against performance data of existing automotive PEFC-systems.
stac
kCur
...
specifiedPo...
auxiliaryPow e...stackPow er
k=-1
chs1
fuelCellConsu...
fuelCellC...
Fuel CellConsum...
k=Alter...
gain
add
-1
+1add
++1
-1
P,...
electricMultiSensorAux
k=...
pu...
reversePolari...
k=A_cell
current...
V
stackVoltagek=1/n_c...
stackV...
n_cellrealExp...
A_cellrealExp...
sw itch
sw itch1
pow er
auxPow erauxCurrentauxVoltage
stackStoichiometricAirMassFlowstackStoichiometricH2MassFlow
fuelFlow
current
voltagestackMeanCellVoltage
stackNumberOfCells
stackActiveCellArea
auxiliarySw itch
auxiliarySw itchstackCurrentDensity
cont
rolB
us
Fuel
CellM
ount
f uelCellCo...
fuelCellBusfuelCellBus p_fc
n_fc
p_aux
n_aux
fuelCellControl...fuelCellControl...
Figure 4: Table-based fuel cell system model
For the vehicle simulation a specific power weight of the fuel cell system of approx. 3.2 kg/kW is

EVS24 International Battery, Hybrid and Fuel Cell Electric Vehicle Symposium 4
assumed [7]. For hydrogen storage a high pressure-tank with a specific energy density approx. 21 kg/(kg H2) is used [8].
2.2 Definition of scenario vehicles Vehicle size today is defined by the means of vehicle dimension and installed traction power. To cover a wide range, three vehicle size categories are defined for the analysis (table 2).
Table 2: Definition of scenario vehicle categories
Vehicle class Parameter Unit Small Medium Large Maximum velocity km/h 150 170 190 Acceleration (0-100 km/h) s 14 12 10 Power ICE-vehicle kW 53 91 120 Kerb weight ICE-vehicle kg 1,050 1,340 1,650 Aerodynamic coefficient cw 1 0.31 0.28 0.32 Frontal area A m² 2 2.2 2.7 Rolling resistance kr0 1 0.01 Three electric vehicle concepts are covered by an in-depth analysis: • battery electric vehicles (BEV) • extended range electric vehicles (EREV) • fuel cell electric hybrid vehicles (FCHEV)
Advantages of BEV are local zero emission, high efficiency and low noise emission. On the other hand electrical range is much lower than for fuel cell and conventional vehicles. Extended range electric vehicles (EREV) offer significantly higher driving ranges, as an internal combustion engine (ICE) supplies energy at low battery SOC or high power demand. In contrast to plug-in hybrid electric vehicles (PHEV) top loads can be reached without assistance of the ICE, as EREV make use of a full size electric power train, similar to a BEV. The FCHEV is a serial hybrid with a small battery for acceleration and deceleration. Table 3 shows the electric ranges assumed for simulation of vehicles. Artemis real world driving cycles [9] are used to simulate energy consumption. To obtain one single value for energy consumption the three Artemis cycles urban, road and motorway are combined using a set distribution. According to
[9], on average 29 % of all ways are driven in urban surroundings, 45 % on road and 26 % on motorway.
Table 3: Definition of the electrical range in Artemis real world drive cycles
Vehicle Class / electrical range Power Train Unit Small Medium Large
EREV km 50 50 50 BEV km 80 120 120
FCHEV km 400 400 400 Constant auxiliary loads have been estimated for each vehicle class (small: 1 kW; medium: 1.5 kW and large: 2 kW) to account for the use of auxiliaries (e.g. heating and cooling) which is an important influencing factor for the energy consumption of electric vehicles. In table 4 assumptions on future reductions of vehicle weight, aerodynamic drag and rolling resistance based on the initial values (table 2) are summarized.
Table 4: Definition of driving resistance reduction
Year / Reduction Parameter 2020 2030
Vehicle weight (m) 6 % 11 % Aerodynamic drag (cwxA) 10 % 20 %
Rolling resistance (kr0) 9 % 17 %
2.3 Simulation results Based on the assumptions stated in section 2.2 the scenario vehicles have been dimensioned. For all electric vehicles electric drive power was selected to reach the predefined driving performances (maximum speed and acceleration). Battery capacity of BEV and EREV was calculated by simulating energy consumption of the vehicles using the combined Artemis drive cycles including auxiliary load. The EREV primary energy converting unit was defined by simulating the Artemis Motorway starting with low battery SOC. During the simulation it was checked that the installed power was high enough to prevent a further decrease of the battery SOC. The fuel cell system power was set to the same value than the electric drive. A summary of the power train vehicle dimensioning is given in table 5.
Table 5: Dimensioned vehicles with the basic parameters
EREV BEV FCHEV Parameter Unit
Small Medium Large Small Medium Large Small Medium Large Vehicle mass kg 1,293 1,578 1,989 1,245 1,753 2,247 1,231 1,580 2,086
Electrical traction power kW 55 80 125 55 90 140 55 80 125 Electrical energy storage kWh 16.2 18.9 24.3 24.3 45.9 62.1 3.2 4.5 7.1
Primary energy converter power kW 35 40 55 - - - 55 80 125 Primary energy storage capacity kg 30 38 45 - - - 4 5,5 8

EVS24 International Battery, Hybrid and Fuel Cell Electric Vehicle Symposium 5
Simulation results of all electric vehicles are shown in figure 5. BEV have lowest energy consumption and highest tank-to-wheel (TTW) efficiency. Energy consumption is in between 16.4 to 28.1 kWh/100km in 2010. EREV energy consumption in charge depleting mode is lower than for BEV due to the smaller battery weight. Energy consumption of FCHEV is at 34.6 to 70.6 kWh/100km in 2010. The highest energy consumption is reached by the EREV in charge sustaining mode (53.9 to 83.9 kWh/100km in 2010). The TTW efficiencies in figure 6 were calculated by equation (1):
input
wheelwt W
W=2η (1)
The value for Winput varies on the type of power
train. For BEV the required battery energy including the losses during charging process and for the EREV (cs-mode) and FCHEV the energy of fuel mass have been used (SOCend = SOCstart)
0
20
40
60
80
100
2010 2015 2020 2025 2030Time in years
Ener
gy c
onsu
mpt
ion
in k
Wh/
100
km
BEV & EREV (cd-mode)
FCHEV small and medium
FCHEV large
EREV small & medium (cs-mode)
EREV large (cs-mode)
ICE small
Figure 5: Combined Artemis drive cycles energy
consumption including auxiliaries
The low energy consumption of BEV is due to high efficiency (74 % to 45 %) of the battery system and electrical drive. The much lower efficiency in the Artemis urban cycle can be explained by the high amount of acceleration phases and the resultant multiple energy conversions (battery-electrical drive-wheel-electrical drive-battery). The FCHEV efficiency is approx. half the value of BEV efficiency (39 % to 17 %) which can be justified by the efficiency of the fuel cell system at around 50 %. Efficiency of EREV in cs-mode is in between 23 % and 15 %. Only on the motorway cycle the
direct powered ICE vehicle offers higher efficiency. At high power demand and small potential of recuperating a direct traction system is more efficient as the ICE-generator unit can not run in the best operating point and the energy losses caused by several energy conversions can not be compensated.
0,0
0,2
0,4
0,6
0,8
ArtemisMotorway
ArtemisRoad
ArtemisUrban
NEDC
Tank
to w
heel
effi
cien
cy
BEV FCHEV EREV (cs-mode) ICE
Figure 6: Tank to wheel efficiency for different power
train concepts for the vehicle class small in 2010
0 50 100 150 200
ICE
EREV (cs-mode)
FCHEV natural gas
EREV (75% cd-mode)electricity mix germany
EREV (cd-mode)electricity mix germany
BEV electricity mixgermany
EREV (75% cd-mode)renewable electricity
FCHEV electrolysisrenewable electricity
BEV renewableelectricity
Well to wheel CO2 emissions in g/km (Artemis, small vehicle, 2010)
Figure 7: WTW CO2 emission for power trains
Looking at well-to-wheel (WTW) CO2 emissions in combined Artemis drive cycle, lowest values (3 to 44 g/km) are for BEV, FCHEV and EREV (75% in cd-mode) when operated using electricity or hydrogen from renewable energy sources (s. figure 7, small vehicle size category). With electricity and hydrogen from fossil sources WTW emissions are in between 99 to 121 g/km. Highest values are for EREV (cs-mode) and conventional ICE vehicles (165 g/km / 186 g/km).
EVS24 International Battery, Hybrid and Fuel Cell Electric Vehicle Symposium 6
3 Technology cost assessment Besides vehicle energy consumption, for a profound judgement on future market prospects for vehicle technologies, sales prices and therefore manufacturing costs are a key relevant parameter. For the analysis, baseline vehicles are defined for three passenger car size categories: small, medium and large (s. section 2.2). Production costs and retail prices for technically more advanced vehicle variants with lower energy consumption are consecutively derived.
3.1 Internal combustion engines Manufacturing costs for baseline gasoline, diesel and compressed natural gas (CNG) vehicles are estimated based on sales prices of currently available passenger cars. As a conversion factor for production costs to retail prices excluding tax, a value of 1.35 is applied, as discussed in literature [10]. This mark-up includes profit of the vehicle manufacturer as well as costs and profit of the dealership. Furthermore, value-added tax (VAT) is added. Individual technical measures for optionally reducing energy consumption are identified and associated manufacturing costs are estimated, according to literature as well as manufacturer data [10, 11]. Examples for technical measures are direct injection for gasoline vehicles, downsizing and turbocharging, variable valve control, exhaust heat recovery, improved aerodynamic efficiency, improved transmission and reduction of vehicle curb weight.
EnergyCons.
ProductionCost
RetailPrice
Baseline Vehicle 2,65 MJ/km 9.337 € 15.000 €
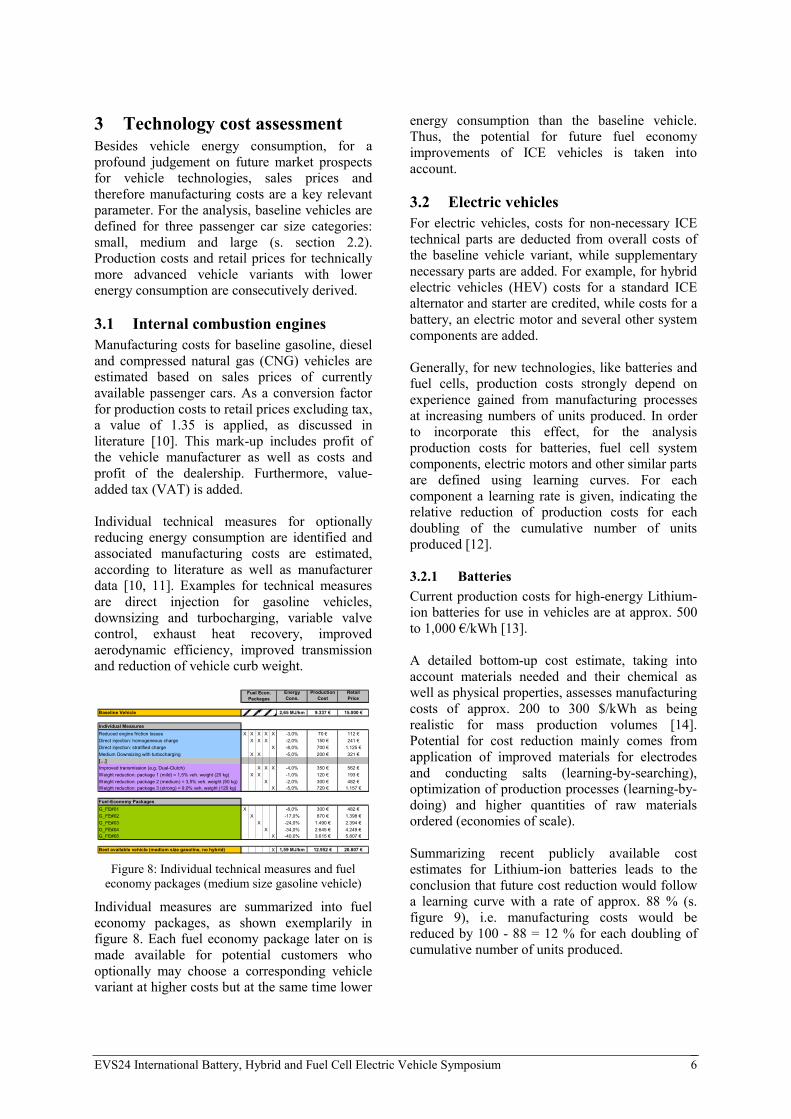
Individual MeasuresReduced engine friction losses X X X X X -3,0% 70 € 112 €Direct injection: homogeneous charge X X X -2,0% 150 € 241 €Direct injection: stratified charge X -8,0% 700 € 1.125 €Medium Downsizing with turbocharging X X -5,0% 200 € 321 €[…]Improved transmission (e.g. Dual-Clutch) X X X -4,0% 350 € 562 €Weight reduction: package 1 (mild) = 1,5% veh. weight (20 kg) X X -1,0% 120 € 193 €Weight reduction: package 2 (medium) = 3,5% veh. weight (50 kg) X -2,0% 300 € 482 €Weight reduction: package 3 (strong) = 9,0% veh. weight (120 kg) X -5,0% 720 € 1.157 €
Fuel-Economy PackagesG_FE#01 X -8,0% 300 € 482 €G_FE#02 X -17,0% 870 € 1.398 €G_FE#03 X -24,0% 1.490 € 2.394 €G_FE#04 X -34,0% 2.645 € 4.249 €G_FE#05 X -40,0% 3.615 € 5.807 €
Best available vehicle (medium size gasoline, no hybrid) X 1,59 MJ/km 12.952 € 20.807 €
Fuel Econ.Packages
Figure 8: Individual technical measures and fuel
economy packages (medium size gasoline vehicle)
Individual measures are summarized into fuel economy packages, as shown exemplarily in figure 8. Each fuel economy package later on is made available for potential customers who optionally may choose a corresponding vehicle variant at higher costs but at the same time lower
energy consumption than the baseline vehicle. Thus, the potential for future fuel economy improvements of ICE vehicles is taken into account.
3.2 Electric vehicles For electric vehicles, costs for non-necessary ICE technical parts are deducted from overall costs of the baseline vehicle variant, while supplementary necessary parts are added. For example, for hybrid electric vehicles (HEV) costs for a standard ICE alternator and starter are credited, while costs for a battery, an electric motor and several other system components are added. Generally, for new technologies, like batteries and fuel cells, production costs strongly depend on experience gained from manufacturing processes at increasing numbers of units produced. In order to incorporate this effect, for the analysis production costs for batteries, fuel cell system components, electric motors and other similar parts are defined using learning curves. For each component a learning rate is given, indicating the relative reduction of production costs for each doubling of the cumulative number of units produced [12].
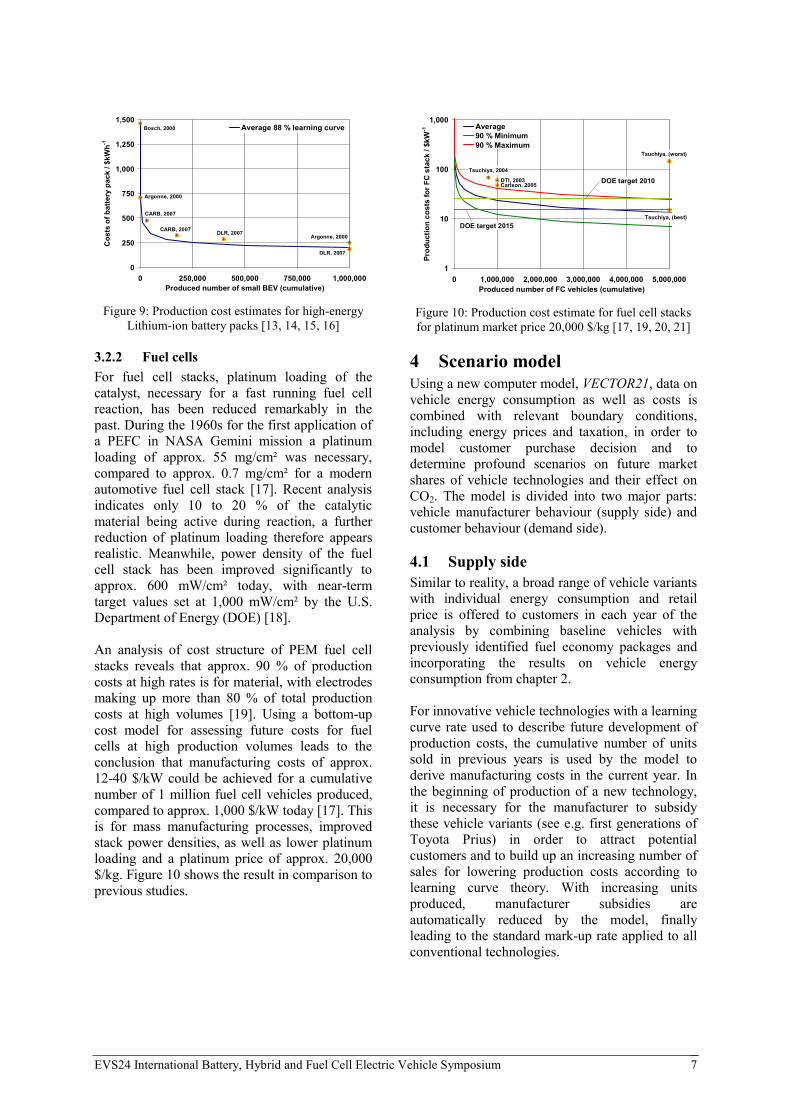
3.2.1 Batteries Current production costs for high-energy Lithium-ion batteries for use in vehicles are at approx. 500 to 1,000 €/kWh [13]. A detailed bottom-up cost estimate, taking into account materials needed and their chemical as well as physical properties, assesses manufacturing costs of approx. 200 to 300 $/kWh as being realistic for mass production volumes [14]. Potential for cost reduction mainly comes from application of improved materials for electrodes and conducting salts (learning-by-searching), optimization of production processes (learning-by-doing) and higher quantities of raw materials ordered (economies of scale). Summarizing recent publicly available cost estimates for Lithium-ion batteries leads to the conclusion that future cost reduction would follow a learning curve with a rate of approx. 88 % (s. figure 9), i.e. manufacturing costs would be reduced by 100 - 88 = 12 % for each doubling of cumulative number of units produced.
EVS24 International Battery, Hybrid and Fuel Cell Electric Vehicle Symposium 7
Argonne, 2000
CARB, 2007
CARB, 2007 DLR, 2007
DLR, 2007
Argonne, 2000
Bosch, 2008
0
250
500
750
1,000
1,250
1,500
0 250,000 500,000 750,000 1,000,000Produced number of small BEV (cumulative)
Cos
ts o
f bat
tery
pac
k / $
kWh-1
Average 88 % learning curve
Figure 9: Production cost estimates for high-energy
Lithium-ion battery packs [13, 14, 15, 16]
3.2.2 Fuel cells For fuel cell stacks, platinum loading of the catalyst, necessary for a fast running fuel cell reaction, has been reduced remarkably in the past. During the 1960s for the first application of a PEFC in NASA Gemini mission a platinum loading of approx. 55 mg/cm² was necessary, compared to approx. 0.7 mg/cm² for a modern automotive fuel cell stack [17]. Recent analysis indicates only 10 to 20 % of the catalytic material being active during reaction, a further reduction of platinum loading therefore appears realistic. Meanwhile, power density of the fuel cell stack has been improved significantly to approx. 600 mW/cm² today, with near-term target values set at 1,000 mW/cm² by the U.S. Department of Energy (DOE) [18]. An analysis of cost structure of PEM fuel cell stacks reveals that approx. 90 % of production costs at high rates is for material, with electrodes making up more than 80 % of total production costs at high volumes [19]. Using a bottom-up cost model for assessing future costs for fuel cells at high production volumes leads to the conclusion that manufacturing costs of approx. 12-40 $/kW could be achieved for a cumulative number of 1 million fuel cell vehicles produced, compared to approx. 1,000 $/kW today [17]. This is for mass manufacturing processes, improved stack power densities, as well as lower platinum loading and a platinum price of approx. 20,000 $/kg. Figure 10 shows the result in comparison to previous studies.
Carlson, 2005
Tsuchiya, 2004
Tsuchiya, (best)
Tsuchiya, (worst)
DTI, 2003
1
10
100
1,000
0 1,000,000 2,000,000 3,000,000 4,000,000 5,000,000Produced number of FC vehicles (cumulative)
Prod
uctio
n co
sts
for F
C s
tack
/ $k
W-1 Average
90 % Minimum90 % Maximum
DOE target 2010
DOE target 2015
Figure 10: Production cost estimate for fuel cell stacks for platinum market price 20,000 $/kg [17, 19, 20, 21]
4 Scenario model Using a new computer model, VECTOR21, data on vehicle energy consumption as well as costs is combined with relevant boundary conditions, including energy prices and taxation, in order to model customer purchase decision and to determine profound scenarios on future market shares of vehicle technologies and their effect on CO2. The model is divided into two major parts: vehicle manufacturer behaviour (supply side) and customer behaviour (demand side).
4.1 Supply side Similar to reality, a broad range of vehicle variants with individual energy consumption and retail price is offered to customers in each year of the analysis by combining baseline vehicles with previously identified fuel economy packages and incorporating the results on vehicle energy consumption from chapter 2. For innovative vehicle technologies with a learning curve rate used to describe future development of production costs, the cumulative number of units sold in previous years is used by the model to derive manufacturing costs in the current year. In the beginning of production of a new technology, it is necessary for the manufacturer to subsidy these vehicle variants (see e.g. first generations of Toyota Prius) in order to attract potential customers and to build up an increasing number of sales for lowering production costs according to learning curve theory. With increasing units produced, manufacturer subsidies are automatically reduced by the model, finally leading to the standard mark-up rate applied to all conventional technologies.
EVS24 International Battery, Hybrid and Fuel Cell Electric Vehicle Symposium 8
For modeling the supply side for fuel and electricity, sales prices may be directly predefined by the user or alternatively are calculated according to crude oil price development, using calculation factors previously derived from an analysis of historical correlations of crude oil and fuel prices. For each fuel type, as well as for hydrogen and electricity, it is possible to define a separate fuel tax and VAT. Similarly, raw material price developments may also be taken into account. E.g. it is possible to connect platinum price with the overall price for a fuel cell stack in order to achieve a more dynamic and realistic modeling. For vehicle technologies which require installation of a novel infrastructure for vehicle refuelling and maintenance services, the investment and time necessary is reflected by restricting the technology to more innovative and therefore less demanding customer types at first. Following a time delay of approx. 5 years, the respectively next adopter group is allowed to purchase the affected vehicle variants, assuming that infrastructure density would be sufficient by then [22].
4.2 Demand side Research indicates that vehicle purchase decision involves a high cognitive effort with vehicle size, safety and price ranking at top priority of most important criteria to customers. Environmental issues are also often considered important, however at almost no willingness to pay an additional charge [23]. Therefore, for modeling customer purchase decision, a three-step approach is implemented: • Step 1: Reduce the number of available
vehicle variants by choosing a size category and filtering for general compulsory requirements.
• Step 2: Within remaining variants choose the ones with lowest total cost of ownership (TCO).
• Step 3: Finally, choose the vehicle variant with lowest WTW CO2 emissions.
Step 1 is based on the assumption that customers generally select an appropriate vehicle size category based on their everyday needs, as well as a vehicle variant which satisfies basic requirements, e.g. regarding a certain minimum driving range. Nevertheless, it is evident that this
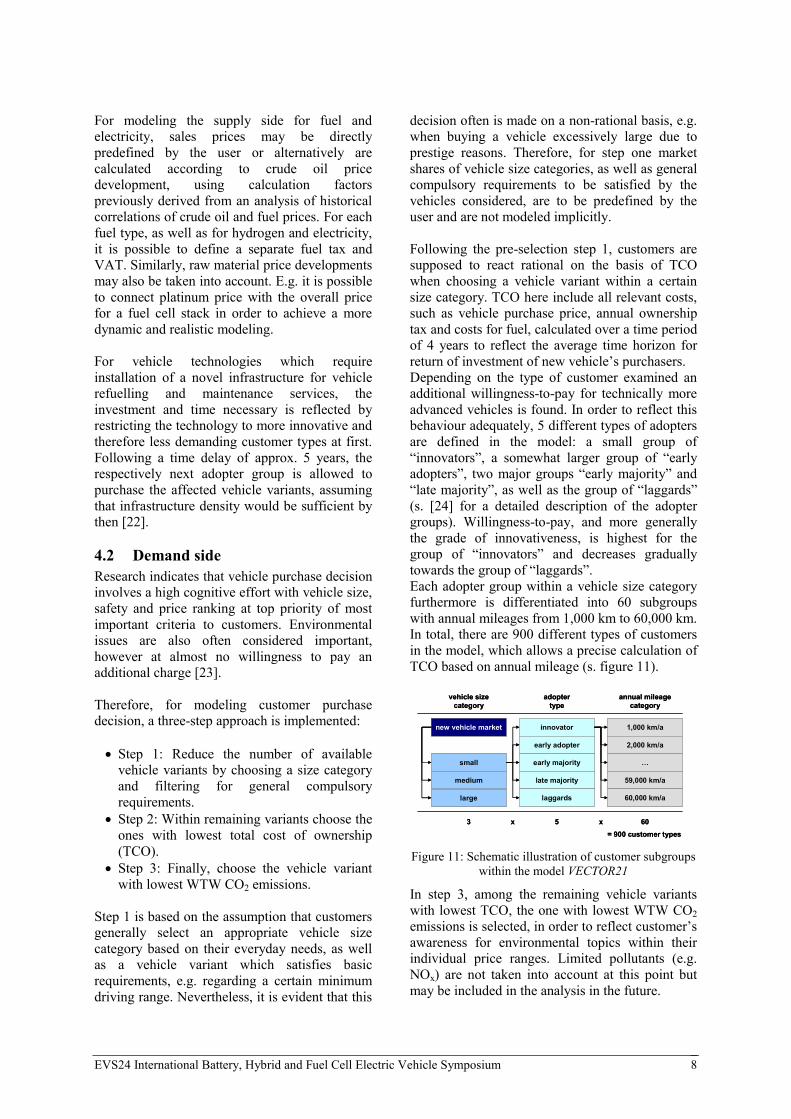
decision often is made on a non-rational basis, e.g. when buying a vehicle excessively large due to prestige reasons. Therefore, for step one market shares of vehicle size categories, as well as general compulsory requirements to be satisfied by the vehicles considered, are to be predefined by the user and are not modeled implicitly. Following the pre-selection step 1, customers are supposed to react rational on the basis of TCO when choosing a vehicle variant within a certain size category. TCO here include all relevant costs, such as vehicle purchase price, annual ownership tax and costs for fuel, calculated over a time period of 4 years to reflect the average time horizon for return of investment of new vehicle’s purchasers. Depending on the type of customer examined an additional willingness-to-pay for technically more advanced vehicles is found. In order to reflect this behaviour adequately, 5 different types of adopters are defined in the model: a small group of “innovators”, a somewhat larger group of “early adopters”, two major groups “early majority” and “late majority”, as well as the group of “laggards” (s. [24] for a detailed description of the adopter groups). Willingness-to-pay, and more generally the grade of innovativeness, is highest for the group of “innovators” and decreases gradually towards the group of “laggards”. Each adopter group within a vehicle size category furthermore is differentiated into 60 subgroups with annual mileages from 1,000 km to 60,000 km. In total, there are 900 different types of customers in the model, which allows a precise calculation of TCO based on annual mileage (s. figure 11).
new vehicle market innovator
small
medium
large
early adopter
early majority
late majority
laggards
1,000 km/a
2,000 km/a
…
59,000 km/a
60,000 km/a
vehicle size category
adoptertype
annual mileagecategory
= 900 customer types5 603 x x
new vehicle market innovator
small
medium
large
early adopter
early majority
late majority
laggards
1,000 km/a
2,000 km/a
…
59,000 km/a
60,000 km/a
vehicle size category
adoptertype
annual mileagecategory
= 900 customer types5 603 x x
Figure 11: Schematic illustration of customer subgroups
within the model VECTOR21
In step 3, among the remaining vehicle variants with lowest TCO, the one with lowest WTW CO2 emissions is selected, in order to reflect customer’s awareness for environmental topics within their individual price ranges. Limited pollutants (e.g. NOx) are not taken into account at this point but may be included in the analysis in the future.
EVS24 International Battery, Hybrid and Fuel Cell Electric Vehicle Symposium 9
Table 6: Summary of scenario assumptions
scenario 1 scenario 2
2009 2030 2009 2030 crude oil price 54 [€/bbl] 65 [€/bbl] 54 [€/bbl] 65 [€/bbl] proportion of bio-fuels 0-8 % 15 % 0-8 % 25 % electricity – CO2 emission 600 [g/kWh] 550 [g/kWh] 21 [g/kWh] 20 [g/kWh] electricity – consumer price 0.18 [€/kWh] 0.35 [€/kWh] 0.21 [€/kWh] 0.37 [€/kWh] hydrogen – source natural gas electrolysis electrolysis hydrogen – CO2 emission 350 [g/kWh] 650 [g/kWh] 25 [g/kWh] 24 [g/kWh] hydrogen – consumer price 0.13 [€/kWh] 0.35 [€/kWh] 0.21 [€/kWh] 0.37 [€/kWh] CO2 – new vehicle fleet target --- 113 [g/km] --- 76 [g/km] CO2 – penalty for exceeding --- 95 [€/(g/km)] --- 120 [€/(g/km)] market share small / medium / large 25 / 55 / 20 % 30 / 45 / 25 % 25 / 55 / 20 % 30 / 45 / 25 %
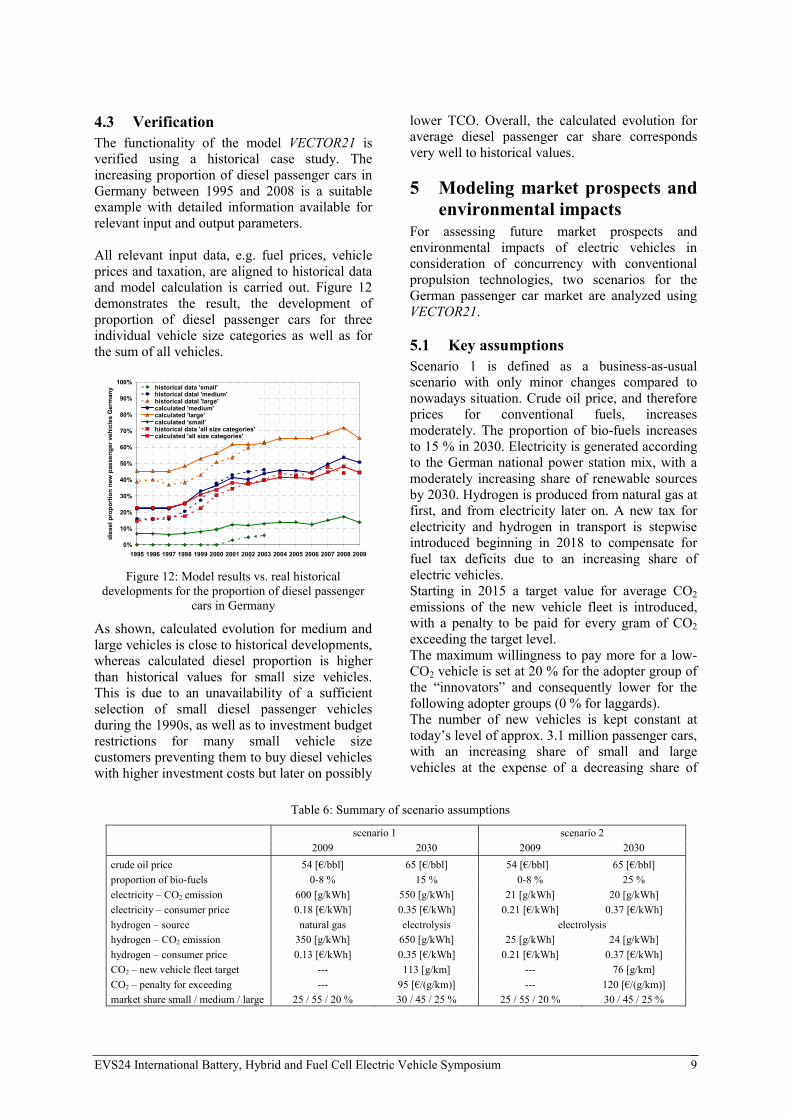
4.3 Verification The functionality of the model VECTOR21 is verified using a historical case study. The increasing proportion of diesel passenger cars in Germany between 1995 and 2008 is a suitable example with detailed information available for relevant input and output parameters. All relevant input data, e.g. fuel prices, vehicle prices and taxation, are aligned to historical data and model calculation is carried out. Figure 12 demonstrates the result, the development of proportion of diesel passenger cars for three individual vehicle size categories as well as for the sum of all vehicles.
0%
10%
20%
30%
40%
50%
60%
70%
80%
90%
100%
1995 1996 1997 1998 1999 2000 2001 2002 2003 2004 2005 2006 2007 2008 2009
dies
el p
ropo
rtio
n ne
w p
asse
nger
veh
icle
s G
erm
any historical data 'small'
historical datal 'medium'historical datal 'large'calculated 'medium'calculated 'large'calculated 'small'historical data 'all size categories'calculated 'all size categories'
Figure 12: Model results vs. real historical
developments for the proportion of diesel passenger cars in Germany
As shown, calculated evolution for medium and large vehicles is close to historical developments, whereas calculated diesel proportion is higher than historical values for small size vehicles. This is due to an unavailability of a sufficient selection of small diesel passenger vehicles during the 1990s, as well as to investment budget restrictions for many small vehicle size customers preventing them to buy diesel vehicles with higher investment costs but later on possibly
lower TCO. Overall, the calculated evolution for average diesel passenger car share corresponds very well to historical values.
5 Modeling market prospects and environmental impacts
For assessing future market prospects and environmental impacts of electric vehicles in consideration of concurrency with conventional propulsion technologies, two scenarios for the German passenger car market are analyzed using VECTOR21.
5.1 Key assumptions Scenario 1 is defined as a business-as-usual scenario with only minor changes compared to nowadays situation. Crude oil price, and therefore prices for conventional fuels, increases moderately. The proportion of bio-fuels increases to 15 % in 2030. Electricity is generated according to the German national power station mix, with a moderately increasing share of renewable sources by 2030. Hydrogen is produced from natural gas at first, and from electricity later on. A new tax for electricity and hydrogen in transport is stepwise introduced beginning in 2018 to compensate for fuel tax deficits due to an increasing share of electric vehicles. Starting in 2015 a target value for average CO2 emissions of the new vehicle fleet is introduced, with a penalty to be paid for every gram of CO2 exceeding the target level. The maximum willingness to pay more for a low-CO2 vehicle is set at 20 % for the adopter group of the “innovators” and consequently lower for the following adopter groups (0 % for laggards). The number of new vehicles is kept constant at today’s level of approx. 3.1 million passenger cars, with an increasing share of small and large vehicles at the expense of a decreasing share of
EVS24 International Battery, Hybrid and Fuel Cell Electric Vehicle Symposium 10
medium size vehicles (see table 6 for a summary of assumptions). Scenario 2 is set up to reflect stronger governmental intervention in view of impending climate change. Electricity for transportation now is generated solely on the basis of renewable sources, at higher prices than in scenario 1. Hydrogen is produced using electricity, accounting for efficiency loss due to electrolysis process and distribution. The price for hydrogen is assumed to be similar to electricity, due to non-applicable grid utilization charges. The proportion of bio-fuels is higher then in scenario 1 and the new vehicle CO2 emission target values and penalty levels are stricter. (s. table 6).
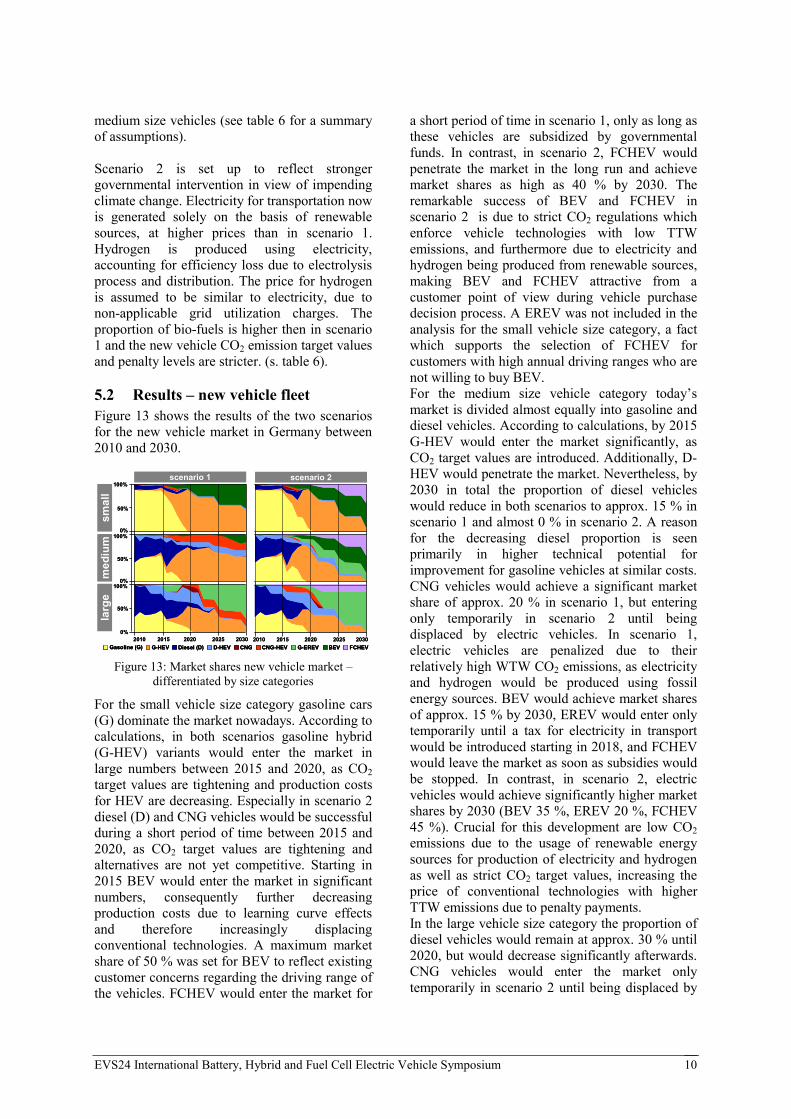
5.2 Results – new vehicle fleet Figure 13 shows the results of the two scenarios for the new vehicle market in Germany between 2010 and 2030.
20152010 2020 2025 2030
50%
100%
0%
50%
100%
0%
50%
100%
0%20152010 2020 2025 2030
larg
em
ediu
msm
all
scenario 1 scenario 2
Gasoline (G) Diesel (D) CNGG-HEV D-HEV CNG-HEV BEV FCHEVG-EREV20152010 2020 2025 2030
50%
100%
0%
50%
100%
0%
50%
100%
0%20152010 2020 2025 2030
larg
em
ediu
msm
all
scenario 1 scenario 2
Gasoline (G)Gasoline (G) Diesel (D)Diesel (D) CNGCNGG-HEVG-HEV D-HEVD-HEV CNG-HEVCNG-HEV BEVBEV FCHEVFCHEVG-EREVG-EREV Figure 13: Market shares new vehicle market –
differentiated by size categories
For the small vehicle size category gasoline cars (G) dominate the market nowadays. According to calculations, in both scenarios gasoline hybrid (G-HEV) variants would enter the market in large numbers between 2015 and 2020, as CO2 target values are tightening and production costs for HEV are decreasing. Especially in scenario 2 diesel (D) and CNG vehicles would be successful during a short period of time between 2015 and 2020, as CO2 target values are tightening and alternatives are not yet competitive. Starting in 2015 BEV would enter the market in significant numbers, consequently further decreasing production costs due to learning curve effects and therefore increasingly displacing conventional technologies. A maximum market share of 50 % was set for BEV to reflect existing customer concerns regarding the driving range of the vehicles. FCHEV would enter the market for
a short period of time in scenario 1, only as long as these vehicles are subsidized by governmental funds. In contrast, in scenario 2, FCHEV would penetrate the market in the long run and achieve market shares as high as 40 % by 2030. The remarkable success of BEV and FCHEV in scenario 2 is due to strict CO2 regulations which enforce vehicle technologies with low TTW emissions, and furthermore due to electricity and hydrogen being produced from renewable sources, making BEV and FCHEV attractive from a customer point of view during vehicle purchase decision process. A EREV was not included in the analysis for the small vehicle size category, a fact which supports the selection of FCHEV for customers with high annual driving ranges who are not willing to buy BEV. For the medium size vehicle category today’s market is divided almost equally into gasoline and diesel vehicles. According to calculations, by 2015 G-HEV would enter the market significantly, as CO2 target values are introduced. Additionally, D-HEV would penetrate the market. Nevertheless, by 2030 in total the proportion of diesel vehicles would reduce in both scenarios to approx. 15 % in scenario 1 and almost 0 % in scenario 2. A reason for the decreasing diesel proportion is seen primarily in higher technical potential for improvement for gasoline vehicles at similar costs. CNG vehicles would achieve a significant market share of approx. 20 % in scenario 1, but entering only temporarily in scenario 2 until being displaced by electric vehicles. In scenario 1, electric vehicles are penalized due to their relatively high WTW CO2 emissions, as electricity and hydrogen would be produced using fossil energy sources. BEV would achieve market shares of approx. 15 % by 2030, EREV would enter only temporarily until a tax for electricity in transport would be introduced starting in 2018, and FCHEV would leave the market as soon as subsidies would be stopped. In contrast, in scenario 2, electric vehicles would achieve significantly higher market shares by 2030 (BEV 35 %, EREV 20 %, FCHEV 45 %). Crucial for this development are low CO2 emissions due to the usage of renewable energy sources for production of electricity and hydrogen as well as strict CO2 target values, increasing the price of conventional technologies with higher TTW emissions due to penalty payments. In the large vehicle size category the proportion of diesel vehicles would remain at approx. 30 % until 2020, but would decrease significantly afterwards. CNG vehicles would enter the market only temporarily in scenario 2 until being displaced by
EVS24 International Battery, Hybrid and Fuel Cell Electric Vehicle Symposium 11
electric vehicles, but penetrate the market (approx. 15 %) in the long run in scenario 1. EREV would be successful in both scenarios starting in 2020, with market shares of approx. 70 % / 85 % by 2030. Similar to the small and medium vehicle size categories, FCHEV would enter the market only temporarily in scenario 1, while in scenario 2 achieving a market share of approx. 15 % by 2030. Figure 14 summarizes the results for the individual vehicle size categories. Scenario 2 is more dominated by electric vehicles and especially FCHEV, whereas the focus in scenario 1 is more on G-HEV, D-HEV and CNG-HEV.
20152010 2020 2025 2030
50%
100%
0%20152010 2020 2025 2030
scenario 1 scenario 2
Gasoline (G) Diesel (D) CNGG-HEV D-HEV CNG-HEV BEV FCHEVG-EREV20152010 2020 2025 2030
50%
100%
0%20152010 2020 2025 2030
scenario 1 scenario 2
Gasoline (G)Gasoline (G) Diesel (D)Diesel (D) CNGCNGG-HEVG-HEV D-HEVD-HEV CNG-HEVCNG-HEV BEVBEV FCHEVFCHEVG-EREVG-EREV Figure 14: Market shares new vehicle market –
sum of all size categories
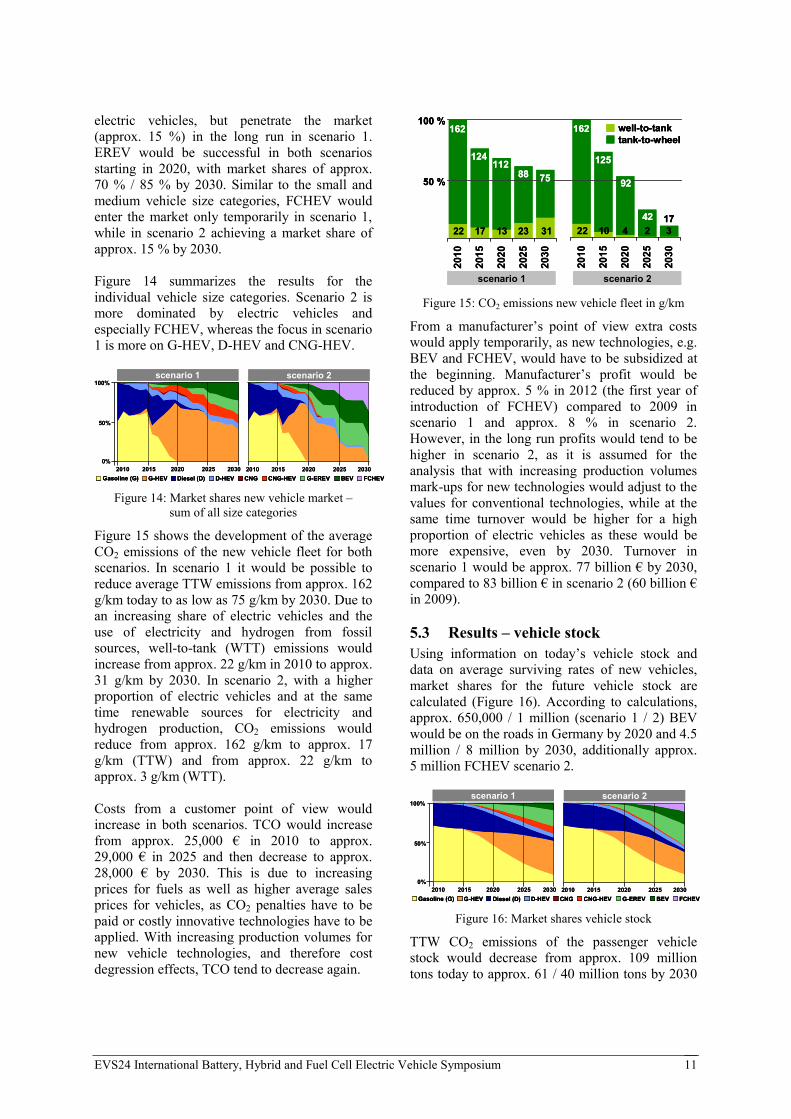
Figure 15 shows the development of the average CO2 emissions of the new vehicle fleet for both scenarios. In scenario 1 it would be possible to reduce average TTW emissions from approx. 162 g/km today to as low as 75 g/km by 2030. Due to an increasing share of electric vehicles and the use of electricity and hydrogen from fossil sources, well-to-tank (WTT) emissions would increase from approx. 22 g/km in 2010 to approx. 31 g/km by 2030. In scenario 2, with a higher proportion of electric vehicles and at the same time renewable sources for electricity and hydrogen production, CO2 emissions would reduce from approx. 162 g/km to approx. 17 g/km (TTW) and from approx. 22 g/km to approx. 3 g/km (WTT). Costs from a customer point of view would increase in both scenarios. TCO would increase from approx. 25,000 € in 2010 to approx. 29,000 € in 2025 and then decrease to approx. 28,000 € by 2030. This is due to increasing prices for fuels as well as higher average sales prices for vehicles, as CO2 penalties have to be paid or costly innovative technologies have to be applied. With increasing production volumes for new vehicle technologies, and therefore cost degression effects, TCO tend to decrease again.
2010
2015
2020
2025
2030
2010
2015
2020
2025
2030
100 %
50 %
scenario 1
well-to-tanktank-to-wheel
162
22
124
17
112
13
88
23
75
31
162
22
125
10
92
4422
173
scenario 2
2010
2015
2020
2025
2030
2010
2015
2020
2025
2030
100 %
50 %
scenario 1
well-to-tanktank-to-wheel
162
22
124
17
112
13
88
23
75
31
162
22
125
10
92
4422
173
scenario 2
100 %
50 %
scenario 1
well-to-tanktank-to-wheel
162
22
124
17
112
13
88
23
75
31
162
22
125
10
92
4422
173
scenario 2 Figure 15: CO2 emissions new vehicle fleet in g/km
From a manufacturer’s point of view extra costs would apply temporarily, as new technologies, e.g. BEV and FCHEV, would have to be subsidized at the beginning. Manufacturer’s profit would be reduced by approx. 5 % in 2012 (the first year of introduction of FCHEV) compared to 2009 in scenario 1 and approx. 8 % in scenario 2. However, in the long run profits would tend to be higher in scenario 2, as it is assumed for the analysis that with increasing production volumes mark-ups for new technologies would adjust to the values for conventional technologies, while at the same time turnover would be higher for a high proportion of electric vehicles as these would be more expensive, even by 2030. Turnover in scenario 1 would be approx. 77 billion € by 2030, compared to 83 billion € in scenario 2 (60 billion € in 2009).
5.3 Results – vehicle stock Using information on today’s vehicle stock and data on average surviving rates of new vehicles, market shares for the future vehicle stock are calculated (Figure 16). According to calculations, approx. 650,000 / 1 million (scenario 1 / 2) BEV would be on the roads in Germany by 2020 and 4.5 million / 8 million by 2030, additionally approx. 5 million FCHEV scenario 2.
20152010 2020 2025 2030
50%
100%
0%20152010 2020 2025 2030
scenario 1 scenario 2
Gasoline (G) Diesel (D) CNGG-HEV D-HEV CNG-HEV BEV FCHEVG-EREV20152010 2020 2025 2030
50%
100%
0%20152010 2020 2025 2030
scenario 1 scenario 2
Gasoline (G)Gasoline (G) Diesel (D)Diesel (D) CNGCNGG-HEVG-HEV D-HEVD-HEV CNG-HEVCNG-HEV BEVBEV FCHEVFCHEVG-EREVG-EREV Figure 16: Market shares vehicle stock
TTW CO2 emissions of the passenger vehicle stock would decrease from approx. 109 million tons today to approx. 61 / 40 million tons by 2030

EVS24 International Battery, Hybrid and Fuel Cell Electric Vehicle Symposium 12
(Figure 17). WTT emissions would decrease from approx. 19 to approx. 12 / 2 million tons.
2010
2015
2020
2025
2030
2010
2015
2020
2025
2030
100 %
50 %
scenario 1
well-to-tanktank-to-wheel
109
19
89
13
77
10
68
10
61
12
109
19
89
12
74
8
57
4
40
2
scenario 2
2010
2015
2020
2025
2030
2010
2015
2020
2025
2030
100 %
50 %
scenario 1
well-to-tanktank-to-wheel
109
19
89
13
77
10
68
10
61
12
109
19
89
12
74
8
57
4
40
2
scenario 2 Figure 17: CO2 emissions vehicle stock in million tons
Demand for conventional fuels in the passenger car sector would decrease for both scenarios. For gasoline from approx. 900 PJ today to approx. 550 / 400 PJ by 2030, for diesel from approx. 600 PJ today to approx. 150 / 100 PJ by 2030. Demand for CNG would increase from today 0.2 PJ to 120 PJ / 10 PJ by 2030, which equals approx. 4 % / 0.3 % of today’s total demand of CNG in Germany. Demand for hydrogen would increase to approx. 0.5 / 85 PJ in 2030, which equals approx. 0 % / 39 % of today’s total hydrogen demand in Germany. Demand for electricity for passenger vehicles would increase to approx. 65 PJ / 95 PJ in 2030. The total production of electricity from renewable sources in Germany in 2006 was at approx. 190 PJ.
6 Conclusion The analysis of various vehicle concepts using the Modelica AlternativeVehicles library clearly demonstrated the predominance of electric vehicles regarding the overall degree of efficiency, especially in an urban environment. Nevertheless, production costs at today’s low volumes are markedly high, with significant reduction potentials for the future, as bottom-up cost models show. Calculation of two scenarios, each with a different set of input variables, using the VECTOR21 model, led to the conclusion that remarkable changes of the passenger vehicle fleet appear feasible for the time horizon up to the year 2030. Assuming a moderately increasing crude oil price, electricity and hydrogen from fossil energy sources as well as an average CO2 target value of 113 g/km for the German new vehicle fleet in 2030, electric vehicles (BEV and EREV) could achieve market shares of approx. 40 % by 2030 in scenario 1. Under different
constraints, with a stricter CO2 target value of 75 g/km and higher penalty fines as well as electricity and hydrogen being produced from renewable sources, electric vehicles could achieve market shares as high as 95 %, including a 35 % proportion of FCHEV in scenario 2. Regarding CO2 emissions both scenarios indicate significant potential for reduction. WTW emissions of the vehicle stock could decrease by approx. 40 % in scenario 1 by 2030 and even by approx. 65 % in scenario 2. For permanently limiting CO2 emissions from transport at low values in the future, a combination of electric vehicles as well as electricity and hydrogen from renewable energy sources therefore appears promising.
Acknowledgments Our thanks go to the German Federal Ministry of Education and Research who has funded the development of the Modelica Library AlternativeVehicles within the ITEA-Project EUROSYSLIB. Without their strong support, this project would not have been happened.
References [1] Treffinger, P., Baur, M., Braig, T., Dittus, H.,
Ungethuem, J. (2007). Modeling of Alternative Propulsion Concepts Applying Modular Object-Oriented Simulation Techniques. 23. International Electric Vehicle Symposium and Exposition (EVS), 2-5/12/2007, AnaheimJ.J. Romm,
[2] Schweiger, Christian; Dempsey, Mike; Otter, Martin (2005): The PowerTrain Library: New Concepts and New Fields of Application. In: Schmitz, Gerhard [Hrsg.]: Proceedings of the 4th International Modelica Conference, S. 457 - 466, 4th International Modelica Conference, Hamburg, 2005-03-07/08
[3] Elmqvist, H. A Structured Model Language for Large Continuous Systems. Lund Institute of Technology, Sweden, Ph.D. Thesis, 1978.
[4] Tiller, M. Introduction to Physical Modeling with Modelica, Boston : Kluwer Academic Publ., 2001
[5] Buller, S.: Impedance-Based Simulation Models for Energy Storage Devices in Advanced Automotive Power Systems, RWTH Aachen, Ph.D. Thesis, 2002
[6] Grotendorst, J.; Birke, P.; Keller, M.; Schiemann, M.: Lithium-Ion Battery Systems for Hybrids- and Battery Electric Vehicles,

EVS24 International Battery, Hybrid and Fuel Cell Electric Vehicle Symposium 13
Congress of the German Association of Engineers (VDI), 6-7/11/2008, Dresden
[7] http://www.nucellsys.com accessed 2009-04-06
[8] v. Helmolt, R.; Eberle, U: Fuel cell vehicles: Status 2007, Journal of Power Sources 165 (2007) 833–843
[9] André, M.: Real-world driving cycles for measuring cars pollutant emissions. Part A: The ARTEMIS European driving cycle, Institut National de Recherche sur les Transports et leur Securite (INRETS), 2004
[10] Smokers, R., R. Vermeulen, et al. (2006). Review and analysis of the reduction potential and costs of technological and other measures to reduce CO2-emissions from passenger cars. TNO, IEEP, LAT.
[11] Edwards, R., J.-F. Larivé, et al. (2007). Well-to-Wheels analysis of future automotive fuels and power-trains in the European context – Version 2c. CONCAWE, EUCAR, JRC.
[12] Ghemawat, P. (1985). Building strategy on the experience curve. Harvard Business Review, March-April, 143-149.
[13] VDI (2008). “Stromer“ fahren noch 20 Jahre in der Nische. VDI Nachrichten, 32, 08.08.2008, p. 14.
[14] Gauss, I. (2007). Diffusion von Produktinnovationen im Lithium-Ionen Batterie Markt. Diploma thesis. Westfaelische Wilhelms-Universitaet / DLR Institute of Vehicle Concepts, Muenster / Stuttgart.
[15] Gaines, L., R. Cuenca (2000). Costs of Lithium-Ion Batteries for Vehicles. Argonne National Laboratory, Argonne.
[16] Kalhammer, F.E., B.M. Kopf, et al. (2007). Status and Prospects for Zero Emissions Vehicle Technology – Report of the ARB Independent Expert Panel 2007. State of California Air Resources Board (CARB), Sacramento.
[17] Mock, P. and S.A. Schmid (2009). Fuel cells for automotive power-trains – A techno-economic assessment. Journal of Power Sources, in press.
[18] U.S. Department of Energy, Hydrogen, Fuel Cells & Infrastructure Technologies Pro-gram-Multi-Year Research, Development and Demonstration Plan – Planned Program Activities 2005–2015. DOE, 2007.
[19] E.J. Carlson. Cost Analysis of PEM Fuel Cell Systems for Transportation. National
Renewable Energy Laboratory (NREL), Cambridge, MA, 2005.
[20] Tsuchiya, H., O. Kobayashi (2004). Mass production cost of PEM fuel cell by learning curve. International Journal of Hydrogen Energy, 29, 985-990.
[21] Directed Technologies Inc. (DTI). DFMA Cost Estimate of Fuel-Cell/Reformer Systems at Low/Medium/High Production Rates – DOE FY 2003 Progress Report, 2003.
[22] Santini, D.J., A.D. Vyas (2005). Suggestions for a New Vehicle Choice Model Simulating Advanced Vehicles Introduction Decisions (AVID). Center for Transportation Research, Argonne National Laboratory, Argonne.
[23] Haan, de P. (2007). Erforschung des Autokaufverhaltens hinsichtlich Treibstoff-einsparung und Technologieakzeptanz. Berichte zum Schweizer Autokaufverhalten Nr. 2. ETH, Zuerich.
[24] Rogers, E.M. (1995). Diffusions of Innovations. The Free Press, New York.
Authors
Peter Mock received a degree in chemistry and economics (Dipl. chem. oec.) from the University of Ulm in 2004. Since 2006 he is working on his PhD thesis on assessing future costs, market shares and emissions of passenger vehicle technologies at the department of Innovative Vehicle Systems and Technology Analysis at DLR.
Dirk Hülsebusch, received a degree in electrical engineering (Dipl.-Ing. FH) in 2005 from the Bonn-Rhein-Sieg University and in 2007 a degree in mechatronics (M.Sc.) from Reutlingen University. Since 2007 he is scientist at the department Alternative Powertrains and working on model based development of alternative power trains.
Jörg Ungethüm received a degree in mechanical engineering (Dipl.-Ing.) from Technical University Hamburg-Harburg, 1997. In DLR since 2003, Jörg Ungethüm is scientist at the department of Alternative Powertrains. His focus is on multi-physics vehicle system simulation with a special interest in the fuel cell system simulation.

EVS24 International Battery, Hybrid and Fuel Cell Electric Vehicle Symposium 14
Stephan A. Schmid received a degree in mechanical engineering (Dipl.-Ing.) from the Technical University of Karlsruhe in 1996. He received a doctorate degree in engineering (Dr.-Ing.) from the University of Stuttgart in 2005. Since 2003 he is member of the scientific staff at DLR, where he is head of the department Innovative Vehicle Systems and Technology Analysis.