Electric Bus Operations...experiences, costs, and benefits of electric bus operations in Santa...
74
1. Report No. SWUTC/9516OO57-1 I 2. Government Accession No. 4. Title and Subtitle Electric Bus Operations: A Feasibility Study 7. Author(s) Thomas Michael Fowler, Mark A. Euritt and C. Michael Walton 9. Perfonning Organization Name and Address Center for Transportation Research University of Texas at Austin 3208 Red River, Suite 200 Austin, Texas 78705-2650 12. Sponsoring Agency Name and Address Southwest Region University Transportation Center Texas Transportation Institute The Texas A&M University System College Station, Texas 77843-3135 15. Supplementary Notes CENTER 1 3. Recipient' 5. Report Date MayJ995 6. Perfonning Organization Code 8. Perfonning Organization Report No. Research Report 60057-1 10. Work Unit No. (TRAIS) 11. Contract or Grant No. 0079 13. Type of Report and Period Covered 14. Sponsoring Agency Code SUpported by a grant from the Office of the Governor of the State of Texas, Energy Office 16. Abstract LIBRARY This study determines the technical and economic feasibility of electric bus operations. A review of electric vehicle technology with an emphasis on battery-powered electric vehicles is performed, and the availability and use of electric buses are identified. A methodology is presented for selection of bus routes most suitable for electric bus operations using the Capital Metropolitan Transportation Authority as a case study. Costs and benefits of electric bus operations are identified an compared to the costs and benefits of compressed natural gas and diesel bus operations. Finally, recommendations are made regarding the feasibility of electric bus operations. 17. Key Words 18. Distribution Statement Battery-Powered Bus, Electric Bus, Electric Vehicle, Alternative Fueled Vehicle, Bus Transit, Zero Emission Vehicle, Alternative Transportation Fuels No Restrictions. This document is available to the public through NTIS: 19. Security Classif.(ofthia report) Unclassified Form DOT F 1700.7 (8-72) National Technical Infonnation Service 5285 Port Royal Road Springfield, Virginia 22161 1 20. Security Classif.(ofthia page) Unclassified Reproduction of completed page authorized 21. No. of Pages 74 I 22. Price
Transcript of Electric Bus Operations...experiences, costs, and benefits of electric bus operations in Santa...

1. Report No.
SWUTC/9516OO57-1 I 2. Government Accession No.
4. Title and Subtitle
Electric Bus Operations: A Feasibility Study
7. Author(s)
Thomas Michael Fowler, Mark A. Euritt and C. Michael Walton
9. Perfonning Organization Name and Address
Center for Transportation Research University of Texas at Austin 3208 Red River, Suite 200 Austin, Texas 78705-2650
12. Sponsoring Agency Name and Address
Southwest Region University Transportation Center Texas Transportation Institute The Texas A&M University System College Station, Texas 77843-3135
15. Supplementary Notes
CENTER
1 3. Recipient'
5. Report Date
MayJ995 6. Perfonning Organization Code
8. Perfonning Organization Report No.
Research Report 60057-1 10. Work Unit No. (TRAIS)
11. Contract or Grant No.
0079
13. Type of Report and Period Covered
14. Sponsoring Agency Code
SUpported by a grant from the Office of the Governor of the State of Texas, Energy Office 16. Abstract
LIBRARY
This study determines the technical and economic feasibility of electric bus operations. A review of electric vehicle technology with an emphasis on battery-powered electric vehicles is performed, and the availability and use of electric buses are identified. A methodology is presented for selection of bus routes most suitable for electric bus operations using the Capital Metropolitan Transportation Authority as a case study. Costs and benefits of electric bus operations are identified an compared to the costs and benefits of compressed natural gas and diesel bus operations. Finally, recommendations are made regarding the feasibility of electric bus operations.
17. Key Words 18. Distribution Statement
Battery-Powered Bus, Electric Bus, Electric Vehicle, Alternative Fueled Vehicle, Bus Transit, Zero Emission Vehicle, Alternative Transportation Fuels
No Restrictions. This document is available to the public through NTIS:
19. Security Classif.(ofthia report)
Unclassified Form DOT F 1700.7 (8-72)
National Technical Infonnation Service 5285 Port Royal Road Springfield, Virginia 22161
120. Security Classif.(ofthia page)
Unclassified Reproduction of completed page authorized
21. No. of Pages
74 I 22. Price

ELECTRIC BUS OPERATIONS: A FEASIBILITY STUDY
by
Thomas Michael Fowler
Mark A. Euritt
and
C. Michael Walton
Research Report SWUTC/95/60057-1
Southwest Region University Transportation Center
Center for Transportation Research
The University of Texas at Austin
Austin, Texas 78705-2650
May 1995

EXECUTIVE SUMMARY
The battery-powered electric bus is a viable alternative for metropolitan transit authorities.
Based on a case study of the Austin Capital Metropolitan Transportation Authority (Capital Metro),
electric buses can be utilized for select routes. Feasibility criteria including range, maximum
speed, ridership, and economics were used to evaluate the electric bus, natural gas bus, and
diesel bus. Based on operational criteria, Le. range, speed, and ridership, the electric bus is
ideally suited for the Congress Capitol 'Dillo route in the central business district. Moreover,
based on life-cycle economic costs, including the cost of pollutants, the electric bus is competitive
with current diesel technology. The evaluation of electric buses in this study is based on
commercially available technology, and not near-term or long-term technology. As advances
continue to materialize in the electric vehicle industry, the cost of electric buses will decrease, and
the operational attributes will improve. Given the growing concern over air quality and energy
sustainability, the electric bus is an attractive alternative to current diesel technology.
ii

ABSTRACT
This study determines the technical and economic feasibility of electric bus operations. A review of electric vehicle technology with an emphasis on batterypowered electric vehicles is performed, and the availability and use of electric buses are identified. A methodology is presented for selection of bus routes most suitable for electric bus operations using the Capital Metropolitan Transportation Authority as a case study. Costs and benefits of electric bus operations are identified an compared to the costs and benefits of compressed natural gas and diesel bus operations. Finally, recommendations are made regarding the feasibility of electric bus operations.
ACKNOWLEDGEMENTS
This publication was developed as part of the University Transportation Centers Program which is funded 50% in oil overcharge funds from the Stripper Well settlement as provided by the Texas State Energy Conservation Office and approved by the U.S. Department of Energy. Mention of trade names or commercial products does not constitute endorsement or recommendation for use.
iii

TABLE OF CONTENTS
CHAPTER 1. INTRODUCTION ................................................................................................. 1
OBJECTIVES ................................................................................................................ 2
OVERVIEW ................................................................................................................... 3
CHAPTER 2. TECHNOLOGy ................................................................................................... 5
BATTERY-POWERED ELECTRIC VEHICLES ............................................................. 5
HYBRID ELECTRIC VEHiCLES .................................................................................... 9
FUEL CELL-POWERED ELECTRIC VEHICLES .......................................................... 10
ROADWAY ELECTRIFICATION SySTEMS ................................................................. 11
ENERGY USE ............................................................................................................... 12
CHAPTER 3. AVAILABILITY AND USE OF ELECTRIC BUSES .............................................. 15
ELECTRIC BUS MANUFACTURERS ........................................................................... 15
PERFORMANCE CHARACTERiSTiCS ........................................................................ 16
AGENCIES OPERATING ELECTRIC BUSES .............................................................. 18
FUNDING ...................................................................................................................... 21
CHAPTER 4. APPLICATIONS FOR ELECTRIC BUSES .......................................................... 23
CAPITAL METRO ROUTE SERViCES ......................................................................... 23
CRITERIA FOR ROUTE SELECTION .......................................................................... 24
RECOMMENDED ROUTES .......................................................................................... 26
CHAPTER 5. COSTS AND BENEFITS OF ELECTRIC BUSES ............................................... 39
CAPITAL COSTS .......................................................................................................... 39
FUEL COSTS ................................................................................................................ 40
MAINTENANCE COSTS ............................................................................................... 41
EMISSIONS ................................................................................................................... 43
ANALYSIS ........................................................... : ......................................................... 50
iv
CHAPTER 6. CONCLUSION .................................................................................................... 55
SUMMARY .................................................................................................................... 55
RECOMMENDATIONS ................................................................................................. 55
APPENDIX A .... .......................................................................................................................... 57
REFERENCES ........................................................................................................................... 63
v

LIST OF FIGURES
Figure 4-1 Congress Capitol 'Oillo .............................................................................................. 33
Figure 4-2 Convention Center/UT'Oillo ....................................................................................... 34
Figure 4-3 ACC/Lavaca 'Oillo ................................................................................ , .................... 35
Figure 4-4 Forty Acres Shuttle Route ......................................................................................... 36
Figure 4-5 West Campus Shuttle Route ..................................................................................... 37
LIST OF TABLES
Table 2-1 Battery Technology .................................................................................................... 7
Table 2-2 Comparison of Energy Use ........................................................................................ 14
Table 3-1 1993 Electric Bus Companies .................................................................................... 16
Table 3-2 Electric Bus Cost, Performance, and Specifications .................................................. 18
Table 3-3 1993 Agencies Operating Electric Buses .................................................................. 19
Table 4-1 Route Matrix-Metro Routes ........................................................................................ 28
Table 4-1 Route Matrix-Metro Routes (cont'd) ........................................................................... 29
Table 4-2 Route Matrix-Flyer Routes ......................................................................................... 30
Table 4-3 Route Matrix-expresS/Park & Ride Routes ................................................................ 30
Table 4-4 Route Matrix-IOillo Routes .......................................................................................... 30
Table 4-5 Route Matrix-UT Shuttle Routes ................................................................................ 31
Table 4-6 Routes Considered for Implementation ..................................................................... 32
Table 5-1 Capital Costs of Buses ............................................................................................... 40
Table 5-2 Fuel Costs ........................ " ........................................................................................ 42
Table 5-3 Maintenance Costs .................................................................................................... 43
Table 5-4 Pollutant Costs Estimates By Study (¢/Gram} ............................................................ 47
Table 5-5 Ppllutant Costs (¢/gram), January 1993 Dollars ......................................................... 48
vi

Table 5-6 Bus Emissions In Grams Per Mile (GlKm) ................................................................ 49
Table 5-7 Pollutant Damage Costs per km (mi) of Operation ..................................................... 51
Table A·1 Metro Routes ............................................................................................................. 60
Table A-1 Metro Routes (cont'd) ................................................................................................. 61
Table A-1 Metro Routes (cont'd) ................................................................................................. 62
Table A-2 Flyer Routes ............................................................................................................... 62
Table A-3 Express/Park & Ride Routes ..................................................................................... 62
Table A-4 'Oillo Routes ............................................................................................................... 63
Table A-5 UT Shuttle Routes ...................................................................................................... 63
vii

CHAPTER 1. INTRODUCTION
Increasing air pollution and dependence on foreign oil in the United States has led to a
growing interest in alternative fuel vehicles (AFVs). The transportation sector's significant
contribution to these problems has prompted federal and state regulations which now require
large public fleets to convert to AFVs. In the transit industry, a variety of AFVs are available
which meet federal and state mandates. This study focuses on electric buses, one such
alternative fuel, and attempts to determine the technical and economic feasibility of electric bus
operations using Austin's Capital Metropolitan Transportation Authority (Capital Metro) as a case
study.
DEFINITION
Capital Metro is currently operating diesel and compressed natural gas (CNG) fueled
buses in their route services. The enactment of Senate Bill 740 in 1991 by the Texas legislature
requires that vehicle purchases by public transit authorities be AFVs and that their fleet consist of
at least 30 percent or more AFVs by September 1994, 50 percent by 1996, and if deemed
effective in lowering emissions 90 percent by 1998. An AFV is defined as a motor vehicle
capable of operating on natural gas, propane, methanol, ethanol, or electricity. In addition to the
legislature's requirement, Austin's growing air pollution levels put the city in risk of exceeding
National Ambient Air Quality Standards (NAAQS). As a public agency, Capital Metro has a
responsibility to promote activities in the best interest of the public which it serves. The use of
AFVs by transit authorities not only satisfies legal requirements, but also benefits the general
public through a reduction in vehicle emissions and a reduced dependence on imported
petroleum.
There are several types of alternative fueled buses currently available. CNG, liquefied
natural gas (LNG), propane, and electric-powered buses are all in operation throughout the
United States. While each type of alternative fueled bus is considered a low emission vehicle,
only electric buses offer the advantage of zero tailpipe emissions.
Unfortunately, there are several technical and economic disadvantages of electric bus
operations. Electric buses have a limited range, require several hours to recharge their batteries,
and have a substantially higher capital cost than other types of alternative fueled buses. Before
electric buses can be considered as a feasible alternative fueled vehicle for service in Capital
Metro, the technical capabilities and costs of electric buses must be determined.
1

OBJECTIVES
The primary objective of this study is to evaluate the technical and economic feasibility of
electric bus operations for Capital Metro. To meet this objective, several tasks are defined.
First, a review of electric vehicle technology is completed to determine the current state of
technology. Electric vehicles were first developed in the late 1800s, but their popularity among
the public has never been very high. This is primarily due to their limited range and performance
characteristics in comparison to gasoline- or diesel-powered vehicles. Due to the increasing
concerns over air pollution and energy security, there is renewed interest in electric vehicles. A
great deal of research and development in the electric vehicle field has occurred in the last
decade, and every effort was made to document the most recent advances in this study.
Manufacturers and users of electric buses are identified. Interest in electric buses has
led to the creation of several companies dedicated primarily to the manufacturing of electric
buses. Several brief case studies of experiences with electric bus operations are presented.
Capital Metro route services are described and a methodology is presented for selection
of routes most suitable for electric bus operations. An initial evaluation of all routes serviced by
Capital Metro identified five routes suitable for electric bus operations. From these five routes, an
optimal route for implementation of electric buses is selected.
Finally, costs and benefits of electric buses are identified. Appropriate costs include
capital costs, fuel costs, and maintenan.ce costs. Total fuel-cycle emission reductions are
calculated with associated values placed on individual pollutants to determine the social benefit of
emissions reduction. The costs and emissions of battery-powered electric buses are compared
with diesel-powered and CNG-powered buses currently in operation to determine the benefits of
electric bus operations for Capital Metro.
BACKGROUND
The use of battery-powered electric buses in transit operations is relatively new. The
Santa Barbara Metropolitan Transit District (MTD) was the first major transit agency to begin
operation of electric buses on a fixed route, introducing their first bus in January 1991. MTD has
yet to compile the data collected from their experiences into a comprehensive study of the
feasibility of electric bus operations, describing their decision to introduce electric buses into
service partially as a "leap of faith" (Doerschlag, 1994).
Studies by Gleason (1992) and Dugan (1994) describe, to a limited extent, the
experiences, costs, and benefits of electric bus operations in Santa Barbara and Chattanooga,
respectively. A report by the California Energy Commission (1991) attempts to identify the cost
2

and availability of low emission motor vehicles and fuels (including electric vehicles), but focuses
primarily on passenger vehicles and small trucks. Much of the data and information used in this
study regarding recent technology and practical experience with electric buses was gathered
through personal communications with manufacturers and representatives of transit agencies
currently operating electric buses.
Estimates of pollutant damages due to emissions are based on studies by Small (1977),
Haugaard (1981), the Massachusetts Department of Public Utilities (19a9), and Ottinger, et. al.
(19a9). A discussion of these studies is included in Chapter 5. Total fuel-cycle emissions are
estimated based on data collected on buses and a study of total fuel-cycle emissions by Darrow
(1994).
OVERVIEW
This report consists of six chapters. Chapter 1 introduces the problem, objectives, and a
brief background. Chapter 2 reviews the current state of electric vehicle technology. Emphasis is
placed on battery-powered electric vehicles (EVs), although hybrid EV technology, fuel cell EV
technology, and roadway electrification technology are also reviewed. Chapter 3 discusses the
availability and use of battery-powered electric. buses. A discussion of federal and state
programs, and related financial incentives, promoting electric bus operations is also included.
Chapter 4 presents a methodology for selecting bus routes appropriate for electric bus operation.
Accordingly, Capital Metro routes are analyzed and recommendations are made on routes that
are most suitable for electric bus operations. Chapter 5 discusses the costs and benefits of
electric bus operations compared to Capital Metro's diesel and CNG bus operations. Costs
determined in Chapter 5 include capital costs, fuel costs, and maintenance costs. Total fuel-cycle
emissions are estimated and damage costs are determined for individual pollutants. Costs per
mile of operation for an electric-powered bus, diesel-powered bus, and CNG-powered bus are
determined based on capital costs, fuel costs, maintenance costs, and damage costs due to
emissions. This report concludes with.Chapter 6, which presents recommendations regarding the
feasibility of electric bus operations.
3

4

CHAPTER 2. TECHNOLOGY
The purpose of this chapter is to describe current electric transportation technology. Four
types of technology are considered: battery-powered electric vehicles (EVs). hybrid EVs, fuel
cell-powered EVs, and roadway electrification systems. Because the focus of this study is on
battery-powered electric buses, greatest attention is given to battery-powered EV technology. A
brief review of current research and development in hybrid EVs, fuel cell-powered EVs, and
roadway-powered EVs is also provided. This chapter concludes with a discussion of the energy
consumption of battery-powered EVs, fuel cell-powered EVs, and roadway-powered EVs.
BATTERY-POWERED ELECTRIC VEHICLES
Battery-powered EVs use a large battery pack to supply electricity to an electric motor.
Although EVs were developed before gasoline-powered vehicles, they have never been widely
used by the public, primarily because the range of EVs is limited to under 161 km (100 miles).
EV motors have proven to be durable and efficient. They do not require cooling systems
or tune-ups, and most models do not require transmissions. Brake life of an EV can be extended
due to regenerative braking systems, which use the electric motor as a generator to slow the
vehicle while retuming electrical energy to the batteries. This also extends the range of the EV.
The conventional lead acid batteries used in EVs are heavy, expensive, and take as long
as 8 hours to recharge. However, due to stricter air quality laws and policies to reduce reliance
on foreign oil, EVs are again being considered as a viable technology to replace internal
combustion engine vehicles (iCEVs). Due to the range issue and operating costs, the majority of
EV research in recent years has focused on battery technology. The following sections describe
some of the research and development that has occurred in EV technology.
Battery Technology
On January 30, 1991, Chrysler, Ford, and General Motors formed a partnership called
the United States Advanced Battery Consortium (USABC). The consortium was designed to
advance the state of battery technology, the limiting technology of EVs. Immediately after the
signing of the partnership agreement in January, the USABC approached the electric utility
industry and requested their participation. In the spring of 1991, the Electric Power Research
Institute (EPRI), representing the electric utility industry, agreed to provide financial, technical,
and management support for the USABC. In April 1991, the USABC proposed a SO/50 cost
shared program of advanced battery research and development with the United States
Department of Energy (DOE). After several months of negotiation, a formal agreement was
5

finalized, and on October 25, 1991, DOE joined the USABC (DOE, 1992). The total amount of
funds dedicated to battery research from the auto industry, electric utility industry, and federal
government amounts to $260 million over a four year period (EPRI, 1992).
The USABC's mid-term battery development objectives are to develop a battery with a
specific energy density of 80 to 100 walt-hours per kilogram (whlkg), a useful life of 5 years, a
recharge time of under 6 hours, and a cost of less than $150 per kilowatt-hour (kwh) of capacity.
The battery is also expected to sustain more than 600 charge/discharge cycles. Although
batteries exist which meet several of the USABC's mid-term objectives, a battery has not been
developed at this time which meets all of the objectives.
Long-term goals for battery development are to develop a recyclable battery with a
specific energy of 400 wh/kg, a useful life of 10 years, a recharge time of 3-6 hours, and an
operating cost of less than $100/kwh of capacity. Feasibility for the USABC's long term
objectives are to be demonstrated by the end of 1994.
Table 2-1 presents several battery technologies that are currently being used or are
expected to be used in the near future.
Table 2-1 Battery Technology
Lead Acid 35 100 $200 $10,000
Advanced Lead Acid 52 355 $150 $7,500
Nickel-iron 53 100 $150 $7,500
Zinc-bromine 80 90 $150 $7,500
Sodium-sulfur 100 110 $200 $10,000
aBased on 50 kWh storage capacity of General Motor's G-Van battery pack. Sources: SCEVC. 1992; DeLuchi, et. aI., 1989.
Lead acid batteries have been the standard batteries used in EVs for the past century.
They require approximately 8 hours to recharge and have an average life of 2-3 years. The
technology of lead acid batteries has developed very slowly, and they are generally considered
inadequate for practical applications in small EVs. General Motors's G-Van, a full size cargo van,
6

and several models of electric buses are using lead acid batteries. Both the G-Van and the
electric buses have the volume capacity to carry the large number of lead acid batteries required
to provide a practical range of 64-129 km (40-80 mi) between charges.
Advanced lead acid batteries will most likely replace the standard lead acid batteries in
the near future. Electrosource, Inc. of Austin, Texas, has developed the Horizon Electric Vehicle
Battery, an advanced lead acid battery that can be recharged to 50 percent power in 8 minutes,
and to 99 percent power in 30 minutes. This represents a dramatic decrease in charging time
compared to conventional lead-acid batteries, which require about 8 hours for a full recharge.
Although the Horizon battery is able to be recharged quickly, it's low energy density still limits an
EV's range to under 161 km (100 mi). Electrosource estimates that the Horizon battery will have
a range of approximately 137 km (85 mi) when installed in a mid-size van (Electrosource, Inc.,
1993).
Advanced lead acid batteries differ from conventional lead acid batteries primarily in
structure and construction. While conventional lead acid batteries use vertical lead plates, the
Horizon advanced lead acid battery uses fiberglass reinforced woven lead mesh arranged
horizontally. Other such technologies have been developed to increase the power and energy
per unit of battery weight compared to conventional lead acid batteries.
Nickel-iron batteries are currently being used in the Chrysler TEVan, an electric minivan.
Compared to conventional lead acid batteries, nickel-iron batteries have a higher energy density,
provide a vehicle with a greater range while not increasing the volume and weight of the batteries,
and can sustain more charge/discharge cycles. Disadvantages of the nickel-iron batteries include
excessive hydrogen gassing during recharging, and a need to be watered more frequently than
most batteries (which adds to the maintenance time required to operate an EV using nickel-iron
batteries).
Zinc-bromine batteries are inexpensive and have a relatively high energy density.
However, zinc-bromine batteries are bulky, complex, and have a short life. The power density for
zinc-bromine batteries is fairly low, making them suitable only for smaller low performance
vehicles.
Sodium-sulfur batteries offer a very high energy density and are almost maintenance
free. Unlike most batteries, they do not require watering and do not emit gases while being
charged. A disadvantage of the sodium sulfur batteries is that they must be kept at a temperature
of 250·-350· C. When in use, the battery produces enough heat to maintain this temperature, but
when it is idle. heat is no longer produced. To compensate, the batteries must be surrounded by
7

insulation. which increases the weight of the vehicle. The life of the sodium-sulfur batteries will be
shortened jf the temperature is allowed to reach room temperature more than 20-30 times.
Charging Systems
Charging systems regulate the flow of electricity to batteries during recharging to prevent
damage to the batteries due to overcharging. Most EV battery systems take about 8 hours to fully
recharge, but advanced charging systems may be able to reduce this time by more than 90
percent. The range limitation problem of EVs is compounded by the slow recharge time for their
battery packs. Trips outside the EV range require either an 8 hour recharge period or an auxiliary
power source. Charging systems that allow batteries to be recharged in the same time it takes to
refuel a conventional ICEV would reduce the problem of limited range to a mere inconvenience of
having to spend a few minutes to recharge batteries each time the range of the EV has been
exceeded.
Chrysler and Norvik Technologies Inc.lNorvik Traction Inc. are developing the Smart
Charging System, a quick charge system that will be able to provide a full charge to a completely
discharged battery in about 25 minutes. The system is designed to be used with any type of
battery and to eliminate overcharging, thus extending battery life. The Smart Charging System
currently requires a 480 volt (AC) power supply when operating the system, which makes it
unavailable for home use. The system may eventually be able to recharge a battery in as little as
10 minutes with expected technological improvements and an increase in the voltage of the
power supply.
Improvements in battery technology will reduce charging time. The Electrosource
Horizon Battery, discussed previously, can receive a 99 percent recharge in 30 minutes. Intense
research and development in battery technology by the USABC and other organizations should
continue to produce batteries with reduced charging time.
Rather than rely on quick charge technology, several EVs have been designed to use
removable battery packs. Nordskog Industries, Inc., for example, has developed a bus with a
removable battery pack that will allow the bus to replace a discharged battery pack with a fully
recharged pack in as little as 10 minutes. Removable battery packs allow the bus to service a
route for a longer period of time with only a brief interruption in service to change the battery
pack. The main disadvantage of using the removable battery packs is the investment required to
purchase a second battery pack for each vehicle. The battery packs, which weigh from 181 kg
(400 Ibs) for very small automobiles to over a thousand kilograms (several thousand pounds) for
8

buses, will also require investment in specialized lifting equipment to aid in their installation and
removal.
Development
Virtually every major automobile manufacturer has been developing EVs that rely solely
on batteries for power. Some of the front runners in development include the General Motors
Impact, the Ford Ecostar minivan, the Chrysler TEVan minivan, and the General Motors full size
G-Van.
The General Motors Impact is a small, two-seat commuter car with performance
characteristics similar to vehicles powered by ICEs. Powered by lead-acid batteries, the Impact
can accelerate from 0 to 96 km/hr (60 mph) in 8 seconds and has a top speed over 161 km/hr
(100 mph). The maximum range is 193 km (120 mil at constant highway speeds, but the
practical range will probably be about 129 km (80 mil. General Motors had originally planned to
mass produce the Impact by the mid 1990s, but recently announced a hold on these plans due to
corporate losses and uncertainty in the EV market (J.E. Sinor, 1993b).
The Ford Ecostar is an electric version of the Ford Escort minivan, which is primarily sold
in Europe. The Ecostar uses sodium-sulfur batteries that provide a range between 161 and 322
km (100 and 200 mil at 40 km/hr (25 mph). The van will go from 0 to 80 km/hr (0 to 50 mph) in
12 seconds.
The Chrysler TEVan and the General Motors G-Van have a range of about 129 km (80
mil. Both vans have operated in electric utility company fleets, and the G-Van has also operated
in several private company fleets. Neither van is mass produced at this time, a factor that has
lead to very high prices (1993 prices are $120,000 for the TEVan and $50,000 for the G-Van.).
There are several small companies that have developed battery-powered electric buses
and shuttles. The buses are generally under 9 m (30 tt) in length, have a range of 97-121 km (60-
75 mil, and are able to reach speeds of around 64 krn/hr (40 mph). These buses are available for
immediate purchase and use, and several transit agencies already have them in their fleet
services. A detailed discussion of the buses and shuttles available at this time is presented in
Chapter 3.
HYBRID ELECTRIC VEHICLES
Hybrid vehicles are a step in the evolution from the ICEV to the battery-powered EV,
using an ICE and a battery-powered electric motor. In most cases, a very small ICE using a
"clean fuel", such as natural gas, provides the primary driving force for the vehicle. In order to
compensate for the small ICE, a battery-powered electric motor provides additional power for
9

peak performance periods, such as climbing steep grades or initial acceleration. The electric
motor can also serve as the primary driving motor during the first few minutes of vehicle
operation. During this period, the batteries heat the catalytic converter as well as supply power to
the electric motor, eliminating the very high cold-start emissions associated with ICEs. This can
significantly reduce emissions since catalytic converters only work when heated. When the
electric motor is not needed during driving, the batteries can be recharged by the ICE.
Hybrid vehicles offer the advantages of increased range and quick refueling compared to
a battery-powered EV. However, there are several disadvantages. Because the hybrid's ICE
relies on a fuel source such as gasoline or natural gas to operate, it does not offer zero tailpipe
emissions. An EV can be produced without a transmission, but the introduction of an ICE into the
power train necessitates the use of a transmission. Finally, the vehicle must be designed to
function using two different power sources, requiring maintenance personnel to be familiar with
both ICEs and electric motors.
General Motors, Volkswagen, Audi, and Fiat have all developed hybrid automobiles at
this time. The Volkswagen Chico, for example, uses a 2-cylinder gasoline engine with an
operating range of 403 km (250 mi). The Chico can achieve a top speed of 130 km/hr (81 mph)
using both its ICE and electric motor (Siuru, 1991). While the range is more than double that of
most battery-powered EVs, it should be noted that the increase is primarily due to the use of an
ICE, which does produce tailpipe emissions, albeit at a lower rate.
Ontario Bus Industries of Mississauga, Ontario, is one of the companies currently
developing hybrid electric buses. Ontario Bus Industries is developing an 8 m (25 ft), 24-
passenger hybrid bus that will use natural gas and electricity as fuel sources. The bus will have a
top speed of 60 km/hr (37 mph) using only the ICE before power from the storage batteries is
needed. Energy efficiency for the proposed model was rated for several different driving cycles.
On level ground, at a constant speed of 80 km/hr (50 mph), the hybrid vehicle had a 26 percent
fuel savings over a diesel-powered bus. However, in typical central business district (CBD)
driving the estimated fuel savings was only 6 percent. Considering that transit buses seldom
operate at constant speed (with the exception of express buses), the energy savings for a hybrid
bus will be closer to the 6 percent value (J.E. Sinor, 1991).
FUEL CELL-POWERED ELECTRIC VEHICLES
A fuel cell combines a fuel (such as hydrogen), with oxygen (found in the air). and
converts the chemical energy from the combination directly into electricity. The process is highly
efficient, the cell can be quickly refueled, and there are almost zero fuel-cycle emissions. Fuel
10

cells have been in use for many years but have only recently been developed to the point where
they can supply enough electricity to power an EV.
Hydrogen used in fuel cells can be produced from several sources, including methanol,
ethanol, and natural gas. The hydrocarbons in these fuels are converted into hydrogen and
carbon dioxide through a thermal chemical process in a fuel reformer. For practical use, fuel cells
still require the development of an inexpensive and compact fuel reformer, which can be carried
aboard the vehicle, to convert their fuel source into hydrogen (Royer, 1992).
DOE has been developing a fuel cell/battery propulsion system for use in an urban transit
bus. Compared to a diesel bus, DOE expects the fuel cell bus to have a 50 percent higher fuel
economy, a 99 percent lower emissions rate, and to operate 10 to 20 decibels quieter. A transit
bus was selected because it is large enough to carry the fuel cell design, the fixed route permits
controlled testing, the longer service life of a transit bus helps justify the cost, and the use of a
transit bus in an urban area will take advantage of the environmental benefits associated with a
zero emission vehicle. The bus uses a phosphoric acid fuel cell with methanol as a fuel source to
supply energy to the electric motors. Conventional batteries are also used to provide the motor
with additional energy for accelerations and to reduce the size of the fuel cell needed. At the
present time, one 8.2 m (27 ft) bus is operational and two additional 8.7 m(27 ft) buses are being
constructed. The second bus is scheduled for delivery in September 1994, and delivery of the
third bus is scheduled for January 1995. Controlled testing will begin with the operational bus on
a fixed route at Georgetown University in the fall of 1994, and DOE expects to start field testing a
small fleet of fuel cell buses by 1995 (Kost, 1994).
Fuel cells have been available for many years, but their use in transportation has only
recently been investigated. They are an extremely efficient means to produce energy, and while
not commercially available at this time, there may be widespread use in future years. If the DOE
study proves successful, transit agencies may be able to attain fuel cell-powered electric buses in
as little as 2-3 years.
ROADWAY ELECTRIFICATION SYSTEMS
A roadway electrification system delivers electricity to vehicles through inductive coils
buried in the roadway. The coils are placed in segments along a highway and eliminate the need
for long-range batteries. A maximum air gap of 5 to 10 cm (2.0-3.9 in.) between the vehicle and
the highway is required. As a vehicle passes over a segment, the power in that segment is
switched on and electricity is used for both powering the EV and recharging batteries. The
advantage of this system is that EVs would no longer be limited in range, as a direct source of
11

electricity would constantly be available. The high capital costs, approximately $1.25 million/lane
km ($.78 million/lane-mi) of implementing such a system can be reduced if the system is placed
only on freeways. This would require vehicles to use battery power during trips on local roads,
but allow them to use the roadway electrification system and recharge their batteries during
longer trips on the freeway (Ross, 1992).
A roadway-powered EV system has been underway in Southern California for the past 10
years. The eventual goal is to provide roadway electrification to about 3 percent of the highway
network. The first phase of the project, completed in 1991, included building prototypes of
vehicles, segments of the roadway, and a power supply for the electrification system. Phase II
involves construction of 300 and 450 m (984 and 1476 ft) test facilities, a range of 5 vehicle types
including a full size electric transit bus, additional power supplies, and economic feasibility
studies. Phase II should be complete by the end of 1994 (Ross, 1992).
For transit services, coils could be placed under the lanes on transit routes. This system
would eliminate the need for buses to carry large amounts of batteries, yet still provide an
unlimited source of power to the electric motor. While much of the technology needed for this
type of system is available, a major roadway power electrification project has yet to be completed.
Roadway electrification may be a strong possibility for the future, but until further research and
development occurs, it appears that the system is not feasible for the short term.
ENERGY USE
A recent study (Swan, 1990), estimated the energy use of a conventional ICE vehicle, a
battery-powered EV, a roadway-powered EV, and a fuel cell-powered EV. The energy
consumption estimates for a conventional ICE vehicle are based on a conversion efficiency of
crude oil to gasoline of 90 percent, and a vehicle with a 32.2 krnlliter (20 milgal) fuel consumption
rating .. Energy consumption estimates for a battery-powered EV and a roadway-powered EV are
based on electric utility energy consumption of 9,500 BTU per kWh produced, and a transmission
efficiency of 95 percent. The conversion of natural gas to hydrogen for the fuel cell is estimated
. to be 65 percent efficient, and the fuel cell net energy efficiency is estimated at 45 percent. The
energy consumption estimates of each technology are presented in Table 2-2.
The study did not consider a hybrid EV. It is important to note the difficulty in quantifying
the energy consumption of a hybrid. At any given time, a hybrid EV may operate using power
exclusively from an ICE, power exclusively from an electric motor, or power from both. The use
of these power sources depends on trip length, trip route, and driving characteristics. The ICE
and the electric motor have different rates of energy consumption, and unless the percentage use
12

of each power source can be identified, accurate quantification of the energy consumption of a
hybrid EV is not possible.
4,725 Btu/km (7,602 Btu/mi)
100%
Table 2·2 Comparison of Energy Use·
4,027 Btu/km (6,479 Btu/mi)
85%
3,128 Btu/km (5,033 Btu/mi)
66%
2,189 Btu/km 3,522 Btu/mi
46%
Energy consumption based on a 1991 Chrysler Caravan (8.5 km/l I 20 mpg) operating in city traffic. Source: Swan, 1990.
Using the per kilometer (per mi) energy consumption of the conventional ICE vehicle as a
base, the battery-powered EV uses 85 percent of the energy required of an ICE vehicle, the
roadway-powered EV uses 66 percent, and the fuel cell-powered EV uses 46 percent. Although
more energy efficient than battery-powered EVs, roadway-powered electric buses and fuel cell
powered electric buses are not commercially available at this time. Battery-powered electric
buses are currently available and have been proven to be a reliable technology by several transit
agencies. Until other electric technologies are further developed and proven reliable, battery
powered EVs will remain the most feasible zero emission technology available.
13

14

CHAPTER 3. AVAILABILITY AND USE OF ELECTRIC BUSES
The purpose of this chapter is to discuss the availability, performance, and use of battery
powered electric buses. The first section identifies U.S. manufacturers of electric buses.
Performance characteristics and vehicle specifications for several manufacturer's buses are
presented in the second section. The third section identifies public agencies operating electric
buses in the U.S. and discusses their experiences. Finally, the sources of funding available to
public agencies to assist with the capital and operating costs of electric buses are discussed.
ELECTRIC BUS MANUFACTURERS
Table 3-1 presents companies involved with the development and manufacturing of
electric buses in 1993. It is interesting to note that 6 of the 7 companies are located in California.
California currently has the strictest air quality laws of any state as well as the largest U.S.
vehicle market, and several Californian transit agencies have purchased electric buses.
Table 3-11993 Electric Bus Companies
Advanced Vehicle Systems, Inc. Chattanooga, TN Manufacture/develop electric buses
Develop electric buses APS Systems Oxnard, CA Retrofit buses for electrification
Bus Manufacturing U.S.A., Inc. Goleta, CA Manufacture custom buses
Market electric buses for Specialty Vehicle Manufacturing Corporation
Electric Vehicle Marketing Corp. Palm Desert, CA Research and development
Futura Propulsion Systems Mission Viejo, CA Develop electric buses
NEVCOR Stanford, CA Manufacture/develop electric buses
Nordskog Industries, Inc. Redlands, CA Manufacture/develop electric buses
Specialty Vehicle Manufacturing Corporation Downey, CA Manufacture/develop electric buses
Specialty Vehicle Manufacturing Corporation is the largest manufacturer of dedicated
electric buses. The Chattanooga Area Regional Transportation Authority (CART A), the City of
Monterey, California, and the Georgia Power Corporation are all operating 6.7 m (22 ft), 22-
passenger electric buses manufactured by this company. In addition to the 6.7 m (22 ft) bus,
Specialty Vehicle Manufacturing Corporation offers a 6.7 m (22 ft), 21-passenger trolley, a 6.7 m
15

(22 ft), 22-passenger shuttle, a 28.8 m (9 ft), 28-passenger bus, and a 9.4 m (31 tt), 28-passenger
bus.
Advanced Vehicle Systems, Inc. was formed in Chattanooga, Tennessee as a sister
company of Specialty Vehicle Manufacturing Corporation to meet the growing electric bus
demand of CARTA for electric buses. In 1993, CARTA operated four 6.7 m (22 ft) Advanced
Vehicle Systems buses. Advanced Vehicle Systems offers the same vehicle models as Specialty
Vehicle Manufacturing Corporation and is designated as the eastern U.S. supplier of Specialty
Vehicle Manufacturing Corporation's line of electric buses.
Marketing of the vehicles produced by both Specialty Vehicle Manufacturing Corporation
and Advanced Vehicle Systems is provided by the Electric Vehicle Marketing Corporation, based
in Palm Desert, California.
Bus Manufacturing U.S.A., Inc. built eight 6.7 m (22 ft) open air shuttles for the Santa
Barbara Metropolitan Transit District (MTD). The shuttle accommodates 22 seated passengers
and 7 standing passengers.
Nordskog Industries, Inc. built three electric shuttles for the Sacramento Municipal Utility
District (SMUD). Nordskog Industries has been building electric vehicles for applications in
airports and industry for over 40 years. They are currently producing a 14-passenger and a 20-
passenger electric shuttle.
APS Systems, Futura Propulsion Systems, and NEVCOR are each developing electric
buses, but have not produced an electric bus that is currently in use.
PERFORMANCE CHARACTERISTICS
Table 3-2 identifies cost, performance, and specifications of several models of battery
powered electric transit vehicles manufactured by Advanced Vehicle Systems, Inc. and Specialty
Vehicle Manufacturing Corporation.
The base price of an electric bus is high relative to that of a diesel-powered bus. For
example, the purchase price of the 9.1 m (30 ft), 29-passenger Gillig Phantom bus operated by
the Capital Metropolitan Transportation Authority (Capital Metro) is $174,000. Purchase price of
the 9.4 m (31 ft), 25-passenger Advanced Vehicle System battery-powered electric bus operated
by CARTA was $225,000; $51,000 higher than the comparable diesel-powered bus.
16

Table 3·2 Electric Bus Cost, Performance, and Specifications
48/30 56/35 72/45
75-100/121-161 75-100/121-161 50-75/80-121
7/22 7/22 50/31
262/103 262/99 239/94
206/81 234/92 244/96
21 22 25
5,443/12,000 7,258/16,000 8,709/19,200
Yes Yes Yes
The maximum speed of each bus, while low relative to internal combustion engine buses,
should be adequate for most shuttle and bus routes located in downtown areas. The range per
charge for the buses limits daily operation to approximately 10 hours depending on the type of
route the bus is operated. Experience by agencies operating the 7 m (22 ft) bus manufactured by
Advanced Vehicle Systems, Inc. and Specialty Vehicle Manufacturing Corporation reveals an
actual range of 105 to 121 km (65 - 75 mil per charge (Kist, 1993; Litchtanski, 1993).
Electric buses are not yet available in sizes comparable to large diesel and natural gas
buses. However, large transit buses are rarely filled to capacity, and in many cases smaller
shuttles and buses can be substituted for large buses. All of the electric buses use conventional
lead acid batteries, but as battery technology improves, larger electric buses with greater ranges
may be developed.
The use of regenerative braking on these buses extends their operating range. The
Santa Barbara MTD estimated that the use of regenerative braking provides about 1.5 more
hours of service per charge for their shuttles (Gleason, 1992).
17

AGENCIES OPERATING ELECTRIC BUSES
Table 3-3 lists the agencies operating electric buses in 1993. The experiences of these
agencies are summarized in the following sections.
Table 3-3 1993 Agencies Operating Electric Buses
Santa Barbara
Chattanooga, TN
Metropolitan Transit Santa Barbara, District CA
Sacramento, CA
Specialty Vehicle Manufacturing Corporation
Advanced Vehicle <':\I,,'to.n," Inc.
4 6.7 m (22') Electric buses 2 6.7 m (22') Open air shuttles
6 6.7 m (22') Open air shuttles
3 6.7 m (22') Shuttle buses 2 6.7 m (22') Electric buses
1 6.7 m Electric bus
Chattanooga Area Regional Transportation Authority (CART A)
The Chattanooga experience with battery-powered electric buses began with the
revitalization of their central downtown area. CARTA opted for a shuttle circulator system to
provide transportation for visitors along the 3 km (2 mi) long, 4 to 6 block wide revitalized central
downtown area. A unique and innovative shuttle to match the downtown area was desired.
Given the city's recent commitment to environmental issues, an environmental friendly shuttle
was also desired. The electric bus met these objectives and was chosen to operate on the
downtown shuttle route.
CARTA operated 2 Specialty Vehicle Manufacturing Corporation and 4 Advanced Vehicle
Systems, Inc. battery-powered electric buses on their downtown shuttle route in 1993. Eight
additional buses were ordered from Advanced Vehicle systems, Inc. in 1993 including one 9.4 m
(31 ft). 28-passenger electric bus. Funding has been approved for the purchase of another 10
electric buses in 1994; bringing CARTA's total electric bus fleet to 24 buses. Initial costs of the
Specialty Vehicle Manufacturing Corporation 6.7 m (22 ft) buses were approximately $140,000
per bus. The 9.4 m (31 ft) bus Advanced Vehicle Systems, Inc. will manufacture has a purchase
18

per bus. The 9.4 m (31 ft) bus Advanced Vehicle Systems, Inc. will manufacture has a purchase
price of $215,000. Fuel costs for the electric buses have been in the range of 2.8-3.5 e/km (4.5-
5.7 (l:/mi) and maintenance costs have been estimated at 21.8 e/km (35 e/mi), For a comparable
diesel bus, fuel costs are about 11.2 e/km (18 e/mi) and maintenance costs are about 43.5 e/km
(70 e/mi). The electric buses range have been approximately 105 km (65 mi) and are operated 7-
8 hours on their shuttle route.
In response to requests for information regarding their electric bus program, CARTA
formed the Electric Transit Vehicle Institute. The purpose of this Institute is to promote the
design, production. and utilization of electric transit vehicles powered by non-stationary means of
storage or production of energy. Described as a "Living Laboratory" for the research, design,
development, and demonstration of electric transit vehicles, the Electric Transit Vehicle Institute is
comprised of CARTA. Advanced Vehicle Systems, Inc., and Electrotek, an electric vehicle test
facility (Hartman, 1993).
Santa Barbara Metropolitan Transit District (MTO)
Similar to CARTA, MTD procured a fleet of electric shuttles to operate on a downtown
route. The downtown-waterfront shuttle serves Santa Barbara's commercial district and
waterfront.
The first electric shuttle bus. manufactured by Bus Manufacturing. U.S.A., Inc .. began
operation in January 1991. Manufacturing of additional buses was subcontracted to Specialty
Vehicle Manufacturing Corporation. In 1993. MTD operated eight 6.7 m (22 ft) electric shuttle
buses on their downtown-waterfront shuttle route. The shuttles are scheduled for at least 10
hours of service per day, and some have operated for as long as 12 hours in a single day. Their
range has been approximately 137 km (85 mi) on a single charge. Recharging occurs overnight
to take advantage of off-peak electric utility rates. Fuel costs for the MTD electric shuttle buses
are estimated at 1.8 (l:/km (2.9 e/mi). while fuels costs for the diesel buses operated in Santa
Barbara are estimated at 10 e/km (16 e/mi). The range of the electric shuttle buses was found to
be highly sensitive to the operating characteristics of the bus drivers. Slow rates of acceleration
and thoughtful deceleration that make the best use of regenerative braking systems can increase
the range of the electric shuttle buses.
MTD has expressed a great deal of satisfaction with their electric shuttle buses. Between
1991, when electric shuttle buses first began replacing diesel buses. and 1992, ridership on the
route has increased 800 percent to nearly 1 million passengers per year (Gleason. 1992). MTD
19

attributed a great deal of this increase to the use of electric buses and have had many requests to
introduce or extend the electric shuttle bus service to other parts of the city.
Sacramento Municipal Transit District (SMUD)
SMUD purchased three 6.7 m (22 ft), 16-passenger buses from Nordskog Industries, Inc.
One bus is operated by SMUD, a second is operated by the Sacramento airport, and the third is
operated by McCullough Air Force Base. The buses, equipped with heating and air conditioning,
cost approximately $179,000 each. Although little data was available on the performance of
these buses, SMUD expects cost/benefits of the electric buses to be comparable to a diesel bus
when the benefits of zero emissions are considered (MacDougal, 1993).
Georgia Power Corporation
The Georgia Power Corporation operated two 6.7 m (22 ft), 22-passenger battery
powered electric buses in 1993. The buses, manufactured by Specialty Vehicle Manufacturing
Corporation, are operated on a shuttle route for employees. The performance of the electric
buses has generally matched the performance specifications given for the 6.7 m (22 ft) Specialty
Vehicle Manufacturing Corporation bus listed in Table 3-2. The decision on future purchases is
pending, based on the test results of the first two electric buses. The Georgia Power Corporation
is also operating several types of battery-powered electric vans, including 10 Chrysler TEVans,
two Griffin Electric vans, and two General Motors G-Vans. (Kist, 1993).
City of Monterey
Monterey, California operated one 6.7 m (22 ft), 22-passenger Specialty Vehicle
Manufacturing Corporation battery-powered electric passenger bus in 1993. The bus, purchased
by Pacific Gas and Electric, is leased to the City of Monterey. Monterey has been achieving a
range of 116-121 km (72-75 mi) per day, however, this is not enough to run the bus a full service
day of 12-14 hours. Modifications were required on the torque output of the bus to compensate
for major inclines on the route, which also reduced the maximum speed to 43-45 km/hr (27-28
mph). While the base price of the bus was $140,000, an additional $100,000 was necessary to
obtain the bus options the City wanted as well as to provide needed modifications to a recharging
station. The initial ride quality of the bus was rated poor by several passengers, but most of the
problems related to ride quality have since been resolved. Several drivers, however, have
indicated that they are unhappy with the handling characteristics of the bus. Although the City of
Monterey noted the value of a zero emission electric bus, they did not feel that widespread
20

FUNDING
There are several programs available through the federal Government and the State of
Texas to encourage the use of battery-powered electric vehicles. This funding can help alleviate
the high capital costs associated with purchasing electric buses, making them more cost
competitive with diesel and natural gas buses. Below is a summary of the current programs
available.
Federal Assistance
The Energy Policy Act of 1992 (EPACT) authorizes a 5-year, $40 million
government/private industry program to research, develop, and demonstrate EV infrastructure.
Projects may receive up to $4 million dollars in funding, which can be used for such activities as
servicing of EVs, installation of charging facilities, and information dissemination efforts. The
funding can help a transit agency lower construction costs of the initial infrastructure that will be
needed to support electric buses.
EPACT also authorizes $50 million dollars over the next ten years for projects that will
accelerate development and evaluate operational performance and infrastructure needs of EVs.
The programs must be in urban areas and involve at least 50 vehicles. Financial assistance of up
to $10,000 per vehicle will be available to decrease the cost of EVs. This program would be ideal
for a transit agency considering a wide-scale electric bus or electric vanpool service initiative.
A $50 million, 5-year federal assistance program will provide assistance to states for the
development of state alternative fuel and alternative fueled vehicle incentive plans. To be eligible
for funding, a state's plan must examine such ideas as exempting alternative fuel vehicles from
state taxes and providing infrastructure for refueling. If a state's plan is approved by the United
States Department of Energy (DOE), federal assistance may provide as much as 80 percent of
implementation costs of the program. Incentives to transit agencies may be included in the
state's plan.
The Intermodal Surface Transportation Efficiency Act of 1991 (ISTEA) includes a $6
billion, 6-year Congestion Mitigation and Air Quality Improvement Program that will allow cities in
non-attainment areas to utilize funds from the Federal Highway Trust Fund for transportation
related projects. Project funding selection is the responsibility of Metropolitan Planning
Organizations (MPOs) in non-attainment areas. A variety of programs that will aid a city in
attaining national ambient air quality standards (NAAQS) can be funded. Mass transit is one way
to ease pollution and, therefore, is eligible for funding.
21

Federal Tax Incentives
Several federal tax incentives are available which apply to electric vehicles. Although
public transit agencies are tax exempt, they may contract operation of some of their services to
private industry. For example, the Capital Metropolitan Transportation Authority's (Capital Metro)
UT shuttle service is operated by DAVE Transportation, a private firm which is not tax exempt.
A 10 percent tax credit (up to $4,000 per vehicle) based on the purchase price of a
qualifying electric vehicle is available for electric vehicles purchased after June 30, 1993. The tax
credit will be phased out between 2002 and December 31,2004, when the credit is terminated.
A $100,000 tax deduction is available for investments made in clean fuel vehicle refueling
property. This deduction is available for refueling property placed into service between June 30,
1993 and December 31, 2004.
State of Texas Assistance
In 1991, the Texas legislature adopted Senate Bill 740 (SB740) requiring transit
authorities to begin converting their fleets to alternative fuel vehicles (which include EVs). By
September 1, 1994, transit fleets must consist of 30 percent or more alternative fuel vehicles.
This percentage increases to 50 percent by September 1, 1996, and to 90 percent by September
1, 1998.
In order to assist in funding these fleet conversions, the 1993 Texas legislative session
enacted Senate Bill 737 (SB 737), which establishes an Alternative Fuels Council and an
Alternative Fuels Conversion Fund. This fund consists of approved allocations from oil
overcharge funds, gifts and grants for financing alternative fuel activities, interest earned on the
fund, and any other government approved monies. The Alternative Fuels Council administers the
fund's loan program to aid with alternative fuel fleet conversion. Senate Bill 737 also authorizes
the Texas Public Finance Authority to issue bonds for alternative fuel fleet conversion. Transit
authorities in Texas are eligible for funding from both the Alternative Fuels Conversion Fund and
the Texas Public Finance Authority issued bonds.
As the momentum towards alternative fuels continues to grow, additional funding may
become available.
22

CHAPTER 4. APPLICATIONS FOR ELECTRIC BUSES
The purpose of this chapter is to discuss possible applications for battery-powered
electric buses within the existing services of the Capital Metropolitan Transportation Authority
(Capital Metro), the transit authority of Austin, Texas. An overview of the route services offered
by Capital Metro and the criteria used for route selection are discussed. Finally, Capital Metro
routes that are most feasible for electric bus operations are identified.
CAPITAL METRO ROUTE SERVICES
The creation of Capital Metro was approved in January 1985 by voters in Austin and
surrounding areas. Originally funded by a 1 percent sales tax, the board of directors voluntarily
lowered the sales tax to 3/4 percent beginning in April 1989. Capital Metro currently provides
service throughout a 1,219.9 square km (471 square mil) area which encompasses the cities of
Austin, Cedar Park, Leander, Lago Vista, Jonestown, Pflugerville, Manor, and San Leanna.
Capital Metro's service area also includes the unincorporated area of Precinct Two in Travis
County and the Anderson Mill area in Williamson County.
Capital Metro offers a variety of route services to the public, including metro routes, flyer
routes, 'Dillo routes, express/park & ride routes, and the University of Texas shuttle routes.
Appendix A lists all routes currently served by Capital Metro.
Metro Routes
Capital Metro offers 40 metro routes, which provide local service throughout the Austin
area. lVIost m~tro routes run north-south and pass through the downtown area, although several
crosstown and feeder routes do exist. Service on all routes begins by 6:30 AM on weekdays and
continues until as late as midnight. Weekend service is also provided on most routes. The one
way fare for adults is 50 cents.
Flyer Routes
Flyer routes combine local service within various neighborhoods with express service to
downtown Austin. There are currently seven flyer routes, which are operated only on weekdays
during morning and late afternoon periods. A one-way adult fare of 50 cents is charged.
Express/Park & Ride Routes
Four express/park and ride routes provide express service from free park and ride lots to
. downtown Austin. The IRSIVA Express, North East Express, and the Pflugerville Express routes
are operated only on weekdays during morning and late afternoon periods. The Leander Express
23

is operated continuously throughout the day on weekdays and Saturdays. A one-way fare of
$1.00 is charged for adults.
'Dillo Routes
Oillo service is provided on three routes and acts as a circulator service in downtown
Austin, the Capitol Complex, the University of Texas campus, and the Austin Convention Center.
'Oillo buses operate using diesel engines but resemble older versions of electric trolleys. The
Convention Center/UT 'Oillo offers service during weekdays and Saturdays, while the Congress
Capitol 'Oillo and the ACC/Lavaca 'Oillo offer service on weekdays only. 'Oillo service is free, and
a free park and ride lot located near Palmer Auditorium is serviced by each of the 'Oillo routes.
University of Texas Shuttle Routes
Twelve shuttle routes provide service to the University of Texas campus when classes
are in session. Shuttle routes operate full weekday schedules and most provide limited service
on weekends. Students pay a fee each semester for unlimited use of the shuttle buses, as well
as metro route buses, during the semester. The adult one-way fare for non-students is 50 cents.
CRITERIA FOR ROUTE SELECTION
The selection of Capital Metro routes most feasible for electric bus use is based primarily
on route service area and route characteristics.
Route Service Area
One of the most important considerations for route selection is based on the area
serviced. In order to provide the benefits of zero tailpipe emissions to the greatest number of
people, electric buses should be operated in densely developed areas such as central business
districts (CBOs). This allows transit agencies to operate buses in urban areas (where air pollution
is generally a problem) without adversely affecting air quality.
Routes that place buses in highly visible areas should also be considered. The absence
of exhaust fumes and the quiet operation of an electric bus distinguishes it from a standard transit
bus. Many people realize the importance of clean air and are more likely to appreciate the efforts
of a transit company to reduce air pollution within a city.
The decisions to utilize electric buses on routes in Santa Barbara and Chattanooga were
due in large part to the clean image of electric vehicles. Both Santa Barbara and Chattanooga
operate their electric buses in dense areas of the city popular with local residents and tourists.
The Santa 'Barbara and Chattanooga transit agencies found that not only did the public
24

appreciate their efforts to improve air quality, but the novelty of an electric bus increased ridership
along the routes serviced by the electric buses.
Route Characteristics
Several route characteristics also influence the feasibility of electric bus implementation.
These characteristics include:
•
•
Maximum speed required along the route
Number of stops along the route
• Service hours for the route
• Terrain along the route
• Ridership on the route.
The highest operating speed of an electric bus is approximately 64 kmlhr (40 mph). This
relatively low maximum speed does not allow operation of an electric bus on a freeway, but it is
generally adequate for operation in downtown urban areas and has not presented a problem in
either Chattanooga or Santa Barbara. A careful evaluation of any route on which an electric bus
will be operated should be performed to determine jf the maximum speed of the bus is adequate.
The number of stops along the route contribute to the effectiveness of a battery-powered
electric bus compared to a diesel-powered or CNG-powered bus. During each stop for boarding
and deboarding passengers, internal combustion engine buses emit pollutants and use energy.
The use of an electric bus on routes with frequent stops eliminates pollutants resulting from
periods of idling. Overall energy consumption is also reduced since the electric bus consumes no
energy for stops due to boarding and deboarding of passengers, due to traffic control signals, or
due to highway congestion.
The maximum range of 113 to 121 kilometers (70 to 75 mi) per charge limits the daily
operation time of the bus. A bus that operates with an average speed of 16.1 kmlhr (10 mph) will
be limited to approximately 7 to 7.5 hours of service per day, depending on the driving
characteristics of the driver and the terrain on which the bus is operated. Quick accelerations and
steep grades will reduce the range, while gentle accelerations, level terrain, and thoughtful use of
the regenerative braking systems will increase the range.
Finally, ridership on the route must be considered to assure that an electric bus, which
generally seats less than half the passengers of a standard full-size diesel-powered bus, can
accommodate demand.
25

RECOMMENDED ROUTES
An evaluation of all metro routes, flyer routes, express routes, 'Dillo routes, and UT
shuttle routes was made to determine which routes are most feasible for electric bus use. This
section presents the methodology used to identify routes with characteristics not amenable to
current electric bus technology. The following section presents the routes selected for further
evaluation and the criteria used for final route selection. Finally, the third section presents the
Capital Metro route determined most feasible for operation of electric buses.
Unfeasible Routes
An initial evaluation of all routes serviced by Capital Metro was made to determine which
routes were not feasible for electric bus use. Routes were eliminated from consideration based
on two criteria: 1) maximum speed required on the route and 2) area serviced by the route.
Routes that required buses to operate on freeways were eliminated from consideration.
Most models of electric buses have a maximum speed rating of 56 to 72 km/hr (35 to 45 mph)
and, therefore, are unable to operate safely on freeways.
Routes that serviced areas outside the CBD were also eliminated from consideration. In
this report, the CBD is defined as the area in downtown Austin bordered by Interstate 35 on the
east, Lamar Boulevard on the west, the University of Texas campus to 26th Street on the north,
and Riverside Drive and Barton Springs Road on the south.
A route matrix was developed to indicate which routes operated on freeways and which
routes operated outside the CBD. The matrix also indicates which routes are served exclusively
by large transit buses (buses at least 9.1 m (30 ft) long). Routes which are served by smaller
buses under 9.1 m (30 ft) are preferred because electric buses, which are also under 9.1 m (30 ft)
would be adequately suited to accommodate ridership on those routes. However, service of a
route by a smaller bus is not a requirement for effective use of an electric bus. Headways can be
shortened so that smaller buses can service routes where large buses currently operate. Also,
ridership on a particular route may be low enough that smaller buses can accommodate demand.
The route matrix was applied to each type of route service offered by Capital Metro. The
completed matrix for each type of route service is presented in Tables 4·1 through 4·5.
Routes that met either criteria of operation on freeway or operation outside of the defined CBD
were eliminated from consideration. A majority of metro routes operate primarily outside the
CBD, providing service from less dense urban and suburban areas to the CBD. Due to their
operation outside of the CBD, all metro routes were eliminated from consideration.
26

Table 4-1 Route Matrix-Metro Routes
.(1r ;:;~ "":"Obefali6ri< 'ill.Ere~WM'.@OffiMCt~1heOBD 1··Bl'sesObtV~
1 North Lamar • •
1 Rosewood • •
1 Burnet • •
1 MUlllu!-'ulis • •
1 _Woodrow • •
1 East 12th • •
1 Duval • •
1 Govalle •
1 Enfield •
11 South First • •
12 MClOfhaca • •
13 South Congress • •
14 Travis iei411l::> •
15 Red River • •
16 South FifthIW • •
17 Johnston • •
18 Martin Luther King • •
19 Bull Creek • •
20 Manor Rd/LBJ H.S. • •
21 F)(no~ition •
22 Chicon •
25 Ohlen • •
27

Table 4-1 Route Matrix-Metro Routes (cont'd)
_dt!ii2~lgili&j',_I&ill~i~[t~~6g§61~~~~~~~~1~~~ !:""HOI .. ",;,'.''''''1 ,1IrtC,'r'tI:;;\.;)tlL!
26 Riverside_ • •
27 Dove Sprinq • •
28 Ben White • •
29 Barton Hills • •
30 Barton Creek Square • •
31 Oltorf •
32 Airport Blvd. •
33 William Cannon •
37 Colony Pk.lWind§or Pk • •
38 South Lamar/W"';;"!:Jate • •
39 Walnut CreeklKoeniq • •
40 Parkfield •
I..VF Laqo Vista Feeder •
42 Quail Vallt::y/Metlil,,; •
43 South Oaks •
44 Balcones N()rthwest •
45 COJ-'I-'",,fib Id •
46 n. • 1:>1:: I!-!;;'II VI
28

Table 4-2 Route Matrix-Flyer Routes
61 Dove Spring Flyer • • •
62 Metric Flyer • • •
63 Oak Hill Flyer • •
64 South Central Flyer • •
65 lVIanchaca Flyer • •
66 North Central Flyer • • •
67 Cameron Road Flyer • •
Table 4-3 Route Matrix-Express/Park & Ride Routes
IRS IRSIVA Express • • •
NEX North East Express • •
PX Pflugerville Express • • •
LX Leander Express • • •
Table 4-4 Route Matrix-'Dillo Routes
85 Convention Center/UT • 'Dillo(Red Line)
86 Congress Capitol'Dilio • (Blue Line)
87 ACC/Lavaca 'Dillo • (Green Line)
29

Table 4-5 Route Matrix-UT Shuttle Routes
48 Red River • •
49 South Riverside •
50 West Campus •
51 Cameron Road • • •
53 Enfield Road • • 54 Forty Acres •
55 Far West >. • •
56 Intramural Fields • •
57 Lake Austin • • 58 North Riverside • • •
59 Pleasant Valley • •
60 East Campus • •
All express/park & ride routes and most flyer routes were eliminated because of their
freeway routing which require speeds of up to 88.5 km/hr (55 mph). Those flyer routes not
operating on freeways require buses to travel fairly long distances without stopping for
passengers and operate outside the CBD. These flyer routes were also eliminated from
consideration.
Finally, most UT shuttle routes operate outside the CBD and several operate on
freeways. UT shuttle routes meeting either of these criteria were eliminated from consideration.
Selected Routes
Based on the initial evaluation criteria presented in the route matrix, three 'Dillo routes
and two UT shuttle routes were selected for possible electric bus implementation. 'Dillo routes
include the Convention Center/UT 'Dillo, Congress Capitol 'Dillo, and ACC/Lavaca 'Dillo; UT
shuttle routes include the Forty Acres and West Campus routes.
These routes were initially selected because of their continuous service in high density
areas, which provides exposure for the electric buses and maximizes the zero tailpipe emissions
benefits. Detailed maps of the Convention Center/UT 'Dillo, Congress Capitol'Dillo, ACC/Lavaca
'Dillo, Forty Acres shuttle route, and West Campus shuttle route, including the location of all bus
stops, are provided in Figures 4-1 through 4·5 found,at the end of this chapter.
30

The three 'Dillo routes and two UT shuttle routes are all located in areas which make
electric bus utilization a feasible alternative. Selection of the best route was based on three
additional criteria:
• Number of bus stops per km (mil) along the route
• Average speed of the bus on the route
• Daily ridership.
An evaluation of the above criteria is presented in Table 4-6.
Table 4-6 Routes Considered for Implementation
Average Route
Route Bus Stops Speed Length Number of Cycle Time per kmlmi (km/hr)/ Weekday
Route (kmlmi) Bus Stops (minutes) Along Route (mph) Ridershipa
Congress Capitol o ill 0 6.3/3.9 24 32 3.9/6.2 11.7/7.3 725
Convention Center/UT 'Dillo (With UT extension) 13.0/8.1 40 51 3.0/4.9 15.3/9.5 496b
Convention Center/UT 'Dillo (Without UT extension) 9.2/5.7 29 36 3.2/5.1 15.3/9.5 496b
ACC/Lavaca 'Dillo 9.0/5.6 38 40 3.1/5 13.5/8.4 2087
140 Acres 3.912.4 6 14 1.6/2.5 16.7/10.3 4989
lWest Campus 4.5/2.8 13 20 2.9/4.6 13.5/8.4 5579
aBased on Capital Metro ridership survey, November 1992. bRidership is given for the entire day and not divided between ridership with and without UT eX1ension.
The number of bus stops per kme (mi) indicates the frequency of stops the buses make
during service of the route. As explained above, the greater the frequency of stops, the more
beneficial electric buses are relative to ICE buses. The Congress Capitol 'Dillo had the greatest
number of bus stops per kilometer with 24 stops on a route of 6.3 km (3.9 mi), equivalent to 3.9
stops per km (6.2 stops per mile).
Low average speeds on routes allow electric buses to service the route for a longer
period of time throughout the day, which is crucial due to the current range limitations of electric
buses. The Congress Capitol 'Dillo also had the lowest average speed of any selected route,
31

completing a 6.3 km (3.9 mil route in 32 minutes, which is an average speed of 11.7 km/hr (7.3
mph).
Finally, weekday ridership surveys were obtained from Capital Metro to assure the
smaller electric vehicles had the capacity to handle ridership demand on selected routes. In the
case of replacement of 'Oillo service with electric buses, ridership is not a major consideration
since the electric buses seat approximately the same number of riders as the 'Oillo buses. Based
on the ridership data for the 'Oillo routes, currently manufactured electric buses with seating
capacities of 22 passengers are adequate to accommodate ridership demand on the 'Oillo routes.
However, the high weekday ridership of the Forty Acres and West Campus UT shuttle routes may
prove troublesome for the smaller electric buses. Most likely, current headways of buses on
these routes during peak demand times would need to be reduced by using additional buses in
order to meet ridership demand.
Final Route Recommendations
Of the four selected routes, the Congress Capitol 'Oillo route offers the most feasible
route for electric buses. The operation of this route in a high density urban area takes full
advantage of the benefits of a zero emission vehicle. Operation of the Congress Capitol 'Oillo
along Congress Avenue from Town Lake to the Capitol will provide a great deal of exposure for
the electric buses to both Austin residents and out of town tourists. The high frequency of bus
stops along the route and low average speed will help to minimize the negative effects of the 113-
121 km (70-75 mil range. The current average operating speed of the Congress Capitol'Oilio of
12.1 km/hr (7.5 mph) allows electric buses to operate continuously for approximately 10 hours
before requiring a recharge.
The selection of routes on which to operate electric buses is crucial to their success.
Selected routes should take maximum advantage of the benefits of an electric bus while
minimizing the disadvantages, such as short range and low maximum speeds. Based on the
selection criteria presented in this chapter, and the current status of electric bus technology, it is
believed that the Congress Capitol'Oilio route is best suited for use of electric buses.
32

w w
Parking City
~ 9 I
~ ,0 1: "~ ~
?' ¢
"ff'
Coliseum
• Ilouldin
;::;, ~.
3. 8-'
-l o
~ r ::.: ;><;" Q
')
~
'" "' ') ::r
'" < r;
'" ~
o
Figure 4-1 Congress Capitol 'Dillo
n o 9
b'1 i::':' C. ci.
• Con\"cntiun Cen(l~r
Congress
... 5'
B I III
o V< 5'
;2' ::r
Il ::::J ::r
o o EI
00 5'
o Colorado
o B
z :;....
Guadalupe ............. -IN -- S-
o Lavaca
0: ::;-
01 13 •
Sial" Capilol Building
\0 -o 5' 5'
S 'Dillo Stop
One-way Service
Two-way Service

~
Parking
~ o 0
~ ,\0 <~
~ 0o?
~ ..... o ~ 'f'
Figure 4-2 Convention Center/UT 'OHIo
City ColiseulTl
• Bouldin
", .' i ~
~ ;>\" G
C. Brazos
QI t )(; t :; 'J g
§: I D ------ El
OBI O""-1lI
ri 1"
~ ----Trinity
• Con\'~ntion
Center
D San Jacinto
Dobie. Mall
z )It
Guadal upe El EI EI .-------, o If! 0 D I I ~
I 01 Is-~L.J I~
I;!. ::0" 0
• o Congress I I . 0 01
Stale Cnrirol Building
University • FfCampus
IH~ IU~ ::0"
III 11 0 ..... ,....- 10 -::0"1 --....
III Trinity
n ~ t~;U'SP"dW'Y ~ Brazos ;;0::
D 'Dillo SLOP
One-way Service
Two-way Service
- -. UT EXLension

Pllfking City
~ Coiiseum • Bouldin II II
~\ Palmer /~ Auditorium !! • J:!
fi: ";)
Ci) ~ ~. B South lSI (J1 ";)
\l0-.)1
,..... b ~ o
Figure 4-3 ACC/Lavaca'Dillo
('") g <: (1) N ~ ...... ~
t, "::. e ~..o
~:J
;;' 5 ~
8 ~ ~~ ;> ~
~8
ACC Rio Grande Campus
• Rio Grande a II 0
z ~
o • • Oil B 0
Guadalupe 0 0 Do.OOOol'!
D 111 Guadalupe D
mOoool ---!MuniciP~II~ Annex
o D Lavaca
-----IiI"-
D n
~
tlg tl~ I~ l~ r m .1Pt ~ i 1PUS
• State Capirol lluilding
D 0 ----- IJ Speedway
o 'Dillo SlOp
One-way Service
Two-way Service

w en
22nd 10 (\.) C. ::l
:§ § o
t
Figure 4-4 Forty Acres Shuttle Route
c .~
'"' 'l)
.!::
:51 26th
0 --.-
• lrf Campus
..011-
2Ist
• Fr CmnpllS
[j
• Stale Capitol BUilding
fl
~ f}
(J
~ N
• LBJ Library and Sehoul of Public Affairs
Shuttle Stop
One-way Service

~
Figure 4-5 West Campus Shuttle Route
W.23rd
W.25th
w
<n ::;)
Z <:: (i)
c ::E 2. ::r < ~: >-
<
~ W.26UI 1-1 W. [lUI
!!.. I 0........ W 2M [/ D 11 .
a •
I Il
1 ::!.
~ .;:)
d ~
"
• 1.11' Campus
o I 0
::E &: z
----- D
CI1 '";J
(1: (1:
c.. :::
'" '<!
0
<n
f 5 '-::::> ;,
21st
W.24th
D Shuttle Stop
~ N
One-way Service

38

CHAPTER 5. COSTS AND BENEFITS OF ELECTRIC BUSES
This chapter attempts to measure the quantifiable costs and benefits of electric buses
compared to diesel and compressed natural gas (eNG) buses. Quantifiable costs include capital
costs, fuel costs, and maintenance costs. The emissions from the three types of buses are also
considered, and damage costs of pollutants due to emissions are estimated.
CAPITAL COSTS
The costs of several models of diesel, natural gas, and electric buses are included in
Table 5-1. Costs for the diesel and natural gas buses represent the total cost of each bus,
including such features as wheelchair lifts and air conditioning. Electric bus costs represent the
total bus cost and also include the cost of a separate battery charger unit.
Table 5-1 Capital Costs of Buses
CNG 12.2 m (40') 41 $247,000 $6,024
CNG 8.8 m (28.8') 28 $209,000a $7,464
Diesel 10.7 m (35') 39 $187,000 $4,795
Diesel 9.1 m(30') 29 $174,000 $6,000
994 Advanced Vehicle ems 31' Bus Electric 9.4 m (31 ') 25 $225,000b $9,000
Electric 6.7 m (22') 22 $145,OOOb $6,591
992 Bus Manufacturing .sA Inc. 22' Open Air
MTD huttle Electric 6.7 m (22') 22 $125,OOob $5,682
aEstimated cost (Capital Metro, 1994). blncludes $5,000 cost of battery charger.
Data from Capital Metro, the Chattanooga Area Regional Transportation Authority
(CARTA), and the Santa Barbara Metropolitan Transit District (MTD) are used in Table 5-1 and
throughout this chapter. CARTA and MTD have both been operating electric buses for several
years, and have the most extensive electric bus data available.
39

Capital Metro buses listed in Table 5-1 represent all buses purchased in the last five
years and include their 1993 TMC RTS's, 1993 Chance Trolley, and 1989 Gillig Phantoms.
The 40 ft (12.2 m) TMC RTS bus is fueled by CNG. Capital Metro acquired 30 of these
buses in 1993 for use on metro routes.
The Chance Trolley is also fueled by CNG and is currently leased from Chance to provide
service on the 'Dillo routes. The Chance Trolley is an experimental vehicle, and a purchase price
has not been set (Capital Metro estimates that the cost for this trolley will be approximately
$209,000). The 1985 diesel fuel Spartan trolleys, which provide primary service on 'Dillo routes,
are not included in this study because Capital Metro will replace them in 1995. Capital Metro
plans to write specifications for the new 'Dillo trolleys based on the CNG Chance trolley model
and a competitive bidding process will be used to select the manufacturer (Young, 1994).
Both the 9.1 m (30 ft) and 10.7 m (35 ft) Gillig Phantom buses included in Table 5-1 are
diesel fueled and operate on Capital Metro fixed routes including UT shuttle routes.
The two models of CARTA's electric buses currently in operation are included in Table 5-
1. These buses include the 9.4 m (31 ft) Advanced Vehicle Systems electric bus and the 6.7 m
(22 ft) Advanced Vehicle Systems electric buses. These buses are not equipped with air
conditioning or heating units from the manufacturer. CARTA has installed propane fueled heaters
on several buses but has not equipped any buses with air conditioning.
Finally, MTD's 22 ft (6.7 m) open air shuttle is included in Table 5-1. MTD's first two open
air shuttles were manufactured by Bus Manufacturing U.S.A., Inc., and an additional six open air
shuttles were manufactured by Specialty Vehicle Manufacturing Corporation. The specifications
and costs of all eight shuttles are the same. These open air shuttles have an overhead roof but
do not include doors or passenger windows.
In addition to the cost per bus, Table 5-1 also lists the cost per passenger seat. This was
calculated by dividing the cost of the bus by the seating capacity to determine the cost of a bus to
provide service to one passenger. The least expensive units based on cost per passenger seat
are the diesel fueled Gillig Phantoms. MTD's open air electric shuttle also had a low cost relative
to the other buses, but it is not suited for service in cold or inclement weather. The TMC CNG
buses were in the mid-price range based on cost per seat. CARTA's electric buses and the CNG
fueled trolley were on the high side of the cost per passenger seat estimates.
FUEL COSTS
Fuel costs, measured on a cents per kilometer (mil) basis, are provided in Table 5-2.
These costs are given for Capital Metro's TMC 12.2 m (40 ft) CNG buses, Capital Metro's diesel
40

fleet, CARTA's 6.7 m (22 ft) electric bus, and MTO's 6.7 m (22 ft) electric shuttle. Information on
specific diesel bus models was not available from Capital Metro. The fuel costs per passenger
seat per kilometer are also provided in Table 5-2.
The fuel costs per kilometer (mi) of the electric buses are well below those of diesel and
CNG buses. CARTA's electric buses consume .93 to 1.2 kWh/km (1.5 to 1.9 kWh/m) of travel,
and unlike diesel and CNG buses which idle and continue to consume fuel when stopped, electric
buses do not consume any electricity when stopped. CARTA's estimate of 2.8-3.5 ¢/km (4.5 to
5.7 ¢/mi) (Hartman, 1993) are below the fuel costs of the diesel and CNG buses, even when
measured by fuel costs per passenger seat per kilometer (mi). MTO's estimate of 4.4 e/km (7
elm i) (Ooerschlag, 1994) is also below the fuel costs of diesel and CNG buses. When measured
based on fuel costs per passenger seat per kilometer, fuel costs of the MTO electric shuttle are
equivalent to the fuel costs for CNG buses and below the fuel costs for diesel buses.
Table 5-2 Fuel Costs
Capital Metro TMC CNGa 8.1¢(13¢) 20q: (.32¢ (.)
Capital Metro Oieselb 12.4e (20e) .36e (.59¢)
CARTA 22' Electric Busc 2.8-3.5¢ (4.5-5.7e) .13-.16e (.20-.26¢)
MTO 22' Electric Shutt/ec 4.4¢ (7¢ ) .20¢(.32¢)
aBased on average Capital Metro CNG fleet fuel efficiency rating of 4.8 km/g (3 mpg), CNG fuel cost of 3ge/gallon equivalent, and CNG bus fleet passenger seating capacity of 41. bBased on average Capital Metro diesel fleet fuel efficiency rating of 5.6 km/g (3.5 mpg), diesel fuel cost of 70e/gallon, and average diesel bus fleet passenger seating capacity of 34. cBased on battery recharging during off peak electricity rates. The electric buses have a seating capacity of 22.
MAINTENANCE COSTS
Maintenance costs of Capital Metro's diesel and CNG buses, and CARTA's electric bus,
are given in Table 5-3. Capital Metro's estimates for diesel and eNG maintenance costs are the
same. (Insufficient data is available to evaluate any differences in costs between the two vehicle
types.)
41

Capital Metro Diesel and CNGa
CARTA 22' Electric Bus
Table 5-3 Maintenance Costs
11.6e (18.7c) Parts 19.2e (30.ge) Labor
21.8e (35.0e) Maintenance 7.1 e (11.4e) Batteryb
30.8e (49.6e)
28.ge (6.4e)
aM aintenance cost based on Capital Metro 1994 fleet maintenance budget.
.ge (1.5e) Dieselc
.8e (1.2c) CNGd
bSattery replacement cost based on a battery pack with a life of 1,500 recharge cycles and cost of $12,000.
cSased on average Capital Metro diesel bus fleet passenger seating capacity of 34. dSased on CNG bus fleet passenger seating capacity of 41. eSased on electric bus passenger seating capacity of 22.
Maintenance costs for CARTA's 6.7 m (22 ft) electric buses also include the cost for
battery replacement. It is estimated that battery life is consumed at 1,500 recharge cycles.
(Capell, 1994). CARTA's buses have only experienced approximately 500 cycles at this time,
and CARTA expects to pay $12,000 per battery pack for replacement (Capell, 1994).
Specific maintenance data was not available from MTD, but their initial estimates for
battery cycle life and replacement costs match those of CARTA (Doerschlag, 1994).
Total maintenance costs, including battery replacement costs, are lower for electric buses
compared to diesel and CNG buses. However, if compared on a cost per passenger seat basis,
the maintenance costs of the electric buses are actually higher than diesel and CNG buses.
The reduced maintenance costs of electric buses (due to their lack of transmissions,
cooling systems, and tune-ups) are partially offset by the costs for battery maintenance and
replacement. Maintenance costs will remain close if a larger electric bus is compared with a
diesel and CNG bus because bus size does not have a significant impact on maintenance costs.
(It would, however, increase the fuel costs because of the larger battery pack required for bigger
buses.) Unfortunately, CARTA did not have estimates on maintenance costs for their 9.4 m (31
ft). 25-passenger bus, which only recently began route service. The maintenance costs for this
bus should be similar to the maintenance costs for the 6.7 m (22 ft), 22-passenger electric bus. If
this is true, maintenance costs per passenger seat on the 9.4 m (31 ft) electric bus would be
42

1.2c/km (1.9 c/mile), still higher than the diesel and CNG costs per passenger seat but lower than
the maintenance costs per passenger seat for the 6.7 m (22 ft) electric bus.
EMISSIONS
The primary benefit of electric buses is that they have zero tailpipe emissions. There are,
however, emissions associated with electricity generation which must be accounted for, but total
fuel-cycle emissions of electric buses are still less than those of diesel and natural gas buses. A
pollutant cost index is developed in this section to determine the damage cost of individual
pollutants. These pollutant costs are then applied to the emissions levels of each bus to estimate
the pollutant damage costs for operating each bus.
Effects of Emissions
The five emissions associated with the National Ambient Air Ouality Standards (NAAOS)
were selected for evaluation: carbon monoxide (CO), hydrocarbons (HC) 1, nitrogen oxides (NOx),
sulfur oxides (Sax), and particulates.
Carbon monoxide is a colorless, odorless, tasteless gas, produced by incomplete
combustion in motor vehicles, industrial processes, gas and wood stoves, and cigarette smoking.
Nationally, 63 percent of the outdoor carbon monoxide pollution is emitted by motor vehicles
(EPA, 1993). Carbon monoxide is absorbed into the blood and displaces oxygen in red blood
cells, reducing the amount of oxygen available to cells throughout the body. Exposure to high
levels of carbon monoxide can place additional strain on cardiac and respiratory systems
(Hyndman, 1992), and adversely affect mental processes (Halvorsen, 1981).
Hydrocarbons are the volatile portion of unburned fuel emitted from motor vehicle
engines. Sources of hydrocarbons include exhaust gases and evaporative loss due to refueling
engines. Hydrocarbons may cause skin irritations and has been linked to an increase in the
number of leukemia cases (Hyndman, 1992).
Nitrogen oxides include nitric oxide, an odorless, colorless gas, and nitrogen dioxide, a
yellow-brown gas with a sweet, pungent odor. Nitric and nitrogen dioxide are produced by motor
vehicles and other combustion sources such as coal-or oil-fueled power plants. Nitrogen oxides
can interfere with the defense mechanisms of the lung (thereby increasing susceptibility to lung
infections), decrease pulmonary function, and adversely affect vegetation (Faiz, 1990).
1 The NAAQS do not include HC as a criteria pollutant. Ground level ozone, the primary constituent of smog, is the principal concern. HC, however, is a major contributor, along with NOx• to the development of tropospheric ozone. Regulations for tailpipe emissions, etc. are for hydrocarbons.
43

Hydrocarbons and nitrogen oxides react with sunlight to form ozone, a major constituent
of smog. Exposure to elevated levels of ozone can cause irritations in the eyes and chest,
headaches, respiratory illness, increased asthma attacks, and reduced pulmonary functions.
Ozone can also inflict damage on vegetation, reduce crop yield, and accelerate the deterioration
process of plastics and rubber (Faiz, 1990).
Sulfur dioxide combines with water to form sulfurous acid. Major sources of sulfur dioxide
include power plants, primary metals industries, and industrial boilers. Sulfur dioxide can
adversely affect the respiratory system, and is a primary contributor to acid raid. Extensive
damage to lakes, streams, and the wildlife inside of them has been associated with sulfur dioxide.
Acid rain also causes damage to vegetation, stone, structural steel, and oil-based paint
(Halvorsen, 1981).
Combustion sources often emit fine particulates under 10 micrometers (PM10). PM10
can reduce local visibility, cause human respiratory problems, and cause soiling when deposited
on buildings and other materials. Further, fine particulates will tend to remain airborne until
brought down by precipitation (Chernick, 1989).
Pollutant Costs
There are three methods that can be used to measure the social costs of pollutants
(Federal Highway Administration, 1984). The damage cost method evaluates damage in the form
of medical injuries, death, lost earnings, and physical damage to property and agriculture.
External social costs reflect the actual expenditures used to compensate for these damages.
The revealed preference method measures how much people would be willing to pay to
avoid a particular externality. Real estate property values are often used as a measure of the
price a person will pay to avoid an externality such as noise or air pollution.
Finally, the optimal control costs method measures the cost of reducing an externality to
some defined limit. for example. the U.S. Environmental Protection Agency (EPA) ambient air
standards. The social cost of a particular pollutant is then the cost to reduce the level of that
pollutant to the EPA standards.
A literature review revealed four studies that attempt to estimate pollutant costs on a cost
per unit weight basis: Small (1977), Haugaard (1981), Massachusetts Department of Public
Utilities (1989), and Ottinger, et. al. (1989). All of the studies use the damage cost method for
estimating pollutant costs. Table 5-4 presents pollutant cost estimates for each study on a per
gram basis.
44

Small bases his pollutant costs estimates on damages caused by air pollution to health
and materials. The costs due to mortality are based on lost earnings as a result of death. An
attempt to arrive at a value of human life estimate is not included, The costs associated with
morbidity include medical costs and lost earnings due to absence from work. Small determines
that the best lower bound estimate of U.S. cost due to air pollution is five percent of the total U.S.
cost due to mortality and morbidity in 1963. Allocation of the total cost to various pollutants is
based on the emissions and severity of each pollutant.
The costs due to materials damage and the need to use more expensive materials (such
as aluminum for galvanized steel) tp combat the effects of pollution are also considered.
Small also omits the pollutant costs for damage to agriculture. He reasons that the
estimates of agriculture damage costs are so small that including them is not warranted. Other
categories such as aesthetic loss, damage to wildlife, and possible long term ecological damage
are not included because of the difficulty of quantitative estimates.
Haugaard's estimates of pollutant costs are based on damage to human heath, materials,
and vegetation. Damage costs to human health are based on medical bills and lost earnings as a
result of mortality and morbidity. Damage costs to materials are based on 32 kinds of materials
affected by pollution. Damage costs to vegetation are based on 77 crops, as well as shade trees
and other ornamental trees and shrubbery.
The purpose of Ottinger's study was to develop a pollutant cost index that could be used,
for electric utilities to estimate the social costs of producing electricity. Pollutant damages were
estimated individually for each pollutant. This differs from the approach used by Small and
Haugaard, who first evaluate the social cost of all air pollution and then attempt to disaggregate
by specific pollutants.
Cost estimates of NOx emissions in Ottinger's study are based on impacts to health,
materials, vegetation, and visibility. A value of human life estimate of $4 million is used to
determine mortality costs. Estimation of vegetation damage is based only on damage to crops,
with the categories of damage to forests and ornamental plants excluded.
Pollutant costs of SOx emissions are based on impacts to health, materials, and visibility.
Health costs accounted for nearly all of the total SOx pollutant cost.
Particulate pollutant cost estimates are based on impacts to health and visibility. Visibility
accounted for approximately 70 percent of the total particulate pollutant cost.
45

Table 5-4 Pollutant Costs Estimates By Study (¢/Gram)
1· ••••• _ .• y.H:»IH8?_!}§@g···p;:;~?·· Small 1977 Health costs per urban emission, 1974 (~/gram) 0.00068 0.00683 0:0164 0.0144 0.0206
Materials costs per urban emission, 1974 (It/gram) 0.0 0.00375 0.0185 0.0289 0.0
Total cost per urban emission, 1974 (¢/gram) 0.00068 0.0106 0.0350 0.0432 0.0206
Haugaard 1981 Health costs per emission, 1981 (¢/gram) 0.00158 0.0158 0.0380 0.0332 0.0475
Materials costs per emission, 1981 (¢/gram) 0.00025 0.00765 0.0396 0.0627 0.0405
Vegetation costs per emission, 1981 (Q:/gram) .. 0.00076 0.00091 0.00007 ..
Total cost per urban emission, 1981 (¢/gram) 0.00183 0.0238 0.0779 0.0960 0.0880
Ottinger 1989 Health costs per emission, 1989 (Q:/gram) • .. 0.139 0.390 0.079
Materials costs per emission, 1989 (Q:/gram) .. • 0.002 0.026 0.0
Vegetation costs per emission, 1989 (Q:/gram) .. .. 0.002 0.0 0.0
Visibility costs per emission, 1989 (Q:/gram) .. .. 0.037 0.031 0.183
Total cost per urban emission. 1989 (It/gram) .. .. 0.180 0.448 0.262
Massachusetts Department of Public Utilities 1989 Total cost per urban emission. 1989 (Q:/gram) 0.0959 .. 0.716 0.165 0.441
Values not given
In August 1990, the Massachusetts Department of Public Utilities issued a regulation
requiring electric utilities to consider pollutant costs when calculating the social costs of resource
options. Similar to Ottinger's study, the Massachusetts Department of Public Utilities study
estimates the damage cost of each pollutant separately. Eight pollutants were evaluated,
including CO, NOx, and SOx. Hydrocarbon damage costs were not included in the study.
46

The results presented in the previous tables have been recalculated to January 1993
dollars. This was done using the January 1993 implicit price deflator value for personal
consumption expenditures (U.S. Department of Commerce, 1993). Table 5-5 summarizes the
results of each study in January 1993 dollars.
Table 5-5 Pollutant Costs (¢/gram), January 1993 Dollars
Small 0.0019 0.0294 0.097 0.120 0.057
Haugaard 0.0029 0.0384 0.122 0.155 0.142
Ottinger 0.180 0.448 0.262
Massachusetts Department 0.096 0.822 0.189 0.506 of Public Utilities
• Values not given
Total Fuel-Cycle Emissions
Total fuel-cycle emissions are determined for the CNG, diesel, and electric buses. Total
fuel-cycle emissions include emissions due to feedstock extraction, feedstock transportation,
conversion of feedstock into end-use fuel or electricity, transportation of end-use fuel, and tailpipe
emissions of vehicles. Estimates for total fuel-cycle emissions are given in Table 5-6. Emissions
for the CNG and diesel buses are divided into two categories, fuel-cycle and tailpipe emissions.
Fuel-cycle emissions are defined in this study as all emissions associated with the total fuel-cycle
other than tailpipe emissions.
Full fuel-cycle emissions estimates for CNG buses include emissions from extraction,
transportation, and compression of the fuel; and emissions from the tailpipe. Values given in
Table 5-6 for fuel cycle emissions are based on a study by Darrow (1994) prepared for the Gas
Research Institute. The study uses a small van as a base vehicle for calculations of grams per
mile equivalent emissions. The estimates for CNG bus emissions in Table 5-6 are adjusted to
reflect the lower fuel efficiency, and therefore higher emissions, of the CNG buses.
47

Table 5-6 Bus Emissions In Grams Per Mile (G/Km)
Capital Metro CNGa Fuel Cycle 0.40 (0.25) 0.62 (0.39) 3.26 (2.03) 1.96 (1.22) 0.04 (0.02) Tailpipe 3.38 (2.10) 1.25 (0.78) 10.68 (6.64) * 0.13 (0.08) Total 3.78 (2.35) 1.87 (1.16) 13.94 (8.66) 1.96 (1.22) 0.17 (0.11)
Capital Metro Diesela Fuel Cycle 0.50 (0.31) 1.58 (0.98) 1.41 (0.88) 0.27 (0.17) 0.08 (0.05) Tailpipe 26.8 (16.66) 1.4 (0.87) 27.6 (17.15) * 3.1 (1.93) Total 27.30 (16.97) 2.98 (1.85) 29.01 (18.03) 0.27 (0.17) 3.18 (1.98)
CARTA 22' Electric Busb
Feedstock Extraction 0.06 (0.04) 0.08 (0.05) 0.23 (0.14) 0.03 (0.02) 0.01 (0.006) Power Plant 0.12 (0.07) 0.04 (0.02) 4.38 (2.72) 7.87 (4.89) 0.01 (0.006) Tailpipe 0.0 0.0 0.0 0.0 0.0 Total 0.18(0.11) 0.12 (0.07) 4.61 (2.87) 7.90 (4.91) 0.02 (0.012)
MTD 22' Electric Busc Feedstock Extraction 0.04 (0.02) 0.06 (0.04) 0.16 (0.10) 0.02 (0.01) 0.01 (0.006) Power Plant 0.07 (0.04) 0.02 (0.01) 2.77 (1.72) 5.56 (3.46) 0.01 (0.006) Tailpipe 0.0 0.0 0.0 0.0 0.0 Total 0.11 (0.07) 0.08 (0.05) 2.93 (1.82) 5.58 (3.47) 0.02 (0.012)
n
aBased on Cummins L 10 Engine (Kitchen and Damico. 1992). bElectric bus energy consumption estimated to be 1.9 kWh/mile (1.18 kWh/km) (Hartman, 1993). emissions data based on data from SCEVC (1992) and Hamilton (1992).
cElectric bus energy consumption estimated to be 1.2 kWh/mile (.75 kWh/km) (Gleason, 1992), emissions data based on data from SCEVC (1992) and Hamilton (1992).
Tailpipe emissions for the CNG buses are based on the engine manufacturer's estimates
in grams per brake-horsepower-hour (Turner, 1994). Using a conversion factor determined by
Kitchen and Damico (1992), grams per brake-horsepower-hour are converted to grams per
kilometer (mi) for a vehicle operating in the central business district (CBD) driving cycle. The
CBD driving cycle attempts to simulate driving in a dense urban environment with the vehicle
operating at an average speed of 19.9 kmlhr (12.4 mph).
Diesel bus fuel cycle emissions are based on Darrow's emission estimates for a gasoline
powered vehicle. (Darrow did not include a diesel-powered vehicle in his stUdy.) Estimates for
diesel bus emissions are adjusted to reflect the fuel economy differences of the diesel buses
compared to the gasoline van used in Darrow's study.
Tailpipe emissions for the diesel buses are based on Kitchen and Damico's study. In
their study, emissions per kilometer (mi) are determined for a diesel bus operating with an engine
48

comparable to those in Capital Metro's diesel buses. The emissions are estimated using the CBD
driving cycle.
Electric vehicle emissions are based on emissions associated with feedstock extraction
and electricity generation. There are zero tailpipe emissions associated with electric buses.
Feedstock extraction emissions include emissions from mining and drilling, and
emissions from the transport of feedstock fuel. These estimates are based on Darrow's study.
Darrow's study estimates the emissions in grams per mile based on an electric van with an
electricity consumption rate of 0.30 kWh/km (0.48 kWh/mi). Darrow's estimates of emissions on a
per mile basis are increased for use in this study to appropriately reflect the greater electricity
consumption of the electric buses.
Emissions from electricity generation vary depending on the fuel used to produce
electricity. In Austin, approximately half of the electricity is produced by the Holly and Decker
natural gas power plants. The other half is usually produced by the Fayette plant, which is coal
fueled, or purchased from other Texas utilities. Austin is also a partner in the South Texas
Project, a nuclear power plant which has not been in operation since February 1993. Although
the plant has recently been brought back on line, the percentage of power that it will supply to
Austin is currently unknown. For this study, half of the electricity is assumed to be produced from
natural gas-powered plants and half is assumed to be produced from coal-powered plants.
Estimates of emissions from these power plants are used to determine the electric bus emissions
per kilometer (mi) due to electricity generation.
Damage Costs Due to Emissions
Table 5-5 presented pollutant cost damage estimates. The Massachusetts Department
of Public Utility estimates are significantly different than the estimates of the other three studies.
It was not possible within the scope of this study to determine the cause of these differences.
Therefore, an average cost based on the studies by Small, Haugaard, and Ottinger is used for
each pollutant. Pollutant damage values calculated are 0.0024 e/gram for carbon monoxide,
0.0339 e/gram for hydrocarbons, 0.133 e/gram for nitrogen oxides, 0.241 e/gram for sulfur oxides,
and 0.154 e/gram for particulates.
Based on the previous values and the values given in Table 5-6, the damage costs of
pollutants are calculated per distance of operation for the buses. These damage costs are based
only on emissions from the tailpipe of the vehicles and from the generation of electricity. Table 5-
7 presents the pollutant damage per kilometer (mi) estimates.
49

Table 5-7 Pollutant Damage Costs per km (mi) of Operation
Capital Metro 0.0057¢ 0.0394¢ 1.1520e 0.2936¢ 0.0158~ 1.5068¢ CNG (0.0091¢) (0.0634¢) (1.8540c) (0.4724¢) (0.0255¢) (2.4244<t)
Capital Metro 0.0407<t 0.0628¢ 2.3980c 0.0405e 0.2965¢ 2.8383<t Diesel (0.0655¢) (0.1010¢) (3.8583¢) (0.0651<t) (0.4770¢) (4.566ge)
CARTA 22' 0.0002¢ 0.0025¢ 0.3810¢ 1.1833C 0.0020¢ 1.5691¢ Electrica (0.0004<t) (0.0041 e) (0.6131 <t) (1.9039¢) (0.0032<z:) (2.5247¢)
MTD 22' 0.0002¢ 0.0017<t 0.2422¢ 0.8358<t 0.0019¢ 1.0817¢ Electricb (0.0003<t) (0.0027¢) (0.3897<z:) (1.3448e) (0.0031<z:) (1.7406¢)
aElectric bus energy consumption estimated to be 1.18 kWh/km (1.9 kWh/mil (Hartman, 1993). bElectric bus energy consumption estimated to be .75 kWh/km (1.2 kWh/mil (Gleason. 1992).
ANALYSIS
The Federal Transit Agency (FTA) requires that buses purchased with their assistance
operate a minimum of 804,500 km (500,000 mi) or 12 years. For the purpose of this analysis, it is
assumed that all buses analyzed are operated for 804,500 km (500,000 mi), at which time they
are retired and retain no value.
Two cost scenarios are considered. The first evaluates the total cost to purchase and
operate buses based on capital costs, fuels costs, and maintenance costs presented in Tables 5·
1 through 5-3. The second scenario evaluates total costs based on the previous three factors as
well as damage due to pollutants.
Refueling infrastructure and operating costs are not considered in either scenario,
although it is important to note that these costs can have a significant impact on the cost of bus
operations. Construction costs for Capital Metro's CNG refueling station were approximately 2.7
million dollars, and operating costs for the station are approximately 2.6<z:/liter (1 O<t/gal) equivalent
of fuel distributed.
Total Costs Based on Capital, Fuel, and Maintenance Costs
The first scenario evaluates the costs for Capital Metro's 12.2 m (40 ft) TMC CNG bus,
10.7 m (35 ft) diesel-power Gillig Phantoms, and 10.7 m (30 ft) diesel-power Gillig Phantoms;
CARTA's 9.4 m (31 ft) and 6.7 m (22 ft) electric buses; and MTD's 6.7 m (22 ft) open air shuttle.
50

The purchase costs of the buses are added to the fuel costs and maintenance costs of operating
each bus for 804,500 kilometer (500,000 mi). (Capital Metro's 1993 Chance Trolley is not
included in either scenario because an actual purchase price is unknown and maintenance costs
for the trolley are not available.)
Table 5-8 presents the results. Total cost of purchase and operation is lowest for the
three electric bus models. Over a lifetime of 804,500 km (500,000 mi), electric buses generate a
fuel cost savings of $65,000 compared to diesel buses and $30,000 compared to CNG buses.
Maintenance cost savings for the electric buses compared to diesel and CNG buses are
approximately $16,000.
On a cost per passenger seat basis, electric buses compare less favorably with diesel
and CNG buses. The 12.2 m (40 ft) CNG bus and the 10.7 m (35 ft) diesel bus had the lowest
costs per passenger seat. Costs per passenger seat for the electric buses are comparable to
those for the CNG trolley and the 10.7 m (30 ft) diesel bus.
It should be noted that bus ridership rarely reaches the maximum seating capacity of the
bus. In many cases, larger diesel and CNG buses can be replaced with electric buses. In these
cases, electric buses offer a costs savings, based on purchase, maintenance, and fuel costs,
compared to diesel and CNG buses. Moreover, infrastructure costs are not included for CNG or
diesel.
Total Costs Including Pollutant Costs
The second scenario includes all of the costs from the first scenario as well as the
pollutant damage costs. Table 5·9 presents the results of adding the pollutant damage costs into
the total cost of operating the CNG, diesel, and electric buses. Pollutant damage costs that were
computed for CARTA's 6.7 m (22 ft) electric bus were also applied to CARTA's 9.4 m (31 ft)
electric bus. Although the exact number of kilowatts per mile required by the 9.4 m (31 ft) bus
was not known, CARTA estimated that it should be close to that of the 6.7 m (22 ft) electric bus.
Pollutant damage costs had greatest adverse affect on the operating costs of the diesel
buses. Pollutant damage costs for CARTA's electric buses are nearly equivalent to those of the
CNG bus, and MTD's electric shuttle's pollutant damage costs are the lowest of all buses
evaluated.
The use of the pollutant damage cost estimates must be done with some caution. Values
placed on the damage of pollutants is very subjective. While approximate values may be
attempted, it's rare that two studies of pollutant damages yield very similar results.
51

The operating costs over a 804,500 kilometer (500,000 mi) life of all three electric bus
models presented in table 5-9 are substantially lower than those of the CNG and diesel buses on
a total cost basis. Transit agencies that find a 22-passenger bus will suit the needs of a particular
route served by a 29-passenger diesel bus may find their total yearly savings compared to the
diesel to be from $129,750 to $144,150 if the value of pollution reduction is considered.
The costs per passenger seat for the electric buses are still high relative to the cost per
passenger seat for the CNG and diesel buses, even with the savings in pollutant costs. The 9.4
m (31 tt) and 6.7 m (22 tt) electric buses still represent the highest costs per passenger seat at
$19,804 and $18,868 per passenger seat respectively. The TMC RTS 12.2 m (40 tt) CNG bus
has the lowest cost per passenger seat at $13,954. Importantly, this latter figure does not include
the cost of fueling or maintaining CNG refueling infrastructure. Including the CNG station
development and operating costs, estimated to be about $0.30 per gallon equivalent (DOE,
1988), increases the total cost of the CNG bus to $621,428, or $15,157 per passenger seat.
52

01 c.u
Table 5-8 Total Cost Based on Capital, Fuel, and Maintenance Costs
12.2 m (40') eNG Bus $247,000 I 8.1¢ (13¢a) 30.8¢ (49.6¢e) I $560,000 $13,658
10.7 m (35') Diesel Bus $187,000 I 12.4¢ (20¢b) 30.8¢ (49.6¢e) I $535,000 $13,718
9.1 m (30') Diesel Bus $174,000 I 12.4¢ (20¢b) 30.8¢ (49.6¢e) I $522,000 $18,000
I 9.4 m (31 ') Electric Bus $225,000 3.2¢ (5.1 ¢C) 28.9¢ (46.4¢~ $482,500 $19,680
I 6.7 m (22') Electric Bus $145,000 3.2¢ (5.1 ¢C) 28.9¢ (46.4¢~
6.7 m (22') Electric I 4.4¢ (7¢~ I 28.9¢ (46.4¢~ Shuttle $125,000
aBased on average Capital Metro CNG fleet fuel costs. bBased on average Capital Metro diesel fleet fuel costs. CAverage value of CARTA's high and low end fuel costs estimate. dMTD estimate.
$402,500 $18,727
$392,000 $17,818
eMaintenance costs are based on Capital Metro's 1994 fleet maintenance budget. fMaintenance costs are based on CARTA's 6.7 m (22 ft) and are assumed to be the same for the Advanced Vehicle Systems 9.4 m (31 ft) bus and the Bus Manufacturing, U.S.A. Inc. 6.7 m (221t) shuttle.

~
Table 5-9 Total Cost Including Pollutant Damage Costs
12.2 m (40') eNG I $247,000 1 8.1 ¢ (13¢a) 30.8¢ (49.6¢e) 11.51 ¢ (2.42¢) I
10.7 m (35') Diesel I $187,000 I 12.4¢ (20¢b) 30.8¢ (49.6¢e) 12.84¢ (4.57¢}I
9.1 m (30') Diesel I $174,000 I 12.4¢ (20¢b) 30.8¢ (49.6¢e) \ 2.84¢ (4.57¢) I
9.4 m (31') Electric Bus \ $225,000 1 5.1¢c (3.2¢) 28.9¢ (46.4¢f) 11.57¢ (2.52¢) I
16.7 m (22') Electric Bus I $145,000 I 3.2¢ (5.1¢C) 28.9¢ (46.4¢f) \1.57¢ (2.52¢) I
6.7 m (22') Electric I $125,000 1 4.4¢ (7¢d) r 28.9¢ (46.4¢f) 11.08¢ (1.74¢)\ Shuttle
aBased on average Capital Metro CNG fleet fuel costs. bBased on average Capital Metro diesel fleet fuel costs. c Average value of CART A's high and low end fuel costs estimate. dMTD estimate. eMaintenance costs are based on Capital Metro's 1994 fleet maintenance budget.
$572,100
$557,850
$544,850
$495,100
$415,100
$400,700
$13,954
$14,304
$18,788
$19,804
$18,868
$18,214
fMaintenance costs are based on CARTA's 6.7 m (22 ft) and are assumed to be the same for the Advanced Vehicle Systems 9.4 m (31 ft) bus and the Bus Manufacturing, U.S.A. Inc. 6.7 m (22 ft) shuttle.

CHAPTER 6. CONCLUSION
SUMMARY
The goals of this study are to determine the technical and economic feasibility of electric
bus operations. Technical feasibility can be measured through objective criteria such as range,
maximum speed, and size of an electric bus. Determining economic feasibility presents a great
deal more difficulty. Valuing the monetary benefit from emissions reductions is very inaccurate as
displayed by the disparity in results of the pollutant costs studies discussed in this chapter.
Several economic factors which contribute to the feasibility of electric bus operations were not
considered in this study. Benefits of a reduction in dependence on foreign oil resulting from the
use of electric vehicles, energy conservation, and decreases in noise pollution are all valuable
attributes of battery-powered electric buses which are extremely difficult, if not impossible, to
accurately assign monetary values.
Based on the review of current technology and use of electric buses in Chapters 2 and 3,
this study concludes that electric buses are technically feasible for operation in transit services.
As discussed in Chapter 3, electric buses provide adequate range, speed, and size to service a
variety of routes. Transit officials must be fully aware of the limitations of the buses, however,
and be sure to select routes suitable for electric bus operations. One such decision process for
route selection is presented in Chapter 4.
Based on the analysis in Chapter 5, operation of electric buses can prove to be
economically feasible if their smaller passenger seating capacity is adequate to serve present
demand. The fuel and maintenance costs of electric buses are below those of diesel and natural
gas buses, and over their expected service life the fuel and maintenance savings can make
electric buses an attractive alternative fuel option. However, there are many additional costs that
are associated with implementing new technologies that need to be considered before a
determination can be made regarding the economic feasibility of electric buses.
RECOMMENDATIONS
Although this study concludes that electric bus operations are technically feasible at this
time, the economic feasibility of electric buses is less certain. There are several costs which this
study did not attempt to quantify. Transit agencies operating electric buses expressed concern
over the number of hours that management has devoted to the implementation of the electric
buses. Costs for familiarizing drivers and mechanics with the buses are higher than if an agency
were to convert to CNG or other alternative fuel which utilizes an internal combustion engine
55

similar to a diesel engine. Schedulers and planners must be cognizant of electric bus limitations,
such as range and maximum speed, and take these into account when determining a route and
its service schedule. Although electric buses may prove to be feasible, the management of a
transit agency will have to be fully committed to the idea of implementing electric buses, if only on
a small scale, for the buses to be successful. A high initial investment in capital and training will
need to be made, but over time, as technology develops and transit personnel gain experience,
electric buses may not only reduce pollution but transit expenses as well.
56

APPENDIX A
CAPITAL M ETROPOLIT AN TRANSPORTATION AUTHORITY
SERVICE ROUTES
57

58

Table A-1 Metro Routes
lilllllllllt._i:11t~i: •• litiS""
1 North Lamar Large Everyday 5:40am 12:25 am
2 Rosewood Large Everyday 5:34 am 11:39 pm
3 Burnet Large Everyday 5:10 am 12:39 am
4 Montopolis Large Everyday 4:57 am 11:43 pm
5 Woodrow Large Everyday 5:40am 11 :50 pm
6 East 12th Large Everyday 5:28 am 11:58 pm
7 Duval Large Everyday 5:16 am 11 :32 pm
8 Govalle Large Everyday 5:05 am 12:12 am
9 Enfield Large Everyday 6:04 am 10:44 pm
10 South First Large Everyday 5:28 am 11:21 pm
12 Manchaca Large Everyday 5:30 am 12:26 am
13 South Congress Large Everyday 5:30 am 12:12 am
Large/ Weekdays/ 14 Travis Heights Small Saturday 6:07 am 10:32 pm
15 Red River Large Everyday 5:40 am 12:19 am I
South Fifth/ 16 Westgate Large Everyday 5:40am 12:01 am
17 Johnston Large Everyday 5:20 am 12:57 am
Martin Luther 18 King Large Everyday 5:17 am 12:13 am
Weekdays/ 19 Bull Creek Large Saturday 5:25 am 10:26 pm
Manor Rd/ 20 LBJ H.S. Large Everyday 5:04 am 12:27 am
Large/ 21 Exposition Shuttle Everyday 5:08 am 10:34 pm
Large/ 22 Chicon Shuttle Everyday 5:16 am 10:18 pm
25 Ohlen Large Everyday 6:03 am 10:31 pm
59
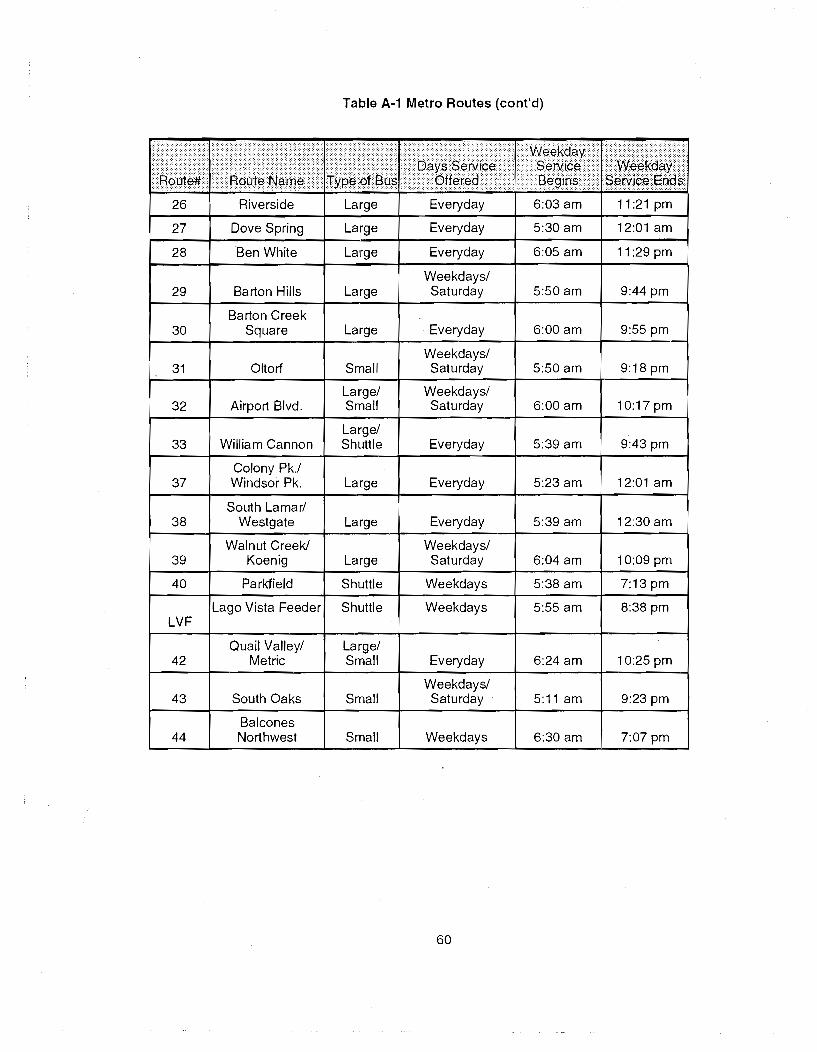
Table A~1 Metro Routes (cont'd)
;!"t~~~llf~~I~!~~~~:i!.~IJ!!i~IIII~~'i~~!i!;li~~~~I:!iliil~~~, I 26 Riverside Large Everyday 6:03 am 11:21 pm
27 Dove Spring Large Everyday 5:30 am 12:01 am
28 Ben White Large Everyday 6:05 am 11 :29 pm
Weekdays! 29 Barton Hills Large Saturday 5:50 am 9:44 pm
Barton Creek 30 Square Large Everyday 6:00 am 9:55 pm
Weekdays! 31 Oltorf Small Saturday 5:50 am 9:18 pm
Large! Weekdays! 32 Airport Blvd. Small Saturday 6:00 am 10:17 pm
Large! 33 William Cannon Shuttle Everyday 5:39 am 9:43pm
Colony Pk.l 37 Windsor Pk. Large Everyday 5:23 am 12:01 am
South Lamar! 38 Westgate Large Everyday 5:39 am 12:30 am
Walnut Creek! Weekdays! 39 Koenig Large Saturday 6:04 am 10:09 pm
40 Parkfield Shuttle Weekdays 5:38 am 7:13 pm
Lago Vista Feeder Shuttle Weekdays 5:55 am 8:38 pm LVF
Quail Valley! Large! 42 Metric Small Everyday 6:24 am 10:25 pm
Weekdays! 43 South Oaks Small Saturday 5:11 am 9:23 pm
Balcones 44 Northwest Small Weekdays 6:30 am 7:07 pm
60

- Table A-1 Metro Routes (cont'd)
Copperfield
Saturday
Everyday 5:31 am 11 :14 pm
Talble A-2 Flyer Routes
62 Weekdays
63 Weekdays
64 Large Weekdays.
65 Large Weekdays
66 Large Weekdays 6:03 pm
Weekdays 5:51 pm
Table A-3 Express/Park & Ride Routes
N EX North East Express 6:23 pm
PX Pflugerville Express Large 6:25
5:38 am 9:17 pm
61

Table A·4 'Qillo Routes
Weekdays/ 85 'Dillo Saturday 6:30 am 7:11 pm
86 'Dillo Weekdays 6:30 am 7:13 pm
87 Weekdays 6:44 am 9:37 pm
Table A·5 UT Shuttle Routes
Weekdays/ 48 Red River Large Sunday 7:15 am 11 :05 pm
Weekdays! 49 South Riverside Large Sunday 6:45am 11 :05 pm
Weekdaysl 50 West Campus Large Sundays 7:15 am 11:00 pm
Weekdays! 51 Cameron Road Large Sunday 7:15 am 11:05 pm
Weekdays/ 53 Enfield Road Large Sundays 7:15 am 11:00 pm
54 Forty Acres Large Weekdays 7:30 am 5:45 pm
Weekdays! 55 Far West Large Sunday 6:45 am 11 :05 pm
Intramural Weekdays! 56 Fields Large Sunday 6:45am 11:00 pm
Weekdays! 57 Lake Austin Large Sundays 7:15 am 11:00 pm
58 North Riverside Large Weekdays 7:15 am 11:00 pm
Weekdays/ 59 Pleasant Valley Large Sundays 6:45 am 11 :00 pm
Weekdays! 60 East Campus Large Sundays 7:15 am 11:05 pm
I nuary 1994.
62

REFERENCES
Albee, Kathryn (1994). Personal communication, Capital Metropolitan Transportation Authority, Austin, Texas.
California Energy Commission (1991). Cost and Availability of Low-Emission Motor Vehicles and Fuels, California Energy Commission. August.
Capell, John (1994). Personal communication, Electric Vehicle Transit Institute. Chattanooga. Tennessee.
Capital Metropolitan Transportation Authority (1994). Bus Route Map, Austin, Texas, January.
Capital Metropolitan Transportation Authority (1994). Schedule Booklet, Austin, Texas, January.
Chernick, Paul and Caverhill. Emily (1989). The Valuation of Externalities from Energy Production, Delivery, and Use, Fall, 1989 Update, Report to the Boston Gas Company, PLC, Inc., December.
Darrow, K.G. Jr. (1992). Energy Utilization and Greenhouse Gas Emissions: Transportation Sector, Topical Report, Energy International, Inc., Bellevue, Washington, Report No, 9060R341, Prepared for the Gas Research Institute, Chicago, Illinois, June.
Darrow, Kenneth G. (1994). Light Duty Vehicle Full Fuel Cycle Emissions Analysis, Energy International, Inc., Bellevue, Washington, Report No. 99333R440, Prepared for the Gas Research Institute, Chicago, Illinois, April.
DeLuchi, Mark, et al, (1989). "Electric Vehicles: Performance, Life-Cycle Costs, Emissions, and Recharging Requirements," Transportation Research-A, Volume 23A, No.3, pp. 255-278.
DeLuchi, Mark (1991). Emissions of Greenhouse Gases from the Use of Transportation Fuels and Electricity, Center for Transportation Research, Argonne National Laboratory, Argonne, Illinois, November.
Doerschlag, Karin (1994). Personal communication, Santa Barbara Metropolitan Transit District, Santa Barbara, California.
Dugan, Thomas (1994). Electric Buses in Operation: The Chattanooga Experience. Transportation Research Board, 73rd Annual Meeting, Paper No. 940867, January.
Electric Power Research Institute (EPRI) (1989). The Chrysler Electric TEVan, Pamphlet EU.2022,6,89, Palo Alto, California.
Electric Power Research Institute (EPR I) (1992). USABC to Develop Advanced Batteries for Electric Vehicles, Technical Brief T8-100982, Palo Alto, California.
Electric Power Research Institute (EPRI) (1993), Personal communication, Palo Alto, California.
Electric Transit Vehicle Institute (1993), Driving the Future, (Information sheet), Electric Vehicle Transit Institute, Chattanooga, Tennessee.
63

Electric Vehicle Marketing Corporation (1992). Electric Vehicle Marketing Corporation. Electric Transit & Shuttle Buses, Electric Vehicle Marketing Corporation, Palm Desert, California.
Electric Vehicle Marketing Corporation (1993). Product Specifications, Palm Desert, California.
Electrosource, Inc. (1993). preliminary Specifications for the Horizon Battery, Effective 18 February 1993. Austin, Texas.
Faiz, Asif. et. al. (1990). Automotive Air Pollution, Issues and Options for Developing Countries, The World Bank, Washington, D.C., 1990,
Federal Highway Administration (1984). State Highway Cost-Allocation Guide, Volume II: Technical Appendix, U,S, Department of Transportation, Washington, D.C.
Gleason, Gary (1992). "Santa Barbara Metropolitan Transit District Downtown-Waterfront Electric Shuttle," MTD Technology News, Report #5, September 1, 1992.
Halvorsen. Robert and Ruby, Michael G. (1981). Benefit-Cost Analysis of Air-Pollution Control. D.C. Heath and Company, Lexington, Massachusetts.
Hamilton, William (1992). 1992 Electric Vehicle Technology and Emissions Update, Report Number BKI-92-1 00, Bevilacqua-Knight, Inc., Oakland, CA, April 30.
Hartman, Les (1993). Personal communication, Electric Transit Vehicle Institute, Chattanooga, Tennessee.
Haugaard, John (1981). "Measures of Air Pollution Costs Attributable to Motor Vehicle Travel," Technical Report 134, Iowa City: Institute of Urban and Regional Research, University of Iowa, December.
Hyndman, Louis D. (Chairman) (1992). Directions: The Final Report of the Royal Commission on National Passenger Transportation, Volume 4.
J.E. Sinor Consultants, Inc. (1993a). "Chrysler and Norvik Unveil Fast Charging System," The Clean Fuels Report, February, p. 163.
J.E. Sinor Consultants, Inc. (1993b). "GM Cancels Production Schedule for the Impact," The Clean Fuels Report, February, pp. 160-161.
J.E. Sinor Consultants, Inc. (1992). "Fuel Cell Bus Program Enters Second Phase," The Clean Fuels Report, February, pp. 175-177,
J.E. Sinor Consultants, Inc. (1991). "Natural Gas Hybrid Electric Bus Being Developed in Canada," The Clean Fuels Report. April, p. 163.
Kitchen, Matthew and Damico, William (1992). Development of Conversion Factors for HeavyDuty Bus Engines G/BHP-Hr to G/Mile, Technical Report EPA-AA-EVRB-92-01, U.S. Environmental Protection Agency, June 6.
Kist, Ross (1993). Personal communication. Georgia Power Corporation, Atlanta. Georgia.
Kost, Robert A. (1994), Personal communication, U.S. Department of Energy. Washington, D.C.
64

Litchtanski, Frank (1993). Personal communication, City of Monterey, Monterey, California.
Lowe, Jamie R. (1993). Personal communication, Nordskog Industries Inc., Redlands, Califorflia .
MacDougal. Ruth (1993). Personal communication, Sacramento Municipal Utility District, Sacramento, California.
Massachusetts Department of Public Utilities (1990). Investigation by the Department of Public Utilities on Its own Motion into Proposed Rules to Implement Integrated Resource Management Practice for Electric Companies in the Commonwealth, order dated August 31, 1990, and accompanying Rules Governing the Procedure by Which Additional Resources Are Planned, Solicited, and Procured by Investor-Owned Electric Companies, 220 Code of Massachusetts Regulation 10.00.
Ottinger, Richard L., et al. (1990). Environmental Costs of Electricity, Pace University Center for Environmental Legal Studies, New York.
Ross, Howard R. (1992). "Roadway Powered Electric Vehicle System Development in California," The Urban Electric Vehjcle Policy Options Technology Trends and Market Prospects, OECD/IEA, pp. 225-229.
Royer, Sylvain de (1992). "Integration of Electric Vehicles in an Urban Setting Geared to Transport Mobility," in The Urban Electric Vehicle, Policy Options. Technology Trends, and Market Prospects, OECDIIEA, pp. 187-188.
Siuru, Bill (1991). "Electric Vehicles: Getting the Lead Out," Mechanical Engineer, December, p. 37.
Small, Kenneth A. (1977). "Estimating the Air Pollution Costs of Transport Modes," Journal of Transport Economics and Policy, May.
South Central Electric Vehicle Consortium (SCEVC) (1992). A Report of Electrjc Vehicle Findings and Recommendations, August.
Swan, David H. (1990). "Electric Vehicle Technology," Presented at a conference entitled Automobiles and Their Alternatives: An Agenda for the 1990's, Boston, January.
Turner, C.E. (1994). Personal communication, Cummins Engine, Arlington, Texas.
U.S. Department of Commerce (1993). Survey of Current Business, U.S. Department of Commerce, Bureau of Economic Analysis, Washington D.C., Volume 73, Number 3, March.
U.S. Department of Energy (DOE) (1988). Assessment of Costs and Benefits of Flexjble and Alternative Fuel Use in the U.S. Transportation Sector. Progress Report One: Context and Analytical Framework, Washington, D.C., January.
U.S. Department of Energy (DOE) (1992). Electric and Hybrid Vehicles Program. 15th Annual Report to Congress for Fiscal Year 1991, Washington, D.C., April.
U.S. Environmental Protection Agency (EPA) (1993). National Air Quality and Emissions Trends Report. 1992, Research Triangle Park, North Carolina, October.
65

Young, Doyle (1994). Personal communication, Capital Metropolitan Transportation Authority, Austin, Texas.
Wang, Ouanlu and DeLuchi, Mark A. (1991). Comparison of Primary Energy Consumption by Gasoline Internal Combustion Engine Vehicles and Electric Vehicles, Division of Environmental Studies, University of California, Davis, TRB Paper No. 910804, January.
Wang, Ouanlu and Sperling, Daniel (1992). Energy Impacts of Using Electric Vehicles in Southern California, Institute of Transportation Studies, University of California, Davis, UCDITS-RR-92-13, May.
66

![& Alternative Fuel Bus & Motorcoach Operations Session...[CNG Fuel / Electricity] CNG & BEB Charging Infrastructure(s) Electric Bus Program – Performance Experience Implementation](https://static.fdocuments.us/doc/165x107/60837a3fdf358d36a14a4223/-alternative-fuel-bus-motorcoach-operations-session-cng-fuel-electricity.jpg)