Elections - Amazon Simple Storage Service (S3)Enter the Elections DemTool, also known by its...
25
Elections Election data management and analysis
Transcript of Elections - Amazon Simple Storage Service (S3)Enter the Elections DemTool, also known by its...

Elections
Election data management and analysis
Elections User Manual Election data management and analysis
1

Acknowledgements NDItech would like to thank Tim Akinbo and his stellar team at TimbaObjects, who built a remarkable data management system. From the NDI Elections team, Richard Klein has shepherded the system through many election days; his forceful, vocal support for legitimate elections is an inspiration. Michelle Brown, Michael McNulty, and Sunila Chilukuri on the NDI Elections team have also contributed significantly. This content is available under a Creative Commons AttributionShareAlike 4.0 International Public License. You are free to: Share — copy and redistribute the material in any medium or format; Adapt — remix, transform, and build upon the material for any purpose, even commercially. The licensor cannot revoke these freedoms as long as you follow the license terms. The license terms include: Attribution — You must give appropriate credit, provide a link to the license, and indicate if changes were made. You may do so in any reasonable manner, but not in any way that suggests the licensor endorses you or your use; ShareAlike — If you remix, transform, or build upon the material, you must distribute your contributions under the same license as the original; No additional restrictions — You may not apply legal terms or technological measures that legally restrict others from doing anything the license permits.
2

Table of Contents
Acknowledgements Table of Contents Background Introduction Activity Switcher
Account Administration Event management
Creating an event Editing an event Deleting one or more events
User account management Creating and editing user accounts Roles
Managing Forms Creating forms Building forms Quality assurance of forms Sending Text Messages
Managing Participants Importing and exporting participants Deleting participants Administrative Divisions Locations
Analyzing and Understanding Elections Data The Election Dashboard Managing Observer Data Using Checklist Reportss Filtering Checklist Data Editing Data Filtering Data
Critical Incidents Sending Bulk Text Messages to Observers The Messages Log
Message Flow Visualizations The Message Log Filtering Messages
Conducting Analysis
3

Background The Elections platform is one of NDI’s DemTools, webapps providing basic and easytouse solutions for common tech problems in the democracy and human rights space that help civic organizations and political institutions serve their fellow citizens more effectively. The Elections data management system was originally developed by NDI’s Elections and Technology Programs teams to streamline the gathering and analysis of election data, and ease information gathering by citizen observers. For many years, NDI has assisted civic organizations working to provide a credible, independent check on their countries’ elections. Domestic election monitoring, where local groups work to systematically evaluate the process and results of their own polls, has proven to be a potent check on electoral fraud. Citizens armed with a carefully considered checklist of elements to observe travel to one of a selected range of polling stations. Assigned to a station before it opens (often before the sun rises) until the final vote counting is done (sometimes by lantern light), these monitors carefully document the process. These reports are then consolidated and analyzed, enabling election analysts and political experts to determine what it all means. With so much information to be processed quickly and accurately in the pressure cooker of an often volatile political landscape, a database to gather and automate the processing, validation, analysis, and visualization of election day becomes indispensable. Enter the Elections DemTool, also known by its development name, Apollo. Elections was developed by Tim Akimbo in conjunction with NDI to support the 2011 Nigerian Presidential election. Since then, the Elections platform has been an instrumental part of the election monitoring process in countries including Zambia, Zimbabwe, Azerbaijan, Malawi,Tanzania, Uganda, Nigeria, and others. This manual is intended to outline the basic instruction for users attempting to input, analyze, and understand elections data using the Elections platform. For information on the process of citizen observation of elections, please refer to the work of NDI’s Elections team, particularly The Quick Count and Election Observation: An NDI Guide for Civic Organizations and Political Parties.
Introduction Note that the screenshots in this manual were taken from specific elections; what you see may vary based on your version. Elections is a data collection tool and has several components that need to be understood to fully make use of the software. In this user manual, we’ll walk through managing events and users in the database, creating and using forms, handling participant and report data, communicating with participants, and conducting analyses on the data.
4

Activity Switcher To get started, login to your account with your username and password. Once you are logged in, a dropdown menu will appear. If you have access to a number of different election events (for example, simulations and multiple election days) this will allow you to choose the the activity of the day. Click on ‘Go’ when you are ready to proceed.
Account Administration For managing your personal account, click on your username in the top right hand corner. This dropdown also contains the ‘Logout’ option to completely and securely log out of your account.
Apart from the main Elections interface, admin users have access to a separate interface that allows them to perform certain modifications to their deployment. The admin interface can be accessed using the account dropdown menu, as shown below:
5

The admin interface's navigation menu is shown above. The items perform the following functions: Apollo: Return to the main Apollo interface. Deployment: Change some settings for the deployment Event: Create, modify, and delete events User: Create, modify and delete user accounts Role: Create new roles and assign permissions accordingly
Event management
“Events” are different reporting periods around an election. Around a typical election, there may be longterm observation, trainings, simulations, election day, postelection collation, etc. Each may have different forms, be managed by different people, have different participants, and take place at different times. Events are the way the Elections system decides where to route incoming reports.
6
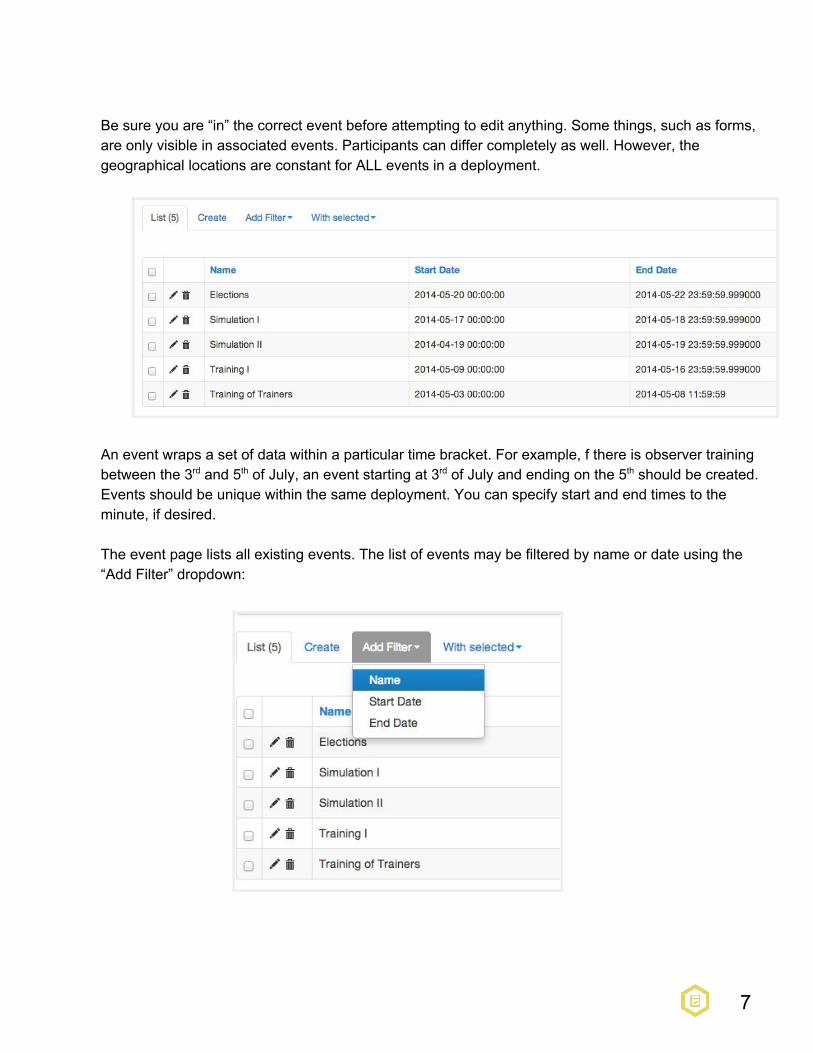
Be sure you are “in” the correct event before attempting to edit anything. Some things, such as forms, are only visible in associated events. Participants can differ completely as well. However, the geographical locations are constant for ALL events in a deployment.
An event wraps a set of data within a particular time bracket. For example, f there is observer training between the 3rd and 5th of July, an event starting at 3rd of July and ending on the 5th should be created. Events should be unique within the same deployment. You can specify start and end times to the minute, if desired. The event page lists all existing events. The list of events may be filtered by name or date using the “Add Filter” dropdown:
7

Creating an event
Events may be created by clicking on the “Create” tab. Please note that all fields are required.
Note that the times for “Start Date” and “End Date” are set to the time on your server which may be different from the time zone you are in. “Roles with Access” lets you set individual groups of system users (not observers) who can interact with the event. This would be useful if you had, for example, different groups of clerks managing information from different forms at the same time. Generally this would default to all roles in the system.
Editing an event
Each of the existing events can be modified by clicking on the pen icon on its row. Editing an event allows you change the name, start date and time and end date and time.
8

Deleting one or more events
Single events can be deleted from the event list view by clicking on the trash can icon on that row. WARNING: this permanently deletes an event and all its associated data, including participants/observers and submissions. To delete multiple events, check the checkbox on each event row, then click on the “With selected” dropdown and choose Delete.
User account management
Similar to event management, user accounts may be created by clicking on the “Create” tab, single user accounts might be deleted using the trash can icon, and multiple user accounts can be deleted by checking the boxes and using the “With selected...>Delete” dropdown.
9

NOTE: Do not delete the account of the currently loggedin user.
Creating and editing user accounts
When creating or editing user accounts, each account may be enabled or disabled using the “Active” checkbox. User roles may be assigned by clicking in the “Roles” box and selecting the desired roles multiple can be assigned for a given user. See the section below for more information on roles.
Inserting a value in the “New password” field for an existing user account overwrites the current account password. Leave this field empty if you just want to perform other operations on the account but not change the password. The Active box indicates whether an account can be used. If the “active” box is unchecked the account will be disabled and cannot be logged into, but will not be deleted. This is useful for preventing people from logging into the system for the time being but maintaining their information if needed in the future.
Roles The platform is typically operated by four classes of users, referred to as roles. The admin has total control over the site, able to use all of the site’s functions and make major setting changes, including other users.
10

Managing Forms The heart of the Elections system is the ability to collect and analyze structured data submitted by trained observers based on event checklists. There are two kinds of forms: standard checklists and critical incidents. Standard checklists describe the full voting process from opening to closing of polling stations. Critical Incident forms identify a major problem which is negatively affecting the full participation and expression of voter preference. Every observer will send data for the checklist form and some may submit incident form data, if necessary, per the occurrence of critical incidents. All information observers send back to the Elections database corresponds to a particular form. TIP: Note that forms must be associated with one or more events; to see or manage forms one must be in the correct event. If a form does not appear, switch to a different event.
Creating forms
11

From this page, you can create the forms your observers will essentially fill out and edit them appropriately.
Building forms
This is the form builder for creating the questions that observers will answer in their reports. Simply drag the type of question you’d like to have answered from the right column to the left, be it an openended, singlechoice, or multiplechoice query. When the question has been dragged, a box will pop up asking you to fill in more details.
12
All forms must have at least one section header, even if there is only one section. They are used internally by the system to manage the data collection. Question Names can not have spaces in them; they typically take the format AA, BC, etc. Comment fields can be used for smartphone or webbased data submissions, but are disabled for text messages. After forms have been built, checklists need to be constructed that unite your event participants with the forms they are supposed to complete.
Quality assurance of forms After data collection, the form submissions are automatically checked for errors and inconsistencies. Reports which do not validate will be rejected by the system with basic information to assist the observer in completing it correctly.
Sending Text Messages Describe the process of actually sending in a properly formatted message. Note Comments via @ work in every form and get appended into the notes
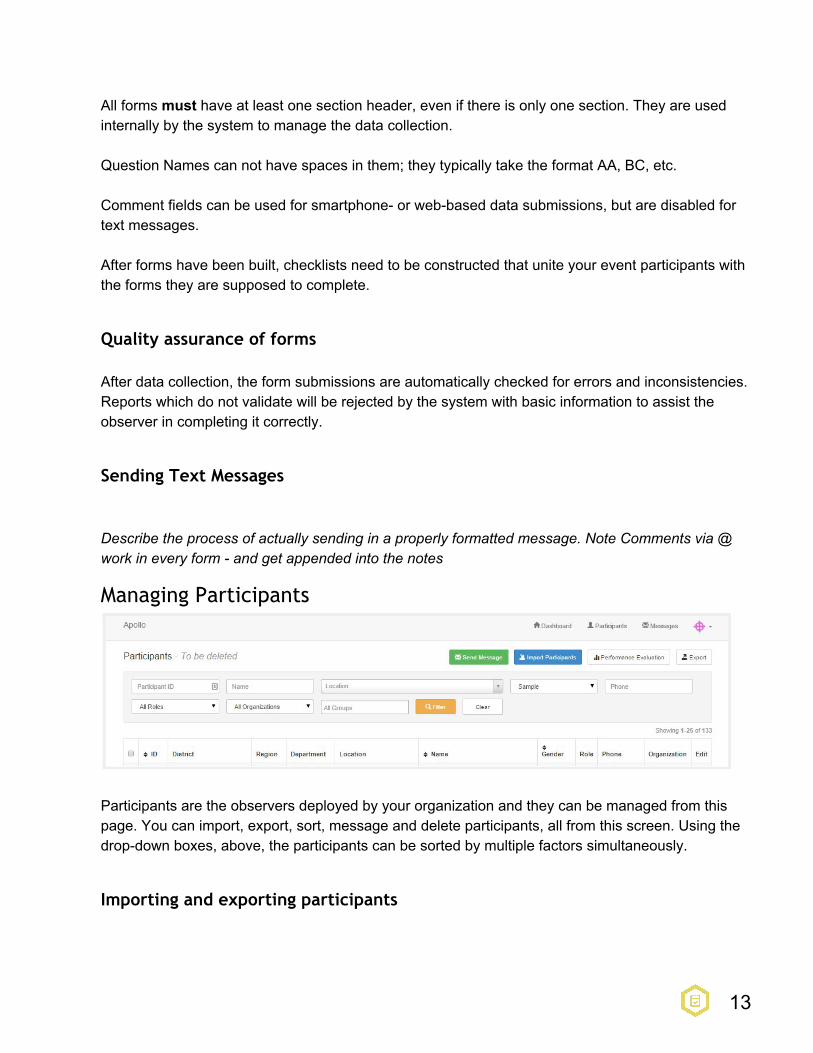
Managing Participants
Participants are the observers deployed by your organization and they can be managed from this page. You can import, export, sort, message and delete participants, all from this screen. Using the dropdown boxes, above, the participants can be sorted by multiple factors simultaneously.
Importing and exporting participants
13
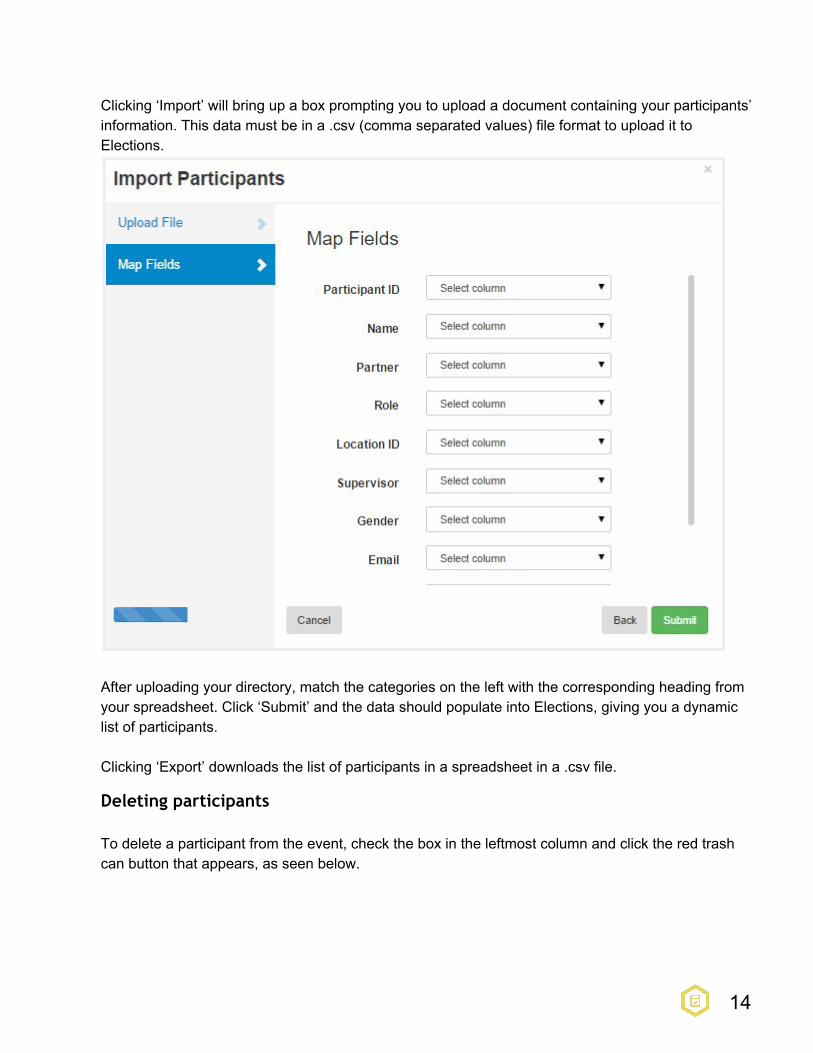
Clicking ‘Import’ will bring up a box prompting you to upload a document containing your participants’ information. This data must be in a .csv (comma separated values) file format to upload it to Elections.
After uploading your directory, match the categories on the left with the corresponding heading from your spreadsheet. Click ‘Submit’ and the data should populate into Elections, giving you a dynamic list of participants. Clicking ‘Export’ downloads the list of participants in a spreadsheet in a .csv file.
Deleting participants To delete a participant from the event, check the box in the leftmost column and click the red trash can button that appears, as seen below.
14

Administrative Divisions
This page allows you to create the organizational hierarchy for data reporting in the election. This represents the geopolitical levels with which you’re concerned in an election. In the United States, it might be wardcountycongressional districtstatenation. It must always include the top Nation level. More divisions can be added by clicking the ‘Add Division’ button and changes do require saving before exiting the page. The administrative divisions must be created prior to uploading the location data so Elections understands how to sort the incoming information. It is paramount that these levels match those in the CSV with your location data or else the upload will fail.
Locations
15
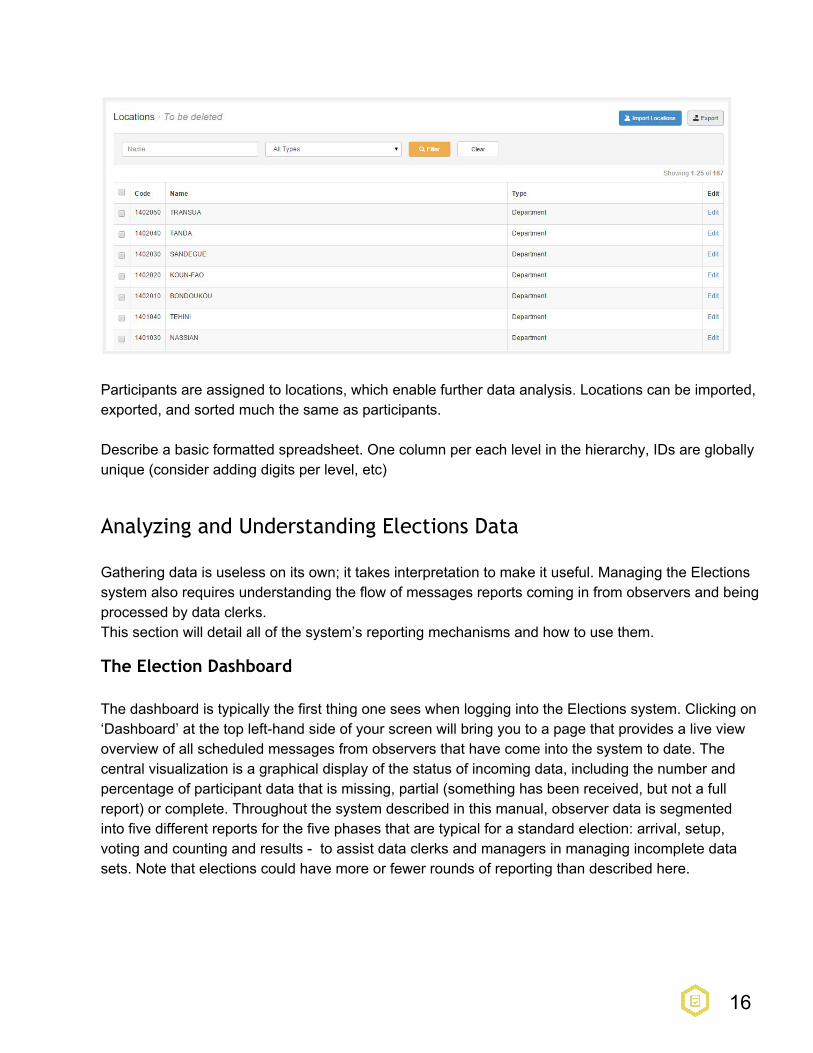
Participants are assigned to locations, which enable further data analysis. Locations can be imported, exported, and sorted much the same as participants. Describe a basic formatted spreadsheet. One column per each level in the hierarchy, IDs are globally unique (consider adding digits per level, etc)
Analyzing and Understanding Elections Data Gathering data is useless on its own; it takes interpretation to make it useful. Managing the Elections system also requires understanding the flow of messages reports coming in from observers and being processed by data clerks. This section will detail all of the system’s reporting mechanisms and how to use them.
The Election Dashboard The dashboard is typically the first thing one sees when logging into the Elections system. Clicking on ‘Dashboard’ at the top lefthand side of your screen will bring you to a page that provides a live view overview of all scheduled messages from observers that have come into the system to date. The central visualization is a graphical display of the status of incoming data, including the number and percentage of participant data that is missing, partial (something has been received, but not a full report) or complete. Throughout the system described in this manual, observer data is segmented into five different reports for the five phases that are typical for a standard election: arrival, setup, voting and counting and results to assist data clerks and managers in managing incomplete data sets. Note that elections could have more or fewer rounds of reporting than described here.
16

‘Missing’ data indicates that an observer has not submitted any data for the specified checklist, whereas ‘partial’ is used to indicate that an election monitor has submitted a portion, but not all, of the required data for a checklist (i.e. they have answered some questions, but have left others blank). A monitor’s data will not be counted as ‘complete’ until they have submitted all necessary data for that segment of the monitoring process. The data can be broken down by geographic unit, enabling you to identify specific areas with incomplete submissions. For information on how dashboard information can be filtered by the election data set, checklist or location, see the ‘Filtering Data’ section of this manual.
Managing Data Using Checklists Information on the data submitted by participant can be found by clicking on the link in the top toolbar that matches your targeted form. From here, you can see a checklist of the data submissions. The ‘checklists’ section of the Elections platform allows you to view, edit, and filter election data. Each line reflects an observer’s reporting at one unique polling station during a particular period of time (arrival, setup, voting, counting and results) and allows you to track the progress of an election.
17

The ability to evaluate an election requires having complete and accurate data from all of your designated polling stations. The checklist screen enables you to keep track of what information has come in at any point of the day. Data can be filtered by observer’s geographical location, ID and data completion status. A red circle is used to indicate fields with missing data, whereas a yellow triangle means that partial information is missing. A green circle indicates the data for that checklist is complete and a green check mark under the cell phone icon means that for reports received via text message, the number submitting the report matches the number on file for that observer. For more information on managing checklists, see the ‘Filtering Data’ section of this manual.
Editing Data From the ‘checklist’ section of the Elections platform, you can edit observation data by clicking on the ‘Edit’ icon on the right hand side of the page, as shown below.
18

Clicking on ‘Edit’ will bring you to a screen where you can view and alter the information submitted by an observer. Here, you can also add, edit or delete observer data for a checklist. Be sure to click ‘Save’ at the bottom of the page when you have finished entering all information.
19

Filtering Data The default view of the Election platform shows all data available from all election observers. The filter box shown below allows you to narrow that information or search for specific data.
The ‘Participant ID’ field in the filter can be used to jump directly to data submitted by an individual observers using their ID number. Using the ‘Location’ dropdown menu, you can also select the location you are interested in viewing, which might be a province, district or an individual polling station. The ‘Locations’ field has an autocomplete capability to match typing, so you can begin to enter the name of a desired location a province or polling station name, for example and the system will show you all entries that match. To further narrow the data in the Elections platform, you can filter by the completion status (i.e. missing, partial or complete) of the checklist you are interested in viewing (i.e. setup or voting). This is particularly useful when you are trying to contact observers whose data has not yet been received. Click on the ‘Clear’ button to return to your full data set and when you are done with a search. Otherwise, you will see incomplete and often confusing results. Note that variants of the same filter can be used on critical incidents, messaging and participant information.
Critical Incidents
20

Critical incidents are special reports submitted by observers, which aim to immediately draw attention to and possibly trigger action on an egregious violation of election processes or laws. Under ‘Critical Incidents’ in the navigation bar, you can view the number and type of critical incident that have been submitted by election observers. Similar to when viewing checklists, critical incidents are displayed using categories. Links are available to add a new incident or export data for sharing and you can also filter or search data based on a specified criteria, such as the status of the incident report.
On the incident report, a red circle indicates that a critical incident occurred in the selected category. A green checkmark under the eye icon indicates that the observer witnessed the incident, while a green checkmark under the phone icon indicates that a phone verification of the incident occurred. Similar to the checklist page, you can click on ‘Edit’ to change this information. You can also send a message to all persons who have submitted a critical incident form or filter desired recipients by status using this feature. Hovering your mouse over the letters shown below will provide a description of the incident category.
21

Sending Bulk Text Messages to Observers Under ‘Messages’ in the navigation bar, you can click on the ‘Send Message’ button to send a mass text message to select observers. Note that accessing the send message feature may require specific permissions and may not apply to your level of access. Using a filter can help you narrow down the recipients who will receive your SMS to those individuals who appear on your screen, for example, all those for whom the Setup message is marked as missing. Note that the “To:” line will always indicate the number who will receive a given message, so be sure that the number displayed matches the number in your target group. Also, be mindful that sending bulk text messages to observers costs money. You don’t want to spam your participants, so only send messages when appropriate. Note that to be able to send messages, the Elections platform will need to be linked to a bulk SMS management system like Clickatell or Telerivet or to an international or domestic short code provider.
22

The Messages Log The most common way for an Elections system to get information from observers is text message. To really . The message log shows in real time the flow of messages between the system and observers. Clicking on ‘Messages’ in the top right corner will take you to a record of the messages sent and received by your Elections site.
Message Flow Visualizations
The Message Log
Filtering Messages From here, messages can be sorted and tracked, allowing the user to see the volume of messaging and the flow over time, indicating for example when the bulk of observers have completed texting in.
Conducting Analysis Under ‘Analysis’ in the navigation bar, you can view a breakdown of all of the election data you are working with. You can view the process analysis by checklist data or by critical incident data. In the checklist analysis, you will see a breakdown of the checklists by questions and a representation of the completion status of each question. You can also filter the data based on region. In the example below for an “Arrival” checklist, a question with the SMS code AA reads as follows: Had the polling officials arrived at the polling station by 5:30am?
23
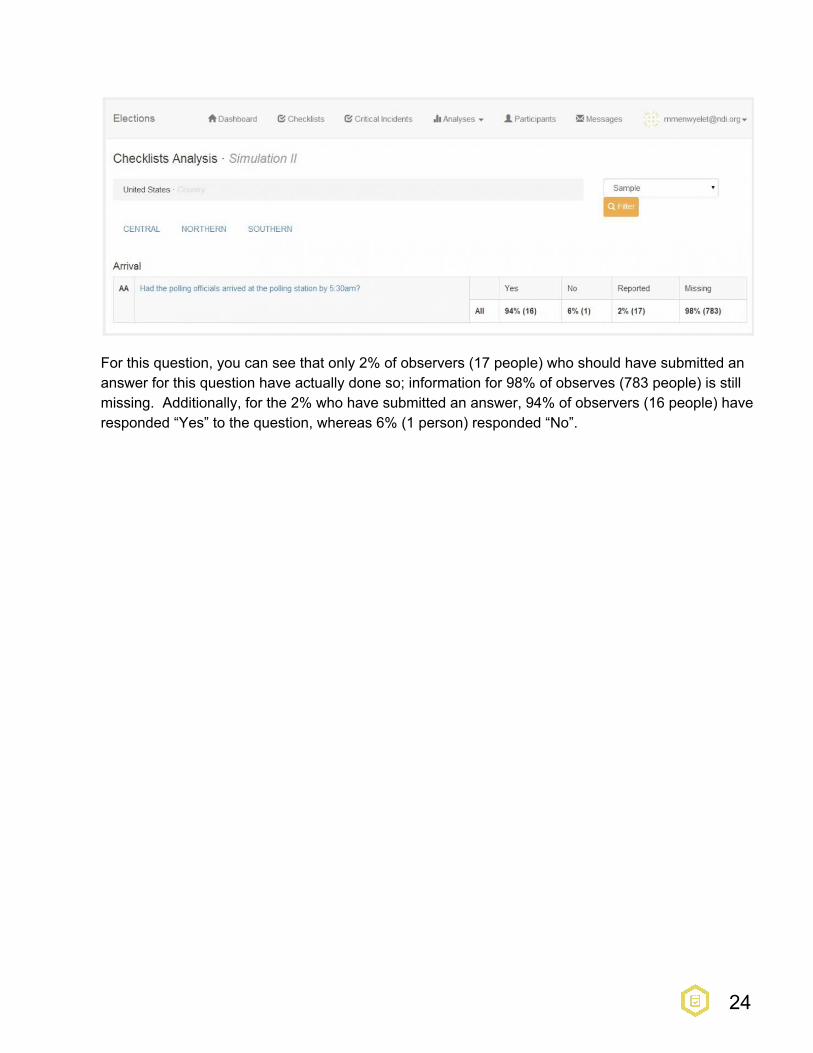
For this question, you can see that only 2% of observers (17 people) who should have submitted an answer for this question have actually done so; information for 98% of observes (783 people) is still missing. Additionally, for the 2% who have submitted an answer, 94% of observers (16 people) have responded “Yes” to the question, whereas 6% (1 person) responded “No”.
24