Elders Balmoral 2015 Ewe Drop Post Weaning Assessment€¦ · Elders Balmoral 2015 Ewe Drop Post...
22
Elders Balmoral 2015 Ewe Drop Post Weaning Assessment Within-Site Results Conducted by Elders Balmoral Sire Evaluation Group under the auspices of The Australian Merino Sire Evaluation Association Merino Lifetime Productivity Project Site June 2016 A revised report will be published when further data (including wether fleece results) becomes available.
Transcript of Elders Balmoral 2015 Ewe Drop Post Weaning Assessment€¦ · Elders Balmoral 2015 Ewe Drop Post...
Elders Balmoral
2015 Ewe Drop
Post Weaning Assessment
Within-Site Results
Conducted by
Elders Balmoral Sire Evaluation Group
under the auspices of
The Australian Merino Sire Evaluation Association
Merino Lifetime Productivity Project Site
June 2016
A revised report will be published when further data (including wether fleece results) becomes available.

Acknowledgement The Merino Lifetime Productivity Project is being undertaken in partnership between the Australian Merino Sire Evaluation Association Incorporated (AMSEA) and Australian Wool Innovation (AWI). AMSEA and AWI would like to acknowledge those entities who also contribute funding, namely Woolgrowers through sire evaluation entry fees, site committee in-kind contributions, and sponsors of AMSEA. A special acknowledgement is also made to the Australian Government who support research, development and marketing of Australian wool. Disclaimer
Australian Merino Sire Evaluation Association Incorporated (AMSEA) is funded by Australian Wool Innovation Limited (AWI) which gratefully acknowledges the funds provided by the Australian Government to support research, development and marketing of Australian wool. AMSEA sponsors, woolgrower entry fees and site committee in-kind contributions also contribute to AMSEA funding. The printing of this publication is funded by various advertisers and we thank them for their support. This publication should only be used as a general aid and is not a substitute for specific advice. To the extent permitted by law, AWI and AMSEA exclude all liability for loss or damage arising from the use of the information in this publication. © 2016 Australian Wool Innovation Limited and Australian Merino Sire Evaluation Association Incorporated. All rights reserved.
The Australian Merino Sire Evaluation Association has approved the format used in this report. Australian Sheep Breeding Values reported here are based on analyses conducted by Sheep Genetics.

Elders Balmoral 2015 Ewe Drop Post Weaning Assessment Page 1
Foreword
Elders Balmoral Sire Evaluation Group Central Test Sire Evaluation
The Elders Balmoral Sire Evaluation Trials aim to evaluate and promote leading sires suited to fine wool production in Western Victoria. This goal is achieved by informing participants, their clients and interested woolgrowers about the events surrounding the trials, and through producing and distributing annual reports and periodic newsletters. To further promote the evaluation, displays have been on show at the Australian Sheep & Wool Show now held in Bendigo (1998-2016), Balmoral Show and Hamilton Sheepvention. Since April 2000 successful annual open days have been held at “The Mountain Dam”, “Kerrsville”, “White Oaks”, “Arundale”, “Tuloona”,“Mokanger”, “Yiddinga” , “Wando Estate”, “Mepungah” and “Tuloona” to allow progeny inspections and to discuss the sire evaluation program with interested woolgrowers. In 1998 a small group of stud breeders met to form what is now known as the Elders Balmoral Victoria Sire Evaluation Group. The Sire Evaluation Trials commenced in 1998 and as of this year there will be 19 progeny drops: 1998 - 2016. All trials are run for a minimum of 2 years. The site planning and direction is provided by the Elders Balmoral Sire Evaluation Management Committee. Evaluations have been held on privately owned host properties around the Balmoral district progressing to a new property mostly every two years. Host properties run Merino fine wool ewes with genetics suitable for the district’s environment. 1998 & 1999 – “The Mountain Dam”, Balmoral 2000 & 2002 – “Kerrsville”, Balmoral 2002 & 2003 – “White Oaks”, Balmoral 2004 & 2005 – “Arundale”, Balmoral 2006 & 2007 – “Tuloona”, Harrow 2008 & 2009 – “Mokanger, Cavendish 2010 & 2011 – “Yiddinga”, Edenhope 2012 & 2013 – “Wando Estate”, Casterton 2014 – “Mepungah”, Wannon 2015 & 2016 – “Tuloona”, Harrow
Merino Lifetime Productivity Project Over recent years we have used the base trials to value add with additional trials. An example of this is the fertility analysis of sires from the 2010 drop progeny, a pedigree collection comparison in 2012 and now the Merino Lifetime Productivity Project (MLP) trials in 2015 and 2016. The MLP project is a partnership between AWI and AMSEA that aims to comprehensively explore lifetime relationships between wool production, carcase performance and fertility. For modern Merino selection systems to be successful we need to understand and accommodate the lifetime relationships between all these production elements - and there are current data gaps. The MLP is set to fill these gaps through increasing our understanding of the genetics of the modern Merino sheep over its lifetime, across different locations and genotypes. The Tuloona trial is one of four standard sire evaluation sites that will join via AI for two years and retain their ewe progeny for annual natural mating, classing and lifetime assessment. The sites will initially operate like a standard sire evaluation site – following the rigorous and independently assessed measured and visual assessment protocols. At the conclusion of the standard sire evaluation (once progeny is 18-24 months of age) AWI will support the ongoing measurement and visual classing of ewe progeny through 4-5 joinings and annual shearings. The number of ewes AI’d to each sire is increased to 90 ewes to ensure that there will be sufficient ewe progeny numbers per sire throughout life. More MLP information is available at www.wool.com.au/MLP.
Thank you to our hosts, sponsors, committee and participants for enabling this valuable assessment of Merino genetics. Tom Silcock Chairman - Elders Balmoral Sire Evaluation Group

Elders Balmoral 2015 Ewe Drop Post Weaning Assessment Page 2
2015 Drop Post Weaning Assessment
The information in this site evaluation report provides an update of the assessment of the 2015 drop, including the Post Weaning assessment of the sire's progeny performance for measured and visually assessed traits. The Post Weaning fleece and visual assessments were made at 7 months of age with 7 months of wool growth. Post Weaning shearing was conducted at 7.5 months of age with 7.5 months of wool growth.
Contents
Page
Foreword ................................................................................................................................................................. 1
Contents .................................................................................................................................................................. 2
Management Committee ......................................................................................................................................... 3
Sire and Owner Details ........................................................................................................................................... 4/5
Manager’s Report ................................................................................................................................................... 6
Assessment and Management Program .................................................................................................................. 7
Site Breeding Objective and Classer’s Visual Grade ............................................................................................. 8
Results
Summary Figure 1: Fleece Weight and Fibre Diameter ..................................................................................... 9
Figure 2: Classer’s Visual Grade: Tops and Culls ............................................................................. 9
Detail Understanding the results – Measured trait performance .............................................................. 10
Table 1: Measured Traits and Classer's Visual Grade ...................................................................... 11
Understanding the results – Scored trait performance ................................................................... 12
Table 2a: Wool Quality ...................................................................................................................... 13
Table 2b: Wool Quality and Pigmentation ......................................................................................... 14
Table 2c: Conformation ...................................................................................................................... 15
Table 2d: Breech ................................................................................................................................. 16
Other assessment results
Table 3: Sire Means for Measured Traits ......................................................................................... 17
Understanding the results – Information to assist the use of results
Accuracy of Flock Breeding Values (FBVs) ........................................................................................ 18
Link Sires ............................................................................................................................................. 18
Calculation of combined information ................................................................................................... 18

Elders Balmoral 2015 Ewe Drop Post Weaning Assessment Page 3
Management Committee
Tom Silcock (Chair) ............ ................................... 03 5388 2238 [email protected] Hugh Jarvis (Deputy Chair) .. ................................... 03 5588 6356 [email protected] Michael Craig (Treasurer and Host) ......................... 03 5588 1395 [email protected] Liz Mecham (Secretary) ....... ................................... 0407 015 059 [email protected] Nick Falkenberg (Host) ....... ................................... 0407 559 680 [email protected] Tom Sweeny ........................ ................................... 0419 362 173 [email protected] Andrew Howells .................. ................................... 0418 846 291 [email protected] David Whyte ........................ ................................... 03 5572 2266 [email protected] Jim Farran ............................ ................................... 03 5585 1888 [email protected] Mark Bunge ......................... ................................... 03 5579 7224 [email protected] Richard Beggs ...................... ................................... 03 5577 8222 [email protected] Richard McShane ................ ................................... 03 5574 2367 [email protected] Tony Kealy .......................... ................................... 03 5586 5252 [email protected] Steve Cotton ........................ ................................... 0447 352 321 [email protected] Peter Mecham ...................... ................................... 0408 279 823 [email protected] Sean Harvey ..............................................................0417 869 674 [email protected] Dale Bruns ........................... ................................... 0458 899 918 [email protected] Rosey Leeming ..................... ................................... 0408 704 243 [email protected] Russell Macgugan ................. ................................... 0438 314 390 [email protected] Scott Davis ............................ ................................... 0419 783 987 [email protected] Hamish Dickson .................. ................................... 0427 446 499 [email protected] Tom & Julia Waldron (Data collection) ...................03 5570 8359 [email protected] Daniel Rogers (Data Collection) ............................. 03 5388 2257 [email protected] Elise Kealy (Data Collection) ................................... 0448 600 525 [email protected] Jonno Hicks (Data Collection) ................................. 03 5392 2366 [email protected] Anthony Close (Data Collection) .............................0413 285 860 [email protected] Will Plush (Data Collection) ....................................0458 797 237 [email protected] Duncan Pixley (Data Collection) ..............................0437 222 433 [email protected] Amy Tierny (Data Collection) ..................................0427 555 027 [email protected]
For further information on this report please contact
Tom Silcock: ....................... ................................... 03 5388 2238 [email protected] Ben Swain: ........................... ................................... 02 6743 2306 [email protected]

Elders Balmoral 2015 Ewe Drop Post Weaning Assessment Page 4
Sire and Owner Details
Breeders flock, Sire name
Sire ID #, Breed †
Billandri Poll, 130087 (Link) Bill Sandilands600571-2013-130087, Poll Merino Billandri, Kendenup WA 6323
P: (08) 9851 4030, F: (08) 9851 4264, E: [email protected], 111424 (Link) Malcolm Peake504792-2011-111424, Merino Ravenswood, Boambolo Road, Yass NSW 2582
P: (02) 6227 1223, F: (02) 6227 1271, E: [email protected] Poll, 13V741 Peter and Gavin Lieschke601449-2013-13V741, Poll Merino Pine Ridge, RMB 123, Walla Walla NSW 2659
P: (02) 6029 0142, F: (02) 6029 0188, E: [email protected], 111265 Ross, Rick & Jill Baldwin504081-2011-111265, Merino Bundilla, Tubbul Road, Young NSW 2594
P: (02) 6383 3802, F: (02) 6383 3805, E: [email protected] Plus Poll, 207316 Robert Mortimer601250-2012-207316, Poll Merino Devondale, Tullamore NSW 2874
P: (02) 6892 8259, F: (02) 6892 8292, E: [email protected], 130941 Russell Jones503655-2013-130941, Merino Darriwell , 924 Darriwell Rd, Trundle NSW 2875
P: (02) 6869 9242, F: (02) 6869 9242, E: [email protected], 120042 Rod Miller504654-2012-120042, Merino 733 Victoria Valley Rd, Brimpaen VIC 3401
P: (03) 5383 9227, F: (03) 5383 9227, E: [email protected] Poll, 130599 Daryl Smith600240-2013-130599, Poll Merino Glenville, Cowell SA 5602
P: (08) 8628 5032, F: (08) 8628 5036, E: [email protected], 11.43 Jim Litchfield500383-2011-000043, Merino Hazeldean Pty Ltd, Cooma NSW 2630
P: (02) 6453 5555, F: (02) 6453 5526, E: [email protected], SR5681 Robert Close504173-2013-SR5681, Merino Kurra Wirra, 770 Moree-Culla Rd, Coleraine VIC 3315
P: (03) 5570 4238, F: (03) 5570 4234, E: [email protected] Poll, 090918 (Link) Andrew and Rosemary Michael600815-2009-090918, Poll Merino PO Box 31, Snowtown SA 5520
P: (08) 8865 2085, F: (08) 8865 2585, E: [email protected] Poll, 123153 Andrew and Rosemary Michael600815-2012-123153, Poll Merino PO Box 31, Snowtown SA 5520
P: (08) 8865 2085, F: (08) 8865 2585, E: [email protected] WA Poll, 100081 (Unreg) Ian Robertson609040-2010-100081, Poll Merino Merinotech (WA) Ltd, RMB 311, Kojonup WA 6395
P: (08) 9833 6251, F: (08) 9833 6255, E: [email protected], 120092 (Link) Richard McShane504888-2012-120092, Merino Mokanger Past Co, 711 Mokanger Road, Cavendish VIC 3314
P: (03) 5574 2367, F: (03) 5574 2328, E: [email protected], 100248 (Link) Mark Wootton504637-2010-100248, Merino 1874 Hensley Park Road, Hensley Park VIC 3315
P: (03) 5574 8246, F: (03) 5574 8262, E: [email protected]
Owner Details

Elders Balmoral 2015 Ewe Drop Post Weaning Assessment Page 5
Sire and Owner Details
Breeders flock, Sire name
Sire ID #, Breed †
Mumblebone, 130389 (Link) Chad Taylor500063-2013-130389, Merino Marapana, 456 Wuuluman Road, Wellington NSW 2820
P: (02) 6845 3620, F: (02) 6845 3608, E: [email protected], 130850 Chad Taylor500063-2013-130850, Merino Marapana, 456 Wuuluman Road, Wellington NSW 2820
P: (02) 6845 3620, F: (02) 6845 3608, E: [email protected] Nareeb, 130380 Richard Beggs500246-2013-130380, Merino 4395 Hamilton Chatsworth Rd, Nareeb VIC 3293
P: (03) 5577 8222, F: (03) 5577 8362, E: [email protected], 130467 John, Hamish and Jock McLaren503298-2013-130467, Merino Nerstane, Woolbrook NSW 2354
P: (02) 6777 5881, F: (02) 6777 5922, E: [email protected] Oak No. 2, R56 (Link) Graham Wells503855-2010-100R56, Merino 1763 Great Alpine Road, Smoko VIC 3741
E: [email protected] Park, 140019 (Link) Matthew and Cherie Coddington504166-2014-140019, Merino Glenwood, 39R Dilladerry Rd MS3, Dubbo NSW 2830
P: (02) 6887 7286, E: [email protected]
The Mountain Dam, 11/ESA004 Tom and Alison Silcock
504572-2011-ESA004, Merino The Mountain Dam, 429 Silcocks Road, Telangatuk East VIC 3401
P: (03) 5388 2288, F: (03) 5388 2235, E: [email protected]
Tuckwood Poll, 121021 Geoff Tucker
601053-2012-121021, Poll Merino PMB 21, Millicent SA 5280
P: (08) 8734 2050, F: (08) 8734 2052, E: [email protected]
Yalgoo, 120043 (Link) Jock Nivison
501552-2012-120043, Merino Yalgoo, PO Box 141, Walcha NSW 2354
P: (02) 6777 2088, E: [email protected]
Yiddinga, 130374 (Unreg) Jim Farran
509242-2013-130374, Merino PO Box 222, Edenhope VIC 3318
P: (03) 5585 1888, E: [email protected]
Owner Details
(Link) Sire evaluated to provide links between years and sites so that the all site results can be combined into a single
report, e.g., Merino Superior Sires. (Unreg) Sire bred in an unregistered flock.
# Sire ID provides a unique number for all sheep. A sire ID has 16 digits. - 2 for the breed of the flock, e.g., Merino (50), Poll Merino (60), Dohne (51), SAMM (48), Afrino (AF) - 4 for flock code, AASMB Registered flock code or unregistered code. - 4 for year of drop. - 6 for tag number used in the breeder’s records.
† Breed of flock in which the sire was born

Elders Balmoral 2015 Ewe Drop Post Weaning Assessment Page 6
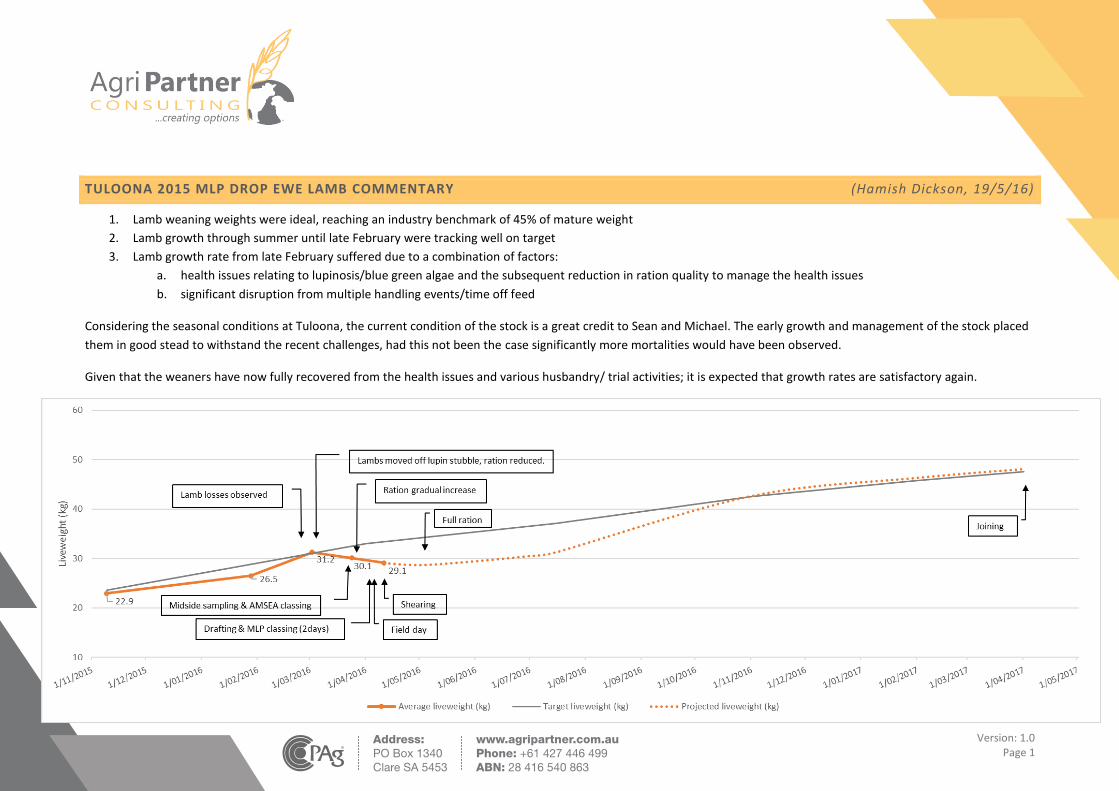
Manager’s Report Host Property for 2015 drop progeny and location “Tuloona” is operated by the Craig family and is located approximately 5km out of Harrow. Tuloona receives a winter dominated rainfall of approximately 470mm annually. Ewe Base The ewe base is a traditional super fine wool flock that has focussed over the past ten years on improving growth rate, wool cut and fertility whilst attempting to retain micron and quality. The mature ewe flock averages 17.2um and cuts 38kg/ha of clean wool (4.7kg at 63% yield, 2.96kg CFW) and weighing 52kg. Ewes for the Merino Lifetime Productivity project were selected from three age groups totalling 3,500 ewes. Selection was based on evenness. Joining Laparoscopic insemination of 2160 ewes was conducted by Genstock Jerilderie between the 23-26 March, 2015. 25 sires were inseminated. Ewes averaged approximately condition score 2.9 at joining. Owing to a mix up of semen at an AI centre, the semen sent for the Mumblebone sire was from two different Mumblebone sires. Both sires are reported in this report and the intended sire entrant has been re-joined and will have additional progeny in the 2016 drop. Pregnancy and lambing The ewes were pregnancy scanned on the 19 May, 2015. The results of which were disappointing with a relative low total number of foetuses. This was largely driven by a very low number of twin bearing ewes being scanned. In total, 67.3% foetuses to ewes joined were scanned. Ewes were split following pregnancy scanning with the single bearing ewes divided into heavy condition and light condition order to maximise lamb survival. It was also decided to lamb the single bearing ewes in groups of approximately 200 to increase the possibility of lamb survival. Ewes completed lambing at Tuloona in late August 2015. A total of 1268 lambs were tagged on 3 September. This represented 87% of the number of foetuses scanned. DNA samples were taken at tagging to determine sire and dam parentage. The lambs were marked at tagging and scored for breech traits. On 9 November the lambs were weaned with an average weaning weight of 23.4kg. Weaning to Post Weaning Assessment Lambs tracked well for growth rate and body weight gain from weaning until affected with lupinosis in March. Body weights collected early March averaged 31.2kg (up from 25.5 on 28/1/16 – 160 grams/day) with an average condition score of 2.98. A combination of managing the lupinosis and a number of trial activities further impact on growth as outlined in the appended report by Hamish Dickson, AgriPartner Consulting. With shearing completed and green feed now in front of them, all lambs are doing well. The challenge now will be to try to build WEC levels so we can obtain individual WEC samples. Seasonal conditions The Spring leading up to the Summer of 2016, has seen record rainfall deficiencies leading to many livestock water storages being dry for the first time ever. As a result, lambs have been heavily supplemented from weaning to May. Record low levels of dry matter and water availability are now being relieved with good recent seasonal rainfall.

Elders Balmoral 2015 Ewe Drop Post Weaning Assessment Page 7
Assessment and Management Program
Activity Date/s Age Wool
Selection of ewes February 2015
Allocation of ewes for mating March 2015
Pregnancy scanning 19 May 2015
Allocated to lambing paddocks 10 August 2015
Lambing: start – finish 16 – 23 August 2015
Lambing mobs boxed to one management group 3 September 2015 14 days
Tagging, pigmentation and breech scoring 3 September 2015 14 days
Marking 3 September 2015 14 days
Weaning 9 November 2015 81 days
Mid side fleece sampling • PW 17 March 2016 7 months 7 months
Visual trait scoring • PW 17 March 2016 7 months 7 months
Shearing • PW 11 April 2016 7.5 months 7.5 months
Fat and eye muscle scanning • Not yet measured
Worm egg count sampling • Not yet measured
Body weighing • W 9 November 2015 81 days
• PW 21 January 2016 5 months
• PW 11 April 2016 7.5 months
Drench Drenched at weaning. Worm burdens currently being monitored.
Fly treatment Treated with Clik® at marking. Progeny are not mulesed.
Supplementary feeding Silage, Barley and Lupins post weaning
Field day or public display of 2015 drop progeny
• Field Day & Progeny Display– April 2016 • Static display at Balmoral Show – March 2016

Elders Balmoral 2015 Ewe Drop Post Weaning Assessment Page 8
Visual trait assessment and site Breeding Objective
Visual trait assessment Classer’s Grade: Mr David Whyte, Elders Limited Trait Scores: Committee Site Breeding Objective used to assess the Classer’s Grades The Breeding Objective used by the classer/s when selecting the Classers Tops, Flock and Cull grades is described below. The Breeding Objective for both measured and visual assessed traits was developed by the site committee in consultation with the classer prior to the grading. Breeding Objective The goal is to select sheep that are productive and well grown, with sound conformation and carrying heavy fine wool fleeces of good character, colour and nourishment suitable for the western Victorian environment.
Sire Codes and Pedigrees
Sirecode
1 Billandri Poll, 130087 600571-2013-130087 509605-2009-0901222 Bogo, 111424 504792-2011-111424 Unknown3 Bundaleer Poll, 13V741 601449-2013-13V741 Unknown4 Bundilla, 111265 504081-2011-111265 504081-2009-0900445 Centre Plus Poll, 207316 601250-2012-207316 601250-2009-907538 (Centre Plus Poll, 907538)6 Darriwell, 130941 503655-2013-130941 503655-2011-0009527 Glenpaen, 120042 504654-2012-120042 503298-2009-090910 (Nerstane, 090910)8 Greenfields Poll, 130599 600240-2013-130599 600240-2010-1000879 Hazeldean, 11.43 500383-2011-000043 600553-2007-070002 (Coromandel Poll, ET2)10 Kurra-Wirra, SR5681 504173-2013-SR5681 504173-2010-SR486211 Leahcim Poll, 090918 600815-2009-090918 600815-2007-07031912 Leahcim Poll, 123153 600815-2012-123153 600815-2010-10100913 Merinotech WA Poll, 100081 609040-2010-100081 609040-2008-08857814 Mokanger, 120092 504888-2012-120092 504888-2009-00000415 Moojepin, 100248 504637-2010-100248 504637-2008-08120616 Mumblebone, 130389 500063-2013-130389 601365-2009-09039917 Mumblebone, 130850 500063-2013-130850 500063-2010-10018618 Nareeb Nareeb, 130380 500246-2013-130380 503855-2011-BL011519 Nerstane, 130467 503298-2013-130467 503298-2010-100919 (Nerstane, 100919)20 One Oak No. 2, R56 503855-2010-100R56 503855-2008-08000421 Roseville Park, 140019 504166-2014-140019 601050-2009-090853 (Stockman Poll, 090853)22 The Mountain Dam, 11/ESA004 504572-2011-ESA004 600792-2009-090576 (Mernowie Poll, 090576)23 Tuckwood Poll, 121021 601053-2012-121021 601082-2008-08137524 Yalgoo, 120043 501552-2012-120043 503298-2008-080121 (Nerstane, 080121)25 Yiddinga, 130374 509242-2013-130374 509242-2011-000076
Sire of SireSheep Genetics IDBreeders flock, Sire number

Elders Balmoral 2015 Ewe Drop Post Weaning Assessment Page 9
Figures 1 and 2. Summary Graphs – FW and FD, Tops and Culls
Figure 1. Fleece weight by fibre diameter (FBVs) The graph describes performance for fleece weight on the side axis and fibre diameter on the bottom axis. Sires that are above average for fleece weight and below average fibre diameter are located in the top left hand quarter.
1
2
3
4
5
6
7
89
10
11
1213
14
15
1617
18
19
20 2122
23
24 25
-25.0
-15.0
-5.0
5.0
15.0
25.0
-2.0 -1.0 0.0 1.0 2.0
Cle
an f
leec
e w
eigh
t (%
)
Fibre diameter (m)
Figure 1. Fleece Weight and Fibre Diameter (FBVs)
High YCFWLow YFD
Low YCFWHigh YFD
Mean PCFW: 1.2kg Mean PFD: 15.2um
Figure 2. Classer’s Visual Grade - Tops by Cull The graph describes performance for Classer’s Visual Tops Grade on the side axis and Culls Grade on the bottom axis. Sires that have above average Tops and below average Culls are in the top left hand quarter.
1
23
4
5
6
7 8
9
10
1112
13
14
1516
17
18
19 202122
23
24
25
-50
-40
-30
-20
-10
0
10
20
30
40
50
-30 -20 -10 0 10 20 30
Top
s %
(de
viat
ions
)
Culls % (deviations)
Figure 2. Classer's Visual Grade: Tops and Culls
Mean PTOPS: 27%Mean PCULLS: 28%
Low TopsHigh Culls
High TopsLow Culls

Elders Balmoral 2015 Ewe Drop Post Weaning Assessment Page 10
Understanding the Results Measured trait performance and Classer’s Visual Grade – Table 1
Breeders flock, Sire number: Identity of the breeder’s flock and the sire’s number or name.
Number of progeny: The number of progeny a sire had at the most recent measured analysis. Average number of progeny is included in Table 1.
Flock Breeding Values: Flock Breeding Values (FBVs) are Estimated Breeding Values (EBVs) calculated by Sheep Genetics for the sires evaluated in this report. Only data from this site evaluation is used in the calculation of these FBVs. FBVs describe the relative breeding value (genetic performance) of the sires (in this case based on the performance of their progeny). A sire’s progeny will express half of their sire’s FBV. FBVs do not necessarily reflect the sire’s observed performance, which is a combination of both genetic and environmental influences. FBVs are an estimate of the genetic component of the sheep’s performance. The highest performing sires for each trait (trait leaders) are highlighted by shading. Curvature is the possible exception when for many breeders the optimum score is in the middle of the range therefore trait leaders have not been highlighted.
Traits: Abbreviation, trait and the (units reported)
GFW: Greasy fleece weight (percentage). CFW: Clean fleece weight (percentage). FD: Average fibre diameter (micron). WT: Body weight (kilograms). FDCV: Fibre diameter coefficient of variation (percentage). SL: Staple length (mm) at the mid-side. SS: Staple strength (N/ktex) at the mid-side. EMD: Eye muscle depth (mm) at the ‘C’ site. FAT: Fat depth (mm) at the ‘C’ site. CURV: Fibre curvature (degrees). WEC: Worm egg count (% deviation in worm burden of sire’s progeny).
Age at assessment: W = Weaning - 42 to 120 days (6 weeks to 4 months of age). E = Early Post Weaning - 120 to 210 days (4 to 7 months of age). P = Post Weaning - 210 to 300 days (7 to 10 months of age). Y = Yearling - 300 to 400 days (10 to 13 months of age). H = Hogget - 400 to 540 days (13 to 18 months of age). A = Adult - 540 days or older (18 months and older).
Classer's Visual Grade: A classer grades all progeny as either Tops, Flocks or Culls based on their visual assessment of all traits relative to the site’s Breeding Objective. The percentage deviation from the average of Tops and Culls is presented in this report. Average percentage of Tops and Culls for the entire drop is included in Table 1. Page 8 provides more detail on Classer’s Visual Grade and the site’s Breeding Objective.

Elders Balmoral 2015 Ewe Drop Post Weaning Assessment Page 11
Table 1. Measured Traits and Classer’s Visual Grade
Numberof Tops Culls
Breeders flock, Sire name Ewe % %Progeny P P
Billandri Poll, 130087 16 16 -3Bogo, 111424 24 -12 3Bundaleer Poll, 13V741 29 -7 -7Bundilla, 111265 20 28 -8Centre Plus Poll, 207316 23 -19 22Darriwell, 130941 18 5 14Glenpaen, 120042 26 -12 7Greenfields Poll, 130599 22 -10 22Hazeldean, 11.43 26 28 -13Kurra-Wirra, SR5681 23 -8 28Leahcim Poll, 090918 27 -9 1Leahcim Poll, 123153 22 -4 -5Merinotech WA Poll, 100081 25 -1 -9Mokanger, 120092 19 -28 14Moojepin, 100248 21 -17 15Mumblebone, 130389 13 -12 -5Mumblebone, 130850 15 43 -28Nareeb Nareeb, 130380 25 23 -11Nerstane, 130467 25 -8 3One Oak No. 2, R56 36 -5 5Roseville Park, 140019 17 -4 -10The Mountain Dam, 11/ESA004 31 -2 -15Tuckwood Poll, 121021 29 4 -7Yalgoo, 120043 31 13 -11Yiddinga, 130374 26 -1 -5
-3.53.2
0.3
2.3-5.5-2.72.0-1.30.83.51.2-3.6
0.4
0.81.4-0.2-1.4-1.71.7-0.6-0.7-2.2-0.51.01.90.50.80.2-1.2-1.4
-210-2-3
1.1-1.1-0.60.7-0.80.6-1.0-0.1-0.50.10.10.10.0-0.61.40.31.30.4-0.7-0.6
-3 -0.7
14-9-211-52-3360
-12-6-7-26-505
13
4-1-3
-3 -1.1-3.46.7
-2 0.21 0.2
0.3-0.10.3-0.9
Classer's Visual Grade1
GFW CFW% % m
Post Weaning Flock Breeding Values (deviations)FDCV
%CURV
deg/mmWTkg
FD
0.2
1.3
1.2-0.9
0.1
-4.8-1.0
0.0-0.30.3-0.60.00.71.3 -1.1
3.3-2.4
-0.82.5
14-75-7
-10.84.94.4-2.00.3-3.68.0
-1 -2.8-2 -2.2
-4 5.28 2.7
-2.2
572
-13-6-6
-5 -1.2
-16
-2.4-1.34.8
-2.4-0.7
P^ P P P P0.3-1.2-0.2
W19-12-7
-0.7
-0.71.0-2.6-0.30.3-1.9-0.42.5-0.8
P
2.81.4-1.2-1.2-0.20.02.6-0.8
0.3
0.72.1-1.61.2-0.5
4.0
^ W = Weaning (42 to 120 days); P = Post Weaning (210 to 300 days); Y = Yearling (300 to 400 days); H = Hogget (400 to 540 days); A = Adult (540 days and older) 1 Classer’s Visual Grade is expressed as the percentage deviation of average Tops% and Culls%.

Elders Balmoral 2015 Ewe Drop Post Weaning Assessment Page 12
Understanding the results Scored trait performance – Tables 2a, 2b, 2c, 2d The following description of trait scores is a summary of the detailed word and diagrammatical description of these scores in Version 2 (2013) of the Visual Sheep Scores booklet that is available free from AWI or at www.merinosuperiorsires.com.au
A deviation from the average trait score for all progeny is reported as well as the percentage of the sire’s progeny recorded for each trait. Visually assessed traits reported were scored at their latest assessment with the exception of pigmentation which was scored at marking (Spot updated on an ongoing basis) and breech traits recorded at marking time (or later in unmulesed flocks with the exception of Dag and Urine).
■ Fleece rot: The severity of fleece rot from 1 (no fleece rot), 2 and 3 (bands of bacterial staining but no crusting), and 4 and 5 (bands of crusty fleece rot).
■ Wool colour: Greasy wool colour scored from 1 (whitest) to 5 (yellow).
■ Wool character: Definition and variation of crimp between and along the staple scored from 1 (well defined and regular) to 5 (undefined and large variation).
■ Dust penetration: Degree of dust penetration from 1 (only tip <6%) to 5 (71 to 100% of staple).
■ Staple weathering: The deterioration due to light and water from 1 (least, <6% of staple) to 5 (most, 71 to 100%) reflect the depth and degree of deterioration.
■ Staple structure: The size and diameter of each staple from 1 (<6mm) to 5 (>30 mm).
■ Fibre pigmentation: The percentage of dark fibres on any part of the sheep from 1 (0 pigmented fibres at any site) to 5 (71 to 100% pigmented fibres at one or more sites). This trait does not include random spot or recessive black.
■ Non-fibre pigmentation: The percentage of pigmentation on the areas not shorn from 1 (0 pigmentation at any site) to 5 (71 to 100% pigmented area on one or more bare skin sites, and/or 71 to 100% of the total hoof area).
■ Recessive black: (Black) Recessive black (black) is identified by relatively symmetrical markings on both sides of the face. There are two scores 1 (no recessive markings) and 5 (recessive markings). This trait does not include random spot or fibre pigmentation.
■ Random spot: (Spot) Random spot (spot) is identified by rounded wool or hair spot/s, not symmetrical. There are two scores 1 (no spot/s) and 5 (spot/s). If both sides of the face or body are spotted the sheep should be scored as a recessive black.
■ Face cover: Wool cover on the face scored from 1 (open face) to 5 (fully covered face).
■ Feet/Legs: Conformation of feet and legs scored from 1 (very straight) to 5 (very angulated).
■ Body wrinkle: The degree of body wrinkle from 1 (no wrinkle) to 5 (extensive wrinkle).
■ Jaw: The alignment of the lower jaw and its teeth relative to the top jaw from 1 (very well aligned) to 5 (heavily undershot or overshot).
■ Back/Shoulder: Conformation of the back and shoulder from 1 (very square) to 5 (very dipped or high).
■ Breech cover Size of natural bare area around the breech from 1 (large) to 5 (no bare).
■ Crutch cover Size of natural bare area in the pubic and groin from 1 (large) to 5 (no bare).
■ Breech wrinkle Degree of wrinkle at the tail set and hind legs from 1 (nil) to 5 (extensive).
■ Dag Degree of dag adhering to the breech and legs from 1 (nil) to 5 (extensive).
■ Urine Degree of urine stained wool in the breech area, including the hind legs from 1 (nil) to 5 (extensive).

Elders Balmoral 2015 Ewe Drop Post Weaning Assessment Page 13
Table 2a. Visual trait assessments – Wool Quality
Traits are reported as a deviation (Dev) from the average trait score for all progeny. The percentage of a sire’s progeny assessed for each score is also reported. No adjustments are made to the data to improve the accuracy of the results as is the case with sire means or breeding values.
For the majority of breeder’s objectives a negative deviation would be considered favourable and the larger the deviation the better.
Breeders flock, Sire nameDev 1 2 3 4 5 Dev 1 2 3 4 5 Dev 1 2 3 4 5 Dev 1 2 3 4 5
Billandri Poll, 130087 0.0 94 6 0 0 0 0.2 0 13 75 12 0 0.1 0 19 75 6 0 -0.4 0 50 44 6 0Bogo, 111424 0.0 100 0 0 0 0 0.2 4 15 58 23 0 -0.2 0 42 58 0 0 0.0 0 23 65 12 0Bundaleer Poll, 13V741 0.0 100 0 0 0 0 -0.1 3 21 69 7 0 -0.2 0 41 55 4 0 -0.1 0 31 55 14 0Bundilla, 111265 0.0 100 0 0 0 0 -0.1 0 45 40 15 0 0.2 0 10 80 10 0 0.1 0 15 70 15 0Centre Plus Poll, 207316 0.0 100 0 0 0 0 0.2 0 16 67 17 0 -0.2 0 42 54 4 0 0.0 0 21 62 17 0Darriwell, 130941 0.0 100 0 0 0 0 0.0 0 26 58 16 0 0.2 0 5 84 11 0 0.1 0 16 63 21 0Glenpaen, 120042 0.0 100 0 0 0 0 0.3 0 8 69 23 0 -0.3 0 50 50 0 0 0.2 0 12 69 19 0Greenfields Poll, 130599 0.0 95 5 0 0 0 0.0 4 14 77 5 0 0.0 0 27 68 5 0 0.2 0 18 50 32 0Hazeldean, 11.43 0.0 100 0 0 0 0 0.0 0 33 48 19 0 -0.3 0 56 41 3 0 0.0 0 26 52 22 0Kurra-Wirra, SR5681 0.1 92 8 0 0 0 0.2 0 16 60 24 0 -0.4 0 64 36 0 0 -0.1 0 36 44 20 0Leahcim Poll, 090918 0.0 96 4 0 0 0 0.0 0 29 61 10 0 0.0 0 29 61 10 0 0.1 0 21 54 25 0Leahcim Poll, 123153 0.0 100 0 0 0 0 0.0 0 23 68 9 0 -0.1 0 32 64 4 0 0.0 0 32 41 27 0Merinotech WA Poll, 100081 0.0 100 0 0 0 0 -0.3 0 46 50 4 0 0.1 0 23 65 12 0 -0.3 0 50 42 8 0Mokanger, 120092 0.0 95 5 0 0 0 0.1 0 20 65 15 0 -0.1 0 25 75 0 0 0.2 0 15 55 30 0Moojepin, 100248 0.0 100 0 0 0 0 0.4 0 4 67 29 0 0.8 0 0 43 57 0 0.5 0 10 43 43 4Mumblebone, 130389 0.0 100 0 0 0 0 -0.3 0 54 38 8 0 0.0 0 15 85 0 0 0.0 0 15 77 8 0Mumblebone, 130850 0.1 92 8 0 0 0 0.2 0 31 38 31 0 0.1 0 8 92 0 0 0.1 0 23 54 23 0Nareeb Nareeb, 130380 0.0 100 0 0 0 0 0.0 0 25 62 13 0 0.1 0 12 88 0 0 -0.4 0 46 54 0 0Nerstane, 130467 0.0 96 4 0 0 0 -0.2 0 50 35 15 0 -0.2 0 35 65 0 0 0.2 0 19 50 31 0One Oak No. 2, R56 0.0 100 0 0 0 0 0.1 0 22 61 17 0 -0.1 0 33 67 0 0 -0.1 0 31 56 13 0Roseville Park, 140019 0.0 100 0 0 0 0 0.2 0 24 47 29 0 -0.2 0 35 65 0 0 0.0 0 18 76 6 0The Mountain Dam, 11/ESA004 0.0 100 0 0 0 0 -0.1 0 35 55 10 0 0.2 0 10 77 13 0 -0.2 0 35 61 4 0Tuckwood Poll, 121021 0.0 100 0 0 0 0 -0.3 0 52 41 7 0 0.3 0 3 83 14 0 0.1 0 17 62 21 0Yalgoo, 120043 0.0 100 0 0 0 0 -0.5 0 63 37 0 0 -0.1 0 33 63 4 0 -0.2 0 33 63 4 0Yiddinga, 130374 0.0 100 0 0 0 0 -0.2 0 37 59 4 0 0.2 0 11 74 15 0 -0.1 0 41 41 18 0Average performance 1.0 98 2 0 0 0 2.8 0 29 56 15 0 2.8 0 26 67 7 0 2.9 0 26 56 18 0
Dust PenetrationFleece RotWool Quality
Wool Colour Wool Character

Elders Balmoral 2015 Ewe Drop Post Weaning Assessment Page 14
Table 2b. Visual trait assessments – Wool Quality and Pigmentation
For the majority of breeder’s objectives a negative deviation for wool quality traits would be considered favourable and the larger the deviation the better. Staple Structure is the possible exception when for many breeders the optimum score is in the middle of the range therefore trait leaders have not been highlighted. Four pigmentation traits are reported. Fibre pigmentation and Non-fibre pigmentation are scored 1 to 5, however Recessive black and Random spot are scored 1 (no pigmentation of this type) or 5 (when the trait is expressed). Only the percentage progeny for each sire that a score 5 is recorded, are reported for Recessive black and Random spot.
Breeders flock, Sire name Black SpotDev 1 2 3 4 5 Dev 1 2 3 4 5 Dev 1 2 3 4 5 Dev 1 2 3 4 5 5 5
Billandri Poll, 130087 0.1 7 12 81 0 0 0.0 98 2 0 0 0 0.1 33 61 6 0 0 0 2Bogo, 111424 -0.3 0 58 42 0 0 0.0 94 4 0 2 0 0.0 43 48 9 0 0 0 0Bundaleer Poll, 13V741 0.0 0 34 66 0 0 0.0 97 1 2 0 0 -0.2 59 41 0 0 0 0 0Bundilla, 111265 0.2 0 15 85 0 0 0.0 97 0 0 0 3 0.3 21 67 12 0 0 0 5Centre Plus Poll, 207316 -0.2 0 54 46 0 0 -0.1 100 0 0 0 0 -0.1 43 54 3 0 0 0 0Darriwell, 130941 0.3 0 5 95 0 0 -0.1 100 0 0 0 0 0.3 26 53 21 0 0 0 0Glenpaen, 120042 -0.4 0 69 31 0 0 -0.1 100 0 0 0 0 -0.3 69 30 1 0 0 0 2Greenfields Poll, 130599 0.1 0 23 77 0 0 0.0 96 2 2 0 0 -0.3 65 35 0 0 0 0 0Hazeldean, 11.43 -0.4 0 74 26 0 0 0.0 97 3 0 0 0 -0.1 48 48 4 0 0 0 0Kurra-Wirra, SR5681 -0.2 0 56 44 0 0 0.0 95 4 1 0 0 -0.1 51 40 9 0 0 0 4Leahcim Poll, 090918 0.1 0 25 75 0 0 0.0 97 1 2 0 0 -0.2 62 35 1 2 0 0 0Leahcim Poll, 123153 0.0 0 27 73 0 0 0.0 93 5 2 0 0 0.0 45 45 10 0 0 0 0Merinotech WA Poll, 100081 0.0 0 27 73 0 0 -0.1 100 0 0 0 0 -0.3 65 35 0 0 0 0 2Mokanger, 120092 0.0 0 35 65 0 0 0.3 79 16 2 0 3 0.4 21 58 18 3 0 0 0Moojepin, 100248 0.3 0 0 100 0 0 0.1 90 8 0 2 0 -0.1 55 39 6 0 0 0 4Mumblebone, 130389 -0.1 0 38 62 0 0 0.1 91 6 0 0 3 0.3 28 50 19 3 0 0 0Mumblebone, 130850 0.0 0 31 69 0 0 0.0 96 4 0 0 0 0.1 42 46 12 0 0 0 0Nareeb Nareeb, 130380 0.1 0 17 83 0 0 0.0 96 2 2 0 0 0.3 25 56 19 0 0 0 2Nerstane, 130467 -0.2 0 54 46 0 0 0.0 94 6 0 0 0 0.3 17 68 15 0 0 0 0One Oak No. 2, R56 0.0 0 28 72 0 0 0.0 98 2 0 0 0 -0.3 63 37 0 0 0 0 2Roseville Park, 140019 0.0 0 29 71 0 0 -0.1 100 0 0 0 0 0.2 23 69 8 0 0 0 0The Mountain Dam, 11/ESA004 0.1 4 19 77 0 0 -0.1 100 0 0 0 0 0.0 44 47 7 2 0 0 0Tuckwood Poll, 121021 0.2 0 10 90 0 0 -0.1 100 0 0 0 0 -0.3 61 39 0 0 0 0 0Yalgoo, 120043 0.0 0 27 73 0 0 -0.1 100 0 0 0 0 -0.4 78 22 0 0 0 0 0Yiddinga, 130374 0.3 0 4 96 0 0 0.0 96 4 0 0 0 0.3 10 84 6 0 0 0 0Average performance 2.7 0 31 69 0 0 1.1 96 3 1 0 0 1.6 44 48 8 0 0
Wool Quality Pigmentation - Marking Staple Weathering Staple Structure Fibre pigmentation Non-fibre pigmentation
Staple Weatheringwas not scored
as Dust Penetration was

Elders Balmoral 2015 Ewe Drop Post Weaning Assessment Page 15
Traits are reported as a deviation (Dev) from the average trait score for all progeny. The percentage of a sire’s progeny assessed for each score is also reported. No adjustments are made to the data to improve the accuracy of the results as is the case with sire means or breeding values.
For the majority of breeder’s objectives a negative deviation would be considered favourable and the larger the deviation the better. Face cover is the possible exception when for many breeders the optimum score is in the middle of the range therefore trait leaders have not been highlighted.
Breeders flock, Sire nameDev 1 2 3 4 5 Dev 1 2 3 4 5 Dev 1 2 3 4 5 Dev 1 2 3 4 5 Dev 1 2 3 4 5
Billandri Poll, 130087 0.0 100 0 0 0 0 0.1 24 38 38 0 0 0.1 62 38 0 0 0 -0.1 0 25 75 0 0 0.2 0 50 50 0 0Bogo, 111424 0.1 96 0 4 0 0 0.1 19 54 27 0 0 0.0 75 25 0 0 0 0.3 0 0 85 15 0 0.1 0 62 38 0 0Bundaleer Poll, 13V741 0.0 100 0 0 0 0 -0.1 24 62 14 0 0 -0.1 83 17 0 0 0 0.0 0 14 83 3 0 0.0 3 59 38 0 0Bundilla, 111265 0.0 100 0 0 0 0 -0.2 40 40 20 0 0 -0.1 84 16 0 0 0 0.2 0 0 90 10 0 0.2 0 47 53 0 0Centre Plus Poll, 207316 0.0 100 0 0 0 0 0.2 13 58 29 0 0 -0.1 83 17 0 0 0 -0.3 0 46 54 0 0 0.1 4 48 48 0 0Darriwell, 130941 0.0 100 0 0 0 0 -0.3 37 58 5 0 0 0.2 63 32 0 5 0 0.3 0 5 74 21 0 0.2 0 63 26 11 0Glenpaen, 120042 0.0 100 0 0 0 0 0.0 23 58 19 0 0 0.3 58 31 11 0 0 0.1 0 15 73 12 0 0.3 0 46 42 12 0Greenfields Poll, 130599 0.0 100 0 0 0 0 0.5 5 45 50 0 0 0.1 68 23 9 0 0 0.1 0 5 95 0 0 0.1 5 50 45 0 0Hazeldean, 11.43 0.0 100 0 0 0 0 -0.2 30 63 7 0 0 0.1 63 37 0 0 0 -0.1 0 30 67 3 0 0.2 0 44 56 0 0Kurra-Wirra, SR5681 0.1 96 0 4 0 0 0.5 12 28 60 0 0 0.4 48 39 13 0 0 0.1 0 12 76 12 0 0.2 0 57 39 4 0Leahcim Poll, 090918 0.0 100 0 0 0 0 -0.1 43 28 29 0 0 0.1 70 26 4 0 0 -0.1 0 25 71 4 0 -0.6 26 74 0 0 0Leahcim Poll, 123153 0.0 100 0 0 0 0 0.1 9 73 18 0 0 -0.1 82 18 0 0 0 -0.2 0 36 64 0 0 -0.5 27 68 5 0 0Merinotech WA Poll, 100081 0.0 100 0 0 0 0 -0.1 15 77 8 0 0 0.0 73 27 0 0 0 -0.2 0 35 65 0 0 0.2 0 46 54 0 0Mokanger, 120092 0.0 100 0 0 0 0 0.3 10 55 35 0 0 0.1 68 26 6 0 0 0.2 0 0 90 10 0 0.5 0 37 47 16 0Moojepin, 100248 0.0 100 0 0 0 0 -0.1 29 57 14 0 0 -0.2 90 10 0 0 0 -0.6 0 71 29 0 0 -0.6 29 71 0 0 0Mumblebone, 130389 0.0 100 0 0 0 0 -0.1 38 31 31 0 0 -0.2 92 8 0 0 0 0.1 0 0 100 0 0 -0.2 0 85 15 0 0Mumblebone, 130850 0.0 100 0 0 0 0 -0.3 38 54 8 0 0 0.0 77 15 8 0 0 -0.5 0 62 38 0 0 -0.8 46 54 0 0 0Nareeb Nareeb, 130380 0.0 100 0 0 0 0 -0.2 38 50 12 0 0 -0.2 88 12 0 0 0 -0.1 4 21 75 0 0 0.2 0 50 46 4 0Nerstane, 130467 0.1 96 0 4 0 0 0.3 7 58 35 0 0 0.0 69 31 0 0 0 0.3 0 0 81 19 0 0.3 0 35 65 0 0One Oak No. 2, R56 0.0 100 0 0 0 0 -0.2 33 53 14 0 0 0.1 75 11 14 0 0 0.2 0 3 86 11 0 0.3 0 44 50 6 0Roseville Park, 140019 0.0 100 0 0 0 0 -0.1 24 65 11 0 0 0.0 82 12 6 0 0 -0.1 0 24 76 0 0 0.0 6 53 41 0 0The Mountain Dam, 11/ESA004 0.0 100 0 0 0 0 0.1 26 39 35 0 0 0.1 77 6 13 4 0 0.1 0 6 94 0 0 -0.2 4 77 19 0 0Tuckwood Poll, 121021 0.0 100 0 0 0 0 0.2 21 41 38 0 0 -0.1 86 14 0 0 0 -0.1 0 28 72 0 0 -0.3 11 79 10 0 0Yalgoo, 120043 0.0 100 0 0 0 0 -0.4 43 50 7 0 0 -0.1 80 20 0 0 0 0.1 0 10 83 7 0 0.3 0 40 60 0 0Yiddinga, 130374 0.0 100 0 0 0 0 0.1 22 52 26 0 0 -0.2 96 4 0 0 0 0.0 0 15 85 0 0 -0.2 15 59 26 0 0Average performance 1.0 100 0 0 0 0 2.0 25 51 24 0 0 1.3 76 21 3 0 0 2.9 0 19 75 6 0 2.3 7 56 35 2 0
ConformationJaw Legs and Feet Shoulder and Back Face Cover Body Wrinkle
Table 2c. Visual trait assessments – Conformation

Elders Balmoral 2015 Ewe Drop Post Weaning Assessment Page 16
Table 2d. Visual trait assessments – Breech
Traits are reported as a deviation (Dev) from the average trait score for all progeny. The percentage of a sire’s progeny assessed for each score is also reported. No adjustments are made to the data to improve the accuracy of the results as is the case with sire means or breeding values.
For the majority of breeder’s objectives a negative deviation would be considered favourable and the larger the deviation the better.
Breeders flock, Sire name
Dev 1 2 3 4 5 Dev 1 2 3 4 5 Dev 1 2 3 4 5 Dev 1 2 3 4 5 Dev 1 2 3 4 5Billandri Poll, 130087 0.0 0 12 60 28 0 0.2 6 42 40 12 0 0.0 0 17 65 18 0 0.1 0 53 41 6 0 -0.3 81 19 0 0 0Bogo, 111424 -0.1 0 19 57 22 2 0.0 11 43 41 5 0 -0.1 0 21 62 17 0 -0.1 0 67 33 0 0 -0.1 64 28 8 0 0Bundaleer Poll, 13V741 -0.3 7 24 52 17 0 -0.2 16 53 24 5 2 0.2 0 18 48 34 0 0.1 4 48 48 0 0 0.3 45 31 21 3 0Bundilla, 111265 0.0 3 15 55 25 2 0.2 5 42 38 12 3 -0.1 0 25 60 15 0 0.1 5 50 40 5 0 -0.3 75 25 0 0 0Centre Plus Poll, 207316 -0.3 5 30 41 24 0 -0.2 11 59 24 6 0 -0.2 0 35 52 13 0 0.3 5 39 43 13 0 -0.2 70 26 4 0 0Darriwell, 130941 0.1 0 8 62 26 4 0.2 11 30 43 13 3 0.2 0 21 37 42 0 0.3 0 42 47 11 0 -0.3 79 16 5 0 0Glenpaen, 120042 0.2 0 9 54 31 6 0.6 1 28 46 19 6 0.2 0 23 31 46 0 0.4 0 35 46 19 0 0.0 65 27 4 0 4Greenfields Poll, 130599 0.0 0 14 59 25 2 0.0 16 41 34 7 2 -0.1 8 9 61 22 0 0.1 5 43 48 4 0 0.4 41 41 0 18 0Hazeldean, 11.43 0.1 0 19 45 32 4 0.4 1 31 55 13 0 0.1 0 15 63 22 0 0.2 3 41 52 4 0 -0.1 69 23 8 0 0Kurra-Wirra, SR5681 0.1 0 14 49 33 4 0.5 2 28 42 28 0 0.1 0 18 52 30 0 0.2 0 48 48 4 0 -0.4 88 12 0 0 0Leahcim Poll, 090918 -0.4 3 34 48 15 0 -0.8 46 46 8 0 0 -0.2 4 33 44 19 0 -0.6 22 74 4 0 0 -0.3 86 11 3 0 0Leahcim Poll, 123153 0.0 4 16 45 30 5 -0.5 30 50 20 0 0 -0.1 0 30 52 18 0 -0.6 30 61 9 0 0 0.3 45 32 23 0 0Merinotech WA Poll, 100081 -0.2 5 26 46 20 3 -0.1 15 44 33 8 0 0.1 0 11 62 27 0 0.1 0 46 54 0 0 0.3 38 42 15 5 0Mokanger, 120092 0.3 0 2 50 45 3 0.5 3 29 39 29 0 0.1 0 16 58 26 0 0.4 0 26 63 11 0 0.7 30 30 30 10 0Moojepin, 100248 -0.4 4 30 50 16 0 -0.6 32 52 16 0 0 -0.4 0 43 52 5 0 -0.5 14 86 0 0 0 -0.4 86 14 0 0 0Mumblebone, 130389 0.2 0 9 53 34 4 -0.1 16 47 31 6 0 -0.1 0 31 46 23 0 0.0 0 62 38 0 0 -0.2 69 31 0 0 0Mumblebone, 130850 -0.3 0 33 52 15 0 -0.9 52 44 4 0 0 -0.5 7 40 53 0 0 -1.1 73 27 0 0 0 -0.3 80 20 0 0 0Nareeb Nareeb, 130380 0.0 0 16 51 31 2 -0.2 18 41 37 4 0 0.0 0 28 44 28 0 0.3 0 36 60 4 0 0.0 60 32 8 0 0Nerstane, 130467 0.5 0 8 32 47 13 0.6 3 25 40 28 4 0.6 0 0 46 50 4 0.5 0 19 73 8 0 0.4 42 35 15 8 0One Oak No. 2, R56 0.7 1 3 29 48 19 1.0 0 14 41 37 8 0.1 0 16 56 28 0 0.3 0 39 53 8 0 -0.1 72 19 6 3 0Roseville Park, 140019 -0.1 3 11 64 22 0 -0.4 31 42 25 2 0 0.0 0 16 67 17 0 0.2 6 39 44 11 0 -0.1 72 22 0 6 0The Mountain Dam, 11/ESA004 0.1 2 16 44 36 2 -0.2 21 43 33 3 0 0.0 0 22 50 28 0 -0.3 9 72 19 0 0 -0.1 65 32 0 3 0Tuckwood Poll, 121021 -0.1 2 31 37 22 8 -0.1 20 37 35 8 0 0.2 0 14 55 28 3 -0.3 0 86 14 0 0 0.1 59 26 7 4 4Yalgoo, 120043 0.1 2 10 56 27 5 0.3 10 24 46 20 0 0.1 0 13 58 29 0 0.2 0 45 48 7 0 0.2 50 33 10 7 0Yiddinga, 130374 -0.1 0 19 54 27 0 -0.3 17 52 31 0 0 -0.1 0 22 59 19 0 -0.2 14 56 30 0 0 0.5 37 33 22 4 4Average performance 3.1 2 17 50 28 3 2.4 16 39 33 11 1 3.0 2 21 53 24 0 2.4 8 50 38 4 0 1.5 63 26 8 3 0
MarkingDag
Post Weaning
Breech Visual TraitsBreech Cover Breech Wrinkle Breech Cover Breech Wrinkle
Marking Post Weaning Post Weaning

Elders Balmoral 2015 Ewe Drop Post Weaning Assessment Page 17
Table 3. Sire Means for Measured Traits
Sire means are the average performance of all the progeny of a sire adjusted for all available information on sex, birth type, rear type, age of dam, age of measurement and management group, in order to improve the accuracy. No account is made for trait heritability and genetic correlations between traits that can improve the breeding value accuracy, as is the case in Table 1.
The highest performing sires for each trait (trait leaders) are highlighted by shading. Curvature is the possible exception when for many breeders the optimum score is in the middle of the range therefore trait leaders have not been highlighted.
The Progeny group average listed at the bottom of the table is the actual mean of the progeny group. Number
ofBreeders flock, Sire name Ewe
progeny W PBillandri Poll, 130087 16 0.1 0.0Bogo, 111424 24 -0.3 -1.4Bundaleer Poll, 13V741 29 -0.5 0.3Bundilla, 111265 20 1.2 1.7Centre Plus Poll, 207316 23 -0.8 -1.6Darriwell, 130941 18 0.9 0.5Glenpaen, 120042 26 -0.2 -0.6Greenfields Poll, 130599 22 -0.5 -0.4Hazeldean, 11.43 26 0.7 0.4Kurra-Wirra, SR5681 23 -1.1 -3.1Leahcim Poll, 090918 27 0.1 -0.4Leahcim Poll, 123153 22 0.2 0.6Merinotech WA Poll, 100081 25 -1.4 -1.1Mokanger, 120092 19 0.1 -0.8Moojepin, 100248 21 0.8 3.2Mumblebone, 130389 13 -0.7 -0.1Mumblebone, 130850 15 1.3 3.4Nareeb Nareeb, 130380 25 0.7 1.2Nerstane, 130467 25 -0.1 -1.9One Oak No. 2, R56 36 -0.6 -1.3Roseville Park, 140019 17 -0.4 0.4The Mountain Dam, 11/ESA00 31 -0.1 0.5Tuckwood Poll, 121021 29 1.7 2.2Yalgoo, 120043 31 -0.4 -1.1Yiddinga, 130374 26 -0.6 -0.7Progeny group average 24 23.4 28.4
0.00.10.20.0-0.1-0.10.20.00.0
0.00.10.0-0.2-0.2-0.1-0.10.0-0.1
0.00.2-0.10.00.0
0.8-0.8-0.40.5-0.60.4-0.7
-0.10.2
0.2-0.5
WTkg
kg
-1.4 2.21.7 1.7
-0.5 0.1
FDCV
P
-4.1
-0.6 0.7
2.1
-1.0 6.0
-9.5
0.5
deg/mmCurv
0.3
P
-0.1 0.0 4.2
kg m %
0.2 0.0P^ P0.3-0.1
GFW FDkg
CFW
P
0.0 1.2 -2.50.0 0.6 7.0
-0.1 -0.3 3.9
0.0 0.2 -3.4
-0.1
-1.0
0.0 1.3 -1.10.1 0.6 0.7
-0.1-0.10.0
-0.40.10.10.00.0
0.1
-0.1 1.8-1.2
0.0 0.5 1.3
0.0
kg
0.315.2
0.0 -0.5 -4.20.0
-0.40.3-0.20.1-0.6
-0.51.00.21.0
Sire means for measured traits (deviations from the site mean)
1.2 20.1 98.2
0.0 1.5 2.90.0 0.8 0.3
-0.1 -2.0-0.1 -0.7 -3.7
0.0 0.7 -3.70.1 0.0 -2.3
0.0 -1.22.1kg deg/mm%m

Elders Balmoral 2015 Ewe Drop Post Weaning Assessment Page 18
Understanding the results
Accuracy of Flock Breeding Values
Flock Breeding Values (FBVs) are reported by Sheep Genetics (SG). FBVs express the expected performance of progeny of a sire relative to another sire in the evaluation when mated to the same standard of ewes. FBVs improve the accuracy of sire results because they account for the association between traits, adjustment for birth effects and the number of progeny a sire has in the analysis.
True Breeding Values would be achieved if the number of progeny evaluated for each sire were infinite. Because the number of progeny in the evaluation is not infinite, performance shown in this report is described as Flock Breeding Values.
Without progeny test information the correlation between the Flock and True Breeding Value of sires from different sources would be zero (0.0%). The correlation between Flock and True Breeding Value improves rapidly from 0.0% with no progeny to 77% with 10 progeny. The rate of improvement in correlation slows from 86% with 20 progeny, to 90% with 30 progeny and 92% with 40 progeny. With an infinite population the correlation is 100%. Note that the correlation used in the above example is for a trait such as fibre diameter with a high heritability (0.5).
A heritability of 0.5 indicates that half or 50% of the measured performance is passed onto offspring. A heritability of 0.35 indicates 35% is passed on. The FBVs that are shown in this report have already accounted for heritability and therefore describe the performance that can be expected from a sire’s progeny.
Link Sires
Link sires provide the ‘genetic link’ between sire evaluation sites located across Australia to allow all sires entered in these site evaluations to have their performance reported relative to each other in Merino Superior Sires. Merino Superior Sires reports sires from across all effectively linked sire evaluation sites and across all evaluations at these sites. Link sires are therefore a vital component of the sire evaluation. To be used as a link a sire must have at least 25 progeny assessed at 1st Assessment at one accredited site. Site reports provide valuable information not reported in Merino Superior Sires however Merino Superior Sires reports the performance of a large number of sires which can provide a wider perspective of the elite sires available across many flocks in Australia. Calculation of Combined Information Combined measured trait performance is calculated as Index – 100. Three different index options are provided to cater for breeders’ different breeding objectives. Combined visual trait performance is calculated as: (Classer’s Visual Grade Tops% – Culls%)/5, expressed as a deviation from (average Tops% – average Culls%)/5. Example Sire’s performance: � AMSEA DP+ Index value = 119.7 � Tops% = 25.5 (average Tops% = 25.1) � Culls% = 17.6 (average Culls% = 16.4) Combined Measured = 119.7.0 – 100 = 19.7 Combined Visual = ((25.5 – 17.6)/5) – ((25.1 – 16.4)/5) = 7.9/5 – 8.7/5 = 1.58 – 1.74 = -0.1
Version: 1.0 Page 1
TULOONA 2015 MLP DROP EWE LAMB COMMENTARY (Hamish Dickson, 19/5/16)
1. Lamb weaning weights were ideal, reaching an industry benchmark of 45% of mature weight
2. Lamb growth through summer until late February were tracking well on target
3. Lamb growth rate from late February suffered due to a combination of factors:
a. health issues relating to lupinosis/blue green algae and the subsequent reduction in ration quality to manage the health issues
b. significant disruption from multiple handling events/time off feed
Considering the seasonal conditions at Tuloona, the current condition of the stock is a great credit to Sean and Michael. The early growth and management of the stock placed
them in good stead to withstand the recent challenges, had this not been the case significantly more mortalities would have been observed.
Given that the weaners have now fully recovered from the health issues and various husbandry/ trial activities; it is expected that growth rates are satisfactory again.

Elders Balmoral
2015 Ewe Drop
Post Weaning Assessment Update
Merino Lifetime Productivity Project Site