Influence of Methods of Construction on the Behaviour of ...
1
Safety Behaviour in the Construction Sector
Report to the Health and Safety Authority, Dublin& the Health and Safety Executive, Northern Ireland
by
Nick McDonaldDepartment of Psychology, Trinity College Dublin
and
Victor HrymakSchool of Food Science and Environmental Health, DIT
Research Team:Jose Damián Pérez-González, Siobhán Corrigan, Sara Boyd,
Emer Farrell, Ann Fitzpatrick, Derek Ross,Michael Griffin, Paul Liston.

i
“Safety Behaviour in the Construction Industry”
Report to the Health and Safety Authority, Dublin& the Health and Safety Executive, Northern Ireland
by
Nick McDonaldDepartment of Psychology, Trinity College Dublin
and
Victor HrymakSchool of Food Science and Environmental Health, DIT
Foreword by the Health and Safety Authority
This report and the work it describes were funded by the Health and SafetyAuthority and the Health and Safety Executive Northern Ireland. Its contents,including any opinions and/or conclusions expressed, are those of the authorsalone and do not necessarily reflect HSA or HSENI policy.
Almost two years ago, against the background of widespread concern overthe level of fatal and serious accidents in the Irish Construction Industry, itwas recognised that the culture in the industry generally was not conducive tohealth and safety. In an effort to develop a better understanding of this cultureand devise practical and targeted initiatives to positively affect behaviour inthe construction sector, the Health and Safety Authority and the Health andSafety Executive, Northern Ireland jointly commissioned a research project,and this document is the culmination of that research process. The researchis a landmark piece of work as it is the first completed research report fromthe Occupational Safety and Health Institute of Ireland (OSHII), and theAuthority welcomes its publication.
The Authority wishes to express its gratitude to the construction companieswho participated in this study and also to the researchers, Dr Nick McDonaldand Mr Victor Hrymak, the authors of this report.
The next phaseThe publication of this research does not represent the completion of the taskhowever. This work, which has been reviewed by the Board of the Authorityand its Legislation and Guidance sub-committee raises many issues fordiscussion, consideration and future action and will be referred to both theConstruction Safety Advisory Committee and the Construction SafetyPartnership (CSP). The Authority particularly welcomes the fact that the reportaffirms a number of initiatives already underway in the Construction SafetyPartnership and indeed, incorporated as legal requirements in the recent

ii
Safety, Health and Welfare at Work (Construction) Regulations, 2001 whichimpose significant new legal responsibilities on project supervisors inimportant areas such as safety training, welfare and safety consultation. Wealso note the reported external perceptions of the Authority held by some ofour stakeholders and recognise the challenge we face to develop a greaterunderstanding of the complexities of the Authority’s role in this sector.
The Research ProcessOSHII was invited to carry out the research and a number of tenders weresubmitted from its constituent members which were peer reviewed by externalacademics and safety practitioners. The research was awarded to a jointproposal from Trinity College Dublin / Dublin Institute of Technology. Work onthe project commenced in 2000 with site work being carried out fromNovember 2000 to February 2001. A number of meetings were held betweenthe researchers and a joint HSA / HSENI steering group at intervals in theduration of the project and a substantive draft report was made available inJune 2001. This then underwent a peer review process which was completedin December 2002. Following consultation between both clients and OSHII inJanuary 2002, a final report was issued in March 2002.
Objectives and DesignThe primary goal of this research was to investigate the factors that influencesafety behaviour and compliance with safety requirements on constructionsites. This goal was realised through the following objectives:
♦ The first objective was to examine compliance with safety requirementsin the construction industry.
♦ The second was to investigate the behaviours, perceptions andattitudes associated with safety in construction.
♦ The third was to investigate management practices and associateddocumentation relating to safety.
♦ The final objective was to seek to establish what factors aresignificantly associated with safe behaviours or safety compliance.
The high incidence of falling from heights in construction accident statisticsled to a focus, particularly in the site observations and operatives’questionnaire, on factors associated with falling from heights
The design adopted was a cross-sectional one based on a comparison of arepresentative sample of 18 sites in Ireland. The sample included large andsmaller sites, housing and general contracting, and metropolitan and regionalareas in the Republic and Northern Ireland. An eighteen-item safety auditchecklist was used to as a protocol for measuring safety compliance. A surveyof construction operatives addressed the perception of risk, behaviour in risksituations, attitudes and safety climate. A total of 244 site operatives weresurveyed. 59 site management and others (including safety representatives)who have a role in safety management were interviewed concerning a rangeof safety management functions and effectiveness. Safety documentation onten sites was examined. A sample of ten inspectors was interviewed.

iii
Dissemination of ReportThe full text of this report will be displayed on the websites of the HSA and theIrish Focal Point website of the European Safety Agency. Furthermore, theHSA urges all of the stakeholders in the construction sector to consider theresearch findings and take on board those recommendations applicable totheir particular roles which will help create safer working conditions on Irishconstruction sites.
_________________________________
Relevant Information on the Safety, Health and Welfare at Work(Construction) Regulations, 2001
These Regulations impose significant new legal responsibilities on projectsupervisors in important areas such as safety training, welfare and safetyconsultation.
The requirement for safety training is being introduced on a phased basisbeginning with all employees newly recruited into the sector, who wererequired to have attended the FÁS SAFE PASS training course with effectfrom January 2002. The requirement applies to all new sites from 1st May2002 and will apply to all remaining workers in the sector by 1st June 2003.The existing Construction Skills Certification Scheme has also beenstrengthened by the Regulations. From 1st January 2002, all scaffolders arerequired to carry a card displaying their skills details, and all ProjectSupervisors Construction Stage (PSCS) are required to make arrangementsto ensure that only CSCS card-holders are recruited for scaffolding work. Thisrequirement will be extended to crane drivers, banksmen, advancedscaffolders and operators of certain mechanical plant from 1st July 2002 andto a range of other trades from 1st June 2003.
Regarding safety consultation, from 1st January 2002, all sites with more than20 workers were required to actively facilitate the appointment of a safetyrepresentative to facilitate effective consultation.
The Regulations also provide for more effective arrangements for ensuringthat adequate welfare facilities are available, by requiring the ProjectSupervisor Construction Stage (PSCS) to co-ordinate the provision of thesefacilities on site.

2
List of figures: ......................................................................................................... 5List of tables: .......................................................................................................... 6
EXECUTIVE SUMMARY .............................................................................................................................. 1
Objectives and design ............................................................................................. 1Results ..................................................................................................................... 1Compliance with safety requirements..................................................................... 1Perception of risk.................................................................................................... 2Training .................................................................................................................. 2Safety management ................................................................................................. 2Role of inspections .................................................................................................. 3Factors associated with safety compliance............................................................. 3Recommendations ................................................................................................... 4Safety Representatives ............................................................................................ 4Training and certification....................................................................................... 4The safety management system ............................................................................... 4The Construction Safety Partnership Plan ............................................................. 5
LITERATURE REVIEW: CONSTRUCTION RELATED FATALITY STATISTICS............................ 7
Construction Fatality Rates in Europe ................................................................... 7Country ................................................................................................................... 7Construction-related fatalities in the UK ............................................................... 7Construction Related Fatalities in Northern Ireland ............................................. 8Construction Related Fatalities in Ireland ............................................................. 9International Construction Related Fatalities due to Falls from heights............... 9Summary ............................................................................................................... 10
REGULATORY ACTIVITY IN THE REPUBLIC OF IRELAND AND NORTHERN IRELAND ...... 11
The Republic of Ireland ........................................................................................ 11Planned Regulatory Activity in 2001 .................................................................... 12
REGULATORY ACTIVITY IN NORTHERN IRELAND ........................................................................ 12
Summary ............................................................................................................... 12SAFETY ANTECEDENTS IN THE LITERATURE ON CONSTRUCTION ......................................... 13
Non-compliance versus accidents as measure of safety performance.................. 13Safety consequences of non-compliance with procedures .................................... 14Interventions to improve safety............................................................................. 14Functional effectiveness of safety management systems....................................... 16Summary ............................................................................................................... 17
DESIGN AND METHODOLOGY................................................................................................................ 19
Site Sampling ........................................................................................................ 19Dublin ..................................................................................................................... 20Belfast ..................................................................................................................... 20Build Type ................................................................................................................. 21

3
PROCEDURE ................................................................................................................................................. 22
METHODOLOGY ......................................................................................................................................... 22
The Observational Study....................................................................................... 22The Operative Survey............................................................................................ 24Safety Management Interviews ............................................................................. 25Analysis of Safety Documentation ........................................................................ 26HSA/HSE Interviews ............................................................................................. 27Summary ............................................................................................................... 27
RESULTS: COMPLIANCE WITH SAFETY REQUIREMENTS............................................................ 28
The Prevention of Falls from Heights................................................................... 28Prevention of Falls Performance by site .............................................................. 30Builder .................................................................................................................. 31General conclusions on Prevention from Falls from Heights .............................. 32Compliance with other items observed ................................................................. 33
OPERATIVE SURVEY ANALYSIS ............................................................................................................... 35
Background information ....................................................................................... 35Safety Training...................................................................................................... 35
MANAGEMENT INTERVIEWS .................................................................................................................... 43
Safety Plan ............................................................................................................ 43Competence/Training............................................................................................ 44Monitoring ............................................................................................................ 45Communication..................................................................................................... 47Co-operation......................................................................................................... 48Suggestions for improvement................................................................................ 48
DOCUMENTATION ANALYSIS ................................................................................................................... 48
Safety plan............................................................................................................. 48Risk assessments ................................................................................................... 49Site specific risk assessments ................................................................................ 49Accident logbook................................................................................................... 49Safety Meetings ..................................................................................................... 49Safety Audits ......................................................................................................... 49Training ................................................................................................................ 50Overall assessment................................................................................................ 50Summary ............................................................................................................... 51Overall Document Evaluation .............................................................................. 51
HSA/HSE INTERVIEWS................................................................................................................................ 52
SUMMARY OF HSE INTERVIEWS........................................................................................................... 52
Background........................................................................................................... 52Site Selection......................................................................................................... 52Site Inspection....................................................................................................... 53Safety on sites........................................................................................................ 53
4
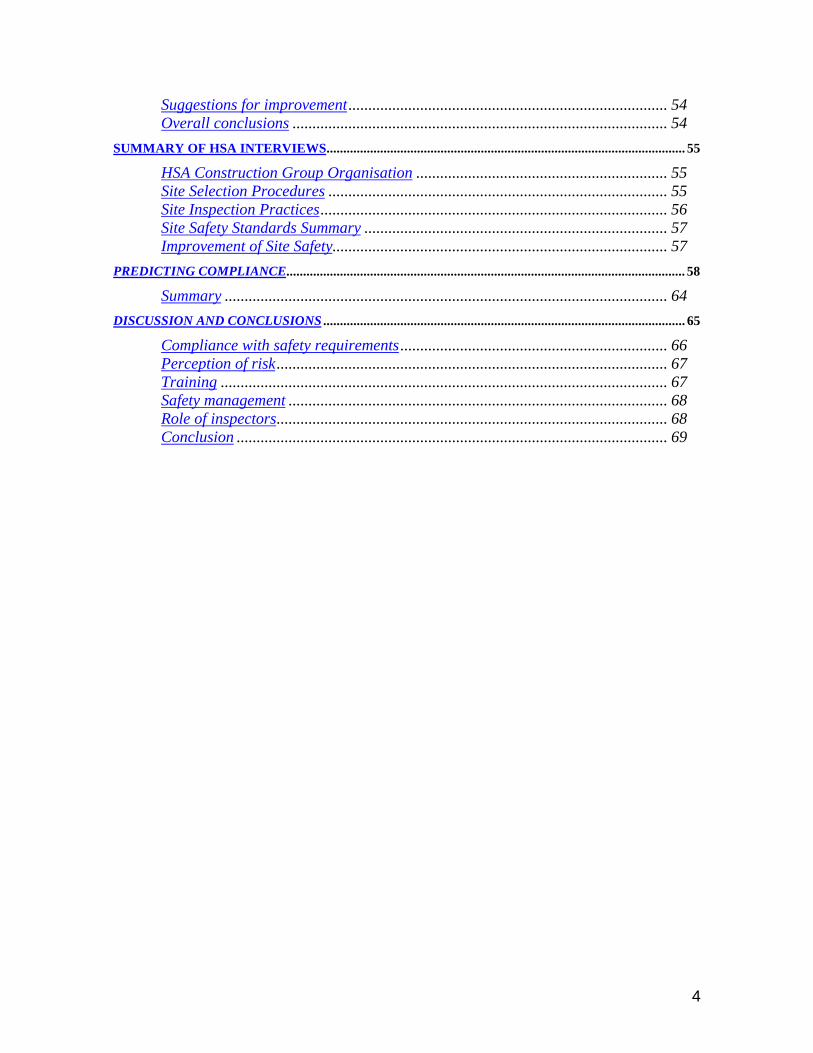
Suggestions for improvement................................................................................ 54Overall conclusions .............................................................................................. 54
SUMMARY OF HSA INTERVIEWS........................................................................................................... 55
HSA Construction Group Organisation ............................................................... 55Site Selection Procedures ..................................................................................... 55Site Inspection Practices....................................................................................... 56Site Safety Standards Summary ............................................................................ 57Improvement of Site Safety.................................................................................... 57
PREDICTING COMPLIANCE....................................................................................................................... 58
Summary ............................................................................................................... 64DISCUSSION AND CONCLUSIONS ............................................................................................................ 65
Compliance with safety requirements................................................................... 66Perception of risk.................................................................................................. 67Training ................................................................................................................ 67Safety management ............................................................................................... 68Role of inspectors.................................................................................................. 68Conclusion ............................................................................................................ 69

5
List of figures:
Figure number Page
Figure 1: Incidence of openings found unguarded 29
Figure 2: Incidence of guardrails or edge protection missing 30
Figure 3: Incidence of ladders found incorrectly tied 31
Figure 4: Incidence of rubbish on access routes 34
Figure 5: Incidence of rubbish on scaffold lifts 34
Figure 6: Incidence of trapped scaffold boards 34
Figure 7: Incidence of missing toe boards 34
Figure 8: Incidence of internal hard hat use 35
Figure 9: Incidence of external hard hat use 35
Figure 10: Incidence of viz vest wearing 35
Figure 11: Safety training received from the main contractor 36
Figure 12: Safety training received from subcontractor 37
Figure 13: Perceived level of risk and frequencies of risky situations for thenine situations of the research 38
Figure 14: Preferred behaviour in the face of danger reported by workers 40
Figure 15: Safety attitudes’ factors 41
Figure 16: Management commitment with safety 43
Figure 17: Perception of sources of risk influencing safety in site 43
Figure 18: Perceived level of risk in site and industry 44
Figure 19: A model of bivariate significant relationships in this research 63
6
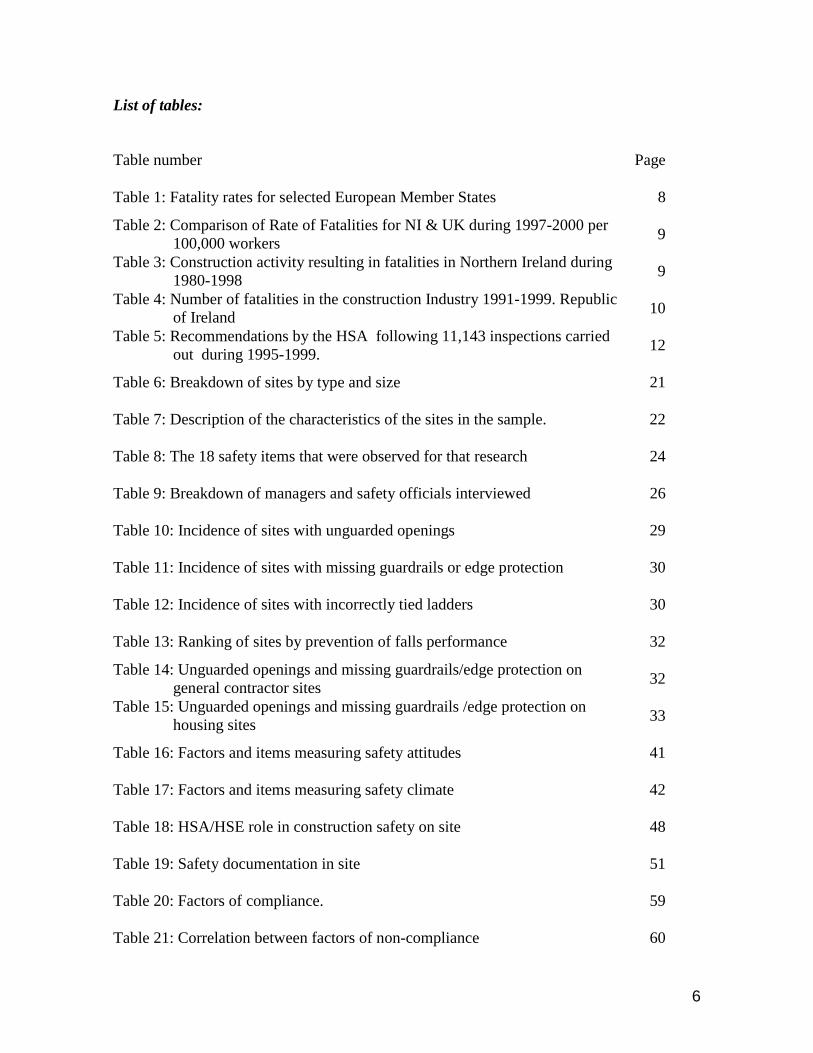
List of tables:
Table number Page
Table 1: Fatality rates for selected European Member States 8
Table 2: Comparison of Rate of Fatalities for NI & UK during 1997-2000 per100,000 workers 9
Table 3: Construction activity resulting in fatalities in Northern Ireland during1980-1998 9
Table 4: Number of fatalities in the construction Industry 1991-1999. Republicof Ireland 10
Table 5: Recommendations by the HSA following 11,143 inspections carriedout during 1995-1999. 12
Table 6: Breakdown of sites by type and size 21
Table 7: Description of the characteristics of the sites in the sample. 22
Table 8: The 18 safety items that were observed for that research 24
Table 9: Breakdown of managers and safety officials interviewed 26
Table 10: Incidence of sites with unguarded openings 29
Table 11: Incidence of sites with missing guardrails or edge protection 30
Table 12: Incidence of sites with incorrectly tied ladders 30
Table 13: Ranking of sites by prevention of falls performance 32
Table 14: Unguarded openings and missing guardrails/edge protection ongeneral contractor sites 32
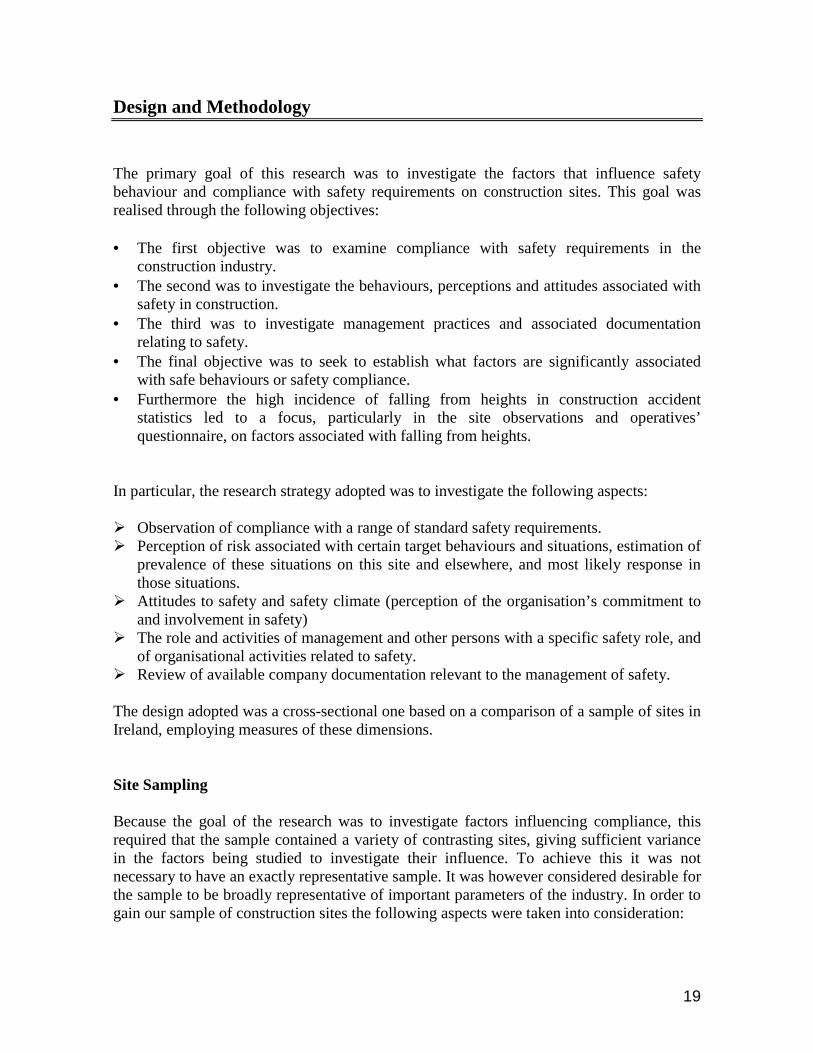
Table 15: Unguarded openings and missing guardrails /edge protection onhousing sites 33
Table 16: Factors and items measuring safety attitudes 41
Table 17: Factors and items measuring safety climate 42
Table 18: HSA/HSE role in construction safety on site 48
Table 19: Safety documentation in site 51
Table 20: Factors of compliance. 59
Table 21: Correlation between factors of non-compliance 60
7
Table 22: Factors related to the management system 61
Table 23: Correlations between Non-compliance and other variables in thisresearch 62
1
Executive Summary
Objectives and design
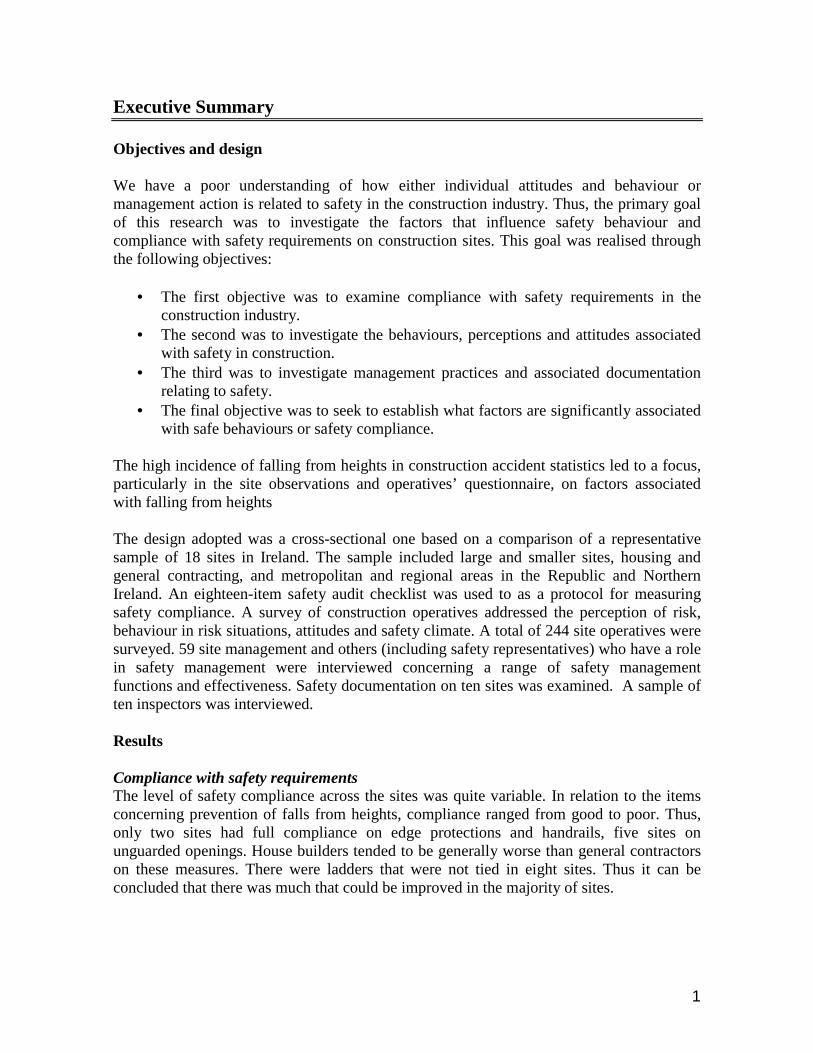
We have a poor understanding of how either individual attitudes and behaviour ormanagement action is related to safety in the construction industry. Thus, the primary goalof this research was to investigate the factors that influence safety behaviour andcompliance with safety requirements on construction sites. This goal was realised throughthe following objectives:
• The first objective was to examine compliance with safety requirements in theconstruction industry.
• The second was to investigate the behaviours, perceptions and attitudes associatedwith safety in construction.
• The third was to investigate management practices and associated documentationrelating to safety.
• The final objective was to seek to establish what factors are significantly associatedwith safe behaviours or safety compliance.
The high incidence of falling from heights in construction accident statistics led to a focus,particularly in the site observations and operatives’ questionnaire, on factors associatedwith falling from heights
The design adopted was a cross-sectional one based on a comparison of a representativesample of 18 sites in Ireland. The sample included large and smaller sites, housing andgeneral contracting, and metropolitan and regional areas in the Republic and NorthernIreland. An eighteen-item safety audit checklist was used to as a protocol for measuringsafety compliance. A survey of construction operatives addressed the perception of risk,behaviour in risk situations, attitudes and safety climate. A total of 244 site operatives weresurveyed. 59 site management and others (including safety representatives) who have a rolein safety management were interviewed concerning a range of safety managementfunctions and effectiveness. Safety documentation on ten sites was examined. A sample often inspectors was interviewed.
Results
Compliance with safety requirementsThe level of safety compliance across the sites was quite variable. In relation to the itemsconcerning prevention of falls from heights, compliance ranged from good to poor. Thus,only two sites had full compliance on edge protections and handrails, five sites onunguarded openings. House builders tended to be generally worse than general contractorson these measures. There were ladders that were not tied in eight sites. Thus it can beconcluded that there was much that could be improved in the majority of sites.
2
Perception of risk
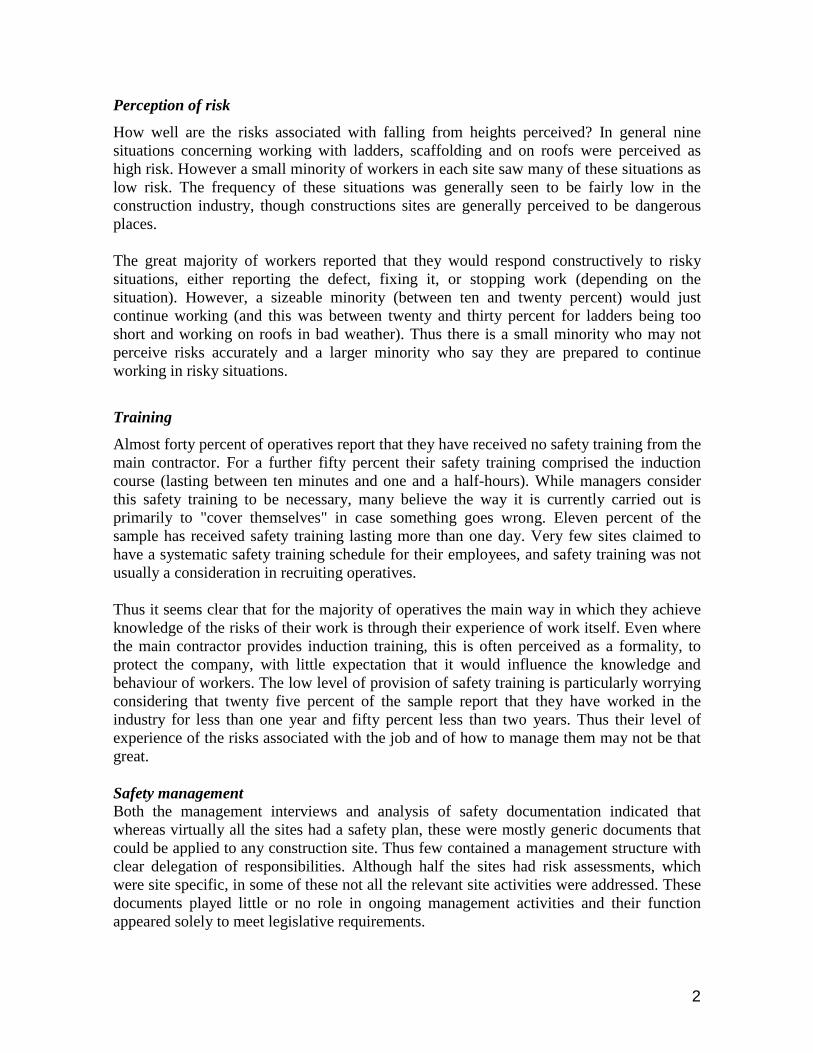
How well are the risks associated with falling from heights perceived? In general ninesituations concerning working with ladders, scaffolding and on roofs were perceived ashigh risk. However a small minority of workers in each site saw many of these situations aslow risk. The frequency of these situations was generally seen to be fairly low in theconstruction industry, though constructions sites are generally perceived to be dangerousplaces.
The great majority of workers reported that they would respond constructively to riskysituations, either reporting the defect, fixing it, or stopping work (depending on thesituation). However, a sizeable minority (between ten and twenty percent) would justcontinue working (and this was between twenty and thirty percent for ladders being tooshort and working on roofs in bad weather). Thus there is a small minority who may notperceive risks accurately and a larger minority who say they are prepared to continueworking in risky situations.
Training
Almost forty percent of operatives report that they have received no safety training from themain contractor. For a further fifty percent their safety training comprised the inductioncourse (lasting between ten minutes and one and a half-hours). While managers considerthis safety training to be necessary, many believe the way it is currently carried out isprimarily to "cover themselves" in case something goes wrong. Eleven percent of thesample has received safety training lasting more than one day. Very few sites claimed tohave a systematic safety training schedule for their employees, and safety training was notusually a consideration in recruiting operatives.
Thus it seems clear that for the majority of operatives the main way in which they achieveknowledge of the risks of their work is through their experience of work itself. Even wherethe main contractor provides induction training, this is often perceived as a formality, toprotect the company, with little expectation that it would influence the knowledge andbehaviour of workers. The low level of provision of safety training is particularly worryingconsidering that twenty five percent of the sample report that they have worked in theindustry for less than one year and fifty percent less than two years. Thus their level ofexperience of the risks associated with the job and of how to manage them may not be thatgreat.
Safety managementBoth the management interviews and analysis of safety documentation indicated thatwhereas virtually all the sites had a safety plan, these were mostly generic documents thatcould be applied to any construction site. Thus few contained a management structure withclear delegation of responsibilities. Although half the sites had risk assessments, whichwere site specific, in some of these not all the relevant site activities were addressed. Thesedocuments played little or no role in ongoing management activities and their functionappeared solely to meet legislative requirements.

3
Safety audits were conducted in all sites, mostly following a checklist method with awritten audit report. However few sites documented improvement measures or actionstaken to remedy audit deficiencies. Hazard reporting was rarely documented and the samewas true of incidents and near misses. Communication about safety was most ofteninformal and verbal. A quarter of the sites had regular dedicated safety meetings, though forothers safety was a frequent item on site meetings.
In all but one site some or all of the management had undertaken CIF/CEF training courses.Thus, having managers with this training did not discriminate between sites which werebetter or worse in safety compliance. A small number of safety managers had alsoundertaken diploma courses in health and safety management. Six sites had a safetyrepresentative. Most often, these had been appointed by the management.
Role of inspectionsThe majority of sites had at some time been subject to an inspection by national authorityinspectors. The primary focus of inspections concerns compliance with safety requirementsand the interviews with inspectors confirm many of the findings of this study in relation tocompliance levels in the industry. While site documentation is often inspected, there is nosystematic methodology for auditing or assessing the safety management system as afunctioning management process which is designed to ensure safety on site. Indeed,inspectors do not see it as their role to conduct such an audit. Inspections themselves do notappear to have a major direct influence on the effective management of site safety.
Factors associated with safety complianceThe presence of a safety representative on site shows the strongest relationship with safetycompliance. The only other factor associated with compliance is the second safetymanagement factor - effectiveness of response to audits and hazard reports. Although thereis a tendency for safety representatives to be present in sites with better general safetymanagement performance, it would be a mistake to conclude that this general safetymanagement factor accounts for the relationship between safety representatives andcompliance. It appears that safety representatives influence safety compliance not onlythrough their influence on the response to audits and hazards but also through other means.Thus they encourage the reporting of hazards and help ensure that these reports lead tobetter safety compliance on site. Their presence also makes it significantly less likely thatworkers will continue to work in hazardous situations.
There is no significant association between the general Safety management factor and anyother factor (with the possible exception of the appointment of safety representatives,which is almost significant). There is no significant correlation with Effectiveness of themanagement system, with safety compliance or the variables assessing safety behaviours.These results pose the question: why does so much activity which is undertaken in thename of safety apparently have so little influence on safety compliance and safetybehaviours?
There are no significant relationships between the attitudinal variables (safety attitudes,perception or risk and safety climate) and any of the safety outcome variables (compliance,

4
safety behaviours). This suggests that the difficulty of getting more consistent and higherstandards of safety compliance may not depend on attitudes and perceptions of workers andmanagers. Systemic factors are more important – having mechanisms for reporting hazards,following up on hazard reports and audits, and doing what it takes to ensure that hazardreports and audits are translated into effective compliance with safety requirements.
Recommendations
Safety RepresentativesThis study has demonstrated the potentially strong role which safety representatives canplay in influencing both behaviour and compliance with safety requirements, and ensuringthat both audits and hazard reports are effectively dealt with. All sites should have safetyrepresentatives and their role and functions should be reinforced as part of the safetymanagement system.
Training and certificationThe most plausible interpretation of the findings in relation to safety representatives is thattheir effectiveness is largely due to their ability to exert influence and persuasion throughinformal interpersonal methods. The social and interpersonal skills which this requiresshould not be the prerogative of safety representatives alone. There is enormous scope forimproving the ability of those who have management and safety responsibilities, andindeed all those who work in construction, to manage the human relations of safety moreeffectively. These skills are trainable and susceptible to systematic development. They needto be clearly and systematically addressed in all training related to safety in construction.
As far as possible, training should not only seek to foster awareness of hazard and risk, butit should strengthen knowledge and skills in managing risky situations effectively. Thisshould include the communications and interpersonal skills, which are necessary at everylevel to ensure that the correct influences on behaviour are consistently reinforced.Transfer of these skills to the working environment needs to be carefully fostered andmonitored. All levels of training should be addressed including:
• Site induction and refresher training• Initiation to the industry and specific crafts / trades training• Management training. Particular attention should be paid to fostering participation
in in-depth professional safety management training at diploma and masters level.
The safety management systemClearly the requirements for safety management systems need to be radically reviewed andoverhauled. It is too easy to comply with the law through having a paper system, whichdoes not effectively operate in practice. This review should address:
• Developing stronger criteria for active and effective safety management systems.These should include design and planning, day-to-day management and monitoringand auditing practices.
• These criteria should be developed in new ways of auditing safety managementsystems, which can routinely and reliably assess the activity and effectiveness of thesystem.
5
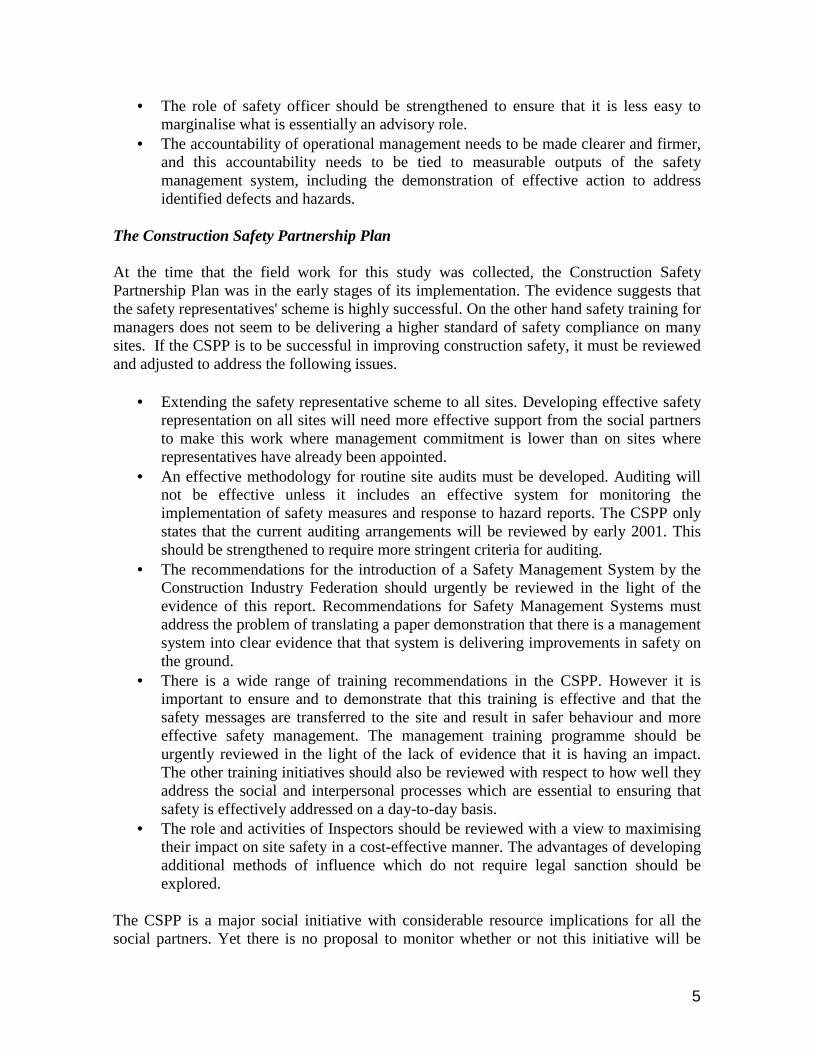
• The role of safety officer should be strengthened to ensure that it is less easy tomarginalise what is essentially an advisory role.
• The accountability of operational management needs to be made clearer and firmer,and this accountability needs to be tied to measurable outputs of the safetymanagement system, including the demonstration of effective action to addressidentified defects and hazards.
The Construction Safety Partnership Plan
At the time that the field work for this study was collected, the Construction SafetyPartnership Plan was in the early stages of its implementation. The evidence suggests thatthe safety representatives' scheme is highly successful. On the other hand safety training formanagers does not seem to be delivering a higher standard of safety compliance on manysites. If the CSPP is to be successful in improving construction safety, it must be reviewedand adjusted to address the following issues.
• Extending the safety representative scheme to all sites. Developing effective safetyrepresentation on all sites will need more effective support from the social partnersto make this work where management commitment is lower than on sites whererepresentatives have already been appointed.
• An effective methodology for routine site audits must be developed. Auditing willnot be effective unless it includes an effective system for monitoring theimplementation of safety measures and response to hazard reports. The CSPP onlystates that the current auditing arrangements will be reviewed by early 2001. Thisshould be strengthened to require more stringent criteria for auditing.
• The recommendations for the introduction of a Safety Management System by theConstruction Industry Federation should urgently be reviewed in the light of theevidence of this report. Recommendations for Safety Management Systems mustaddress the problem of translating a paper demonstration that there is a managementsystem into clear evidence that that system is delivering improvements in safety onthe ground.
• There is a wide range of training recommendations in the CSPP. However it isimportant to ensure and to demonstrate that this training is effective and that thesafety messages are transferred to the site and result in safer behaviour and moreeffective safety management. The management training programme should beurgently reviewed in the light of the lack of evidence that it is having an impact.The other training initiatives should also be reviewed with respect to how well theyaddress the social and interpersonal processes which are essential to ensuring thatsafety is effectively addressed on a day-to-day basis.
• The role and activities of Inspectors should be reviewed with a view to maximisingtheir impact on site safety in a cost-effective manner. The advantages of developingadditional methods of influence which do not require legal sanction should beexplored.
The CSPP is a major social initiative with considerable resource implications for all thesocial partners. Yet there is no proposal to monitor whether or not this initiative will be

6
effective in improving safety in the construction industry. A systematic evaluation strategyneeds to be developed urgently.

7
Literature review: Construction Related Fatality Statistics
The number of fatalities at work in the construction sector remains a matter of seriousconcern for the Government, employers and employees alike (HSA, 1999). Statistics on fatalities generally places the construction sector as the second highestindustry, only surpassed by the agricultural sector. Among the most common sources offatalities in construction, falls from heights is the category that accounts for the highestproportion of deaths. A brief comment of some statistics will be given below, especially forNorthern Ireland and the Republic. Some international figures for falls from heights willalso be reproduced as an example of the relatively high percentage of fatalities in thiscategory reported in the literature.
Construction Fatality Rates in Europe
The HSE (2001) reports that the European average fatality rate in construction was 13.3 per100,000 workers in 1996. In contrast with that figure, the HSA (1999) has reported a rate of8 fatalities for 100,000 workers for the Republic of Ireland in 1996. Although under theEuropean average of fatalities, Ireland still shows a higher incidence than countries asFrance, the United Kingdom or Spain (see table 1).
Country Year Fatality Rate per100,000 workers
Europe 1996 13.3 Germany 1996 15.4 Italy 1996 14.4 France 1996 12.1 RoI 1996 8.0 UK 1996 5.6 Spain 1996 4.2
Table 1: Fatality rates for selected EU Member States
Construction-related fatalities in the UK
Brabazon et al. (2000) looked at the rate of fatalities between 1993 and 1998. For theprimary building trades, the rate was 1 in 11,000 per year. This is below the HSEintolerable risk criterion of 1 in 1000 and HSE guideline of 1 in 10,000. However,scaffolding trades (1 in 5,400), roofing trades (1 in 3,800), steel erectors, bar bending andstructural trades (1 in 3000) were above the HSE’s guideline.
8
Brabazon et al. (2000) noted that since the Construction Design and MaintenanceRegulations were introduced in the UK in 1994, the overall fatality rate had decreased by10%. However the downward trend in the number of injuries on construction sites, is nowslowing. Davies & Tomasin (1996) reported that 70-80% of all fatalities in the UK each year isattributed to falls. Falls from one level to another, falls on the same level and plantmachinery and structures falling and striking, crushing or burying people were accountedfor that percentage. On the other hand, when considering only the category “falls ofpeople,” 52% out of the 681 construction-related deaths between 1981 and 1985 were inthis category. Construction Related Fatalities in Northern Ireland 92 fatalities in the construction industry occurred in the North of Ireland between 1980 and1998. 47 of these fatalities were due to falls. Other common causes of fatalities were due tovehicles in movement (15 fatalities), impacts or being struck (12), electrocution (9) andtrespassing (5). In comparison with the others, the above figure for falls represents 51% ofall the fatalities in that period.
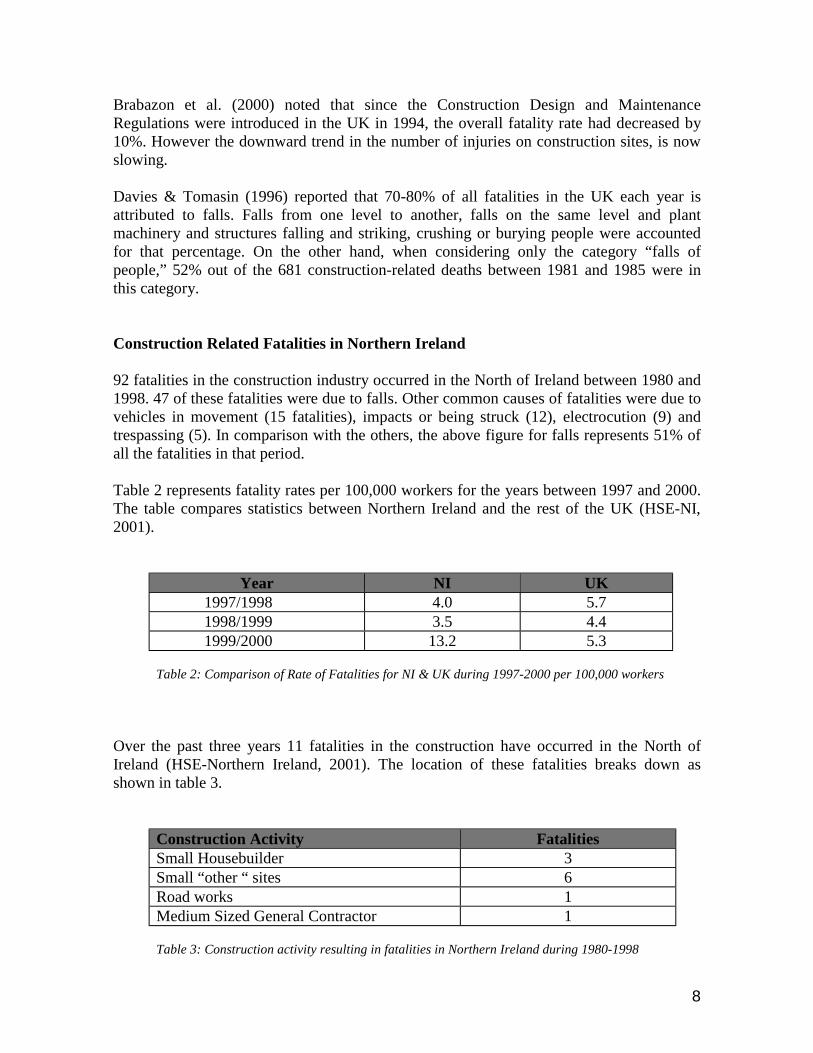
Table 2 represents fatality rates per 100,000 workers for the years between 1997 and 2000.The table compares statistics between Northern Ireland and the rest of the UK (HSE-NI,2001).
Year NI UK 1997/1998 4.0 5.7 1998/1999 3.5 4.4 1999/2000 13.2 5.3
Table 2: Comparison of Rate of Fatalities for NI & UK during 1997-2000 per 100,000 workers
Over the past three years 11 fatalities in the construction have occurred in the North ofIreland (HSE-Northern Ireland, 2001). The location of these fatalities breaks down asshown in table 3.
Construction Activity Fatalities Small Housebuilder 3 Small “other “ sites 6 Road works 1 Medium Sized General Contractor 1 Table 3: Construction activity resulting in fatalities in Northern Ireland during 1980-1998
9
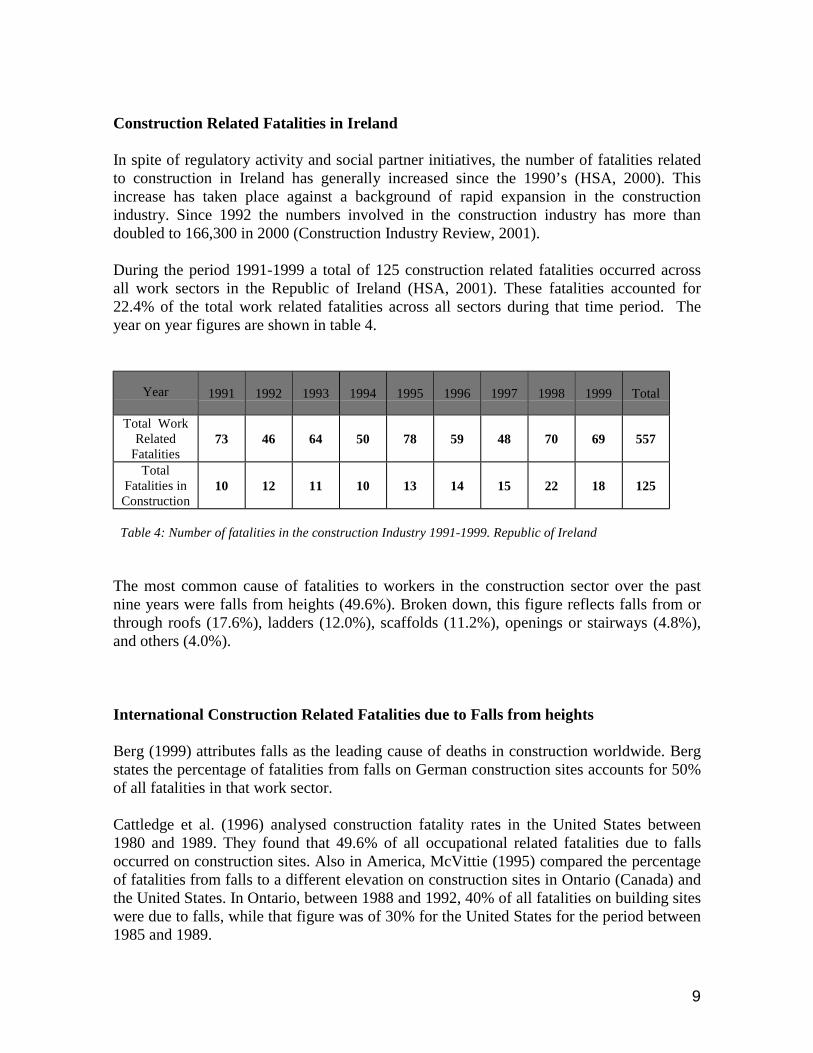
Construction Related Fatalities in Ireland In spite of regulatory activity and social partner initiatives, the number of fatalities relatedto construction in Ireland has generally increased since the 1990’s (HSA, 2000). Thisincrease has taken place against a background of rapid expansion in the constructionindustry. Since 1992 the numbers involved in the construction industry has more thandoubled to 166,300 in 2000 (Construction Industry Review, 2001). During the period 1991-1999 a total of 125 construction related fatalities occurred acrossall work sectors in the Republic of Ireland (HSA, 2001). These fatalities accounted for22.4% of the total work related fatalities across all sectors during that time period. Theyear on year figures are shown in table 4.
Year
1991 1992 1993 1994 1995 1996 1997 1998 1999 Total
Total WorkRelated
Fatalities 73 46 64 50 78 59 48 70 69 557
TotalFatalities inConstruction
10 12 11 10 13 14 15 22 18 125
Table 4: Number of fatalities in the construction Industry 1991-1999. Republic of Ireland
The most common cause of fatalities to workers in the construction sector over the pastnine years were falls from heights (49.6%). Broken down, this figure reflects falls from orthrough roofs (17.6%), ladders (12.0%), scaffolds (11.2%), openings or stairways (4.8%),and others (4.0%).
International Construction Related Fatalities due to Falls from heights Berg (1999) attributes falls as the leading cause of deaths in construction worldwide. Bergstates the percentage of fatalities from falls on German construction sites accounts for 50%of all fatalities in that work sector. Cattledge et al. (1996) analysed construction fatality rates in the United States between1980 and 1989. They found that 49.6% of all occupational related fatalities due to fallsoccurred on construction sites. Also in America, McVittie (1995) compared the percentageof fatalities from falls to a different elevation on construction sites in Ontario (Canada) andthe United States. In Ontario, between 1988 and 1992, 40% of all fatalities on building siteswere due to falls, while that figure was of 30% for the United States for the period between1985 and 1989.

10
In Asia, Byung Yong Jeong (1998) reported on construction related fatalities in SouthKorea. This study showed that falls from heights accounted for 42% of all constructionrelated fatalities between 1991 and 1994. Tam and Fung (1998) report the fatality rateamong construction workers in Hong Kong during 1985 and 1994 was 86.8 per 100,000. Summary
Approximately fifty percent of construction fatalities have been attributed, in a wide rangeof studies, to falls from heights. Furthermore, scaffolders, roofers, steel and structuraltrades have a high risk of fatal accident, though fatalities occur across a wide range ofconstruction occupations. The statistics also show that fatalities are spread across housingconstruction and general contracting, large and small companies (though much of theindustry is made up of small subcontractors) and in both urban and rural regions.
11
Regulatory Activity in the Republic of Ireland and Northern Ireland
The Republic of Ireland
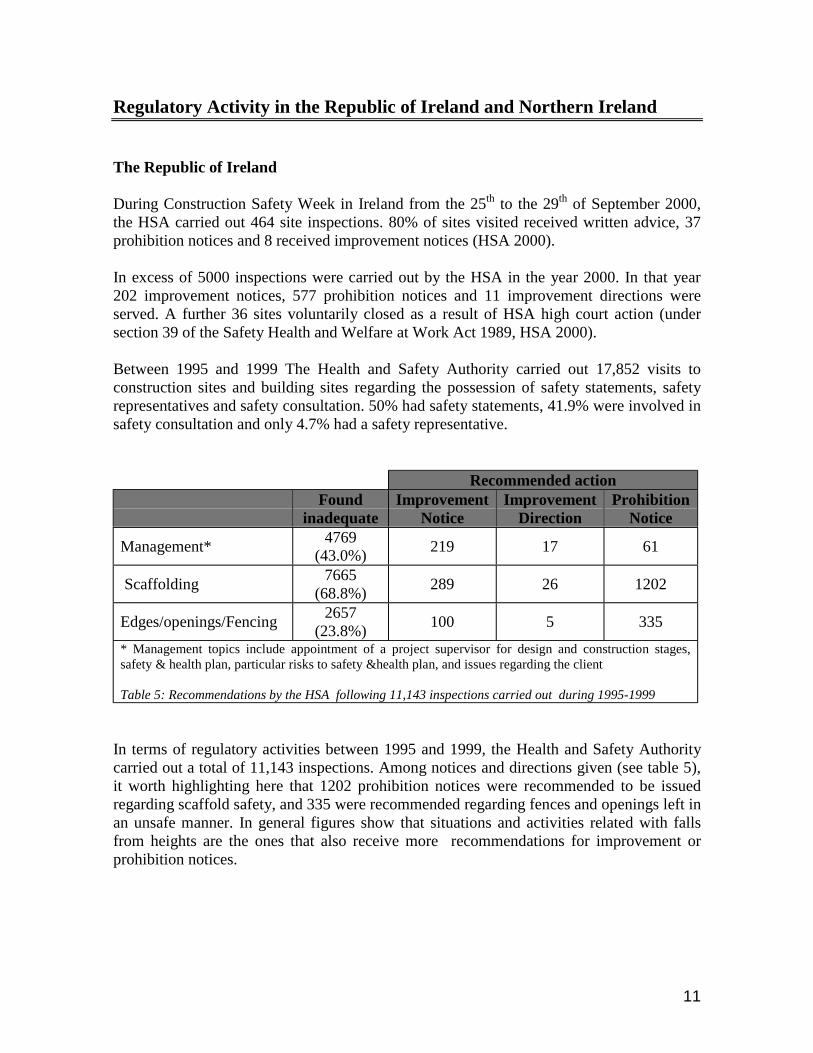
During Construction Safety Week in Ireland from the 25th to the 29th of September 2000,the HSA carried out 464 site inspections. 80% of sites visited received written advice, 37prohibition notices and 8 received improvement notices (HSA 2000). In excess of 5000 inspections were carried out by the HSA in the year 2000. In that year202 improvement notices, 577 prohibition notices and 11 improvement directions wereserved. A further 36 sites voluntarily closed as a result of HSA high court action (undersection 39 of the Safety Health and Welfare at Work Act 1989, HSA 2000). Between 1995 and 1999 The Health and Safety Authority carried out 17,852 visits toconstruction sites and building sites regarding the possession of safety statements, safetyrepresentatives and safety consultation. 50% had safety statements, 41.9% were involved insafety consultation and only 4.7% had a safety representative.
Recommended action Found
inadequate Improvement
Notice Improvement
Direction Prohibition
Notice
Management* 4769(43.0%) 219 17 61
Scaffolding 7665(68.8%) 289 26 1202
Edges/openings/Fencing 2657(23.8%) 100 5 335
* Management topics include appointment of a project supervisor for design and construction stages,safety & health plan, particular risks to safety &health plan, and issues regarding the client Table 5: Recommendations by the HSA following 11,143 inspections carried out during 1995-1999
In terms of regulatory activities between 1995 and 1999, the Health and Safety Authoritycarried out a total of 11,143 inspections. Among notices and directions given (see table 5),it worth highlighting here that 1202 prohibition notices were recommended to be issuedregarding scaffold safety, and 335 were recommended regarding fences and openings left inan unsafe manner. In general figures show that situations and activities related with fallsfrom heights are the ones that also receive more recommendations for improvement orprohibition notices.
12
Planned Regulatory Activity in 2001
The HSA has published a work programme for 2001 planning its regulatory activity for theconstruction sector. (HSA, 2001a). Specific objectives include: ! Codes of Practice on Roof Work and Cranes for publication in 2002.! 7,000 inspections to enforce compliance in relation to safe working at heights and site
traffic management.! 100 inspections of Architectural and Engineering practices relating to issues arising
from site inspections. Regulatory Activity in Northern Ireland
For the year ending the 31st of March 2001 the HSE-NI carried out 1070 inspections and250 investigations. (HSE-NI 2001).
Summary
Scaffolding safety and unguarded openings are major factors leading to prohibition andimprovement notices. Inspections have shown that fifty percent or more sites have no safetystatement or do not engage in safety consultation. The proportion of sites with safetyrepresentatives is less than five percent.

13
Safety Antecedents in the literature on Construction
While there is a good understanding of the extent and patterns of accidents in theconstruction industry, there is only limited evidence about the full range of factorscontributing to those. From a psychosocial point of view, the available literature on safetyon construction sites is relatively scarce when compared with other industrial sectors in oursociety. Important areas of interest when predicting individual safety behaviour andorganisational safety performance are those related to compliance with procedures,effective management systems, organisational climates and cultures, and performance inthe face of risks.
A review of the relevant literature addressing those areas follows. A selection of the mostimportant research and conclusions that have guided the theoretical frame of this project isoffered to outline the reasons behind this research. The main contributions to highlight fromthe literature review is the choice of compliance rather than safety accidents as ourdependent variable, and the selection of those factors that seems to influence safetybehaviour and compliance on site: individual factors, site factors and also factors outsidethe site boundaries.
Non-compliance versus accidents as measure of safety performance
All interventions oriented to improve safety in the workplace have accident reduction as theultimate objective and so the criteria against which to measure the effectiveness of suchinterventions. According to Duff et al. (1993), accident frequency is “the most objectivemeasure of safety performance.” However the scientific literature has highlighted that anaccident is, to some degree, a chance event requiring a combination of circumstances.Additionally, a HSE (1988) investigation has shown that accidents, especially less seriousones, are subject to gross under-reporting. Managers may also be careful in releasinginformation that could affect the future stability of their business or be used in any wayagainst them.Alternatively, better safety performance of a business, or progressive improvement ofsafety when a successful intervention has been carried out, brings the accident rate to alower level than before, increasing the difficulties of identifying it accurately. This alsodecreases the accuracy in measuring the amount of improvement due to the interventionover time (Duff et al., 1993).The combination of above features makes accident frequency difficult to measure in anyresearch. Whatever the objective characteristics, it can be said that accident frequencycannot be considered to be a robust measure for research purposes.Duff et al. (1993) designed an alternative measure of safety performance based oncompliance with safety procedures in particular situations or by means of individualbehaviour. The authors validated an observational tool that turned up to objectively andreliably measure safety performance in percentages of compliance. This tool was composedby 41 items representing critical safety standards that offer data appropriate to be used in

14
many different safety management strategies, such as performance auditing, trainingdesign, incentive system design, and goal-setting (Robertson et al, 1999).
Safety consequences of non-compliance with procedures
A key defence against hazards being realised in high-risk industries is the proceduralisationof tasks – defining key rules and procedures which need to be followed to ensure that thework is done both efficiently and safely. One very promising line of enquiry concerning thebehavioural antecedents of accidents concerns the relationship between these proceduralinstructions governing work and the way in which work is done. Not following procedureshas been implicated as a contributory factor in incident and accident occurrence in a widerange of industries. Some of these studies have provided measures of the normative level ofprocedure violations, which varies from under 20 to over 50 percent of recorded tasks. Inthe construction industry in the U.K., Duff et al. (1993) found percentages of non-compliance with specific categories in 6 construction sites ranging from 22-38% of non-compliance in housekeeping, from 12-43% of non-compliance in scaffolding, from 20-26%of non-compliance in access-to-heights, and from 21-65% of non-compliance in using PPE.Also from the U.K., Robertson et al. (1999) found that non-compliance was around 19% forhousekeeping, 16% for scaffolding, 15% for access-to heights, 21% for P.P.E., and 13% forplant. Lingard et al. (1997) reported from Hong Kong percentages ranging from 30-49% ofnon-compliance in housekeeping, from 30-66% of non-compliance in bamboo scaffolding,from 50-74% of non-compliance in access-to-heights, and from 49-69% of non-compliancein PPE.
The importance of this work is that it provides a mechanism for relating observed orreported behaviour with an identifiable safety standard (the official procedure). This hasopened up productive avenues for researching into the situational factors (task,organisation, resources, individual), which make such violations more likely. Not allviolations are serious from a safety point of view (sometimes there are more efficient waysof working). However, it is possible to identify violations that could result in seriousconsequences.
Interventions to improve safety
One major goal of safety research is to support interventions that can demonstrablyimprove safety. However, thorough empirical studies are rare and they normally focus onchanging individual behaviour.
Duff et al. (1993) and Robertson et al. (1999) carried out a two – phased study on theeffectiveness of different intervention strategies. Specifically, they looked at the effects offeedback, goal setting and training, on safety performance. They found that the techniquesused produced marked improvements in site safety, participative goal-setting being themore effective of the three. However, a continuous and consistent intervention along thelifecycle of the site was recommended to achieve the maximum benefit. The results also

15
highlighted the vital role of management commitment in the effectiveness of theintervention methods used.
Lingard and Rowlinson (1998) used a similar design to Duff et al. (1993) in the Hong Kongconstruction industry. They reported highly significant improvements in housekeeping withtheir intervention. However, in general, the intervention did not result in significantimprovements in the areas of access to heights or bamboo scaffolding. Again, the mainreason was the management commitment towards those two areas of activity. Theyconcluded in relation to that in “behaviour-based safety management programs... safebehaviour can only be achieved where a basic safety infrastructure is already in place” (p.225). Other variables of interest, such as attitudes and safety climate, have received littleattention in the literature. For example, Langford et al. (2000) carried out a research onsafety attitudes in construction workers. This identified some variables that influenced theattitude of construction workers towards safe behaviour: organising for safety supervisionand equipment management, industry norms and culture, attitudes to risk taking, andmanagement behaviour. However, there are no data available for the influence of attitudeson behavioural or site performance. In her degree project, Curran (2000) researched safetyattitudes and the safety climate on one construction site. However, the results cannot begeneralised. To our knowledge, this is the only research on safety climate in theconstruction industry. In relation to management strategies, Tam and Fung (1996), for example, looked at theeffectiveness of the safety management strategies of 45 construction firms in Hong Kong.They report that most safety schemes, strategies or interventions reduced the accident rateson these sites. These schemes strategies and interventions included: ! Level of management responsibility! Orientation programmes! Safety personnel on site! Safety awards and incentive schemes! Post accident investigation and feedback! Safety training and intensity of safety training! Presence of safety committees And from the site of the regulatory authorities, Berg (1999) reports on a safety campaigncarried out in 9 regions in Germany during 1995 and 1996 by 50 inspectors from therelevant construction site regulatory authority. This same authority without documentingany methodologies or indicators of effectiveness other than re-inspecting sites, reports theresults of this campaign as follows: ! A conviction that a substantial increase in safety and health within the region and on
sites involved in the campaign has occurred.! An opinion that the campaign helped in raising awareness of the severity of, and hence
importance of falls.

16
! A conviction that the campaign identified fall hazards on sites to site management.! An opportunity to provide solutions for contractors in the area of fall prevention.! Confirmation of a partnership approach to safety and health with the participating firms.
In brief, construction has not been subject to much intervention research, largely because ofthe complexity of the industry (Ringen et al., 1996). Of the interventions carried out,behaviour-based programs are the most popular when attempting to change safetyperformance. Although positive and significant results are generally obtained, interventionscan be said to be of limited success. Management commitment is identified every time as akey element in guaranteeing the successful implementation and completion of a program.However, intervention at managerial level is rare and studies carried out, while highlightingthe important role of management, are exploratory and descriptive (for example,Whittington et al, 1992), rather than intervention programs to change safety performance.Safety campaigns are directed to increase worker awareness and said to be effective inimproving safety performance, but systematic research suggests that posters and campaignshave limited success (Saarela et al, 1989, quoted by Duff et al. 1993), and do not make alasting impact on the accident/injury rate. Variables such as climate, culture and attitudes,found to be of importance for safety performance in other industries, have yet not beenresearched in construction in a systematic way.
Functional effectiveness of safety management systems
A second level of explanation for safety failures concerns the effectiveness of the safetymanagement system. To quote three examples, Whittington et al (1992) comment that theconstruction industry characteristics that lead to the poor safety record are deep rooted andcomplex. They go on to state that problems at site level could often be traced back tomanagement issues such as poor contractor selection, lack of supervision or inadequatetraining. The European Construction Institute (ECI, 1996) reports that one of the reasonsfor the industry’s poor safety and health reason has been the lack of a systematic approachto the management of risk. Mohamed (1999) also reports that the construction industry ingeneral seems to suffer from an inability to manage workplace safety and health to anextent where a proactive zero accident culture prevails.
Whittington et al. (1999) indicated how the industry and potential clients were also seen tobe responding to safety management demands in a fundamentally flawed manner by wayof: ! Being dealt with at a late stage of the project cycle! Undue emphasis on the failure of individual workers resulting in short term measures
rather than resolving underlying organisational problems.! Competitive tendering resulting in a failure to address safety requirements at bidding
and tendering stages.! Safety issues being inadequately addressed in planning and scheduling of work.! Lack of safety performance monitoring and feedback.

17
! A lack of opportunities for formal project reviews to include organisational learning andpro-active safety management.
In order to reduce the level of fatalities injury and ill health in the construction industry, anumber of safety management systems are available detailing the elements currentlythought necessary to reduce risks. Publications like Successful Health and SafetyManagement (HSE 1997, BS8800: 1996; OHSAS: 1999; OHSAS, 2000) give goodpractical guidance on the requirements for effective safety management.
A number of construction specific safety management systems and codes of practice aredocumented. The HSE in the UK have produced a guidance document; Health and Safetyin Construction. (HSE, 1997a). The HSE have also published a Code of Practice onCompliance with the UK Construction Design and Maintenance Regulations 1994 (HSE,1994a). The HSA have produced guidelines for the equivalent Irish Legislation (HSA,1995). It has also published a Code of Practice for Access and Working Scaffolds (HSA,1999), and it is producing two new codes of practice on roof work and crane usage (HSA,2001a). The Construction Industry Federation in Ireland (CIF, 2001), the EuropeanConstruction Institute (1996) or authors as Clarke (1999) or Gibb (1995) also details healthand safety management systems and risk assessment procedures that can be used in theconstruction industry. Irrespective of the number of guidelines available, research into theelements of the proposed management systems that are effective in the constructionindustry, still needs to be conducted. However, a number of studies do link management commitment with particular findings,especially effectiveness of the intervention programme. For example, Duff et al. (1993)concluded that management commitment was an important moderator of the effectivenessof the intervention carried out. Six years later, in phase two of their research Robertson etal. (1999), concluded that management commitment to the intervention programme was“vitally important, impacting on all aspects of the methodology.” Positive correlationsappeared between management commitment and safety performance improvement on site,and between management commitment and management participation in all stages of theintervention.
Summary
While accident frequency is an objective measure in safety-related researches, measuresbased on compliance with procedures seems to be more appropriate for comparisonbetween sites as is identifying change when intervention programmes are implemented. Forthe construction sector, Duff et al. (1993) have designed and researched a compliance-based measure that has been shown to be valid and reliable. Therefore, it has been adoptedfor this research.
Studies suggest that a compliance with safety procedures varies widely across categories ofprocedure and in different sites. For example, rates of non-compliance with scaffolding

18
requirements between 12% and 43% have been reported. Evaluations of a range ofinterventions to improve safety have addressed goal setting, training and otherbehaviourally based programmes. While some of these have demonstrated success in theshort term, a common conclusion emphasises the importance of sustained managementcommitment and activity in ensuring the effective implementation of these programmes.However, there is a lack of systematic research concerning the management of safety inconstruction. Also, while there have been some studies of attitudes and perceptions ofconstruction workers towards safety and safety management, they have not addressed thelink between these variables and safety behaviours and compliance with safety procedures.
Therefore, it can be concluded that the factors, at both individual and management level,which influence sustained compliance with safety requirements are not well understood.This study aims to address this critical gap in our knowledge about construction safety.
19
Design and Methodology The primary goal of this research was to investigate the factors that influence safetybehaviour and compliance with safety requirements on construction sites. This goal wasrealised through the following objectives: • The first objective was to examine compliance with safety requirements in the
construction industry.• The second was to investigate the behaviours, perceptions and attitudes associated with
safety in construction.• The third was to investigate management practices and associated documentation
relating to safety.• The final objective was to seek to establish what factors are significantly associated
with safe behaviours or safety compliance.• Furthermore the high incidence of falling from heights in construction accident
statistics led to a focus, particularly in the site observations and operatives’questionnaire, on factors associated with falling from heights.
In particular, the research strategy adopted was to investigate the following aspects: ! Observation of compliance with a range of standard safety requirements.! Perception of risk associated with certain target behaviours and situations, estimation of
prevalence of these situations on this site and elsewhere, and most likely response inthose situations.
! Attitudes to safety and safety climate (perception of the organisation’s commitment toand involvement in safety)
! The role and activities of management and other persons with a specific safety role, andof organisational activities related to safety.
! Review of available company documentation relevant to the management of safety. The design adopted was a cross-sectional one based on a comparison of a sample of sites inIreland, employing measures of these dimensions.
Site Sampling
Because the goal of the research was to investigate factors influencing compliance, thisrequired that the sample contained a variety of contrasting sites, giving sufficient variancein the factors being studied to investigate their influence. To achieve this it was notnecessary to have an exactly representative sample. It was however considered desirable forthe sample to be broadly representative of important parameters of the industry. In order togain our sample of construction sites the following aspects were taken into consideration:

20
! Comparison of sites in Northern Ireland and Republic of Ireland! Comparison of sites in Dublin and other urban areas in the Republic! Comparison of small and larger building sites! Comparison of House Building work with General Contracting work Because the absence of a comprehensive database of the number and location of theconstruction sites in Ireland and the current stage of their projects, it was impossible toconstruct a probabilistic random sample. As a consequence, the sample was stratifiedaccording to the following criteria: from site-lists from CIS reports (dating from October1999 to May 2000) and other sources. Sites that did not have a start date or price and anyvalued at less than one million Irish pounds were discarded in the selection process. Theremaining sites were classified as using above criteria. Upon this classification, a sample ofsites per each category was selected following a random selection and site managers wereasked for participation in the research. This process was carried out until completing thepre-selected number of sites per category. In a few cases, as for Dublin, the objective sitecategories could not be filled accordingly to above procedure and then sites were selectedon a convenience basis (mainly approaching visually located sites). The HSE in NorthernIreland were contacted and they provided the names of a number of Contractors who werecarrying out work in the Belfast area.
Because of the possibility of biases in the final composition of the sample, the question ofsampling will be considered again in the discussion section of this document. Analysis of the fatality statistics allowed those sites to be chosen that most closely matchedthe type of contractor and the trade of recorded fatalities that most represented thecharacteristics of the fatalities. However due to practical limitations the sample did notrepresent very small sites or sites in purely rural areas. A total of eighteen construction sites took part in this research project. Table belowprovides a breakdown of sites across the different areas. For the purpose of the study smallsites were defined as being worth between one and five million Irish punts in the Republicof Ireland and one and five million pounds sterling in Northern Ireland. Large sites weredefined as being worth over five million Irish punts in the Republic of Ireland and over fivemillion pounds sterling in Northern Ireland. Table 6 provides a breakdown of sites in the sample and table 7 provides a detaileddescription of each of the sites visited.
Large GeneralContracting
Small GeneralContracting
LargeHousing
SmallHousing
Total
Dublin 4 1 2 1 8 RoI Urban 3 1 4 Belfast 3 1 4 NI Urban 1 1 NI Rural 1 1 Table 6: Breakdown of sites by type and size

21
SITE DESCRIPTION
Site Project type Location
Numberof
workers
Size m 2 *
Build Type Main structures and activities
01 SocialInfrastructure
Dublin 80 30,000 New build Substructure External walls to first floor level Internal walls to first floor level
02 SocialInfrastructure
Dublin 80 >250,000
New build Substructure External wall and cladding in part
Roof deck 03 Social
Infrastructure Dublin 200 >250,000 New build Substructure , external walls
Steel framework Roof and roof covering
04 SocialInfrastructure
Dublin 30 20,000 New build Substructure Internal fixtures and fittings
Roof and roof covering, 05 Housing Dublin 40 50 units New build Substructure External & Internal walls
Floor slabs in place Services in part
06 Housing Dublin 50 250 units New build Substructure in part Roof and roof covering in part
Internal fixtures and fittings in part 07 Housing Dublin 60 150 units New build Substructure in part
Roof and roof covering in part Internal fixtures and fittings in part
08 SocialInfrastructure
Dublin 50 1,000 Renovationrefurbishment
Internal fixtures and fittings Internal partitions
Finishes 09 Social
Infrastructure Republic of
Ireland 40 15,000 New build Ground floor
First floor slab Roof deck
10 Housing Republic ofIreland
20 50 units New build Substructures in part Roof and roof covering in part Internal
fixtures and fittings in part 11 Housing Republic of
Ireland 160 450 units New build Substructure
External walls part Roof and covering part
12 SocialInfrastructure
Republic ofIreland
150 10,000 Renovation ofexisting /expansion
Topped out Internal partitions fixtures and fittings
Services 13 Social
Infrastructure Belfast 100 12,000 New build Substructure
Steel framework External walls, roof and covering part
14 SocialInfrastructure
Belfast 50 15,000 New build Substructure Steel framework
External walls part 15 Social
Infrastructure Belfast 60 15,000 New build Nearly complete
Internal fixtures and fittings Services
16 Housing NorthernIreland
20 50 units New build <10 units incomplete External walls
Internal partitions and floors. 17 Housing Northern
Ireland 30 50 units Refurbishment &
development ofexisting structure
Groundworks Internal partitions
Basement and ground floor slabs 18 Housing Northern
Ireland 20 30 units New build <10 units incomplete
Roof and roof covering in part Internal fixtures and fittings in part
Housing could consist of residential units ranging from one bed apartments to five bed detached houses. Social Infrastructure: small lessthan 5000m2/ Large over 5000m2. Housing: small Less than 100 units/ Large Over 100 units Table 7: Description of the characteristics of the sites in the sample.

22
Procedure
At least four researchers visited each of the eighteen sites and spent approximately half aday on each site. Due, primarily, to the availability of the research staff, managementinterviews, operative’s surveys and observational surveys were conducted at the same time,independently by different research personnel, on all Dublin sites. However, on sites in theIrish Republic, outside Dublin and in Northern Ireland, management interviews andoperatives surveys were conducted at the same time and site observations were conductedon a different day. Methodology
A variety of methodologies were adopted in order to reflect the different aspects ofconstruction sites and to reflect overall project objectives. A pilot study was carried out andthe necessary amendments were made to the instruments before the main research started. The pilot study was conducted in one large construction site. The safety compliancemeasure was tested using several independent ratings and criteria for ratings were agreed.The questionnaire and interview methodologies were also examined with samples ofmanagers, workers and a safety representative. Adjustments to the procedure foradministering these were made to ensure effective data collection. The four methodologies used were: • Site management interviews• Analysis of documentation• Systematic site observations• Operative surveys
The Observational Study
Duff et al. developed a 41-item safety audit checklist for assessing safety and healthperformance on construction sites as part of a safety management intervention programmecarried out in 1993. This tool was chosen as it had been validated in Duff et al. study and itmost closely resembled the objectives and conditions preview in our research. The safety audit checklist was piloted on a large Dublin construction site. Based on thispilot study, a modified 18-item safety audit checklist was produced covering site safetysituations and behaviours encountered under the general headings of Housekeeping,Scaffolding and work platforms, Access to heights, and Personal protective equipment (seetable 8 below).

23
Housekeeping Item 1 Unguarded Openings Item 2 Rubbish on Access Routes Item 3 Storage of Materials
Scaffolding and workplatforms
Item 4 Rubbish on Scaffolding Item 5 Missing Scaffold Boards Item 6 Trapped Scaffold Boards Item 7 Missing Toeboards Item 8 Missing Guardrails or Edge Protection Item 9 Missing Baseplates Item 10 Misuse of Scaffold
Access to heights
Item 11 Ladders Too Short Item 12 Ladders Incorrectly Tied Item 13 Safe use of Ladders Item 14 Defective Ladders
Personal protectiveequipment
Item 15 Hard Hat External Use Item 16 Hard Hat Internal Use Item 17 Protective Footwear Item 18 Viz Vest Wearing
Table 8: The 18 safety items that were observed for that research.
All 18 items were rated on a percentage scale of compliance with recommended site safetypractice. The procedure for the observational study carried out on each site visited was asfollows: • A generalised description of the site including size, number of site personnel, stage of
construction and weather conditions was carried out.• The researcher then surveyed the site and recorded all information on the safety audit
checklist. In recording the information three responses were possible and recorded inspecified ways:
• Unsafe conditions or behaviours were recorded as percentage of items or operatives onsite not conforming with recommended practice. Hence, the percentage of non-compliance was recorded.
• Safe items were recorded as ‘zero.’• If the situation or behaviour was not seen, a ‘Not seen’ was recorded. All safety items on the safety audit checklist were completed for all the 18 sites surveyed. The only exception to this procedure occurred on site 10. Due to heavy rain encounteredduring the observational survey period, there were no workers on site. Due to time

24
pressures in rearranging access, it was decided to record site conditions observed, and usethem in the study. Site operative behaviour was recorded as ‘Not seen.’
The Operative Survey
A total of 244 questionnaires were completed across 18 sites. At the beginning of each sitevisit the number of operatives and sub-contractors on site was sought. It was decided tosample approximately 20% of all operatives on site (including both company operativesand sub-contractor operatives). Two researchers were involved in administering the survey.Each researcher approached an operative, outlined the aims of the study and asked if theywould be interested in participating in the survey. On each site a representative sample ofboth the company operatives and the sub-contractors' operatives were covered as well as allareas on the site. Completion of the survey took approximately 15-20 minutes. An important purpose of the project was to explore the safety antecedents at the individuallevel. The main agents to report on safety in the workplace at that level are those peopleworking in the ‘front line’, which means the operatives. As the literature and statistics highlight the category of falls from height as accounting forthe most frequent and severe accidents in the construction sector, the instrument wasdeveloped to explore this category. Three aspects of working at heights were identified asbeing particularly of high-risk. These are working on scaffolds, using ladders and workingon roofs. From these situations our final behavioural protocol was developed. This wasmade up of nine high-risk situations. A brief description of the situations chosen follows: Front-line workers (they will be referred as ‘operatives’ in this report) were interviewedfollowing a structured interview protocol. A selection of nine high-risk situations waspresented. Each participant was requested to give his opinion about perception of risk,frequency and preferred behaviour in the face of risk for each of the situations presented. a) WORKING ON SCAFFOLDS: Situation 1: Working on scaffolds not totally boarded. Situation 2: Working on scaffolds with missing guard-rails. Situation 3: Climbing up or down a scaffold when a ladder has not been provided. b) USING LADDERS: Situation 4: Using a ladder not tied or secured. Situation 5: Using a ladder broken or somehow defective. Situation 6: Using a ladder shorter than 1 metre above landing place. c) WORKING ON ROOFS: Situation 7: Working on fragile roofs without crawling boards Situation 8: Working on roofs without edge protection (and not harness provided). Situation 9: Working on roofs with bad weather.

25
For each of the nine situations, the operative was requested to analyse them on three levels.They had to:" Offer an evaluation of their perceived level of risk of each situation (low risk, medium
risk or high risk)." State the frequency at which these situations occur in the construction sector and in the
present site (rare, usual or frequent)" Predict their probable behaviour if the situation occurred on site today (report it, fix it
yourself, stop working/not use the material, or use it/ continue working). In order to determine their level of experience operatives were asked about the frequency atwhich they worked on scaffolds, with ladders and on roofs. Only those operatives whoreported working in the specific areas sometimes or often were allowed to answer questionson the three specific situations in the relevant categories. Workers’ attitudes and perception of the organisational system were also assessed through a20-item questionnaire. Workers were required to agree or disagree with each of thequestions in a Likert-type scale with four possible anchors from ‘Strongly disagree’ to‘Strongly agree’ with each item. Safety Management Interviews
A total of 59 structured interviews were conducted across 18 sites with a range of managersand personnel responsible for safety. The sample included Company Directors, ContractsManagers, Site Managers, Engineers, Safety Officers, Project Officers, Safety Reps andForemen. Table below provides a breakdown of how many of each personnel wereinterviewed.
Personnel Type Interviewed Site Manager 9 Contracts Manager 6 Foreman 15 Engineer 8 Safety Officer (company) 4 Safety Officer (site) 3 Safety Representative 5 Project Manager 4 Company Director 1 Architect (external safety officer) 1 Human Resource Manager 2 Quantity Surveyor 1
Table 9: Breakdown of managers and safety officials interviewed.

26
At the beginning of each site visit relevant personnel were identified and asked if they werewilling to take part in the interview. Two researchers conducted each interview, one askingquestions and the other taking notes. Each interviewee was briefed on the researchobjectives. The safety management system was the target of the interview, and the following areaswere explored:
! Safety Plan! Competence and Training! Monitoring system! Communication system! Assumption of responsibility for safety! Co-operation
However, each interviewee was also asked for personal and professional information:
! Background information (e.g. age, length of time in construction, safety training, etc)! Suggestions for improvements of the safety management system. Each of the areas of work explored also had a corresponding quantitative measure that wascompleted by the researchers at the end of each interview. The interviews lasted between20 and 40 minutes. All managers’ interviews were transcribed, and a content analysis was carried out on eachof them. A single and comprehensive description of the safety management system wasthen generated from the content analysis of all the interviews in each site.Each interview protocol had also several quantitative measures built into the protocol.These measures were intended to translate the qualitative impressions gathered after eachinterview into measurable rating scales. The final ratings should be considered relative tothe participant sites, rather than as an evaluation of their level of safety in absolute terms. Analysis of Safety Documentation
The management interviews established the type and availability of safety documentationon site. After completing the interviews on each site, one of the researchers conducted ageneral assessment on the site safety documentation. This assessment consisted of verifyingthe availability of documentation. All site safety documentation was inspected using the following assessment criteria:
# evidence of a documented site safety plan,# evidence of documented site risk assessments,# whether these risk assessments were site specific for identified site activities,# evidence of a documented site accident logbook,
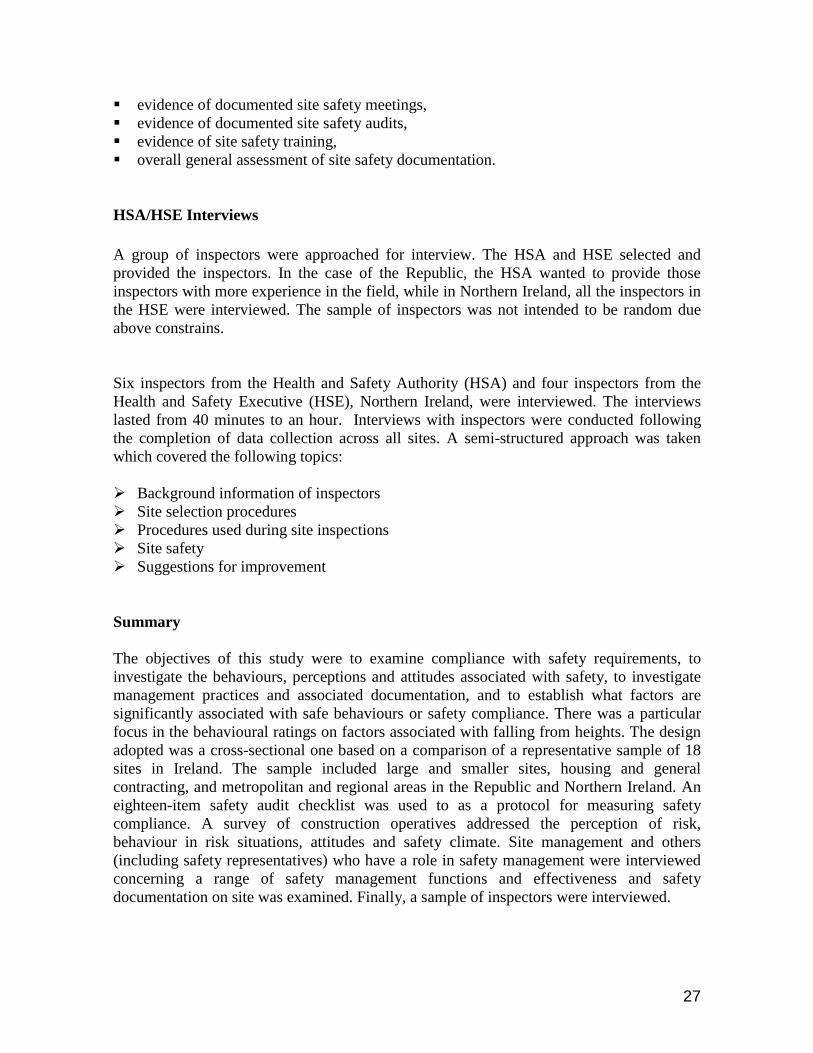
27
# evidence of documented site safety meetings,# evidence of documented site safety audits,# evidence of site safety training,# overall general assessment of site safety documentation.
HSA/HSE Interviews A group of inspectors were approached for interview. The HSA and HSE selected andprovided the inspectors. In the case of the Republic, the HSA wanted to provide thoseinspectors with more experience in the field, while in Northern Ireland, all the inspectors inthe HSE were interviewed. The sample of inspectors was not intended to be random dueabove constrains. Six inspectors from the Health and Safety Authority (HSA) and four inspectors from theHealth and Safety Executive (HSE), Northern Ireland, were interviewed. The interviewslasted from 40 minutes to an hour. Interviews with inspectors were conducted followingthe completion of data collection across all sites. A semi-structured approach was takenwhich covered the following topics: ! Background information of inspectors! Site selection procedures! Procedures used during site inspections! Site safety! Suggestions for improvement Summary
The objectives of this study were to examine compliance with safety requirements, toinvestigate the behaviours, perceptions and attitudes associated with safety, to investigatemanagement practices and associated documentation, and to establish what factors aresignificantly associated with safe behaviours or safety compliance. There was a particularfocus in the behavioural ratings on factors associated with falling from heights. The designadopted was a cross-sectional one based on a comparison of a representative sample of 18sites in Ireland. The sample included large and smaller sites, housing and generalcontracting, and metropolitan and regional areas in the Republic and Northern Ireland. Aneighteen-item safety audit checklist was used to as a protocol for measuring safetycompliance. A survey of construction operatives addressed the perception of risk,behaviour in risk situations, attitudes and safety climate. Site management and others(including safety representatives) who have a role in safety management were interviewedconcerning a range of safety management functions and effectiveness and safetydocumentation on site was examined. Finally, a sample of inspectors were interviewed.

28
Results: Compliance with safety requirements
The Prevention of Falls from Heights Unguarded Openings
Five sites out of the eighteen prevented any unguarded openings from occurring. A furthersix sites had less than 15% of openings left unguarded. Two sites had all openings leftunguarded. Table 10 shows these incidences and how they breakdown.
Number of Sites Percentage of Openings Found Unguarded 5 0 6 0-15 4 15-25 1 25-45 2 100
Table 10: Incidence of sites with unguarded openings
Figure 1: Incidence of openings found unguarded
Missing Guardrails and Edge Protection
Two sites out of eighteen had complete edge protection and seven sites had less than 15%of requisite guard rails or edge protection missing. Eleven out of eighteen sites had morethan 15% of the guardrails or edge protection missing.
0102030405060708090
100
Percentage of openings found
unguarded
1 2 3 4 5 6 7 8 9 10 11 12 13 14 15 16 17 18Site Number
Safety Item 1Incidence of Openings Found Unguarded

29
Number of Sites Percentage of Missing Guardrails or Edge Protection
2 0 2 1-5 3 5-15 7 15-25 2 25-35 1 45-55 1 55-65
Table 11: Incidence of sites with missing guardrails or edge protection
Figure 2: Incidence of guardrails or edge protection missing Short or Defective Ladders
There were no instances of ladders being either to short for use or defective in any way. Ladders not tied
Nine sites had ladders that were found to be incorrectly tied. Site 9, as a special case forcomment, had one ladder alone on site, in use during the survey.
Number of Sites Percentage of ladders found incorrectly tied
9 0 3 1-5 5 6-20 1 100
Table 12: Incidence of sites with incorrectly tied ladders
01020304050
60
Perecntage of guardrails or edge
protection found missing
1 2 3 4 5 6 7 8 9 10 11 12 13 14 15 16 17 18Site Number
Safety Item 8 Incidence of Guardrails or Edge Protection Missing

30
Figure 3: Incidence of ladders found incorrectly tied Safe use of ladders
Three sites had incidences where operatives were observed using ladders in an unsafemanner. In all incidences this was the use of untied ladders. Scaffold / Ladder Misuse
Three sites had incidences where operatives were observed mis-using scaffolding. In allincidences this was not using ladders to access scaffolding lifts on different levels. Operatives misusing ladders or scaffold were observed on six sites. However this figuremust be treated with caution due to the survey duration and the limitations of the researcherin continuously observing all operatives. Prevention of Falls Performance by site
For the prevention of falls from height, those items in the compliance measure related to thecategory were averaged, and mean and standard deviations of non-compliance performanceper site were calculated. This measure of falls performance can be used to rank the sitesagainst each other (see table 13). As can be deducted from the ranking of sites in terms of falls performance and the sitecharacteristics, the location size or stage of construction do not show any apparent patternwith regard to ranking (an so to compliance with falls prevention).
0102030405060708090
100
Percentage of ladders found
incorrectly tied
1 2 3 4 5 6 7 8 9 10 11 12 13 14 15 16 17 18
Site Number
Safety Item 12 Incidence of Ladders Found Incorrectly Tied

31
Ranking Site No. Location Builder Mean Non Compliance
Rate
Standard Deviation
1 3 Dublin General Contractor 0 9.45 2 8 Dublin General Contractor 0.43 0.98 3 2 Dublin General Contractor 0.57 0 4 7 Dublin Housing 0.71 10.29 5 12 RoI General Contractor 0.71 9.27 6 18 Belfast Housing 2.86 6.99 7 11 RoI Housing 3.57 1.89 8 13 Belfast General Contractor 4.29 1.13 9 15 Belfast General Contractor 4.29 48.21
10 6 Dublin Housing 4.86 37.29 11 14 NI General Contractor 5.71 4.76 12 17 Belfast Housing 5.71 1.89 13 5 Dublin Housing 6.57 6.07 14 1 Dublin General Contractor 8.57 9.32 15 4 Dublin General Contractor 8.57 7.32 16 16 NI Housing 11.43 20.35 17 10 RoI Housing 17.14 9.76 18 9 RoI General Contractor 37.14 7.56
Table 13: Ranking of sites by prevention of falls performance Tables 14 and 15 break down the incidence of unguarded openings and missinghandrails/edge protection for general contractor and house builders. Overall, both missinghandrails and missing edge protection were higher on house building sites.
Site No. Location Percentage of openings found unguarded
Percentage of guardrails edge protection missing
1 Dublin 5 20 2 Dublin 2 2 3 Dublin 0 0 4 Dublin 5 30 8 Dublin 0 3 9 RoI 100 60
12 RoI 0 5 13 Belfast 10 15 14 NI 5 25 15 Belfast 5 5
Average => 13.2% 16.5% Table 14: Unguarded openings and missing guardrails/edge protection on general contractor sites
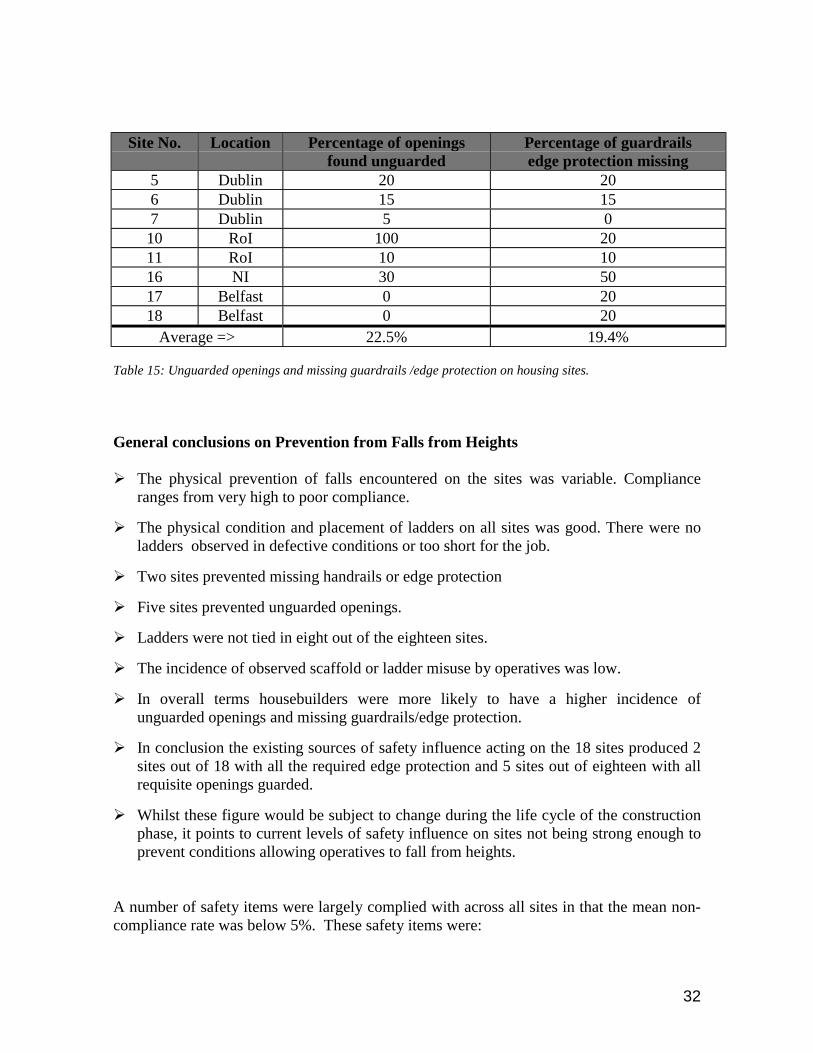
32
Site No. Location Percentage of openings found unguarded
Percentage of guardrails edge protection missing
5 Dublin 20 20 6 Dublin 15 15 7 Dublin 5 0
10 RoI 100 20 11 RoI 10 10 16 NI 30 50 17 Belfast 0 20 18 Belfast 0 20
Average => 22.5% 19.4% Table 15: Unguarded openings and missing guardrails /edge protection on housing sites.
General conclusions on Prevention from Falls from Heights
! The physical prevention of falls encountered on the sites was variable. Complianceranges from very high to poor compliance.
! The physical condition and placement of ladders on all sites was good. There were no
ladders observed in defective conditions or too short for the job. ! Two sites prevented missing handrails or edge protection ! Five sites prevented unguarded openings. ! Ladders were not tied in eight out of the eighteen sites. ! The incidence of observed scaffold or ladder misuse by operatives was low. ! In overall terms housebuilders were more likely to have a higher incidence of
unguarded openings and missing guardrails/edge protection. ! In conclusion the existing sources of safety influence acting on the 18 sites produced 2
sites out of 18 with all the required edge protection and 5 sites out of eighteen with allrequisite openings guarded.
! Whilst these figure would be subject to change during the life cycle of the construction
phase, it points to current levels of safety influence on sites not being strong enough toprevent conditions allowing operatives to fall from heights.
A number of safety items were largely complied with across all sites in that the mean non-compliance rate was below 5%. These safety items were:

33
! Missing scaffold baseplates! Misusing scaffolding! Ladders to short for the job in hand! Misusing ladders! Defective ladders! Protective footwear
Compliance with other items observed Rubbish on access routes
There was an overall pattern with regards to amount of rubbish found: mostly all sitesperformed well in terms of compliance with this item. 12 sites out of 18 had 15% or less ofaccess routes obstructed and 6 sites out of 18 had 16-30% of access routes obstructed (seefig. 4).
Figure 4: Incidence of rubbish on access routes Figure 5: Incidence of rubbish on scaffold lifts Rubbish on scaffold lifts
The second figure above shows the incidence of rubbish found on scaffolding lifts. No clearpattern here emerges with 10 out of 18 sites having 5% or less of scaffold lifts obstructedand 8 out of 18 sites having between 10 and 15 % of scaffold lifts obstructed (see fig. 5). Trapped board and missing toe boards
Figures 6 and 7 show the incidence of trapped scaffold boards and missing toe boards persite. With regard to missing toe boards the incidence rate is generally even with a meanincidence of missing toe boards being 13.1% with a standard deviation of 6.96
Figure 6: Incidence of trapped scaffold boards Figure 7: Incidence of missing toe boards
05
1015202530
Percentage of access routes
found obstructed
1 2 3 4 5 6 7 8 9 10 11 12 13 14 15 16 17 18
Site Number
Safety Item 2Incidence of Rubbish
on Access Routes
02468
10121416
Percentage of scaffold lifts found
obstructed
1 2 3 4 5 6 7 8 9 10 11 12 13 14 15 16 17 18
Site Number
Safety Item 4 Incidence of Rubbish Found on Scaffold Lifts
0
5
10
15
20
Percentage of scaffold boardsfound causing
traps
1 2 3 4 5 6 7 8 9 10 11 12 13 14 15 16 17 18Site Number
Safety Item 6Incidence of Trapped Scaffold Boards
05
10152025
30
Percentage of toe boards
found missing
1 2 3 4 5 6 7 8 9 10 11 12 13 14 15 16 17 18Site Number
Safety Item 7Incidence of Missing Toe Boards
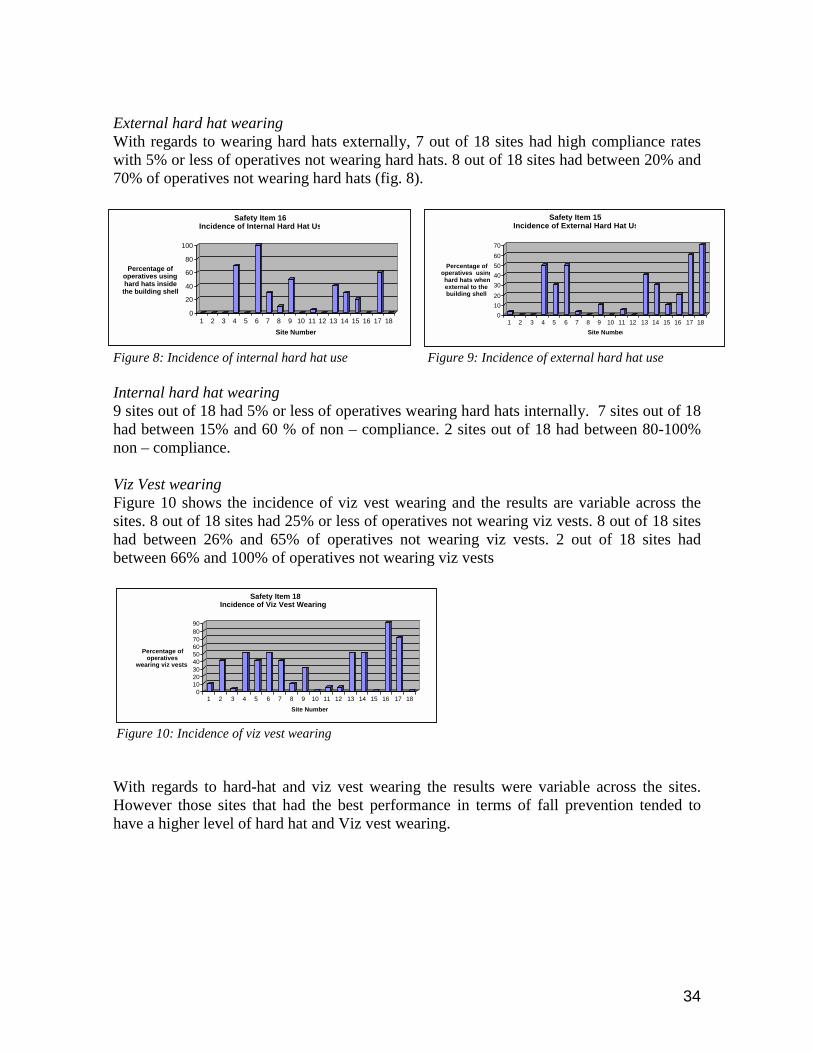
34
External hard hat wearing With regards to wearing hard hats externally, 7 out of 18 sites had high compliance rateswith 5% or less of operatives not wearing hard hats. 8 out of 18 sites had between 20% and70% of operatives not wearing hard hats (fig. 8).
Figure 8: Incidence of internal hard hat use Figure 9: Incidence of external hard hat use Internal hard hat wearing 9 sites out of 18 had 5% or less of operatives wearing hard hats internally. 7 sites out of 18had between 15% and 60 % of non – compliance. 2 sites out of 18 had between 80-100%non – compliance. Viz Vest wearing Figure 10 shows the incidence of viz vest wearing and the results are variable across thesites. 8 out of 18 sites had 25% or less of operatives not wearing viz vests. 8 out of 18 siteshad between 26% and 65% of operatives not wearing viz vests. 2 out of 18 sites hadbetween 66% and 100% of operatives not wearing viz vests
Figure 10: Incidence of viz vest wearing With regards to hard-hat and viz vest wearing the results were variable across the sites.However those sites that had the best performance in terms of fall prevention tended tohave a higher level of hard hat and Viz vest wearing.
010203040506070
Percentage of operatives usinghard hats when external to the building shell
1 2 3 4 5 6 7 8 9 10 11 12 13 14 15 16 17 18Site Number
Safety Item 15Incidence of External Hard Hat Us
0
20
40
60
80
100
Percentage of operatives using hard hats inside
the building shell
1 2 3 4 5 6 7 8 9 10 11 12 13 14 15 16 17 18Site Number
Safety Item 16Incidence of Internal Hard Hat Us
0102030405060708090
Percentage of operatives
wearing viz vests
1 2 3 4 5 6 7 8 9 10 11 12 13 14 15 16 17 18Site Number
Safety Item 18Incidence of Viz Vest Wearing
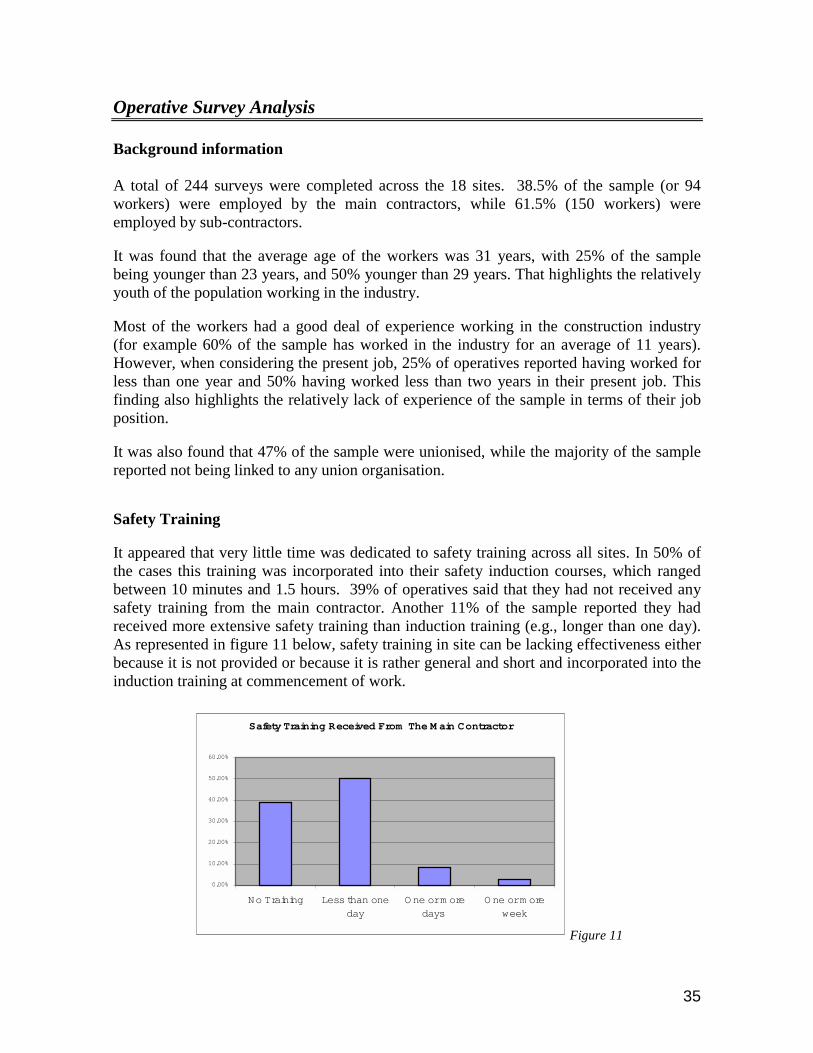
35
Operative Survey Analysis
Background information
A total of 244 surveys were completed across the 18 sites. 38.5% of the sample (or 94workers) were employed by the main contractors, while 61.5% (150 workers) wereemployed by sub-contractors. It was found that the average age of the workers was 31 years, with 25% of the samplebeing younger than 23 years, and 50% younger than 29 years. That highlights the relativelyyouth of the population working in the industry. Most of the workers had a good deal of experience working in the construction industry(for example 60% of the sample has worked in the industry for an average of 11 years).However, when considering the present job, 25% of operatives reported having worked forless than one year and 50% having worked less than two years in their present job. Thisfinding also highlights the relatively lack of experience of the sample in terms of their jobposition. It was also found that 47% of the sample were unionised, while the majority of the samplereported not being linked to any union organisation. Safety Training It appeared that very little time was dedicated to safety training across all sites. In 50% ofthe cases this training was incorporated into their safety induction courses, which rangedbetween 10 minutes and 1.5 hours. 39% of operatives said that they had not received anysafety training from the main contractor. Another 11% of the sample reported they hadreceived more extensive safety training than induction training (e.g., longer than one day).As represented in figure 11 below, safety training in site can be lacking effectiveness eitherbecause it is not provided or because it is rather general and short and incorporated into theinduction training at commencement of work.
Safety Training Received From The M ain Contractor
0.00%
10.00%
20.00%
30.00%
40.00%
50.00%
60.00%
No Training Less than oneday
One or m oredays
One or m oreweek
Figure 11

36
When operatives were questioned about training received through their subcontractorcompanies, almost 67% replied that they had received no safety training, while 22% of thesample received limited training of between one hour and a day (see figure 12). As withsafety training provided by main contractors, 11% of operatives received more extensivetraining that lasted one day or longer. Again, it is evident here that the majority ofsubcontractors are rather negligent in providing safety training.
Figure 12 Experience working in high-risk situations and perception of risk Workers in the sample reported a relatively high level of experience working on scaffolds(around 90% worked on scaffolds sometimes or often) and using ladders (98% used ladderssometimes or regularly). In relation to roofs, 50% of the sample reported working on themsometimes or regularly. In general, all situations regarding working on scaffolds, using ladders and working onroofs (see methodology for more detail about these situations) were perceived as of high-risk. The operatives perceived working on fragile roofs and using defective ladders asbeing the most risky of the nine situations presented. Using short ladders for accessingupper levels was the situation that was perceived as the least risky of all nine situations.However, even this one was evaluated as being of medium risk. Three questions were askedabout these nine situations –how risky the situation was, how frequently it would be foundin the construction industry in general, and how frequently it would be found on the site.Figure 13 shows the average perceived risk and the perceived frequencies of these risks inconstruction and on site.
Safety Training Received From Sub-Contractor
0.00%
10.00%
20.00%
30.00%
40.00%
50.00%
60.00%
No Training Less thanone day
One or m oredays
One or m oreweeks
One m onth orlonger

37
Figure 13: Perceived level of risk and Frequencies of risky situations for the nine situations of theresearch, in a scale from null/no risky (1) to very frequent/highly risky (3)
Even though the nine situations were generally perceived as high risk, the reportedfrequency of these situations actually occurring in the construction sector, as well as in site,was quite low. Those situations occurring more frequently were ! Scaffolds not totally boarded,! Roofs without edge protection,! Climbing up and down scaffolds in an unsafe way,! Working on roofs with bad weather. Consistently, the frequency of these risky situations was rated lower on the present site thanin construction in general. An interesting finding concerned the perception of risk by 3-5% of operatives in each site.Those workers reported a low perception of risk to the following situations: ! Working on fragile roofs without crawling boards,
FREQ. IN SITE1
1.5
2
2.5
3
Perceived risk and Frequencie
FREQ. IN SITE
FREQ. IN CONSTR
RISK

38
! Working on roofs without edge protection,! Working on scaffolds with missing handrails,! Accessing scaffolds by climbing them up and down,! Using ladders not tied or secured! Using ladders too short for the landing place The findings on risk perception for these critical high-risk situations outline that themajority of operatives do not have a misperception of the risks associated to thesesituations. However, there is a small percentage of workers that do misperceive them and socould be exposing themselves to risks due to this misperception. Preferred behaviour to handle high-risk situations When operatives were asked how they would behave in relation to those situations, theiranswers indicate that their preferred behaviour depends more on the actual situation thanthe perceived level of risk. In six out of the nine situations, operatives were more likely toreport the situation to site officer, site manager or specific trades as scaffolders. Thesesituations were: • using defective ladders (61% would report),• working on scaffolds not totally boarded (54%),• working on scaffolds with missing handrails (58%),• climbing up or down a scaffold (55%),• using ladders too short for the landing place (46%),• working on fragile roofs without crawling boards (46%). In the situation of working on a roof in bad weather, 52% of operatives were more likely tostop working as preferred behavioural option. In the situation when operatives find ladders not tied or secured, they would either report it(39%), or they would fix it by themselves (37%), In the situation when operatives has to work on roofs without edge protection, 36%reported that they would stop working while 16% reported that they would continue towork anyway. Figure 14 gives a graphic representation of the percentage of operatives that reported any offour possible behaviours as their probable pattern of action if facing the situations presentedin our survey. In general, we can conclude that operatives appear to have an accurate perception of risk inrelation to the target situations highlighted in our research. The preferred way of dealingwith risky situations is to report them. However in the case of those working on roofs theirfirst reaction is to stop working.
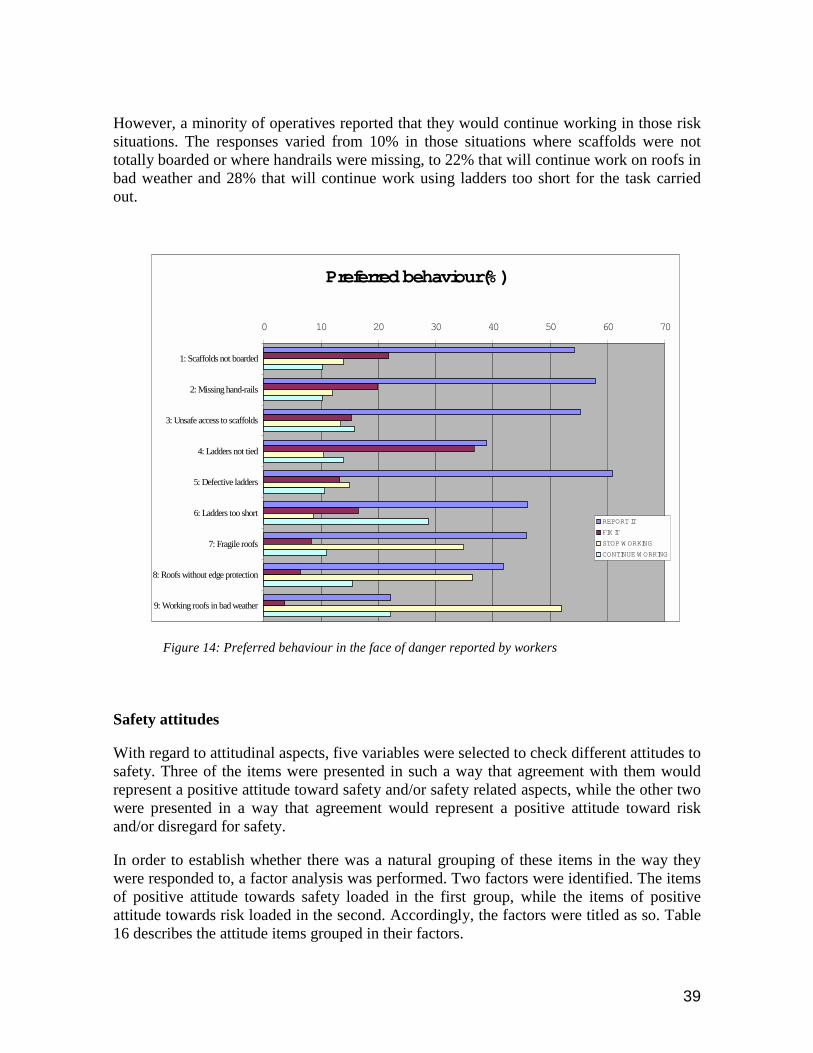
39
However, a minority of operatives reported that they would continue working in those risksituations. The responses varied from 10% in those situations where scaffolds were nottotally boarded or where handrails were missing, to 22% that will continue work on roofs inbad weather and 28% that will continue work using ladders too short for the task carriedout.
Figure 14: Preferred behaviour in the face of danger reported by workers
Safety attitudes With regard to attitudinal aspects, five variables were selected to check different attitudes tosafety. Three of the items were presented in such a way that agreement with them wouldrepresent a positive attitude toward safety and/or safety related aspects, while the other twowere presented in a way that agreement would represent a positive attitude toward riskand/or disregard for safety. In order to establish whether there was a natural grouping of these items in the way theywere responded to, a factor analysis was performed. Two factors were identified. The itemsof positive attitude towards safety loaded in the first group, while the items of positiveattitude towards risk loaded in the second. Accordingly, the factors were titled as so. Table16 describes the attitude items grouped in their factors.
Preferred behaviour(%)
0 10 20 30 40 50 60 70
1: Scaffolds not boarded
2: Missing hand-rails
3: Unsafe access to scaffolds
4: Ladders not tied
5: Defective ladders
6: Ladders too short
7: Fragile roofs
8: Roofs without edge protection
9: Working roofs in bad weather
REPORT IT
FIX IT
STOP W ORKING
CONTINUE W ORKING
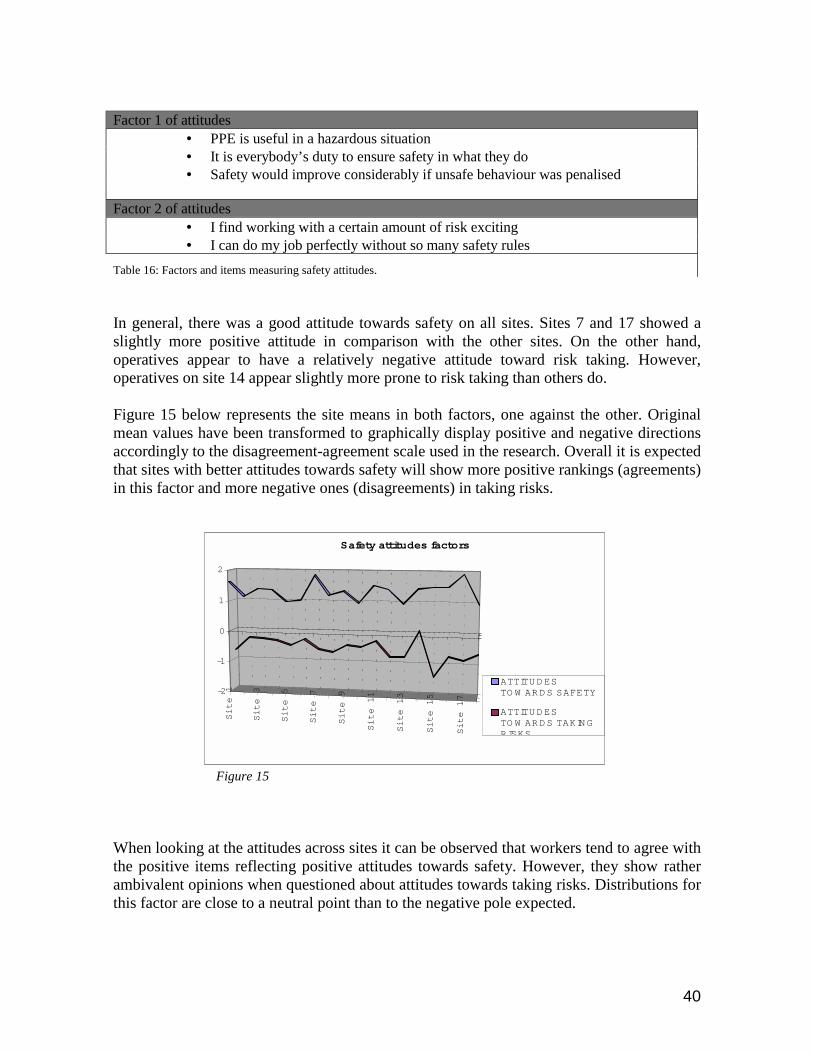
40
Factor 1 of attitudes
• PPE is useful in a hazardous situation• It is everybody’s duty to ensure safety in what they do• Safety would improve considerably if unsafe behaviour was penalised
Factor 2 of attitudes• I find working with a certain amount of risk exciting• I can do my job perfectly without so many safety rules
Table 16: Factors and items measuring safety attitudes. In general, there was a good attitude towards safety on all sites. Sites 7 and 17 showed aslightly more positive attitude in comparison with the other sites. On the other hand,operatives appear to have a relatively negative attitude toward risk taking. However,operatives on site 14 appear slightly more prone to risk taking than others do. Figure 15 below represents the site means in both factors, one against the other. Originalmean values have been transformed to graphically display positive and negative directionsaccordingly to the disagreement-agreement scale used in the research. Overall it is expectedthat sites with better attitudes towards safety will show more positive rankings (agreements)in this factor and more negative ones (disagreements) in taking risks.
Figure 15 When looking at the attitudes across sites it can be observed that workers tend to agree withthe positive items reflecting positive attitudes towards safety. However, they show ratherambivalent opinions when questioned about attitudes towards taking risks. Distributions forthis factor are close to a neutral point than to the negative pole expected.
Site 1
Site 3
Site 5
Site 7
Site 9
Site 11
Site 13
Site 15
Site 17 ATTITUDES TO W ARDS
SAFETY
-2
-1
0
1
2
Safety attitudes factors
ATTITUDESTO W ARDS SAFETY
ATTITUDESTO W ARDS TAKINGRISKS

41
Safety Climate Safety Climate concerns the perception of the organisation and situation with respect tosafety. Fifteen variables were selected to check the perception that operatives have abouttheir job context, especially those aspects related to safety. Some of the items were selectedto collect information about the management system of each site, the level of risk of thesite, and other aspects that could be affecting the safety of the workplace. Table 17 belowshows the climate items in this survey grouped in their empirical factors, following a factoranalysis of the data.
Factor 1 of climate: Management commitment to safety
• Site managers regularly remind the workforce about safety standards• Working safely is top priority for site managers• Managers respect safety standards and procedures• Site managers are strongly committed to follow all safety standards• Site managers regularly remind the workforce about safety standards• Site managers take the breaking of safety rules very seriously• All equipment and materials needed to work safely are available at all times• When site managers become aware of a safety problem they quickly take action• All equipment and materials supplied to work safely are in good conditions
Factor 2 of climate: Variables affecting safety in site• It is difficult to be aware of hazards in my workplace• I am so familiar with my work that sometimes I forget to take precautions• The demands of my work make me forget about safety• It is just a matter of time before I find myself involved in an accident
Factor 3 of climate: Level of risk of the construction sector• Construction sites are dangerous places• My job carries a considerable level of risk
Table 17: Factors and items measuring safety climate In general, operatives perceive a moderately good management commitment towardssafety. It appears that management commitment is perceived higher on site 7 while on site18 perception of management commitment to safety is somehow lower. A graphical displayof the factors shows that operatives agree that managers are committed with safety;however that perception is of a middleweight. A high management commitment is agreedin relatively few sites.

42
Figure 16: Management commitment with safety
A second group of variables gave information on the difficulty of being aware of hazardson site and the influence of work demands and familiarity on the level of safety. In general,operatives do not perceive those variables as affecting their safety on the job. The figurebelow represents the site means in the scale of disagreement-agreement used in theresearch. The line of mean values is clearly in the disagreement area. However it can bealso appreciated that, overall, values tend to a neutral point.
Figure 17: Perception of sources of risk influencing safety in site
In relation to the idea that construction sites are dangerous places, operatives tend to agreewith that assumption. Figure below shows the results per site.
1 3 5 7 9
11
13
15
17
M AN AG EM ENTCO M M ITM ENT
-2
-1
0
1
2
M ANAG EM ENT CO M M ITM ENT
Site 1
Site 3
Site 5
Site 7
Site 9
Site 11
Site 13
Site 15
Site 17 SO URCES OF RISK
-2
-1
0
1
2
SOURCES OF RISK

43
Figure 18: Perceived level of risk in site and industry In conclusion, it seems that there is a relatively high perception of managementcommitment towards safety among the construction companies in the sample. There is alsoa high perception of risks in the industry, although the perception of this factor is muchmore variable among the eighteen sites. In relation to how a group of variables could beaffecting safety on site, the perception is rather neutral across the sites, although with atendency towards perceiving that those variables do not affect safety in a significant way. Management Interviews Reports on the safety management systems for each of the 18 sites were completed. Thisanalysis involved both a qualitative and quantitative analysis of the key features of thesafety management systems. This section of the report provides overall conclusions of thequalitative data and follows the format of the elements of the interview schedule and theapplied aims of the study. A rating procedure, with explicit criteria, was adopted totranslate the qualitative material from the interviews into a quantitative score for eachdimension of the interview. A composite score for each site was then computed. Safety Plan
All of the construction sites had a safety plan and risk assessments available on site. In83% of cases it was reported that the safety plan was developed internally, with the safetyofficer taking the major role in this. Only one site relied completely on external expertise,and two sites developed their safety plans with both internal and external consultation. Theevidence indicates that there was little or no variation in the quality or effectiveness of thesafety plan whether it was developed internally or with external consultation. The majorityof safety plans were generic and not site specific. Specific site hazards were not alwaysidentified or sufficiently addressed within the plan and there was no evidence of planningfor reduction or elimination of identified hazards through the implementation of controlmeasures.
Site 1
Site 3
Site 5
Site 7
Site 9
Site 11
Site 13
Site 15
Site 17 PERCEIVED LEVEL OF RISK
-2
-1
0
1
2
PERCEIVED LEVEL OF RISK

44
Overall it appeared that the safety plan existed to meet legislative requirements and playedonly a minimal role in every day safety management practices. A small number of siteshad a clear plan of action, however, even in these few sites the safety plan did not play anintegral role in the every-day safety management of the site. Competence/Training
Very few of the sites had a systematic safety-training schedule for their employees. Whenrecruiting operatives, their safety backgrounds were not usually taken into considerationexcept for relevant certificates required for certain tasks. All sites had certified personnelfor the following operations e.g. scaffolding, driving diggers and cranes, as legally heldtickets were required to undertake these tasks. When recruiting management, only four ofthe sites considered safety training and relevant qualification as necessary for the job. Two thirds of all sites conducted site safety induction training that lasted anything between10 minutes and 1.5 hours. On average, the duration of the safety induction training wasbetween 15-20 minutes and was usually conducted by the safety officer. While everyone agreed that the induction training was necessary, a number of the managersfelt that it was performed primarily to “cover themselves” just in case something did gowrong. Overall it was felt that safety induction training was not sufficient on its own andshould be supplemented by refresher courses focusing on different hazards as the siteprogresses. 50% of the sites reported conducting toolbox talks as part of their training schedule. Anumber of the sites did undertake safety toolbox talks on a regular basis, and some sitesreported that the toolbox talks were organised specifically after an accident or seriousincident. All but one of the sites reported their managers undertook the CIF/CEF course - ManagingSafety on Construction, or an equivalent course. A small number had also undertakendiploma courses in health and safety management. Other training offered on sites includedtraining for the Safety Reps (a 3-day course run by ICTU), first aid courses and half-daylegal briefing for managers. In Northern Ireland there was much reliance on the mobile CITB unit, which was reportedto be a very beneficial and cost effective in providing a range of safety based training.Many of the sites in the Republic expressed a positive interest in the introduction of theSafe Pass Scheme. Sites reported the Safe Pass Scheme was a welcome initiative, whichmay improve safety behaviour and competence. Overall, sites expressed the need foradditional training as well as scheduled refresher training. While almost everyone agreed on the importance of safety training, many limitations inproviding training were highlighted. For example ! Reluctance to release staff for training – “time is money”, it slows down production

45
! Increasing time pressure, as sites were working towards very tight deadlines, difficult toconduct effective safety training due to time constraints
! Insufficient manpower! Lack of interest by operatives to attend training There was a general consensus by site management that the quality and quantity of thepresent training needed to be improved upon. Monitoring
All sites undertook some level of monitoring safety on site, e.g. audits, hazard reporting,incident and accident reporting. Internal audits were conducted on all sites on a regular basis. Two thirds of the sites alsoengaged in external audits conducted by the client, insurance companies or safety experts.Client and insurance audits were usually conducted on a six monthly to yearly basis whilesafety expert audits were generally conducted on a monthly basis. Management reportedthat the external audits were more successful in identifying and suggesting controlmeasures, however it appeared that these control measures were not always effectivelyimplemented. There were two primary approaches to conducting safety audits on site - (i) visualinspection with findings not formally documented (ii) visual inspections supported bychecklists and formal audit reports. All of the external audits were conducted usingsystematic checklists and formal audit reports. 80% of the internal audits relied on thechecklist approach, the outcome of which was a regular audit report. A number of similar trends from the audits (both internal and external) were consistentacross the sites. For example ! Not wearing PPE, in particular hard hats! Poor Scaffolding! Missing toe boards! Missing guard-rails / handrails! Poor housekeeping, in particular poor stacking While these problems were continually highlighted by the audits and were signed off on aregular basis as being dealt there were no preventative or control measures put in place toaddress and remedy the audits’ outcomes. One site (number 8) had an approach to safety management that was quite distinctive fromthe rest. The managing director of the small main contracting company also acted as thesafety officer, conducting regular informal audits as well as unscheduled site visits. Hischarismatic style plus strict insistence on safety was reported to be very effective. Thismanagement approach was utmost entirely informal and very poorly backed up indocumentation.
46
The relevant foreman dealt with most hazards on site and very few of the sites documentedthe hazards. It was reported than in most cases that the operatives were reluctant to reporthazards, as it was felt that it wasn’t part of their job. There was no formal documentedsystem to record incidents or near misses in 75% of sites. Overall managers reported a lowlevel of hazard, incident and near miss reporting. There was a standard disciplinary procedure across all sites, which consisted of - 1 verbalwarning, 1 written warning and then dismissal from site. Again site 8 was an exception tothis - referral to head office and possible reassignment to another site being the reporteddisciplinary procedure. A total of eleven out of eighteen sites had received an inspection by the relevant authority(9 out of 12 had been inspected by the HSA; 2 out of 6 by the HSE) on at least oneoccasion (see column 3 in table 18, page 48). The issues highlighted by the regulatorsduring site inspections included, for example, poor edge protection, missingguardrails/handrails, poor housekeeping, not wearing PPE, poor covering of manholes andprovision of poor welfare facilities. It was reported that two sites had been served with animprovement notice for poor housekeeping. From the interview reports, there appeared to be no follow up from the HSA/HSE aftertheir initial inspections to make sure that their recommendations were implemented. Twosites reported that they had received no feedback regarding the level of safety on their sitefollowing an inspection. One site expressed concern that they had received nocorrespondence from the HSA following a reportable accident. There was mixed reaction across all sites in relation to both the role and the effectiveness ofthe HSA/HSE inspections. On eleven sites positive views were expressed about theinspectors (6 sites gave only positive views). Inspectors were considered as being helpful,understanding, giving good advice, and competent, and thus would welcome more in-depthinspections. While the Northern Ireland sites had received fewer inspections, there wererelatively more positive comments about the HSE, and some reported using the HSE in anadvisory capacity. In twelve of the sites negative views were expressed about inspectors (7 sites gave onlynegative views). These included the view that inspectors encountered lacked specificknowledge or competence or had no standard procedure for inspections. Others felt theattitudes of inspectors were superior or arrogant. In all sites interviewees appeared tobelieve that inspectors targeted ‘high profile building contractors’ and tended to neglectsmall contractors and sites where the safety problems were worse. It should be noted thatthere was no way to check or validate these comments. They were spontaneously expressedand strongly held. Because of these views, it was considered important to interview asample of inspectors from both jurisdictions. Table 18 summarises the comments about inspections along general dimensions – whetherthere were positive or negative comments about the inspectors’ role, the number of

47
inspections reported at this site, a ranking of the level of safety compliance found (scale of1-5) based on the reported findings of the inspectors, and a ranking (scale of 1-5) of thereported effectiveness of the visit is stimulating organisational action to improve safety As can be seen in table 18, the direction of the views expressed both about the role of theinspectors and about the effectiveness of the HSA/HSE to redirect organisational actiondoes not correlate with sites being inspected or not, the number of inspections carried out orthe level of safety discovered by the HSA (sites in Northern Ireland did not disclosed thisinformation to the research team). Thus the views expressed do not simple reflect anegative reaction to an adverse inspection. Furthermore, there was little empirical evidence of the HSA/HSE being seen to be effectivein influencing organisational action. Only one site reported a positive influence, three wereneutral and six were relatively negative.
Table 18: HSA/HSE role in construction safety on site Communication
In almost all of the sites there appeared to be a high reliance on an informal approach tocommunication. Two thirds of all sites relied heavily on individual briefings tocommunicate the safety message. Only 27% had a dedicated safety meeting on a regularbasis. 61% of sites had regular site meetings. However safety was not always on the
comments onHSA/HSE role
by sitemanagers
number ofinspections
carried out byHSA/HSE in
site
safety level discoveredby HSA/HSE
effectiveness ofHSA/HSE visits to
redirect organisationalaction
SITE 1SITE 2SITE 3SITE 4SITE 5SITE 6SITE 7SITE 8SITE 9SITE 10SITE 11SITE 12
SITE 13SITE 14SITE 15SITE 16SITE 17SITE 18
++/-+/--+-+/--+/--+-
+-+/-++-
22110--02111
010100
3241----1--4244
------------
3421----2--1132
--1--3----

48
agenda of this site meeting. Two out of the 18 sites incorporated poster campaigns andnewsletter articles dedicated to safety. It was agreed that the one-to-one verbal approach with operatives was the most successfulmeans of communicating safety. Most sites had identified that their communication couldbe improved and viewed this as an effective means of safety management.
Co-operation
On almost all of the sites a very effective working relationship was reported between thecompany operatives and the subcontractors. There were usually problems at the beginningstages of work but it was felt that both the company managers and the sub-contractors werecommitted maintaining a high level of co-operation.
Suggestions for improvement
The following topics were suggested as areas for improvement: ! Additional Safety Representatives! Full time Safety Officer per site! More regular tool-box talks! More HSA/HSE Inspections! Involvement of HSA/HSE at design stage! Introduce certified safety awareness course with regular brush up courses! Full time staff dedicated to housekeeping! Top management support and commitment! Better planning Documentation Analysis Assessment of site safety documentation was conducted during the latter half of theconstruction project. Safety documentation was evaluated on ten of the eighteen sitesvisited.
Safety plan
All but one of the ten sites had a documented site safety plan. The safety plans variedconsiderably in length, detail and presentation. The safety plans were mostly generic andcould have been applied to any construction site. Few of the safety plans assessed,contained a management structure with clear delegation of safety responsibilities. In mostcases the safety plan had not been updated in accordance with the site development andprogression of work. Many of the safety plans had not been "signed off" by the relevantpersonnel, or in some cases were out of date. Few of the safety plans contained safetystatements from the relevant sub-contractors.

49
Risk assessments
It was evident that one of the sites did not have any documented risk assessments for siteactivities and associated hazards. For example this particular identified site did not haveany risk assessments to address working at heights, scaffolding and ladders, all of whichwere everyday operations/tasks on the site. In general the risk assessments identified thesite hazards, evaluated the risk in association with the people who might be harmed and theseverity of the injury. Only one site had suggested documented control measures to reduce/ eliminate the identified site hazard.
Site specific risk assessments
Fifty percent of the risk assessments were not site specific. These risk assessments did notaddress activities and hazards particular to the site in question. It can be reported that somesites had risk assessment for tasks that were not and would not be part of the scheduledconstruction work. Although 5 out of the 10 sites had site specific risk assessments, not allof the site activities were addressed. For example, one identified site had a specific riskassessment for working on roofs, however no risk assessment was available for working onscaffolding or using electricity.
Accident logbook
One site did not have a documented systematic approach to recording site accidents. Twosites did not have their accident logbook available for inspection. The method of accidentdocumentation varied amongst site. Some sites had a formal systematic logbook, whichrecorded specific accident information e.g. activity and weather conditions. Other sitesmaintained a "site diary", where reported accidents were logged. This method ofdocumentation and level of detail recorded was at the discretion of the site foreman. Ingeneral minor injuries were not recorded. Following inspection of accident logbook it canbe reported that sites had few if any documented site accidents.
Safety Meetings
It was deduced that 5 out of 10 of sites did not have any documented evidence of site safetymeetings. The remaining sites indicated that safety meetings were conducted in terms ofminutes of site safety meetings. In many cases "safety " was also on the agenda of othersite meetings e.g. production, site, company and sub-contractor meetings. Reportedaccidents were generally on the safety meeting agenda. Results from the safety audits weregenerally not discussed at the safety meetings.
Safety Audits
Eight of the ten sites had documented site safety audits, generally presented in a checklistformat. Both internal and external personnel reportedly conducted the safety audits. Thedocumented audits varied in terms of frequency, detail, audited items, rating scale and auditoutcomes. The overall audit score approach was frequently used by external auditors i.e.

50
audit scored/rated out of a total score of 800 points. Many of the sites had scaffoldingaudits dedicated to inspection of site scaffolding, which utilised the C3R forms.Scaffolding was audited on a regular basis from daily, weekly to monthly. Two of the siteshad no documentation relating to their auditing activities.
While eight out of the ten sites had audit documentation, which outlined the activity, thehazard and associated risk, few sites had documented improvement suggestions and/orrecommended control measures. Very few documented audit outcomes were addressed atthe following audit, ensuring that necessary audit items had been remedied.
Training
Seven of the ten sites indicated safety training had been conducted. This safety trainingvaried from site induction training to specific plant/machinery training. Approximately halfof the sites disseminated safety booklets to operatives at the safety induction training stage.In some cases operatives were requested to "sign off", confirming they had either receivedsafety induction training or they had read the information booklet. Great emphasis wasplaced on maintaining a register of certificates indicating personnel were trained andcompetent to operate particular machinery and equipment e.g. certificates for crane, fork-lift truck and dumper drivers and scaffolders.
Overall assessment
Two of the ten sites received an overall rating of poor, one of which did not have a safetyplan. The safety plan on the other site was sub-standard and they had no documentedaccident logbook, safety audits, and training. Both sites' risk assessments were not sitespecific. Three of the ten sites received an overall rating of good as they had documentedsafety plans. Five of the ten sites received an overall rating of very good as they all hadsafety plans with site-specific risk assessment.
SiteNumber
SafetyPlan
Riskassessment
Site specific risk
assessment
Accidentlogbook
Safetymeetings
Safetyaudits
Safetytraining
Overallassessment
08 Yes Yes No No Yes No No poor 09 Yes No No Yes Yes Yes Yes good 10 Yes Yes No Yes No Yes Yes good 11 Yes Yes Yes Yes No Yes Yes very good 12 Yes Yes Yes Yes No Yes Yes very good 13 No Yes No Yes No No Yes poor 14 Yes Yes Yes --- Yes Yes Yes very good 16 Yes Yes Yes Yes No Yes Yes very good 17 Yes Yes Yes Yes Yes Yes No very good 18 Yes Yes Yes --- --- Yes --- good
Table 19: Safety documentation in site.

51
Although this documentation assessment indicates the quantity of safety documentationavailable on site, it was evident that the majority lacked quality. Safety plans were ingeneral very broad and generic. Safety plans were poorly managed and not updated as thework on the site progressed.
Summary
Nine out of ten sites had a documented site safety plan. The safety plans were mostlygeneric and could have been applied to any construction site. Few of the safety planscontained a management structure with clear delegation of safety responsibilities. Fiftypercent of the inspected risk assessments were not site specific. These risk assessments didnot address activities and hazards particular to the site in question. Few sites documentedsite accidents. Five out of the ten sites did not have any documented evidence of site safetymeetings. In many, however, cases "safety" was on the agenda of other site meetings e.g.production, site, company and sub-contractor meetings. Reported accidents were generallyon the safety meeting agenda. Eight of the ten sites had documented site safety audits,generally presented in a checklist format. Very few documented audit outcomes wereaddressed by the time the next audit was carried out. Results from the safety audits weregenerally not discussed at the safety meetings. Seven out of ten sites indicated safetytraining had been conducted. The emphasis was placed on maintaining a register ofcertificates indicating personnel were trained and competent to operate particularmachinery and equipment.
Overall Document Evaluation
Two sites received an overall rating of poor. Half of the ten sites received an overall ratingof very good as they all had safety plans with site specific risk assessment. Although thisdocumentation assessment indicates the quantity of safety documentation available on site,it was evident that the majority lacked quality. Safety plans were in general very broad andgeneric. Safety plan documents were poorly managed and not updated as work on siteprogressed.
52
HSA/HSE Interviews
Summary of HSE Interviews
Background
There are a total of five construction inspectors in Northern Ireland working with theHealth and Safety Executive. The structure of this construction group is comprised of fourfull-time inspectors reporting to one principal construction inspector. All inspectors had anengineering background; one electrical, two civil and one building management. The HSErecruits employees from all sectors. The interviewees reported working as constructioninspectors over a period of five years to 5 months. The inspectors had much experienceworking in the area, from 10-15 years in the field of inspection. All inspectors were trainedto a high degree.
Inspectors had successfully completed postgraduate diploma in safety management. TheHSE also offered regular training courses for inspectors including legislation, COSSH,machinery guarding. New inspectors shadowed more experienced inspectors for a shortperiod of time, which allowed for on the job training. There was a reported high level ofco-operation amongst inspectors. On occasion two inspectors conducted inspectionstogether. Construction inspectors have their own geographical area to cover.
Over one thousand inspections are conducted annually in Northern Ireland. The principalinspector conducts approximately 100 per year.
Site Selection
The HSE inspectors had a structured systematic approach to selection of sites forinspection. Inspectors reported that up to 80% of sites notified the authority of works inprogress or proposed works. The authority receives approximately 500 notification permonth. It was reported that two-thirds of these would be inspected. A database of allnotifications is maintained. Notifications are classified into three categories:
• Large construction works which require inspection,• Construction works which require communication with the architect,• Smaller construction works which will not be inspected e.g. small refurbishment’s or
roadworks.
Complaints, accidents, and fatalities take priority over scheduled inspection. All complaintsreceived by the authority area dealt with within ten days. Complaints may be dealt withover the phone but may also require a site visit.
Inspectors emphasised the importance of being cost effective when planning siteinspections. Sites selected for inspection were done so according to size, operation anddegree of risk associated with the work. Based on experience one inspector reported thebigger the site, the bigger the risk. However other inspectors disagreed and reported that
53
smaller sites were more dangerous. All four inspectors agreed that the present method forsite selection was a fair system and could be improved upon with more resources.
Site Inspection
Inspectors had a structured approach to site inspection. Inspectors reported theycommenced their inspection on approaching the site, taking heed of any hazards visiblefrom the road e.g. poor traffic management, poor housekeeping, dirty roadways. All fourinspectors requested to speak with a member of the site management team on arrival,generally the contracts manager or site foreman.
It was reported there were very few safety officers and safety representative on site. Onlyone inspector reported a level of hostility on one previous site inspected. Three of the fourinspectors inspected safety documentation prior to assessing site safety. One inspectorstressed the importance of speaking with the site operatives asking for their opinions onsafety matters relevant to the site. Inspectors always asked to be accompanied on their siteinspection, generally by the site foreman. This gave the foreman an opportunity to makehis/her own notes and verbally communicate with the inspector.
Safety on sites
Inspectors rated safety as low to medium on construction sites in Northern Ireland. Safetyplans varied in both quality and quantity according the inspectors. Larger sites tended tohave comprehensive safety plans with site-specific risk assessments. The inspectorsattributed this to the fact that the safety plan was devised internally with plenty of availableresources. Inspectors reported examination of sub-contractors method statements, whichwere considered very poor. One inspector felt very strongly about the movement of sub-contractors across the border where they have to comply with Northern Ireland legislation.Sub-contractors were unfamiliar with the legislation requirements.
In general sites were not concerned with the method statements from sub-contractors. Oneinspector indicated that the presence of a safety plan on site was a not a good indicator ofsafety performance. The inspector reported that much of the safety documentation wasthere to “cover management” and meet legislative requirements. Inspectors agreedinvolvement from sub-contractors had to be increased to improve site safety.
All inspectors believed that site safety was better with a full-time safety officer on site.Main problems reported by inspectors on sites included poor scaffolding, poor welfarefacilities, falls from height, poor housekeeping, lack of documentation, site security andmachinery. One inspector reported that 70% of the safety plans were generic, not sitespecific with the use of water and electricity not addressed in the safety plan. The inspectorrecommended that all safety plans should be 8/9 pages in length. Many of the safety planswere not available on site as they were held in the company’s head office. Inspectorsviewed this as an indicator of how active the safety plan was on site.

54
All complaints were dealt with. Many of the complaints come from members of the public,which may be anonymous. Complaints regarding access to site by children, dirty roads andnoise have been reported.
Following a site inspection, inspectors may issue prohibition notices (PN) or improvementnotices (IN) where necessary. These notices are followed up with a letter ofcommunication with accompanying relevant information. The inspectors also reportedconducting site re-inspection one week after the PN had been served.
It was also reported that the level of management commitment to safety varied across sites.Larger sites were generally more proactive regarding safety management. All inspectorsbelieved that management needed to take responsibility for safety and involve operativesand sub-contractors. Inspectors reported that operatives believed “they had to get the jobdone quickly without complaint”, believing they had to work under dangerous conditions.
All inspectors stressed the importance of safety training for both management and operativelevels. Training on larger sites was reported better which was attributed to access toresources e.g. mobile training unit. Some smaller sites had no safety training. Allinspectors welcomed the Registered Skills Card scheme. To date up to 20% of operativeshave been registered.
Inspectors attributed the main cause of site accidents to lack of resources on site, stupidity,apathy, a lack of safety ownership and management commitment to safety.
The Northern Ireland construction group has placed great emphasis on improving sitesafety through conducting particular campaigns. These campaigns have utilised localmedia to highlight the importance of secure and safe scaffolding. Inspectors noted animprovement in site scaffolding since the introduction of this campaign. Inspectors haverecognised the importance of safety at the planning and intend to involve planners andarchitects in preventing safety problems at the early stages of design and construction.
Suggestions for improvement
! Increased resources within HSE i.e. more inspectors! Increase the level and quality of training! Health and safety plan must be site specific! Need for a fundamental change in attitudes on construction sites! Company and site management need to take responsibility for safety! Engage other industries in safety campaigns! More communication and feedback to lower site level Overall conclusions
Inspectors identified the areas for improvement and development in safety management i.e.involvement of planners at early stages. They were very positive regarding their future

55
involvement in prevention of accidents and fatalities. Inspectors felt very strongly aboutthe importance of safety training. There was a general consensus that larger sites werebetter as they had access to resources, more ownership of safety plans as they weredeveloped internally.
Summary of HSA Interviews
HSA Construction Group Organisation
There are 16 dedicated specialist construction site inspectors in the Republic of Ireland with14 in the Leinster region (excluding Waterford and Wexford) Two inspectors are residentin Cork and One in Galway. In addition, further site inspections are “borrowed from” orcarried out by inspectors drawn from outside the construction group but within the HSAorganisation. Targets are quantified by setting the number of site inspections per year. For the year 2001the number of site inspections is set at 7000. This converts to 28 man years and anadditional “borrowed” 7- man-years per year. In 2000 the number of site inspections wasset at 4500 with 5000 being achieved. Individual inspectors have their targets set by seniormanagement. Site Selection Procedures
Sites are selected to be visited on the basis of ! Accidents! Notifications! Complaints! Closeness to other scheduled site visits Sites are selected to be visited based on a number of information sources. These are,accident notifications (IR1 Forms) notification of construction sites (CR1 Forms)complaints from the general public and from construction site personnel. In addition sitesare visited pragmatically when other visits enable sites in close proximity to be accessedor geographical areas to be covered. All complaints and accident notifications are visited as a priority. Due to resource constraints there has been little accident or complaints analysis carried out.This may be remedied by the recent recruitment of a statistician. Notifications and visits close to scheduled visits represent pro-active site selection by theHSA. However not all sites will notify. The inspectors were of the opinion that between 20and 50% of sites notify with the bigger sites having high compliance in this regard.

56
The number of active construction sites in the Republic of Ireland is not known. A figure of20,000 was quoted by one inspector but is based on anecdotal evidence only. The system of site selection is seen by inspectors as being pragmatically fair. The majorityof inspectors expressed the view that they knew that the smaller sites and rural sites werenot being inspected to any where near the extent of the bigger sites. It was generallyexpressed that it would be difficult to change site selection policy given current notificationrates and resources available to the HSA. There are some proactive visits to construction designers professionals being scheduled forthis year. 100 visits to architects and Engineering practices are planned for 2001. However, due to set priorities and resource constraints site selection is in the main reactivewith the smaller sites and smaller rural sites not being visited to any significant extent.
Site Inspection Practices
There are no standardised methods for inspecting sites and inspectors will survey the sitesaccording to received training and experience. There is variation in assessing sitedocumentation and auditing in not a regular occurrence. The definition of auditing usedhere is as per BS8800 (1996), as follows, “A systematic and wherever possible independentexamination, to determine whether activities and related results conform to plannedarrangements and whether these arrangements are implemented effectively and are suitableto achieve the organisations policy and objectives. Inspectors will have a high profile on site by wearing the HSA logo at all times. They willmeet with and be accompanied by site management or safety officials as far as possible. All findings from visits are recorded for site management and safety officials either byadvice notes or letters. Formal enforcement action ranges from improvement, improvementdirection, prohibition notices or high court injunctions. Voluntary site closure is also anoption offered by the HSA on advice from the state solicitor. The most common reasons for issuing prohibition notices was the presence of imminentrisks or the lack of a safety management system. The majority of imminent risks on sitewere reported as falls from heights issues or overhead lines. All complaints and formal enforcement activities are followed up. Follow up visits on allother sites depends on the situation with the emphasis on ensuring the rectification ofproblems discovered by earlier visits. For the vast majority of sites access is always provided with hostility towards the HSAbeing rare.
57
Site Safety Standards Summary
All inspectors reported they encountered falls from heights and unguarded openings ascommon site problems. Other issues reported were lack of wearing PPE, overhead lines,plant movement and poor welfare standards. All inspectors cited a lack of planning as aprincipal cause of these issues. Whilst site safety could be variable across all sites, all inspectors drew a general differencein safety standards between Dublin and rural and or smaller sites. All reported that inoverall terms the Dublin region had the best standards overall and the rural and or smallersites which tended to be worse. The boundary constraints operating on the Dublin regionsites was also noted. All inspectors drew a general difference between house builders and the rest ofconstruction. The developer / housebuilder sites were constantly reported as beingmarkedly poorer in safety terms relative to general contractors. Other reasons cited for poor safety standards included weak safety management systems,lack of planning at the pre construction stage and lack of co-ordination between contractorson site. In the opinion of the inspectors the presence of a site safety officer was taken as showing anincreased commitment to safety by management. However all inspectors noted that thepresence of a safety officer did not necessarily equate to better site safety standards. Improvement of Site Safety
In terms of improving site safety all HSA inspectors agreed on the need to; ! generally improve training levels! increase the amount of planning before and during construction! increase client and designer influence over safety issues.! Introducing more “tool box” talks! Introducing more qualified scaffolders! Improving management commitment to safety! The safe pass scheme to be made compulsory! Slowing down construction project timescales! Decreasing the level of resistance from clients architects and engineers at the design
stage to becoming more involved in planning site safety! Reviewing inspection methods to include more auditing! Strengthening the regulations to ensure co-ordination among contractors! Increasing the number of safety representatives! Increasing site safety meetings! Increasing fines for non compliance with the construction regulations! Introducing tribunals to speed up lengthy court procedures for non compliance

58
Predicting Compliance One of the main objectives of this study was to investigate which factors are associatedwith compliance with safety procedures and requirements. Can the sites be differentiated byhow well the ratings of the management system correlate with safety compliance? Whatassociation do safety behaviours and attitudes have with either management factors orcompliance? The first step in this analysis was to establish how the many variables thatwere measured in the observation of compliance and in the safety management interviewsrelated to each other. Once these main factors were established, it was then possible toinvestigate the correlations between the different types of variables. Only the mainsignificant relationships are reported here. Many statistical analyses were carried out toexplore a wide range of possible relationships between variables. The vast majority of thesewere not statistically significant and are not reported here, primarily for reasons of space. The first step taken was to check for any pattern of relationships among the differentvariables of the observational study. A factor analysis technique is useful here, as it willallow us to discover if some variables tend to correlate better with themselves than withsome others, so that they form identifiable groups. Three groups of related variables werefound in the study when considering the compliance items (see table 20 below).
Factor 1 of non-complianceladders not tiedunguarded openingsunsafe storage of materialsmissing boards on scaffolds (not toeboards)trapped boards on scaffoldsmissing toeboards on scaffoldsmissing guardrails on scaffolds
Factor 2 of non-compliancenot external use of head PPEnot internal use of head PPEnot safe use of laddersnot wearing of viz vestrubbish on scaffolds (lifts)
Factor 3 of non-compliancerubbish on access routesno defined plant routesunsafe storage of materials
Table 20: Factors obtained when using 14 out of the 18 variables ofcompliance. 4 variables were rejected because of some missing values in them.

59
The first factor includes a range of items mostly related to working at height (ladders nottied, unguarded openings, and the condition of scaffolds) but also includes storage ofmaterials. The second factor is mainly concerned with safe behaviour (use of personalprotective equipment, use of ladders, and visibility vests). The third factor concerns accessroutes and interference by rubbish and unsafe storage. Of the three factors, only the first one shows significant relationships with other variablesin the research. In order to reduce the size of the report, only relationships for this factorwill be described below. Correlation indexes were calculated between Compliance-Factor 1, the fall preventionmeasure in the observational research (table 13 page 32) and the overall safety performancewhen all observed items are averaged together. Correlations between the three groups areall significant, with R= .86 for the overall safety performance, and R= .98 for the measureof falls prevention [see table 21 below]. These high levels of correlations are indicative thatthis factor of compliance can be used as a representative one for evaluating compliancewith safety on site. Consequently it will be named as “Factor of non-compliance withsafety.”
Correlation Coefficients between factors Non-compliance Overall Fall Non-compliance 1.0000 .8602 .9780 P= . P= .000 P= .000 Overall Safety .8602 1.0000 .8169 Performance P= .000 P= . P= .000 Fall Prevention .9780 .8169 1.0000 Performance P= .000 P= .000 P= .
Table 21: Correlation between statistically found Factor Non-compliance and previousfactors in the observational research.

60
A similar procedure of factor analysis was used for the management survey. It was foundthat two factors accounted for the main findings at the managerial level. The factors andtheir variables can be seen in table 22 below. Although these factors have a non-significantcorrelation with each other, the level of correlation obtained (R= .36, p= .146) is notnegligible. The small number of sites makes it more difficult to reach a significant result.
Factor 1: Management SystemQuality of the communicationPhilosophy of the companyTraining of operativesTraining of managersCommitment with co-operationPlan of actionQuality of co-operationFrequency of audits
Factor 2: Effectiveness of the management systemEffectiveness of audits to redirect organisational actionEffectiveness of hazard reporting to redirect organisational action
R= .3572 (p= .146)
Table 22: Factors related to the management system The first factor is a general factor including diverse aspects of the safety managementsystem (communication, training, co-operation, planning, audits, safety philosophy). Factor2 contains two items both reflecting how effective was the response to either audits orreports of hazards. Outliers, extreme cases and highly untypical results in management and compliance factorswere examined. Two sites had to be removed from further analysis due to these anomalousdata. Removal of site 8 was based on previous observation of a particular managementsystem that could be guaranteeing compliance but could not be explained by themanagement variables used in our research. Site number 9 was removed because of itsextreme values, but also because some of those values were related to single items (1 ladder

61
= 100% non-compliance; 1 opening = 100% non-compliance) seen on site. Site 9 was notbelieved to give a reliable indication of compliance.
Correlation indexes for each management factor against the non-compliance factor for the16 sites were calculated (see columns 2, 3 and 4 in table 23). Effectiveness of themanagement system (Management-Factor 2) correlates significantly with the level of non-compliance found on site (r = -.66; p= .005). Management system (Management-Factor 1)reached a moderately low correlation which was not significant but had a positive tendencyin the predicted direction (r = -.27; p= .31). Another significant relationship found in the study concerns the presence of a Safetyrepresentative on site (see column 5 in table 23). In comparison to other safety related roles,those sites with safety representatives show significant lower levels of non-compliance (r =-.78; p= .000). That relationship is even bigger than the one found between Effectiveness ofthe management system and Non-compliance. There is a modest relationship between thegeneral management system factor and the presence of a safety representative on site butthis is just short of statistically significance (r = .49; p= .054).

Factor Non-compliance
ManagementFactor 1
(scale 1-5)
ManagementFactor 2
(scale 1-5)Safety Rep. on
site? Reporting Fixing Stopworking
Followworking
Site 3 2.28 4.12 4.00 2 (Yes) 37.38 22.43 26.80 13.40Site 2 2.71 2.50 4.00 2 76.61 5.85 6.76 10.78Site 7 7.14 3.50 3.00 2 59.98 18.31 17.61 4.08Site 15 7.14 4.37 3.00 2 42.95 25.76 12.70 18.60Site 11 7.85 3.62 2.50 2 75.90 15.26 .88 7.96Site 12 5.00 4.12 2.50 2 70.48 17.06 5.56 6.88Site 5 14.00 2.50 3.00 1 (No) 58.91 5.18 19.25 16.65Site 18 12.85 4.00 2.50 1 31.25 34.16 3.33 31.25Site 13 10.00 1.37 2.00 1 45.55 26.46 5.55 22.40Site 6 11.71 2.85 2.00 1 37.30 6.38 23.86 32.48Site 14 12.14 2.87 2.00 1 47.26 27.28 4.85 20.61Site 4 12.85 1.12 1.50 1 32.26 17.41 36.55 13.81Site 17 15.00 2.87 2.50 1 50.36 26.58 13.11 9.93Site 1 15.71 3.50 1.00 1 68.38 25.31 .00 6.31Site 16 20.71 4.12 2.00 1 28.60 57.58 3.03 10.80Site 10 24.85 2.00 2.00 1 47.63 16.66 7.15 28.60
Factor Non-compliance
R= -.2709(p= .310)
R= -.6604(p= .005)
R= -.7870(p= .000)
R= -.3623(p= .168)
R= .3785(p= .148)
R= -.1898(p= .481)
R= .3305(p= .211)
ManagementFactor 1
R= .3572(p=.146)
R= .4901(p= .054)
R= .0535(p= .844)
R= .3779(p= .149)
R= -.3203(p= .226)
R= -.2553(p= .340)
ManagementFactor 2
R= .6931(p= .003)
R= .2031(p= .451)
R= -.2904(p= .275)
R= .1748(p= .517)
R= -.1545(p= .568)
Safety Rep. onsite?
R= .5074(p= .032)
R= -.2698(p= .279)
R= .0006(p= .998)
R= -.4868(p= .040)
Table 23: Visual and statistical correlations. Table ordered to show visual correlations between Non-compliance and Management-Factor 2. Other correlationsshown are presence of Safety Representative on site and Preferred behaviour of operatives in the face of danger.

63
Furthermore, workers’ preferred behaviour when facing risky situations was also correlatedwith safety compliance and the management system factors (see columns 6 to 9 in table23). It was found that no behaviour relates significantly with either the management systemor with compliance levels. On the other hand, the presence of the safety representativecorrelates significantly with the behaviours of reporting and continuing work. When asafety representative is present on site, behaviours of reporting are enhanced (r = .50),while behaviours of continuing working are minimised (r = -.48). Figure 19 provides a graphical summary of these significant findings (and includes the nearsignificant relationship between the general safety management factor and the presence of asafety representative). It should be noted that these are bivariate relationships –i.e.correlations between each pair of variables assesses independently of each other. However,in the real world, these relationships are not independent. For example, the correlation of0.79 between the presence or absence of a Safety representative on site and Non-compliance with safety is probably not independent of the relationship between the Safetyrepresentative variable and Effectiveness of the management system (Factor 2) and Non-compliance with safety (r = -.66).
Management System
Effectiveness of themanagement system
SafetyRepresentative
Non-Compliance
Reporting hazards
Continue working inhazards
-0.49
0.51
-0.79
-0.66
0.69
0.49
Figure 19: A model of bivariate significant relationships in this research

64
In order to examine the underlying structure of these relationships these variables wereentered into a multiple regression equation. This parcels out the correlations between eachpair of variables taking into account the relationships between the other variables within theother variables within the equation which may overlap. In this equation the only twosignificant variables, Effectiveness of the management system and Safety representative onsite, were entered into the equation with Non-compliance with safety being the dependentvariable. In other words, this was the strongest test of hypothesis concerning whichvariables predict or are associated with non-compliance with safety. The outcome of thisdemonstrated that only one variable –the presence or absence of a safety representative-was significantly related to compliance with safety. The presence of a safety representativeis strongly associated with better safety compliance.
Summary
Factor analysis identified a general factor of safety compliance with two smaller factors(the latter two had no significant associations with any other variables). The managementinterviews generated a general factor relating to the safety management system and a morespecific factor related to the effectiveness of the system in responding to audits andhazards. Figure 19 illustrates the significant relationships, which have been foundfollowing the removal of two untypical sites from the analysis. The strongest relationshipwith the main safety compliance factor is with the presence or absence of a safetyrepresentative. A safety representative on site is associated with better compliance. Theonly other factor that is associated with compliance is the second safety management factor- Effectiveness of response to audits and hazard reports. The general Safety managementfactor is not significantly associated with safety compliance, but does have a modestrelationship with the presence of a safety representative (this is just short of statisticalsignificance). The presence of a safety representative is the only factor which issignificantly related to safety behaviours - safety representatives are associated with agreater likelihood of reporting risky situations and a lower likelihood of simply continuingworking in such situations. The presence of a safety representative is also strongly relatedto the effectiveness of response to audits and reported hazards. This pattern of relationshipssuggests that safety representatives are the most important influence on the associationbetween effectiveness of response to audits and hazards and safety compliance. Tootherwise conclude that the influence of the safety representative is masked by themanagement system would be an erroneous one. When a regression analysis is carried outusing management variables and safety representation, only the presence of the safetyrepresentative remains as predictive variable. This result will favour the conclusion that therelationship between Effectiveness of response to audits and hazard reports (management-Factor 2) and safety compliance is modulated by the presence of the safety representative insite.
65
Discussion and Conclusions
This section draws together the evidence of this report addressing five questions:• How well does the sample represent the safety aspects of construction activity in
Ireland?• What can be concluded about the state of construction safety in Ireland?• What factors are associated with better safety compliance?• What implications can be drawn from the evidence?• What recommendations should be made?
How well does the sample represent the safety aspects of construction activity inIreland?
The sample was selected to represent both Northern Ireland and the Republic of Irelandand major dimensions of construction activity, which have been associated with fatalaccidents. Thus it included both housing construction and general contracting, andconstruction in and around both the major metropolitan areas, Dublin and Belfast, and inregional towns in the Republic of Ireland. Both large and smaller sites were included, theformer being categorised as IR£5 million or over, the latter, IR£1 million or over andunder IR£5 million. While small companies are very highly represented in fatal accidentstatistics, these are often subcontractors working on larger sites. Thus it was anticipatedthat we would get a reasonable representation of those employed by these firms on thesites chosen. While labourers are the most highly represented occupational category inthe fatality statistics, a wide range of occupations are involved in fatalities, and oursample of occupations was based on availability on the sites chosen. The highinvolvement of falling from heights in construction accident statistics led to a focus, inthe site observations and operatives’ questionnaire, on factors associated with fallingfrom heights. This while the survey did not include very small sites or sites in purelyrural areas, it has effectively included a wide range of construction activity, whichincludes the major dimensions associated with fatalities.
How representative is the sample of the construction industry in Ireland? There are twopieces of evidence that suggest that the sample may have a higher representation of“better” sites from the point of view of safety. First, the questionnaire results consistentlyshowed that construction workers rated the prevalence of risky situations as being lowerin the site on which they were interviewed that in other sites in which they worked.Secondly, it is possible to compare several dimensions recorded in this survey with theresults of the surveys carried out by the HSA. These statistics show that less than fivepercent of sites inspected had safety representatives compared to forty percent of the sitesin the Republic in this sample and one third overall (only one out of six in NI). Only fiftypercent of the HSA inspected sites had safety statements whereas only one site (in NI) inthis sample (of those whose documentation was inspected) did not have one.

66
While it is impossible to directly compare the criteria used in inspections with those usedin this sample, it is interesting to note the relative level of compliance with safetyrequirements. The HSA inspections documented that 69 percent of sites had inadequatescaffolding, whereas, in this sample, 61 percent of all 18 sites had more than 15 percentof missing guardrails or edge protection. 24 percent of the HSA inspections found edges,openings or fencing to be inadequate, compared to 39 percent of sites in this samplehaving more than 15 percent of openings found unguarded. In the HSA sample, in elevenpercent there was a recommendation for an improvement notice, and in sixteen percent aprohibition notice, compared to two sites (seven percent) in this sample reporting havingreceived improvement notices. It is not clear from the HSA data how many notices werein fact issued.
Perhaps a reasonable conclusion from this would be as follows. Selection for inspectionby the HSA is partly driven by internal and external complaints and so is likely to bebiased towards sites that have a poor compliance record. The sites in this sample, mostlybeing drawn from the CIS database, may have a bias towards companies which are betterestablished or better organised. However, the extent of this relative bias may not be verygreat. It is worth noting that sixty percent of the sites in this sample reported having had arecent inspection by the HSA or HSE. Thus it may be that the level of safety compliancein this sample will provide a modest overestimate of the level of compliance to safetyamong those working in construction in Ireland.
Nevertheless, even if there is a slight bias in this sample towards sites which may appearbetter on some indices of safety, the fundamental objective of this study is to investigatefactors which are associated with compliance. For that it is necessary to have a goodrange of sites, which vary both on indices which may predict compliance and on the levelof compliance itself. This sample fulfils these criteria quite satisfactorily.
What can be concluded about the state of construction safety in Ireland?Bearing in mind the above comments, the following broad observations can be madeabout the state of the art of safety in the Irish construction industry
Compliance with safety requirements
The level of safety compliance across the sites was quite variable. In relation to the itemsconcerning prevention of falls from heights, compliance ranged from good to poor. Thus,only two sites had full compliance on edge protections and handrails, five sites onunguarded openings. There were ladders which were not tied in eight sites. Thus it can beconcluded that there was much that could be improved in the majority of sites. Factoranalysis of the fourteen items which had sufficient variability between sites indicatedthree factors - the first, indicating general non-compliance with safety, included laddersnot tied, unguarded openings, unsafe storage, and deficiencies in scaffold boards, toeboards and guardrails. This factor was highly correlated with a smaller factor concerningspecific fall prevention measures but rather less so with a factor concerning generalhousekeeping.

67
Perception of risk
How well are the risks associated with falling from heights perceived? In general the ninesituations concerning working with ladders, scaffold and on roofs were perceived as highrisk (the major exception being short ladders, which were perceived as medium risk).However a small minority of workers in each site saw many of these situations as lowrisk. The frequency of these situations was generally seen to be fairly low in theconstruction industry, though constructions sites are generally perceived to be dangerousplaces. Workers do not generally see difficulty in being aware of hazards, or theirfamiliarity with work, or the demands of their work as significantly contributing tosafety. Thus, for most workers, developing and maintaining awareness of risk is notperceived to be a significant problem.
The great majority of workers report that they would respond constructively to riskysituations, either reporting the defect, fixing it, or stopping work (depending on thesituation). However, a sizeable minority (between ten and twenty percent) would justcontinue working (and this was between twenty and thirty percent for ladders being tooshort and working on roofs in bad weather). Thus there is a small minority who may notperceive risks accurately and a larger minority who say they are prepared to continueworking in risky situations.
Training
Almost forty percent of operatives report that they have received no safety training fromthe main contractor. For a further fifty percent their safety training comprised theinduction course (lasting between ten minutes and one and a half-hours). While managersconsider this safety training to be necessary and indeed should be supplemented byfurther refresher courses, many believe the way it is currently carried out is primarily to"cover themselves" in case something goes wrong. Eleven percent of the sample hasreceived safety training lasting more than one day. Very few sites claimed to have asystematic safety training schedule for their employees, and safety training was notusually a consideration in recruiting operatives, apart from the certificates required forscaffolders, crane and digger drivers, etc. In Northern Ireland there was much reliance onthe mobile CITB unit, and in the Republic interest was expressed in the potential benefitsof the Safe Pass Scheme. Thus it seems clear that for the majority of operatives the mainway in which they achieve knowledge of the risks of their work is through theirexperience of work itself. Even where the main contractor provides induction training,this is often perceived as a formality, to protect the company, with little expectation thatit would influence the knowledge and behaviour of workers. The low level of provisionof safety training is particularly worrying considering that twenty five percent of thesample report that they have worked in the industry for less than one year and fiftypercent less than two years. Thus their level of experience of the risks associated with thejob and of how to manage them may not be that great. Direct and vicarious experience ofhazards may be the main way of gaining knowledge of the risks of construction and howto manage them. This is a reactive and potentially dangerous way of learning.

68
Safety management
Both the management interviews and analysis of safety documentation indicated thatwhereas virtually all the sites had a safety plan, these were mostly generic documents thatcould be applied to any construction site. Thus, few contained a management structurewith clear delegation of responsibilities. Few contained safety statements from sub-contractors. Although half the sites had risk assessments which were site specific, insome of these not all the relevant site activities were addressed. These documents playedlittle or no role in ongoing management activities and their function appeared solely tomeet legislative requirements.
All sites conducted safety audits, mostly following a checklist method with a writtenaudit report. However few sites documented improvement measures or actions taken toremedy audit deficiencies. Hazard reporting was rarely documented and the same wastrue of incidents and near misses. Communication about safety was most often informaland verbal. A quarter of the sites had regular dedicated safety meetings, though for otherssafety was a frequent item on site meetings.
In all but one site some or all of the management had undertaken CIF/CEF trainingcourses. A small number of safety managers had also undertaken diploma courses inhealth and safety management. Six sites had a safety representative. Frequently these hadbeen appointed by the management.
A factor analysis of the variables investigated in the safety management interviewsindicated that a range of safety management activities, including those just discussed,were highly correlated in one general safety management factor. A second factorcomprised two items, which concerned the effectiveness of audits and hazard reporting inredirecting organisational action to improve safety. These two factors were notsignificantly correlated indicating that commitment to a range of safety managementactivities does not necessarily imply an effective response to audits and hazard reports. Ingeneral the perception by workers of the commitment of management to safety was fairlypositive.
Role of inspectors
While the majority of sites reported having had an inspection from the HSA or HSE,reactions to these inspections varied. Many reported no feedback or follow up from theinspectors to ensure implementation of recommendations. While many sites welcomedthe inspections and would have wanted more in-depth coverage from them, inspectors donot see their role as doing a full site audit and their practice in conducting an examinationof site documentation varies. From the inspectors' point of view, it is through theirexercise of their legal function (improvement and prohibition notices) that they seethemselves bringing pressure on the worst performing sites. Other comments were quitecritical of the inspections. Negative comments did not seem to be systematically relatedto experience of inspection on that site. Some could reflect the fact that inspections ofconstruction sites are sometimes done by inspectors with no specific qualifications inconstruction. The most common complaint was that smaller less safe sites were
69
overlooked. However inspectors report that a large proportion of inspections are reactiveto complaints or accident reports (overall, it is probably fair to say that there was littleevidence of direct positive influence on the sites surveyed from the inspections reported).
Conclusion
In conclusion, the evidence suggests great variability in compliance with safetyrequirements, with plenty of room for improvement. The great majority of workers onconstruction sites report good awareness of risks associated with working at height andthe majority would respond constructively to risky situations, though a significantminority would just continue working. Training for construction workers is patchy andseen to be inadequate, relying to a large degree on site induction training. Certification ofspecific trades (scaffolders, crane drivers, etc.) is monitored. The high proportion ofrelatively inexperienced workers gives rise to concern about their effective appraisal ofand response to risk.
Although workers are fairly positive about the commitment of managers to safety, theevidence from management interviews and documentation is less positive. Safety plansand safety assessments are most often paper exercises with little role in day-to-daymanagement. Only a minority of sites have safety representatives. Audits based onchecklists are used in most sites but it is difficult to find documentary evidence ofcorrective action. While a range of core safety management activities is closelyassociated together, these do not correlate highly with effective response to audits andhazard reports. While the majority of sites have had an inspection from the HSA or HSE,the priorities of the inspectorate are reported to focus on using improvement andprohibition notices to influence compliance (other than that, there seems to be littleopportunity for inspections to influence what happens on site).
What factors are associated with better safety compliance?Perhaps the core question in this study concerns the factors that may be associated withsafety behaviour and compliance with safety requirements. Those factors that tend to bepresent in the sites with better safety outcomes may represent the most effectiveinfluences on safety, whereas factors, which do not discriminate between relatively safeand unsafe sites are unlikely to be critical in promoting safety. For the purposes of thisanalysis the critical outcome variables are the safety compliance factors, and the safetybehaviours which workers report they would follow in risky situations - report it, fix it,stop working or just continue working.
The strongest relationship with the main safety compliance factor is with the presence orabsence of a safety representative. A safety representative on site is associated with bettercompliance. The only other factor which is associated with compliance, is the secondsafety management factor - effectiveness of response to audits and hazard reports. Thegeneral safety management factor is not significantly associated with safety compliance,but does have a modest relationship with the presence of a safety representative (this isjust short of statistical significance). The presence of a safety representative is the onlyfactor which is significantly related to safety behaviours - safety representatives areassociated with a greater likelihood of reporting risky situations and a lower likelihood of
70
simply continuing working in such situations. The presence of a safety representative isalso strongly related to the effectiveness of response to audits and reported hazards. Thispattern of relationships suggests that safety representatives are the most importantinfluence on the association between effectiveness of response to audits and hazards andsafety compliance.
The presence of a safety representative on site shows the strongest relationship withsafety compliance (the bivariate correlation of almost 0.80 is very high). Although thereis a tendency (almost significant) for safety representatives to be present in sites withbetter general safety management performance, it would be a mistake to conclude thatthis general safety management factor accounts for the relationship between safetyrepresentatives and compliance. There is no significant relationship between the generalsafety management factor and compliance. This factor, at best, has an indirectrelationship with compliance through the appointment of a safety representative. It is thepresence of the safety representative which influences compliance.
How does the safety representative influence compliance? The pattern of correlation andthe multivariate analysis suggest that the presence of a safety representative accounts forthe great part of the relationship between the effective response to audits and hazards(Effectiveness of the management system or Management-Factor 2) and compliance withsafety. Safety representatives strongly influence the response to audits and hazards(bivariate r = .60) but their influence on compliance is even stronger (bivariate r = .79).This suggests that they influence safety compliance not only through their influence onthe response to audits and hazards but also through other means.
The safety representative variable is also the only variable that shows a significantrelationship with reported safety behaviours –specifically reporting hazards and notcontinuing to work in hazardous situations. Thus safety representatives encourage thereporting of hazards and play the major role in ensuring that these reports lead to bettersafety compliance on site. Their presence also makes it significantly more likely thatworkers will not continue to work in hazardous situations.
It should be pointed out that these are not actual measures of workers’ behaviours butreports of what they would do in specific hazardous situations. Thus, it is more accurateto say that the influence demonstrated here is on the expressed intentions of workers onsite rather on their observed and recorded behaviour. However, although we cannotassume that intentions will always be translated into actions, what has been demonstratedhere is a strong and systematic relationship between the presence of a safetyrepresentative and intended behaviours in a range of specific safety situations which aregenerally perceived by workers as being risky.
Two aspects of the statistical analysis are worth a comment because of the, perhapssurprising, lack of statistically significant relationships. The first is the lack of associationbetween de general Safety management factor and anything else except the appointmentof safety representatives (almost significant). In particular, although the correlationbetween the general Safety management factor (Management-Factor 1) and Effectiveness
71
of the management system factor (Management-Factor 2) is 0.36, this falls short ofstatistical significance and thus we cannot be confident that this is not a chance result.Likewise there is no relationship is which we can have confidence between the generalsafety management factor and either safety compliance or the variables assessing safetybehaviours. These results must pose a fundamental question: why does so much activitywhich is undertaken in the name of safety apparently have so little influence on safetycompliance and safety behaviours?
Secondly, there is the lack of any significant relationship between the attitudinal variables(safety attitudes, perception or risk and safety climate) and any of the safety outcomevariables (compliance, safety behaviours). General safety attitudes were fairly high,though general attitudes towards risk were more ambivalent. The climate measure showsa generally positive perception of the management commitment to safety, and the specificrisk perception measures show, amongst the great majority, an accurate perception ofrisk. These attitudes and perceptions do not appear to have an influence on safetybehaviours and compliance. Thus it is possible to have fairly strong pro-safety attitudesand perceptions but poor levels of site safety compliance. This suggests that the difficultyof getting more consistent and higher standards of safety compliance may be less to dowith attitudes and perceptions of workers and managers, and more to do with systemicfactors –having mechanisms for reporting hazards, following up on hazard reports andaudits, and doing what it takes to ensure that hazard reports and audits are translated intoeffective compliance with safety requirements.
What is remarkable about the findings reported here is how little safety managementactivity has a measurable positive influence on safety outcomes –suggesting that safetymanagement systems as they exist very often do not provide a systemic basis for effectivesafety action. It is equally surprising that safety representatives who have little or noformal power, and some rights to be consulted and informed, have the strongest and mostpervasive influence on safety compliance and safety behaviours.
It is worth noting that most of these safety representatives are, in no formal sense,representatives –as they were appointed by management rather than elected by theirfellow workers. This in turn suggests the strong and important role of informalmechanisms of influence and persuasion in developing effective safety management. Therole of safety representatives in ensuring the job goes smoothly, in facilitatingcommunication, hazard reporting, and playing a strong informal disciplinary role wasrepeatedly highlighted in the interviews. Their ability to inspire trust and confidenceamongst fellow workers on site is illustrated in the following quotes: "If you approachthem in the right manner they will listen to you", "You need to communicate the messageto young inexperienced staff". Although in this sample it was safety representatives whoplayed this role (wherever they had been appointed), there is no reason in principle whythese informal mechanisms of influence should not be exerted by others as well as safetyrepresentatives. This is clearly not being done in the current situation.
As the majority of sites had at some time been subject to an inspection by nationalauthority inspectors, it seems sensible to pose the question –do these inspections have any

72
direct influence on safety compliance on site? We are not here concerned with thepossible influences of national activities of the authorities which are not quantifiable inthis context. Setting aside, also, the role of improvement and prohibition notices, theeffect of which could not be directly investigated in this study, the main sources ofevidence which can be brought to bear on this question are:
- what site personnel say about inspections,- what inspectors say about their role and objectives,- whether there is any evidence that sites which have received inspections
perform better than those that have not.
In relation to the third source of evidence, no clear pattern emerges with just one sitereporting a strong positive influence of the inspection on improving safety –for others theimpact was rated as neutral or weak. In the majority of sites positive comments weremade about inspections, and some of these indicated willingness for a more in-depthactive role of inspections. A lack of feedback or follow-up was a common comment.Negative comments about inspections were also expressed in a majority of sites. Some ofthese also suggest that an improvement in the inspection process would be welcomed.From the point of view of inspectors themselves, a number of issues arise. There is atension between rolling out a planned programme of inspections which systematicallycovers the whole industry and responding to complaints and accidents. The latter reactivedemands take priority over and often disrupt the former. The primary focus of inspectionsis on documenting compliance with safety requirements and the interviews withinspectors confirm many of the findings of this study in relation to compliance levels inthe industry. While site documentation is often inspected, there is no systematicmethodology for auditing or assessing the safety management system as a functioningmanagement process which is designed to ensure safety on site. Indeed, inspectors do notsee it as their role to conduct such an audit.
Thus, it could be concluded that while quite a lot of activity by inspectors was reported inrelation to the sites in this survey, very little of this activity appears to have, or to bedesigned to have, a direct influence on the effective management of site safety. This maybe a missed opportunity to create value (in terms of safety impact) out of a large scalenational activity.
There was little evidence of any other direct influence on site safety management fromother agencies external to the site, and the main and sub-contractors concerned. Thisincludes architects, the client of the building contract, or trades unions. External safetyconsultants were engaged on some sites in providing an auditing service. After handingthe conclusions to the main contractor, these external consultants appear not to have aninfluence in the measures employed by the main contractor in relation to safety. The lackof apparent direct an identifiable influence by these external agencies does not, of course,imply that they have no important role in site safety. Our conclusion is simply that, interms of the dimensions and measures which were employed in this study there was noevidence of a direct and identifiable influence. It would take a very different study tosystematically investigate the safety role and influence of such agencies.
73
What are the implications of the evidence?At its broadest level the main implication is that the system is not working. The coreprinciple of the European safety management framework is the identification ofresponsibility for safety at the level of the enterprise and the consequent outlining of arange of safety management actions through which this responsibility is to be exercised.These duties of management are complemented by duties of employees to co-operate andto behave safely. The Irish safety regulations, including those specific to construction,derive from this model, which is based on the premise that, if management and workersfulfil their duties and obligations, then safety will ensue. Most starkly, the evidence fromthis study suggests that this model is not working or, at best, is only working in a patchyand fragmented manner.
In particular,• The formal documentation of the safety management system - the safety statement
and risk assessments - are most often seen to be a paper exercise whose role is tosatisfy the legal requirement, rather than being an effective guide to managementaction.
• The same can be said about much of the operatives' safety training, which isundertaken. There is a lack of serious effort to ensure that inexperienced workers (ahigh proportion of the workforce) receive a thorough basic training in safety. Thestudy elicited less evidence about the quality of management safety training, but noneof the evidence suggests that it is having any major impact on compliance.
• While nearly all sites can provide evidence of the safety audits that they haveundertaken, few can show how and when the defects highlighted in the audits havebeen corrected. Many safety managers express frustration at their inability to ensurethat recommendations are translated into corrective action. When it comes toexecutive authority it is often too easy to marginalize the advisory role of the safetyofficer.
• The primary role of inspectors from the regulatory authorities is to inspect the siteitself. There is no systematic approach to auditing or holding accountable the safetymanagement system of the main contractor and its sub-contractors. Other thanthrough the formal channels of improvement and prohibition notices (which were notinvestigated in this study) there is little follow-up and little evidence of significantinfluence of the regulatory authorities on safety behaviour or compliance.
• Only a minority of sites have a safety representative.
On the other hand, there are some very positive findings, which come from the survey.• The way in which safety representatives can exploit their very informal role to help to
influence what both workers and management do.• The positive attitudes towards safety exhibited across the sample• The high awareness of the riskiness of situations associated with working at heights
and the tendency of the majority to act in a pro-safety manner in these situations.• The level of commitment and activity by many safety officers and management to
take their safety responsibilities seriously and fulfil them wholeheartedly.
74
Thus, while it could be said that the organisational safety culture in the constructionindustry is not strong, the most acute problem may lie less with the commitment ofindividual workers or management, and more with the failure of the system for regulatingand managing safety to provide effective channels to translate safety aspirations andinitiatives into effective outcomes. Strengthening the safety culture requires a systemsapproach, which should include the following elements:• Strengthening the safety management process• Defining more clearly the measurable outputs of safety management• Developing competence standards for training• Ensuring that performance criteria & targets are auditable.
Recommendations
Finally it is appropriate to make some recommendations arising from the findings of thisstudy.
Safety RepresentativesThis study has demonstrated the potentially strong role which safety representatives canplay in influencing both behaviour and compliance with safety requirements, andensuring that both audits and hazard reports are effectively dealt with. All sites shouldhave safety representatives and their role and functions should be reinforced as part of thesafety management system.
Training and certification
The most plausible interpretation of the findings in relation to safety representatives isthat their effectiveness is largely due to their ability to exert influence and persuasionthrough informal interpersonal methods. The social and interpersonal skills which thisrequires should not be the prerogative of safety representatives alone. There is enormousscope for improving the ability of those who have management and safetyresponsibilities, and indeed all those who work in construction, to manage the humanrelations of safety more effectively. These skills are trainable and susceptible tosystematic development. They need to be clearly and systematically addressed in alltraining related to safety in construction.
As far as possible, training should not only seek to foster awareness of hazard and risk,but it should strengthen knowledge and skills in managing risky situations effectively.This should include the communications and interpersonal skills, which are necessary atevery level to ensure that the correct influences on behaviour are consistently reinforced.Transfer of these skills to the working environment needs to be carefully fostered andmonitored. All levels of training should be addressed including
• Site induction and refresher training• Initiation to the industry and specific crafts / trades training

75
• Management training. Particular attention should be paid to fosteringparticipation in in-depth professional safety management training at diplomaand masters level.
The safety management systemClearly the requirements for safety management systems need to be radically reviewedand overhauled. It is too easy to comply with the law through having a paper system,which does not effectively operate in practice. This review should address:• Developing stronger criteria for active and effective safety management systems.
These should include design and planning, day-to-day management and monitoringand auditing practices.
• These criteria should be developed in new ways of auditing safety managementsystems, which can routinely and reliably assess the activity and effectiveness of thesystem.
• The role of safety officer should be strengthened to ensure that it is less easy tomarginalize what is essentially an advisory role.
• The accountability of operational management needs to be made clearer and firmer,and this accountability needs to be tied to measurable outputs of the safetymanagement system, including the demonstration of effective action to addressidentified defects and hazards.
The Construction Safety Partnership Plan
The regulatory authorities and the social partners who collaborate in rule making areresponsible to ensure the effectiveness of policy. Perhaps the clearest conclusion fromthis study is that established policy is not working well. New initiatives are currentlyunderway in the Construction Safety Partnership Plan (2000), and new codes of practicein scaffolding and other areas have recently been published. At the time that the fieldwork for this study was collected (Nov. 2000 - Feb. 2001), the Construction SafetyPartnership Plan was in the early stages of its implementation. Two measures in theCSPP were most apparent in the survey: the safety representatives' scheme which wasevident in a number of sites in the Republic, and safety training for managers (involvingthe great majority of sites). The evidence suggests that the safety representatives' schemeis highly successful. On the other hand safety training for managers does not seem to bedelivering a higher standard of safety compliance on many sites.
Other initiatives do not seem to have been implemented widely enough to have beenapparent in the survey, including the recommendation for inspectors to leave a report ontheir inspections (the reported inspections were at a time earlier than the survey). TheSafe Pass Scheme and Construction Skills Certification Scheme were known about butnot widely implemented at that time.
In the light of the findings, critical issues for the CSPP include the following:
• Extending the safety representative scheme to all sites. There was a tendency for thesites with safety representatives to already have better general safety management and
76
many of the representatives were, in fact, appointed by the main contractor.Developing effective safety representation on all sites will need more effectivesupport from the social partners to make this work where management commitment islower.
• An effective methodology for routine site audits must be developed. Auditing will notbe effective unless it includes an effective system for monitoring the implementationof safety measures and response to hazard reports. The CSPP only states that thecurrent auditing arrangements will be reviewed by early 2001. This should bestrengthened to require more stringent criteria for auditing.
• The recommendations for the introduction of a Safety Management System by theConstruction Industry Federation should urgently be reviewed in the light of theevidence of this report. Will the proposals for an SMS effectively overcome thelimitations in safety management indentified in this study? The evidence suggests thata lot of safety management activity is relatively ineffective from the point of view ofsafety performance. Recommendations for Safety Management Systems must addressthe problem of translating a paper demonstration that there is a management systeminto clear evidence that that system is delivering improvements in safety on theground.
• The wide range of training recommendations in the CSPP are to be welcomed.However it is important to ensure and to demonstrate that this training is effective andthat the safety messages are transferred to the site and result in safer behaviour andmore effective safety management. The management training programme should beurgently reviewed in the light of the lack of evidence that it is having an impact. Theother training initiatives should also be reviewed with respect to how well theyaddress the social and interpersonal processes which are essential to ensuring thatsafety is effectively addressed on a day-to-day basis.
• The role and activities of Inspectors should be reviewed with a view to maximisingtheir impact on site safety in a cost-effective manner. The advantages of developingadditional methods of influence which do not require legal sanction should beexplored. Attention should be given to strengthening the oversight of inspectors inrelation to the safety management systems of the contractors concerned; to improvingtheir communication and feedback to encourage better safety activity; and toarrangements for follow up activities to monitor improvements.
• The CSPP is a major social initiative with considerable resource implications for allthe social partners. Yet there is no proposal to monitor whether or not this initiativewill be effective in improving safety in the construction industry, beyond noting theimplementation of the various measures. If it is partially successful, there will be noway to systematically evaluate the strengths and weakness of various measures andinitiatives and adjust them with a reasonable expectation of improving the overallprogramme. A systematic evaluation strategy needs to be urgently developed. Thiscurrent survey was conducted at an early stage of the implementation of the CSPP. Itcould form part of a baseline measure against which improvements could be judged.However evaluation should not be done piecemeal, but as part of a clearly thought outstrategy in relation to the objectives of the programme. Good public policy wouldseem to require that such a strategy be developed as a matter of urgency.

77
References
• Berg, U. Safety Campaign “fall risk in construction work” Implementation of Safety& Health on Construction Sites. Proceedings of the 2nd International Conference ofCIB Working Commission W99, Honolulu, Hawaii, March 1999, Ed. Singh, A,Hinze, J. & Coble, R.J. Conseil Internationale de Batiment, Balkema, Netherlands,pp. 853-866, ISBN 90 5809 036
• Bourier, M. (1996). Organizing Maintenance Work At Two American NuclearPower Plants. JOURNALOF CONTINGENCIES AND CRISIS MANAGEMENT,4(2).
• Brabazon, P., Tipping, A., Jones, J., Construction health and safety for the newmillennium, Contract Research Report 313/2000, 2000 Health and Safety Executive
• Byung, Yong, Jeong,. Occupational deaths and injuries in the construction industry,APPLIED ERGONOMICS Vol 29 No 5, 1998
• BS 8800:1996 Guide to Occupational Health and Safety Management SystemsBritish Standards Institute 1996
• Cattledge GH, Hendricks S, Stanevich R., Fatal occupational falls in the USconstruction industry, 1980-1989, ACCIDENT ANALYSIS and PREVENTION 28:(5) 647-654 SEP 1996
• Cattledge GH, Hendricks S, Stanevich R., Fatal occupational falls in the USconstruction industry, 1980-1989, ACCIDENT ANALYSIS and PREVENTION 28:(5) 647-654 SEP 1996
• Cattledge GH, Schneiderman A, Stanevich R, et al., Non-fatal occupational fallinjuries in the West Virginia construction industry, ACCIDENT ANALYSIS andPREVENTION 28: (5) 655-663 SEP 1996
• Cattledge GH, Schneiderman A, Stanevich R, et al., Non-fatal occupational fallinjuries in the West Virginia construction industry, ACCIDENT ANALYSIS andPREVENTION 28: (5) 655-663 SEP 1996
• CDM 1994 Construction Design and Maintenance Regulations 1994 HMSO• Chen G.X., Expanded Analysis of Injury Mortality among Unionized Construction
Workers, AMERICAN JOURNAL OF INDUSTRIAL MEDICINE, Vol 37, 364-373,(2000)
• Chia-Fen Chi, Meng-lin Wu., Fatal Occupational Injuries in Taiwan Safety –Relationship between Fatality and Age, SAFETY SCIENCE, Vol. 27, No.1, No.1-18,1997,
• CIF 2001 The Construction Industry Federation Ireland http//:www.cif.ie• CSP 1999 Construction Safety Partnership Plan. Health and Safety Authority. 10
Hogan Place Dublin 2 1999• Clarke, T., Managing Health and Safety in Building and Construction. Butterworth
Heinemann 1992• Cooper & Duff, R., By accident or design? Causal factors in Construction industry
accidents, Proceedings of the International Conference of the EuropeanConstruction Institute and the CIB Working Commission W99, London, June

78
2000, Designing for Safety & Health, Gibb, A.G.F. (ed), pp45-52, ECI,Loughborough, ISBN 1 873844 484
• Construction Industry Review 1999 Outlook 2000-2002 Department of theEnvironment and Local Government, The Stationary Office, Dublin 2000
• Construction Safety Partnership Agreement 1999 Health and Safety Authority, 10Hogan Place Dublin 2, 1999
• Corrigan, S., Ward, M. and McDonald, N. (1999) Organisational Aspects of theImplementation of AMPOS. AMPOS- WP3- Deliverable 1.
• Cromie, S.D. (1999) A Comprehensive Approach to Human Factors Training.Journal of Professional Aviation Training, March 1999.
• Davies, V.J., Tomasin, K., Construction safety handbook 2nd Ed. Thomas TelfordPublishing 1996
• Duff, A., R., Robertson, I., T., Cooper, M., D., Phillips, R., A., Improving safetyon construction sites by changing personnel behaviour HSE Contract ResearchReport; No. 51/1993 Health and Safety Executive 1993
• ECI 1996 European Construction Institute., Total project management ofconstruction safety health and environment. 2nd Ed. 1996 Thomas Telford Publishing
• Embrey, D. (1998). Creating a Procedures Culture to Minimise Risks usingCARMAN. In F. Belton (Ed.), Symposium on Human Factors in AviationMaintenance, (pp. 167-178). Gatwick Airport: CAA UK.
• Frosdick, Steve (1997) the techniques of risk analysis are insufficient in themselves.DISASTER PREVENTION and MANGEMENT Vol. 6, No. 3, pp. 165 - 177.
• Gibb, A.G.F. & Gyi, D.E., & Haslam R.A., Occupational health management inconstruction – Problems and solutions, Proceedings of the 2nd InternationalConference of CIB Working Commission W99, Honolulu, Hawaii, March 1999,Ed. Singh, A, Hinze, J. & Coble, R.J. Conseil Internationale de Batiment, Balkema,Netherlands, pp. 769-776, ISBN 90 5809 036
• Gibb, A.G.F. Implementation of project management safety manual, Proceedingsof the First International Conference of CIB Working Commission W99, Portugal,4-7 September 1996, Implementation of Safety and Health on Construction Sites,Alves Dias, L.M. & Coble, R.J. (ed), pp 3-10, AA Balkema, Rotterdam, Brookfield,1996, ISBN 90 5410 847 9
• Gibb, A.G.F. & Foster, M., Safety motivation: Evaluation of incentive schemes,Proceedings of the First International Conference of CIB Working CommissionW99, Portugal, 4-7 September 1996, Implementation of Safety and Health onConstruction Sites, Alves Dias, L.M. & Coble, R.J. (ed), pp 405-415, AA Balkema,Rotterdam, Brookfield, 1996, ISBN 90 5410 847 9
• Gibb, A.G.F. & Haslam, R., Causes of accidents and priorities for intervention,Proceedings of the First International Conference of CIB Working CommissionW99, Portugal, 4-7 September 1996, Implementation of Safety and Health onConstruction Sites, Alves Dias, L.M. & Coble, R.J. (ed), pp 237-241, AA Balkema,Rotterdam, Brookfield, 1996, ISBN 90 5410 847 9
• Gibb, A.G.F. Effective implementation of a safety strategy during the constructionphase of major, complex construction projects, NICMAR Journal of Construction

79
Management, National Institute of Construction Management and Research, India,Vol. X, No. 2, July 1995, pp. 116-126, ISSN 0970-3675
• Gyi, D.E., Gibb, A.G.F., Haslam, R. A., The Quality of accident and health data inthe construction industry: interviews with senior managers, CONSTRUCTIONMANANGEMENT AND ECONOMICS, (1999) 17, 197-204
• HSA 1995 Guidelines to the Safety Health & Welfare (Construction) Regulations1995 Health and Safety Authority, 10 Hogan Place Dublin 2
• HSA 1999 Code of Practice for Access and Working Scaffolds. Health and SafetyAuthority, 10 Hogan Place Dublin 2
• HSA 2000., HSA Newsletter Winter 2000 Health and Safety Authority, 10 HoganPlace Dublin 2
• HSA 2000b. Construction Safety Partnership Plan 200-2002. Health and SafetyAuthority, 10 Hogan Place Dublin 2
• HSA 2001., A analysis of construction related accidents across a range of worksectors. and details of regulatory activity. Personal communication from the Healthand Safety Authority, 10 Hogan Place Dublin 2
• HSA 2001a., Programme of Work 2001. Health and Safety Authority, 10 HoganPlace Dublin 2.
• HSA 2001b. Construction Safety Partnership Plan, Progress Report 2001. Health andSafety Authority, 10 Hogan Place Dublin 2.
• HSE 1994., Construction Design and Maintenance Regulations 1994 HMSO• HSE 1994a., Managing construction for health and safety : Construction (Design and
Management) Regulations 1994 : approved code of practice L 54 Health and SafetyExecutive 1995
• HSE 1997 Successful Health and Safety Management HS(G)65 1997 The Health andSafety Executive
• HSE 1997a., Health and Safety in Construction. HS (G) 150 The Health and SafetyExecutive
• HSE 1997c., An evaluation of the Construction Design and Management Regulations1994HSE Contract Research Report; no. 158/1997 The Health and Safety Executive;
• HSE 2000: An investigation into the falsification of pellet diameter data in the MOXdemonstration facility at the BNFL Sellafield site and the effect of this on the safetyof MOX fuel in use. . The Health & Safety Executive UK
• HSE 2001 Fatal injuries in the construction sector reported to all enforcingauthorities: latest six months, corresponding period in previous year and last completeyear. The Health and Safety Executive UK Website
• http://www.hse.gov.uk/hsestats/construction.htm• HSE 2001a Rates of Workplace Injury Europe and the USA Health and Safety
Executive http://www.hse.gov.uk/hsestats/eurocomp.pdf• (HSE NI 2001) Personal Communication from the HSE Northern Ireland Office• Hurst, N. (1998). Risk Assessment : The Human Dimension, The Royal Society of
Chemistry• Alves Dias, L.M. & Coble, R.J. (ed), pp 11-19, AA Balkema,Implementation of
Safety and Health on Construction Sites, Rotterdam, Brookfield, 1996, ISBN 905410 847 9

80
• Janicak, C. A., An Examination of Occupational fatalities involving impact-relatedhead injuries in the construction industry, JOURNAL OF OCCUPATIONALENVIRONMENTAL MEDICINE, Vol 40, No. 4, April 1998
• Janicak, C. A., An Examination of Occupational fatalities involving impact-relatedhead injuries in the construction industry, JOURNAL OF OCCUPATIONALENVIRONMENTAL MEDICINE, Vol 40, No. 4, April 1998
• Jeong, B, Y., Occupational deaths and Injuries in the construction industry,APPLIED ERGONOMICS, Vol 29, No.5, 355-360, 1998
• Jeong, B, Y., Occupational deaths and Injuries in the construction industry,APPLIED ERGONOMICS, Vol 29, No.5, 355-360, 1998
• Kisner, S. M., Injury Hazards in the Construction Industry, JOURNALOCCUPATIONAL MEDICINE, Vol 36, No.2 137-143 (1994)
• Koningsveld, E. A. P., van der Molen, H.F., History and future of ergonomics inbuilding and construction, ERGONOMICS, Vol.40 No. 10, 1025-1034, 1997,
• Kunju-Ahmad, R., Gibb, A.G.F. & McCaffer, R. Developing a proactive safetyperformance measurement technique (SPMT) for construction, Proceedings of the2nd International Conference of CIB Working Commission W99, Honolulu,Hawaii, March 1999, Ed. Singh, A, Hinze, J. & Coble, R.J. Conseil Internationalede Batiment, Balkema, Netherlands, pp. 507-516, ISBN 90 5809 036
• Langford, D., Rowlinson, S., Sawacha, E., Safety behaviour and safetymanagement: its influence on the attitudes of workers in the UK constructionindustry. ENGINEERING CONSTRUCTION AND ARCHITECTURALMANAGEMENT, June 2000,Vol 7 no 2
• Laitinen H, Marjamaki M, Paivarinta K., The validity of the TR safety observationmethod on building construction, ACCIDENT ANALYSIS AND PREVENTION 31:(5) 463-472 SEP 1999
• Laitinen H, Ruohomaki I., The effects of feedback and goal setting on safetyperformance at two construction sites, SAFETY SCIENCE, 24: (1) 61-73 October1996
• Lawton, R. (1998). Not working to rule: Understanding procedural violations atwork. SAFETY SCIENCE, 28(2), 77-95.
• Lingard, H., Rowlinson, S., Behaviour-Based Safety Management in Hong-Kong’sConstruction Industry, JOURNAL OF SAFETY RESEARCH, Vol.28, No.4 243-256,1997,
• Lingard, Helen, Rowlinson, S., Behaviour-Based Safety Management in Hong-Kong’s Construction Industry, JOURNAL OF SAFETY RESEARCH, Vol.28, No.4243-256, 1997,
• Lowery, J.T., et al, Risk Factors for Injury among Construction Workers at DenverInternational Airport, AMERICAN JOURNAL OF INDUSTRIAL MEDICINE, Vol34, 113-120 (1998)
• MacKenzie. J., Gibb, A.G.F. & Bouchlaghem, N. M., Communication of healthand safety in the design phase, Proceedings of the 2nd International Conference ofCIB Working Commission W99, Honolulu, Hawaii, March 1999, Ed. Singh, A,Hinze, J. & Coble, R.J. Conseil Internationale de Batiment, Balkema, Netherlands,pp. 419-426, ISBN 90 5809 036

81
• Marsden, P. (1996). Procedures in the Nuclear Industry. In N. Stanton (Ed.), HumanFactors in the Nuclear Industry (pp. 99-116). London: Taylor and Francis. Reason, J.(1990). Human Error. Cambridge: Cambridge University Press.
• McDonald, N., Corrigan, S. Daly, C and Cromie, S. (2000): Safety ManagementSystems and Safety Culture in Aircraft Maintenance Organisations. SAFETYSCIENCE Vol 34, pp 151-176, 2000.
• McVittie, D., Banikin, H., Brocklebank, W., The effects of firm size on injuryfrequency in construction, SAFETY SCIENCE, Vol. 27, No.1, No.19-23, 1997,
• Mohamed S., Empirical investigation of construction safety management activitiesand performance in Australia, SAFETY SCIENCE 33: (3) 129-142 DEC 1999
• McDonald, N., Cromie, S., and Ward, M., The impact of safety training onsafety climate and attitudes. In Aviation Safety (Editor Hans Soekkha) Utrecht.: VSP1997, pp 649-660.
• Niskanen, T., and Lauttalammi, J., Accidents in Materials Handling at BuildingConstruction Sites, JOURNAL OF OCCUPATIONAL ACCIDENTS, 11 (1989) 1-17
• No 4, 70-72, (1999)• Ore T., Trends and costs of injuries and disease in the new-south-wales construction-
industry, SAFETY SCI ENCE 15: (1) 1-20 MAY 1992,• Pines A. and Halfon, S. T., Occupational Accidents in the Construction Industry in
Israel, JOURNAL OF OCCUPATIONAL ACCIDENTS, 9 (1987) 225-243• Pollack, E. S., Griffin, M., Ringen, K., Weeks, J.L., Fatalities in the Construction
Industry in the United States, 1992 and 1993, AMERICAN JOURNAL OFINDUSTRIAL MEDICINE, 30: 325-330, (1996)
• Robertson, I., T., Duff, A., R., Marsh, T., W., Phillips, R., A., Weyman, A., K.,Cooper, M., D., 1999. Improving Safety on Construction Sites by ChangingPersonnel Behaviour: Phase 2. HSE Contract Research Report No. 229/1999. Healthand Safety Executive, London
• Safety, Health and Welfare at Work (Construction) Regulations, 1995• Safety, Health and Welfare at Work (General Application) Regulations, 1993• Safety, Health and Welfare at Work Act, 1989• Stern F., Haring-Sweeney, M., Proportionate Mortality Among Unionized
Construction Operating Engineers, , AMERICAN JOURNAL OF INDUSTRIALMEDICINE, Vol 32, 51-56, (1997)
• Sun, J. et al, A Cohort Study of Construction Workers, AMERICAN JOURNAL OFINDUSTRIAL MEDICINE, Vol 32, 35-41, (1997)
• Sweeney, M.H., Becker, P., Bryant, C.J., Palassis, J., Reducing Injuries andIllnesses Among Construction Workers, AMERICAN JOURNAL OF INDUSTRIALMEDICINE SUPPLEMENT,1:96-97 (1999)
• Sweeney, M.H., Becker, P., Bryant, C.J., Palassis, J., Reducing Injuries andIllnesses Among Construction Workers, AMERICAN JOURNAL OF INDUSTRIALMEDICINE SUPPLEMENT,1:96-97 1999
• Tam, C., M., and Fung, Ivan., W., H., Effectiveness of safety managementstrategies on safety performance in Hong Kong. CONSTRUCTIONMANAGEMENT AND ECONOMICS 1998 Vol 16 pp 49-55

82
• Whittington, C., Livingston, A and Lucas D.A., Research into Management ,Organisational and Human Factors in the Construction Industry, HSE ContractResearch Report, 45/1992
• Wooton, R. (1998) Quality Management Systems In Aircraft Maintenance. In OnHuman Factors in Aviation Maintenance proceedings of a symposium in GatwickAirport, (Ed by F. Belton) 119-127, CAA UK.