
El Salvador: Country Economic Memorandum - All … · El Salvador: Country Economic Memorandum Augt...
152
Report No. 781M8M ElSalvador: Country Economic Memorandum Augt 14, 1989 Latin America and theCaribbean Regional Office Country Department II FOROFFICIALUSE ONLY t4 iDms 1 d?,' e -, O (, I 4 O . , . ' 6 .. : > s ^ - - 0~~~~~ Do=- "., 'e 'd .', te " .;bdd Ba < , Thi' -s d -'.,ocmn ha,s -a msrce d.tiuo an ma be ou'se<d by reci, -e-to onl.i tle. gef c of thei of,e@al . . ... Icnet -m~ay no;t otherwise '~~~~ D' / v. 2D ; 57~~~ ... J < _ } ) .> o I~~~ ~Q O ' W B authorization. 0 . . . S 0 3 ', n: .. S, .~~ ~ ~ ~ ~ ~ ~ ~ ~ ~ . .~~~~~~~~ This document has a irsticzed <ltibutIo and maybe usedby-recipients. only in te perfo~mance of teir official duties. Its contents maynotothierwise - - ? be discloseLwitotWoutdd8ank aatoization. - . ~ Public Disclosure Authorized Public Disclosure Authorized Public Disclosure Authorized Public Disclosure Authorized Public Disclosure Authorized Public Disclosure Authorized Public Disclosure Authorized Public Disclosure Authorized
Transcript of El Salvador: Country Economic Memorandum - All … · El Salvador: Country Economic Memorandum Augt...
Report No. 781M8M
El Salvador:Country Economic Memorandum
Augt 14, 1989
Latin America and the Caribbean Regional OfficeCountry Department II
FOR OFFICIAL USE ONLY
t4 iDms 1 d?,' e -, O (, I 4 O . , . ' 6 . . : > s ^ - -
0~~~~~
Do=- "., 'e 'd .', te " .;b dd Ba < ,
Thi' -s d -'.,ocmn ha,s -a msrce d.tiuo an ma be ou'se<d by reci, -e-toonl.i tle. gef c of thei of,e@al . . ... Icnet -m~ay no;t otherwise
'~~~~ D' / v. 2D ;
57~~~ ... J <
_ } ) .> o I~~~ ~Q
O ' W B authorization.
0 . . . S
0 3 ', n: .. S,
.~~ ~ ~ ~ ~ ~ ~ ~ ~ ~ .
.~~~~~~~~
This document has a irsticzed <ltibutIo and may be used by-recipients. only in te perfo~mance of teir official duties. Its contents may not othierwise - -
? be discloseLwitotWoutdd8ank aatoization. - . ~
Pub
lic D
iscl
osur
e A
utho
rized
Pub
lic D
iscl
osur
e A
utho
rized
Pub
lic D
iscl
osur
e A
utho
rized
Pub
lic D
iscl
osur
e A
utho
rized
Pub
lic D
iscl
osur
e A
utho
rized
Pub
lic D
iscl
osur
e A
utho
rized
Pub
lic D
iscl
osur
e A
utho
rized
Pub
lic D
iscl
osur
e A
utho
rized
CURRENCY EQUIVALENTS
Currency Unit - ColonUS$1 - CS
Fis%al YearJanuary 1 - December 31
WEIGHTS AND MEASURES
Manzana (Mz) - 0.59 Hectares (Ha)Metric Ton (MT) - 2Z04.6 lbs.
Spanish Quintal (QQ) - 46 kilograms
GLOSSARY OF ABBREVIATIONS
ADS Salvadoran Demographic AssociationANDA National Water and Sewage AuthorityANTEL National Telecommunications AuthorityBCR Central Reserve BankBFA Agricultural Dewelopment BankBH Mortgage BankCACM Central American Common MarketCBI Caribbean Basin InitiativeCDT Tax Discount CertificatesCEL Electricity Supply UtilityCENTREX Export and Import Documentation CenterCET Common External Tariff of the CACHCIF Including Carriage, Insurance and FreightCONADE National Commission for Displaced PersonsCOPAL Cooperative for cotton ginning, marketing and exportCORSAIN Salvadoran Investment CorporationCPI Consumer Price IndexCPR Prompt Foreign Excha.ae Coneersion CertificatesDIGEPROY Projects Directorate oif wHoPFESAL Family Health Sur:eyFUSADES Salvadoran Found-tion for Economic and Social DevelopmentGDP Gross Domestic ProductICA International Coffee AgreementICO International Coffee OrganizationICOR Incremental Capital Output RatioIDB Interamerican Development BankINAZUCAR National Sugar InstituteINCAFE National Coffee InstituteIRA Institute for Supply RegulationISIC Coffee Research InstituteISSS Salvadoran Social Security InstituteISTA Agrarian Reform InstituteHAG Ministry of Agriculture and LivestockHE Ministry of EconomyMIPLAN Ministry of Planning
MOF Ministry of FinanceMOH Ministry of HealthNPS Non-Factor ServicesNGO Non-Governmental OrganizationNTB Non-Tariff BarrierPERA Agrarian Reform Evaluation Project of MAGPL 480 Public Law 480 - US Food AidSCT Selective Consumption TaxSSMA San Salvador Metropolitan AreaUNDP United Nations Development ProgramUSAID US Agency for International Development
FOR OMFCUL USE ONLY
COer7 MA - I. SALWI
18 oPLATI8 08e61 (195)
u11.o0 eq lIo. In &ilioen 5.032 (16) u par oq. km.Rate of r 1. (1 ) U r eq. km. ft aoricultural lald
POPlaAI _ DVTItI98 S195 1078 16 HEALF14 (19186t )
Crud tIr Rate (por 1000) 48 42 87 Ppulation per phyaician 4.100CrWd Osti Rte (e 100 is 11 9 Pulation VWr hep btal M00Infanti Nsrutai0 (p. 1000 liv. Ic 180 so 84
incu 1wS1m1 l (Priv. nme Reeive 1975 16W TO UEIRRICITY 1t97 19S
iht 10 percenmtHii)s 20 6prct Slt tS de I nag* - toIt 07 48Lmeet 50 teroant 5iLamet 40 percent 1u5 iATri 196 17 I"7
AU6 TO SAM WATS 1968 1975 1966 Enrol lmnt Retee- - - - Primry: Total an 7S5 BOB
Pe rcet of pulation: Total a6 "5 lll* 605 761 naUrban 69 71 Feml, 79 74 nasRural 118US 43 Secondary: Total 171 195 go
ibDi 185 215 ma;URIT 196 17 197 iemle 13 17u no
Idex Feod Prnoductio Per Capita 9 106 a9 OW P6t CAPITA 196 1978 19Par Capita Supply of CIorle/dary 1.61,l 2.061 2,155Per Capita Supply of Pretnea afa sO 88 8 (Current Us Dellar.) 070 480 W
1I90 198?7 1s90 MAM.L C114 RABS (S, cont, price.)
1305 NATQINI. i0MT Min. C S DP nm. C I CDP 141. C * 96P 1970-75 1975-0 190-6 1966 96W 196
-DP at varbet prices 8.917 100.0 19.809 100.0 20.431 100.0 5.8 1.0 -1.5 0.6 0.S 1.0Greaw Doobtle Investent 1.1,8 1s.8 20.99 10.8 8.181 11.2 10.0 -8.0 -1.1 01.6 15.7 -S1.2Groas Natioal Slavine 1,i6 0.0 5.6S0 1S.8 .S2t 11.5 4.8 1.8 4.2 897.8 .. .4.7Current Account blanc. 78 0.8 69 8.0 72 0.8 a.a. n.e. n.a. a.a. a.a. U.e.Exper,a of am"*e NFS 8,04U S .0 4,188 17.9 4,190 14.7 7.9 2.8 -4.8 -12.6 9.7 ? 4.0Iow"rt of CNd aF8 W,s4 88.0 B."t? Q5.7 6.15 92.0 6.e Q.7 -4.9 -0.8 -0.5 -0.5
Value Added Lr Fi V.A. per Worker
OUT LA, BOR ME MPO iCTV 1960 lC19 1960 1986 1980 1966
(Comtnt 1962 Prices) Hin. C (S) "mo. C (5) rEI.000 (S) EmpI.000 (S) Colon (S) Colon (
Agriculture 841 26.6 74t 28.9 n.-. n.c. r c. a.a.induetry 607 24.8 780 Q5.0 n.e. na. n a. n.a.Sevice 1.64 49.9 1.59? 51.1 n.. n... a.a. n.a.
T@tal/Awerse 8.299 100.0 8.12a 100.0 n.e.
Mil lIon Coleane An perrent of curret GDP
COSOLDTE PRW CAL RLIC 1sc2 195 19s 19S 1966 1967 1960 1982 1968 19 195 19w 1987 196
Current ReceiptS 1.990 2,28 2,507 2.8iU 4.11 4,869 4.S60 22.1 22.1 21.7 06.0 01.1 18.7 16.0Currio Eepditurea 1.91S 2,817 2.649 2.785 8,618 4,118 4.848 21.4 22.8 22.7 19.1 18.8 17.7 15.8Current a dget blance f4 (70) (10) 127 547 241 201 0.7 -0.7 -1.0 0.9 2.8 1.0 0.6
Capital Esenditures 761 1.328 691 788 8e9 948 885 8.5 15.1 5.9 5.1 4.4 4.1 8.1Overall Dficit 95) (810) (841) (422) (87 (7) ) (6W7) -8.9 -8.0 -2.9 -2.9 -0.4 -3.0 -2.SOfficial Capia l*u t (0) (0) 0 (o) 0 at? 419 -0.0 -0.0 0.0 -0.0 0.0 2.6 1.SExternal lwrrming (e) 878 428 220 269 22 200 24* 4.2 4.1 1.9 1.9 1.1 0.9 0.9
This document! s a rricted distribution and may be used by recipients only in the performanceof their offlicial duties Its contents may not otherwise be disclosed without World Bank authorization.

011f oCAA - I ALVA06
NOW. OEM me5 VW=9
(Will 2g. Cob....) 1900 1951 1153 115 1156 1no a 14 1 1155
gan C..oito. M a1*. .mw. ON 1.510 0.4101 1.80 8.749 S.073 2.744 3.27 $.01S13* Ornilt f Privett sect.r S,UJ 3.1.0 0.6 8.0 8.1* 4.05 4.41 5.40 41.4
O%nW _t beal _ U * oG U.1 S#. .0 W.* S 7. VA 0.3 8.4 UA U.9C__ Pricelod", (396143) 300.0 11.3 32. JI.3 1. 143.0 11.41 0.4 aw.l
_nnat _3?4S39 A lot 15Com,. P"ice toO. 14.1 U.M3 23. 11.llS 12.0 1." 9 4.6 13.0bS. Credit to Pobl Is twb 1.43 73 .10.6 9.3 UA.I -10.03 W.S 10.4Soak Credit 14 Prftivoto Sest 4.1 -14.1 to." 10.2 17.43 s.211 .4 21.1
6ALm1 OP PAWSfOlSti tttii 2. 1150 1051 1M1 19 £106 *19 1 1157 190 @
- -- (Av w 194(1) offn. Use (M)itert .t Go ado ,W $ 1.31 976 as 3" 64 9i2 we V _ - _
Nrde.di.w (PM5) 1.073 715 V 00 735 M to 7 U 1 n *ole 487.3 40.3obe-Psea Sbeviug 45 1in 16 in 11i of 51U so4 gm Cet 31.6 4.2
*no#, 21.0 2.3larte oa m_ta 1.170 1.1" 1.061 1.06 LU1 1 .11211 1.147 1.21 l Shr.mp 13.3 2.2
tiaradl (P5 8n an5 MS a" 14 on S" 994. SA Ifow" CAC1 * 3.1 16.3teFtor Service 213 s5 010 20 2 me 2o gm 156 l A 10e. 13.5
_mre ben.. 4 (7W (M) (1) (") c5 (13) (M61) (413) Total illB 74.4 100.0U" pit.r Inome (46) (74) OMS (U1S) tl10) (15) (18) 73 M)
Paeut Emipta W 40 sO # 6S As t9 as SFactor P _ANa 19 1S O 1i is 10 in 1 4 1 14 ITmWd. am7 (and Wried)
U l*t- to so) 0 J 44 61 74 is 74 so (5 Oa ilE im) 190 1son._, C.tr_ Tenar 40 a W Ws a1 31l ast No 403. -
#W. Feble . MPb. ar.. 24 1.670Curret Agw_t blame. i i13c) ( 14) (45) (BB) 110 14 sort Teta * Df 27 0
I_r_.a...toed privet. "0.1 161 soLo-Term Cpitael Wlor MS 2W7 st 41 Ws 31 7 9 (41) e -
Ciro" I.v.etina 6 (a) (1) 0 IS 12 0 O 0 Toutl a;tomdies A Olabureed 912 t,17Ot'fileisCapitalGramst 0 0 0 0 0 0 0 0 aNat LT L (9 an dat) so0 19" Z1 13 1an 7 i (U) 9 (61)OisbOsnt i# Mt 2as 40ti US 17 11 r am 11 t 01116M RATIOil_p.gAts titi 10 1n 2.8a 17 11 1t (prt) 1900 311
0*. LT iS1s ot ) 100 14 13 s4 13 U M so (0) 0JOLT P*IIg -*iP. on". 3.3 21.3
Totl Other Itm Q69) 3) sn() (n) (47 on CM) t(o c) ( S wt TeM ib & w O 0.0 0.0U" sort- er. _ ital so 34 0 mm is (13) (44) 0 * N14-*rnted Pri ve. Cb* 2.S 1.3Coieloloiw tN.0 0 0 0 9 9 0 0 0 ---S o.-. d _ imm (3,6) (10o (10 mm a) (1") (90 (on (a) Totel citatumil 45 Ol_aboro 8.6 24.2
COa_n_ I* W* _ tROrvea( ) 31 S1 M1 c) 7 (1) (43) (W) s0Nt_ Crdit from Dv 14 aS aS 17 (66) (1 (36) 0 0
OWOW RATIS 1M0 1titiS 1t1 1i 15 1119011 15s6 10 190 29 LeIti (WI.. use) 1INS 1967 1986
OffgiaI Rote:.o.t.t 0.0 68.0 0.0Calones r Wi (end pried) 2.80O 2.69t 2.300 2.300 2.800 2.800 8.000 8.000 8.000Colon. por N53 (Prted ave.) 2.800 2. 2.200 2.8 2.600 2.800 3.000 6.000 5.000 Gr. DOi bureeeet 3.4 S.4 13.4
Principal Resysn6t 7.9 0.6 11.18biun Rate: M% DOI.herae.t (4.8) (5.2) 2.3Coloe r W Si (and period) - - 3.000 .000 5.000 mntere O.re 10. 11.4 11.8CoEcoet per WUNI (wrid . .) _ _ _ _ _ _ . 5.000 .00 U" Trumfer (18.0) (16.6) (9.8)
1rk*et RateC Oubtsaatanding &Dirb. 140.1 U6i.5 15.4Colon" per ts (en perioe) - - - - - - 8.000 5.000 .006 Debt Oetln i * i. 180.0 25.2 213.7Coloes pr WIM (riod av.) -- - - - - 8.Ot .00 5.000
-- 1-___.
EL SALVADOR
COUNTRY DOUCC HMD3ANDW
TABL Of CONTaNTS
SUMMARY OF MAIN CONCLUSIONS ..................... ..... .. I
I. MACROECONOMlC sITU&TION AND PROSPECTS ................... 4 . .. 1
A. Background ................................................. 1B. Public Finsnces ............................................ 4C. The External Trade Regime and the Current Account .. 6D. Investment Performance and Prospects ....................... 10S. Employment and Wages ;............................ 13F. Summary of Policy Issues ................................... 14
II. GOVERNMENT FIANCES .......................... 17
A. Overview ........................... .17D. Taxation ........................... 17C. Public Expenditures ...................... 21
(a) Economic and Functional Classifications ............... 21(b) Wages and Employment .................................. 21Cc) Public Investment ..................................... 23
D. Public Enternrises ....................................... 24S. Deficit Financing ......................................... 25F. Fiscal Policy Management ................................... 27
III. TRADE POLICY AND PERFORMANCE ................................... 28
A. Background ............................................... 28B. Trade Policies .. 29
(a) Legal Tariffs .29(b) Non-Tariff Barriers .31(c) Tariff Collections and Exonerations .34
C. Reform Proposals .35
This report is based on the findings of a mission which visited El Salvadorin November/December 1988. The mission was led by Robert Laslett(macroeconomics), and consisted of Tarcisio Castaneda (health andpopulation), Joaquin Cottani (trade) and Baudouin Hubert (indastry) of theBank's staff, and consultants Arthur Mann (public finance). Alvaro Reyes(education and housing) and Eric Shearer (agriculture). Researchassistance was provided by Claudia Riccardi, and Maria Adela Shearercontributed with work on NGOs. The assistance of Felix Jakob (housing) isacknowledged. Merle de Silva wordprocessed the report.
-2-
IV. AGRICULTURE ........ ....... . ...... ......... . , 40
A. Production, Trade and Prices .. * . , ...... 40
(a) Overv'iew.... ................... ...... ... 40(b) Food and Feed Ptoducts * . . . ... 42(c) Coffee .............................. 43(d) Other Products .. . .... ... ... . . ... ........ 45
B. Institutional Issues .... .... ........ * 46
(a) Price and Commodity Policies ..... 46(b) The Agrarian Reform . . ............ 47(c) Agricultural Credit .... 49(d) Irrigation. ............... ...... 49(e) Environment ............ . ........... 50
C. Policy Recommendations. . . ........... .50
V. MANUFACTURING .. ......... ..... .... 52
A. Overview ... 52B. Trade Regi.......... * .. . ........... 54C. Investment Financing . ...... 57D. Price Controls . . . .............................. 59E. Conclusions and Recomendations . .. 59
VI. SOCIAL SECTORS .................. 62
A. Overviw ........ 62B. Populationpn.. .... ......... 63C. Health Services ....... 64D. Education . ... ................. . 67E. Housing. .......................... 69
VII. ECONOMIC PROJECTIONS ... 73
A. Introduction ............................................... 73B. Prospects with Present Policies . .74
(a) Assumptions .74(b) Outcome .75
C. Prospects with Economic Policy Changes . . 76
(a) Assumptions . . . . ....................................... 76(b) Outcome . . . . . .................. 77
D. Conclusions ....................... 78
Annex I ................................. ... ......................... 84Annex II........ 86Statistical Appendix ..... .... 91

SUMMARY OF MAID CONCLUSIONS
1. Macroeconomic Situation and Prospects
i. El Salvador's civil war imposes heavy costs which impede economicdevelopment. About 70,000 I4ves have been lost, and it still continues tocause major economic, social and human damage. The proportion of thebudget devoted to national security (272 in 1987) is by far the highest inLatin America, and about 750,000 people have emigrated in the last decade,while another 500,000 are refugees within the country. Coupled wit) analready high population density, El Salvador also has a high rate ofnatural population growth, which combined with internal migration isplacing a heavy strain on the public provision of infrastructure and basicsocial services.
ii. Per capita incomes have stabilized at a low level. GDP fell by222 between 1978 and 1982. Adverse movements in the terms of trade andregional trading problems contributed by cutting exports, but most of thefall came as domestic political turmoil depressed private consumption andinvestment expenditure. The decline was halted in 1983, and since theneconotic growth has averaged only 1.72 a year. Despite war casualties andemigration the population has grown at around 1.4? per year, so real percapita GDP has stabilized at a level similar to that of the early 1960s andremains about 20a below peak.
iii. Emigration, war casualties and military recruitment have allslowed the growth of the labor force. The growth of the workWng agepopulation slowed from 14.8Z in 1970-75 to only 5.12 in 1979-85. The laborsupply declined even faster, since emigrants and military recruits camefrom the age groups with the highest labor force participation. The primeage (20-44) civilian male population was still below its 1978 level in1988. The stock of human capital fell yet more since emigrants had moreeducation than the population as a whole, and school enrollment ratiosdeclined steeply. Recent years have seen an improvement in labor supply,with the growth of the working age population returning to Z.32 a year by1987, and school enrollment recovering to pre-crisis levels.
iv. El Salvador depends heavily on external assistance to meet itsfiscal and trade deficits. In the early 1980s, the public finances cameunder strain as revenue declined with the fall in GDP, and securityexpenditures and public investments grew. The deficit has declined verysubstantially in recent years, mainly at the expense of public investment.There was also some increase in public savings as current expendituresdeclined, mainly in the social sectors, but the tax effort contributednothing to closing the fiscal deficit, and revenues remain at a low level.The development component of public expenditure was thus sacrificed to meetthe urgent need to control the deficit.
v. The deficit is larger than is shown in the budget. Many publicexpenditures are made outside the budget and supported by externalborrowing and grants. In addition, large unacknowledged losses in thenationalized banking system and in public sector lending to agriculture arecontingent liabilities of the public sector. The public sector itself hasreceived sizeable subsidies from the banking system by borrowing at low
- U -
controlled interest rates. Finally the public sector has a large floatingdebt, partly in the form of overdue interest payments.
vi. Improvements in the public finances are necessary for manyreasons. Investment, maintenance and recurrent social expenditures have tob,: .reased to lay the foundations for growth without inflationarydor ;tic financing. Public sector wages need to be selectively increased,as a means of improving efficiency. The public sector must put itself in aposition to cover its outlays from its own resources without r-alying onmajor transfers from abroad. Provision must be made to meet theaccumulated losses of the financial system, to allow it to finance moreproductive investment. And most importantly of all, the public sectorneeds the flexibility to increase public savings in support ofstabilization and adjustment objectives.
vii. The economy also suffers from major distortions. Particularlyimportant is the appreciation of the real exchange rate as a result ofassistance, remittances, and the trade regime. The resulting incentivespenalize agriculture and manufacturing, cutting their capacity to generateforeign exchange, the so-called "Dutch disease' effect. There is a dangerthat the exceptional levels of foreign exchange inflows responsible for theappreciation will disappear: official tr. -fers are likely to fall in themedium term, and recent surveys and projections of migration suggest thatremittances w4 11 stagnate. Thus the foreign exchange needed for economicgrowth will have to come from the production of tradeable goods.
viii. The current policy of stimulating investment by keeping creditcheap and allocating it preferentially to agriculture and manufacturing isboth distorting and ineffective. Bank credit is available to theproductive sectors at interest rates which are negative in real terms andis rationed by administrative allocations. This worsens the allocation ofinvestment resources and leads to excessive self-financing by someenterprises. It is difficult to identify any effect on investment orgrowth of the favored sectors. Non-bank credit markets seem to be thin ornonexistent and many firms are financing investment out of retainedearnings, which tends to constrain overall economic growth. In addition,the artificially low cost of capital to those able to get credit tends toencourage more capital-intensive techniques of production than the realscarcity of funds would justify, reducing the demand for labor.
2. Public Finances
ix. The tax system has contributed little to solving E1 Salvador'sfiscal problems. Several measures are needed to increase revenues andeliminate unnecessary distortions. The stamp tax needs to be reformed toreduce distortions, increase uniformity and eliminate exemptions. Ideallyit should be replaced by a tax such as a VAT, which would allow drawbacksfor exports and cross-checks on other taxes to tighten up auditing andcollection. Even incorporating all firms into the VAT network a uniformtax rate of 15-162 will be required to yield the same revenue as the 5Xstamp tax. To avoid an ercessively high VAT rate exemptions should be keptto a minimum.
- iii -
x. Another necessary change Is to simplify the design of directtaxes. There are 25 different personal income tax brackets with marginalrates from 7.41 up to 60S. There is no indexation and tax brsckets havefallen considerably in real terms. It would simplify administration todrastically reduce the number of brackets and improve incentives to set themarginal rates in a narrower range (perhaps 10 to 501). The businessincome tax has five tax brackets, with rates ranging from 151 to 351, whichshould be simplified to a single rate in orier to promote economies ofscale both in tax administration and in production.
xi. Tax evasion is at least 402 of the tax collected, and the areasmost prone to evasion are direct taxes and import duties. Income taxsimplification combined with the use of the central taxpayer file, cross-checking with other external data, and more external audits is needed toincrease collections. Almost all direct tax audits are desk studies andmore, less complete, field audits should be made on a larger number oftaxpayers. The tax collection system is ir.efficient, with only 251 of taxcollections withheld at source. Independent professionals are not subjectto withholding or estimated tax payments. Delays in receiving some taxesare also excessive, and the sanctions for proven tax fraud are ineffectire.
xii. Only modest changes should be made to the coffee export tax in theshort run, to avoid loss of revenue. Though it contributes to anti-exportbias, the tax is fiscally vital, having averaged over 201 of centralgovernment revenues during the 19809. Moreover, the tax is easier toenforce than corporate income taxes, from which producers are exempt.However there are some deficiencies in the design of the tax. The fixedcoSt of coffee production is above the tax-free allowance of $45, so thetax falls as a share of profits as the price rises. To make the tax moreprogressive and equitable, it is important to raise the allowance, whichhbS been constant since 1950. If this were to take place at the same timeas a devaluation, it would not necessarily involve a loss of public sectorrevenue.
xiii. Defense and interest spending have crowded out public social andeconomic spending. In 1978-79 they took 132 of total expenditures and by1986-87 this had reached 41?. Over the same period spending on socialprograms fell from 401 to 24?, and real per capita social welfare outlaysfell by over 40X. The economic contribution of public spending has beengreatly reduced and needs to be restored. Total general governmentemployment fell from 5.2Z to 4.3Z of the working age population, thoughthere may have been some growth in public enterprise employment.
xiv. Public secto; real wage rate- have fallen more than those in theprivate sector. The fall has been mitigated for some employees by wagedrift (upgrading staff to raise their salaries while leaving wage scalesunchanged). As the biggest cuts were in the higher salary ranges, wagedifferentials within the public sector have shrunk drastically. Thiscombination of wage ratio compression and falling real wages hasundoubtedly affected the ability of the public sector to retain qualifiedpersonnel, posing a major threat to efficiency. Decompression is needed toimprove the provision of public services and assist adjustment efforts.
^ iv-
xv. Public investment in 1984-87 averaged 3.6Z of GDP. While privateinvestment is rising and is consistent with an economic growth rate of 1-22p.a., public investment continued to decline into 1987 anA 1988, and is nowless than is needed to maintain and replace existing assets. Publicinvestment will have to increase, both to complement private investment andto rebuild deteriorated infrastructure.
xvi Public investment is also badly managed and major cht"tges areneeded in the way it is planned and carried out. One source of problems isthe lack of flexibility in investment financed from external sources.Management problems such as poor programming of funds and materialsresulted in substantial under-achievement of public investment targets in1988. The ability of the public sector to manage investment projects islimited partly because of the lack of appropriately qualified personnel.Atiother problem, resulting from the war, is that much of public investmenthas te be directed toward short-term repair and rehabilitation projectsthat do ot add to the capital stock.
xvii. too much government control has led to erosion of publicenterprises prices and investment. Their operating surplus in 1984-87 wasa result of cuts in capital spending rather than improved operatingperformance. This will increase the future financing needs of theenterprises and cut the quality of future services. The real revenues ofthe public enterprises have declined, largely in consequence of consciousgovernment decisions to permit their tariff rates to lag behind the rate ofinflation. Public enterprises should be given more managerial autonomy,within an overall financing and regulatory framework given by government.
xviii. The public sector deficit has mainly been financed through grantsand external borrowing. Sir:a 1983 external grants have contributed anaverage of 58f of total deficit financing. In contrast recorded domesticborrowing has practically disappeared since 1986. External borrowing hasfunded around one-third of the deficit throughout the decade. Despite thelargely concessional terms of these loans, external debt servicing is anincreasing burden, and it would be unsound in the long term for the publicsector to increase external borrowing unless more growth-oriented policiesare adopted.
xix. There has been major unrecorded domestic financing through paymentorders in arrears, or the floating debt. In 1986 particularly, theincrease in the floating debt amounted to over 32 of GDP. The floatingdebt burdens banks and suppliers, increasing the costs of purchases andreducing the liquidity available to the rest of the economy. It isimportant that government arrears be held to a reasonable level (e.g. 60days of purchases) and that the full deficit be reflected in the fiscalaccounts.
XX. The lack of fiscal policy coordination has negatively affected theuse of fiscal policy for stabilization purposes. The BCI prepares themonetary program, MIPLAN the investment budget, and the MoF the centralgovernment budget, with little reconciliation between these threeexercises. The three bodies should better coordinate their activities toproduce a singie set of numbers on which to base fiscal policy.
3. Trade Policy
xxi. The main aim of trade policy should be to encourage export growthand diversification by tariff reform and real depxf:ciation. There are twomain domestic policy constraints on exports. Firstly, as a result of pastregional import substitution efforts, the structure of production is ill-adapted for exports outside the Central American region. Secondly, thereal appreciation of the currency has reduced the incentives for bothexports and import substitutior.. Reforms in'the system of protection wouldboth necessitate and tend to produce a real depreciation in the value ofthe currency.
xxii. There is a wide dispersion of nominal rates of protection, whichproduces an even greater disparity in effective rates of protection (the.protection on value addei) in favor of consumer goods - the so-calledcascade effect. This arisas because consumer goods producers benefit bothfrom high tariffs on competing imports and from low tariffs on inputs.Agriculture and non-traditional exports on the other hand recelve negativeprotection. While export taxes produce negative-protection, much moreserious price distortions result from the protection of import substitutes.
xxiii. Until February, 1989 this pattern was worsened by the selectiveconsumption tax, which raised the effective protection on consumer goodsstill further relative to intermediate and capital goods and increased thedegree of negative protection on agriculture and non-traditional exports.Exchange controls and other NTBs are of great potential importance in tradeprotection. The authorities could for instance limit the number of importapplications. The Salvadorean authorities should avoid using suchquantitative restrictions on imports to keep the official mazket inbalance. As the gap between official and parallel market rates increases,this would worsen the distortions in the trade system, furthor underminingexport prospects. The authorities should also refrain from using otherITBs such as prior deposits and prohibitions.
xxiv. Tariff exonerations are not achieving their intended effect, andcause a great loss of revenue. Though most exonerations are supposed toapply to intermediate and capital goods, the highest exoneration rates areon consumer goods. Potential duty revenue in 1987 was US$E8 Mn., of whichthe govetnment actually collected US$51.7 Mn. El Salvador should abolishtariff exonerations except those on fuel and on inputs used to produceexport manufactures. This would make the system easier to understand andwould to some extent offset the increase in import demand that would resultfrom eliminating NTBs. There would be a net gain in tariff revenue.
xxv. The distortions arising from the tariff structure itself need tobe reduced if not eliminated. A first step to reduce both the level andthe variance of tariffs would be to set a ceiling on rates, e.g., 402 andto cut tariffs to this level over a 2-3 year period. This would parallelpolicy changes already underway in Costa Rica and Guatemala, and would thustend to harmonize trade policies within the region. The current temporarysuspension of the CET affords an ideal opportunity for E1 Salvador to do
vi -
this. Effective protection for domestic producers would remainconsiderable, but anti-export bias would be reduced and the dispersionamong rates of protection would fall. The proposal to move to a 5-502tariff range is a first move in this direction.
xxvi. A more ambitious step would be to set all trade taxes at a lowuniform rate. This would produce more-or-less uniform effective protectiongreatly reducing dispersion and giving similar incentives for allcategories of production. A small bias against exports would remain, buttheir relative competitiveness would be much improved. It might make senseto eliminate export taxes altogether, replacing them with profits taxationand auctions of quota rights uuder the ICO and in the US sugar market. -
4. Agriculture
xxvii. The agricultural sector shared in the general fall in economicactivity, and in recent years has done worse than the rest of the economy.It is of fundamental importance in terms of exports, income generation,employment and fiscal revenues. Price controls and interest subsidies havecaused high fiscal and efficiency costs, and cannot be sustained in theirpresent form. Many farms cannot service their debts to the banking system,and agricultural prices, after a respite in 1986, have continued to fall inreal terms. The sector thus poses a major policy challenge. Substantialrelief can be expected from improved macroeconomic policies, in particulara real devaluation, but a careful overhaul of government policies andinstitutions is also needed.
xxviii. Falling world prices and real appreciation have hurt the sector(which is the most export-oriented). The real average world price ofagricultural commodities fell by over 40Z betveen 1978 and 1987, and thisin combination with E1 Salvador's real currency appreciation produced a 50Zfall in the real prices received by producers. All types of agriculturalproducts have been severely affected, though domestic market prices fellless than those of export crops.
xxix. Land pressure and overuse are intense. With about 350 people persquare kilometer of cultivable iand the country is the most densely settledin Latin America. Large areas of vulnerable land are being cultivated, andconsequently soil erosion is severe. In addition mangrove forests havebeen decimated by developers and cotton planters, destroying the breedingareas of shrimp and other marine life. Other environmental problemsinclude soil contamination by long-term excessive application ofinsecticides to cotton.
xxx. Agricultural imports have increased, and exports have fallen. ElSalvador's comparative advantage, though obscured by distortions, seems tolie in coffee, fishery products, fruit and vegetables and some basicgrains. TheBe areas will all be benefitted by freeing up prices and tradein the sector, and by Amproved macroeconomic policy signals, cruciallyreal devaluation. At the same time, several subsectors where product ishigh-cost and Inefficient - such as sugar or livestock - will likely
- vii -
decline. Indeed, the overall price level received by farmers could doclinein real terms if trade liberalization proceeds too rapidly. To avoidunnecessary disruption, the reduction of tariff protection for import-substitutes should be spread out over several years.
xxxi. There is a good deal of price intervention. During the pastdecade there have been major increases in state trading, subsidies, pricecontrols and quantitative trade restrictions. There are import targets forstaple foods that compete with domestic produce. The Ministry of Economysets price ceilings, import and export targets and trading margins forseveral consumer goods. INCAFE and INAZUCAR monopolize trade in theirrespective products. The intervention of these diverse agenc0es weakensthe planning and coordinating role of the MAG itself.
xxxii. The agrarian reform of the early 1980s has been difficult andcostly, and the most important economic issue is now how to improve theproductivity of the reformed lands. Cooperatives are heavily indebted, butat interest rates lower than agricultural price inflation, so the debt isfalling in real terms. The fact that they cannot service these debts is anindicator of severe management problems. Rather than continued publicsector subsidies they need training, management reforms to introducetangible property rights for members, better financial arrangements forbasic social services now being charged to overhead, and restructuring ofcredit arrears. Individual proprietor beneficiaries also need strongertechnical and financial support, perhaps through non-governmentalinstitutions.
5. Manufacturing
xxxiii. Industrial production is heavily concentrated in consumer goodswhich are not competitive in world markets. As demand fell, manufacturingoutput fell even more than the rest of the economy. Domestic demand wasresponsible for the bulk of the fall, and a decline in exports ofmanufactures in the early 1980s also contributed. In 1987 output was still212 below its real 1978 level. Unlike agriculture, the poor performance ofmanufacturing is wholly attributable to domestic incentive problems.Industrial sector prices have more-or-less kept pace with those in theeconomy as a whole, resulting in an increasing degree of implicitprotection. Import liberalizatioi and a more competitive financial systemare needed for the sector to develop new markets and grow.
xxxiv. The major influence on incentives is the trade regime. Adopted inthe context of regional integration in the 1960s, import substitutionindustrialization policies have been continued in the 1980s despite theerection of trade barriers within the CACM. The small scale of theremaining protected (domestic) market has accentuated the well-knownpr,blems of these policies. It affords few profitable opportunities forgrowth.
,1
- viii -
xxxv. The 1986 export incentives l"w attempts to counter anti-exportbias. However incentives remain strongly biased in favor of importsubstitution. '- some of the same tax exemptions were given in the pastfor sectoral ( ilopment purposes, the net effect in many case' is toreduce taxation on the sector, rather than change the structu, ofincentives in favor of exports.
xxxvi. Policies to encourage sustainable manufacturing growth thereforeneed to start with trade policy changes in several major areas, includingreal devaluation and trade liberalization. Key policy changes are loweringimport barriers and making rates of protection more uniform amongactivities, by eliminating non-tariff barriers and redt-cing the dispersionof tariff rates. Real depreciation of the currency is also needed toincrease the incentive to produce tradeable goods, both exports, andefficient import suLstitutes.
xxxvii. Faced with the stagnation of the manufacturing sector, thegovernment tried to stimulate output by means ot credit subsidies.Manufacturing has been greatly favored in the allocation of bank lending.Though investment has increased, this policy has not provided a viablebasis for manufacturing to make a sustainable contribution to growth. Ithas also imposed heavy costs on the banking system.
xxxviii. E1 Salvador needs to reduce the entry barriers to the formalsector caused by discretional tax incentives, price controls, sectoraldevelopment laws and credit allocations. A particularly important areawill be the provision of finance, as the demand for new investmentfinancing is likely to increase at the same time as pressure on the bankingsystem from overborrowed incumbent firms. The reform of incentives willboth have to be accompanied by measures to make the allocation of creditmore responsive to market forces, and by measures to strengthen the equitybase of the banking system, particularly moving to interest rates whichmore accurately reflect the cost of capital and injecting new equitycapital into the banking system.
6. Social Sectors
xxxix. One of the most impressive and positive fetetures of El Salvador'sdevelopment record during the last decade has been the general maintenanceor improvement of basic social indicators. Ir.fant mortality fell, theprevalence of communicable diseases has declined, and life expectancy rose.Food availability increased, and malnutrition declined. Despite theseachievements, El Salvador still has some of the gravest social problems inthe region. The rate of infant mortalit7 remains one of the highest inLatin America, income distribution is radically unequal and resources forpublic social services are scarce, reflecting pub'ic finance problems.Some but not all of the resource shortfall has been met by the increasedefforts of NGOs.
. ix -
xl. Rapid natural population growth is one of El Salvador's mostfundamental problems. It has declined recently to 2.7? per annum but isstill among the highest in Latin America. Emigration has slowed the growthof the resident population substantially more, to only about 1.4S from 1978to 1988, but as emigration slows population growth can be expected toaccelerate. Efforts are needed to improve the availability of familyplanning services, pArticularly in the rural areas.
xli. Public health spending has been severely squeezed, and needs to betargeted on the neediest. Efficiency would be improved by emphasizingprimary health care, where coverage is inadequate. The main causes ofdeath are diarrhea and respiratory diseases, and combating them is mainly amatter of improved sanitation and primary health care. Primary carecoverage of the most vulnerable groups however is deficients the MoH issupposed to attend 852 of the population, yet its child care and nutritionmonitoring programs cover only 20-402 of children, and 352 of pregnantwomen. Middle-income groups should be encouraged to use private facilitiesand heath insurance. This would also encourage the development ofadditional private sector infrastructure.
xlii. Primary and hospital care need to be better integrated to improvereferral, diagnosis and early treatment and cut costs. Administrativeexpenditures could be cut since operating units have been decentralized andhospitals operate autonomously. Staffing patterns should be changed toincrease the number of auxiliary and paramedical personnel in relation tothe number of doctors from the current ratio of 2sl to about 4sl or 5:1.The MoH should also be given the incentive to cut personnel costs byallowing it to retain the budget for vacancies eliminated. These changeswould help restore the share of basic goods and services in the MoH budget.
xliii. Primary educational enrollment ratios declined disastrously withthe onset of the civil war, from 79X in 1979 to a nadir of 612 in 1981.Since 1983 they have risen, and the enrollment ratio had reached over 802by 1986. A conspicuous feature of the recent increase has been the rapidgrowth of private schooling, which expanded at an annual rate of 17.42,over six times the rate of growth of public school enrollments. By 1987,private schools accounted for 12.22 of primary pupils, up from 7.6t in1983.
xliv. This increase reflects quality problems in the public schoolsystem and is evidence of a strong demand for education. Firstly, thepublic scbool system suffers from capacity problems because it has beenstarved of investment funds, and suffered major losses of facilities in the1986 earthquake. Secondly, there has been a steady fall in teachers' realsalaries and teachers work only part time. Though pupil-teacher ratioshave been maintained, teacher motivation is poor. Lastly, there has beeninadequate expenditure on books and other educational equipment.
xlv. The public sector should concentrate its scarce educationalresources on the neediest groups, particularly women and rural pupils. Thestrong effective demand for education at all levels, and people'swillingness to pay for it, gives the public sector the opportunity to do

this. Improved vocational and technical training would lay the basis forraising the productivity and wages of the poor in the long run. Theprivate sector would continue to expand to satisfy the demand of othersegments of the population.
xlvi. The housing situation presents persistent serious problems,aggravated by war and earthquake losses. Internal migration adds tohousing demand in the urban areas. Private investment in housing hasincreased almost continuously, both in real terms and in relation to GDP,since the mid-1970s. Public spending on housing has fallen back steeply,and showed no sign of a recovery in 1988 despite the reconstructionactivity after the earthquake. The fall has been sharp enough to reducetotal housing investment.
xlvii. There is a mismatch between houaing supply and demand, which iscausing serious problems in formal sector housing finance. Many unitsremain unsold, despite an overall housing deficit. The problem lies partlyin the rise in nominal interest rates, which has led to heavy front-endloading of loan payments, and the fall in real incomes which has madeformal housing hard to afford. Changes are needed in the credit policiesof the publicly-owned financial institutions, and the coordination betweenconstruction and mortgage financing.
xliii. The area of housing construction with most potential is theinformal sector. Migrants and other urban dwellers unable to afford even aminimal finished house try to obtain a building plot, and construct andupgrade their dwellings in line with their income and needs. This process,almost universal in developing countries, has received little help from thepublic sector in El Salvador though it has been assisted through someforeign aid programs. Obstacles include difficulties in obtaining legaltitle to building plots, and lack of credit.
xlix. The result is a major housing deficit. Measures are needed toassist the informal sector and redirect public subsidies away from highincome housing. Injections of public funds under existing institutionalarrangements are unlikely to produce results. More consistent andcomprehensive planning for the sector are needed to identify demand, andlay the basis for meeting the needs of all sectors. The problems of theurban land market merit special study and policy attention, to meet theneeds of low income families. The aim would be to facilitate thedevelopment of sites and services projects, construction materials creditsand other initiatives which have proven useful in other developingcountries, but which have yet to take root in El Salvador.
7. Projections
1. El Salvador's economic performance is projected with and withoutmacroeconomic policy changes. Without policy changes, GDP growth will beconstrained by lack of access to imports. The economy would be unable togrow as fast as population, so per capita GDP would fall continuously.
- xi -
From 1991 onwards, real GDP would start to contract. The main purpose ofthe scenario is to show just how unsustainable present policies are. Whileadjustment actions carry a shzrt-term cost, the longer term damage fromdoing nothing is certainly greater.
li. Several major policy reforms are assumed for the alternativescenario, which targets a 42 GDP growth rate. Policy measures are taken toincrease exports, savings and the efficiency of investment. The keypolicies are a 502 devaluation, taken at the beginning of 1990 and itssupporting measures, namely, far-reaching trade liberalization, fiscalimprovements, reform of the financial system and enhanced social programs.These changes are assumed to increase investment efficiency, economize onimports and accelerate export growth. They strengthen creditworthiness andthere is substantial external borrowing, much of it in the form ofmultilateral programs.
li. The resource gap stabilizes (in US dollar terms) from 1992onwards, and after increasing to over 92 of GDP in 1990 due to the relativeprice effects of the devaluation, falls steadily to around 62 of GDP by1997. Most of this gap is initially financed by transfers but officialgrants fall throughout the period. As a result, the current accountdeficit increases slowly, reaching a peak of 52 of GDP by 1995. Even givengenerous levels of official financing, there is a need for additionalfinancing, which increases in the late 1990s as multilateral adjustmentlending begins to taper off. Debt indicators remain within reasonablelimits up to 1997, with MLT debt servicing reaching at about 62 of GDP and272 of exports. However they are still increasing and El Salvador willneed either more concessional lending terms in the 1990s, or still morerapid export growth, to make a 42 GDP growth rate feasible.
liii. The economic outturns of the two projections are very different,particularly in terms of the long-term prospects of the country. Under acontinuation of present policies, El Salvador ends the decade i'n a worseeconomic position than at present, with the economy contracting. Under theassumed policy changes, it generally improves its position, but alsoacquires a heavy burden of debt. Both scenarios are dominated by costsinherited from the recent past; weakened competitiveness, low investment,aid dependency, heavy war expenditure and war damage, and weakenedinstitutions. Accordingly, it is hard to make incomes grow. An earlyresolution to the conflict, which is consuming over 252 of public sectorrevenue or 52 of GDP in unproductive expenditures, would clearly be ofenormous benefit to the economy. But as plans should be laid which arefeasible even with the current security situation.
I. MACIOECONOKIC SITUATION AND PR0SPECTS
A. Background
1.01 El Salvador faces formidable difficulties in implementing asuccessful development strategy, increasing the need for efficient resourceuse and prudent public sector management. About 70,000 lives have beenlost in the civil war which has racked the country for a decade and stillcontinues to cause major economic, social and human damage. The proportionof the budget devoted to national security (27Z in 1987) is by far thehighest in Latin America, and is similar to that in Israel or Jordan. Anestimated 750,000 people (15? of the population) have emigrated in the lastdecade, while another 500,000 are refugees within the country. Coupledwith an already high population density, El Salvador also has a high rateof natural population growth. The combination of migration and populationgrowth is placing a heavy strain on the public provision of infrastructureand basic social services. Much of its agricultural land is overused andsome is irretrievably degraded. The area is volcanic and seismicallyunstable, and in October, 1986, the capital was severely damaged by anearthquake. These and other challenges greatly complicate the task of theauthorities in managing the economy, and constrain the policy alternativesopen to them.
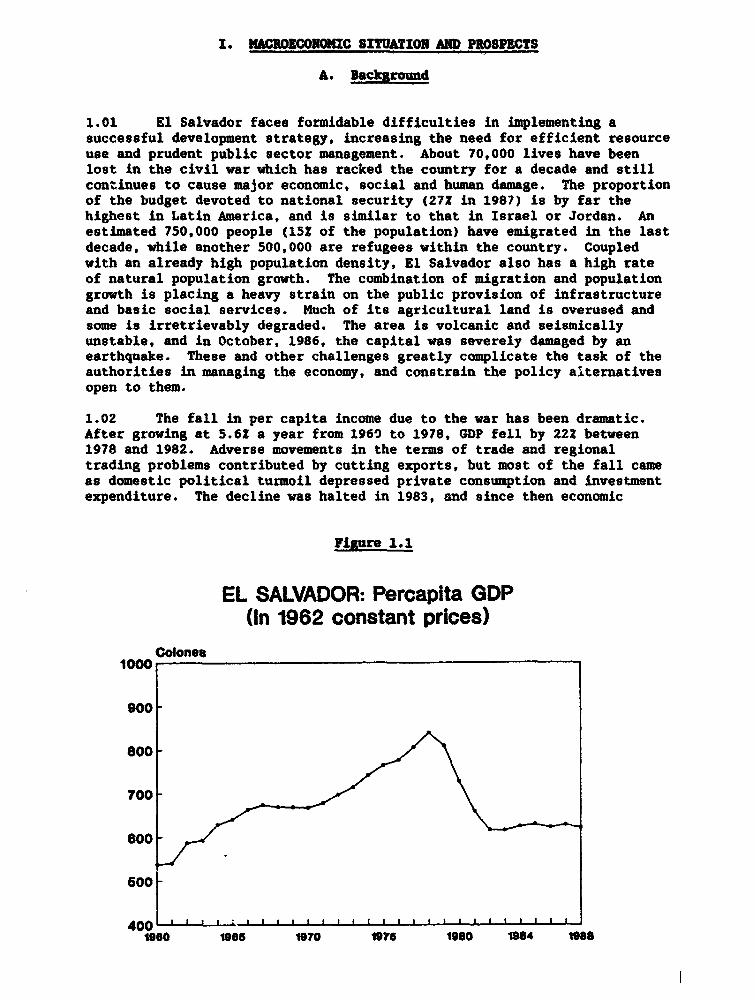
1.02 The fall in per capita income due to the war has been dramatic.After growing at 5.6Z a year from 1960 to 1978, GDP fell by 222 between1978 and 1982. Adverse movements in the terms of trade and regionaltrading problems contributed by cutting exports, but most of the fall cameas domestic political turmoil depressed private consumption and investmentexpenditure. The decline was halted in 1983, and since then economic
Figue 1.1
EL SALVADOR: Percapita GDP(In 1962 constant prices)
Colones1000
900
800
700 -
600
400 1 ' ' I1900 1906 1970 1975 1980 1984 1088
growth has averaged only 1.72 a year. The underlying population growthrate is around 2.72, and despite war casualties and emigration thepopulation has grown at around 1.42 per year, so real per capita GDP hasstabilized and remains about 20S below pre-crisis peak levels. High coffeeexport prices and other factors had produced a sharp peak in GDP in thelate 1970s, but the subsequent fall was much greater, and the current levelof $850 per head is similar to that of the early 19609.
1.03 The fall in living standards was even more severe than that i-output. Private consumption spending fell more than GDP in the earlystages of the crisis and remains depressed, so real per capita privateconsumption fell about 25Z. Not only is income depressed in the aggregate,but the already unequal distribution of earned incomes in the San SalvadortIetropolitan Area (SSMA) seems to have grown worse in recent years.Contributing factors have been falling real wages and declining employmentin the formal sector. Over a third of Salvadoran families however arereceiving remittance incomes from abroad which are not captured in theincome distribution data, and this partly offsets the worseningdistribution of earned incomes. Health, nutrition and other socialindicators have remained remarkably stable (Chapter VI), in part due tothis flow of unrecorded incomes to vulnerable groups.
1.04 Despite a jump in the share of public administration and defensein GDP, reflecting the increased role of the public sector in the economy,the sectoral composition of GDP has remained far closer to that of theimnediately pre-crisis period than to that of the early 1960's when percapita incomes were similar to today's. The share of agriculture in totaloutput has increased, as relatively strong demand offset the adverse supplyeffects of rural violence and the major policy distortions affecting thesector. Because of this, the overall share of tradeables in GDP hasremained almost constant in spite of a loss of competitiveness resultingfrom real currency appreciation.
1.05 Transfers played a critical role in stabilizing the economy after1983. The fall in GDP from 1978 to 1982 was spread across all the majorprivate expenditure components, and stopped in 1983 when exports andconsumption abruptly ceased to decline. The export turnaround was mainlybased on traditional crops, whose performance is relatively isolated fromthat f the rest of the economy. Private consumption was subject toconflicting influences: on the negative side there was massive emigration,real wages were declining and employment was only recovering modestly. Onthe other hand, major official transfers were beginning to come in fromabroad, while emigrant remittances were increasing rapidly.
1.06 Demand growth since 1982 has come purely from domestic sources,led by private investment (up 87Z) and public consumption (up 18Z). Thecontribution of the external sector has been negative, with exports growingmore slowly, and imports faster, than GDP. While the increase in privateinvestment is positive for growth, this pattern of growth based on domesticexpenditure will not be sustainable in the medium to long term, since lackof foreign exchange will become a serious constraint on the economy.

-3-
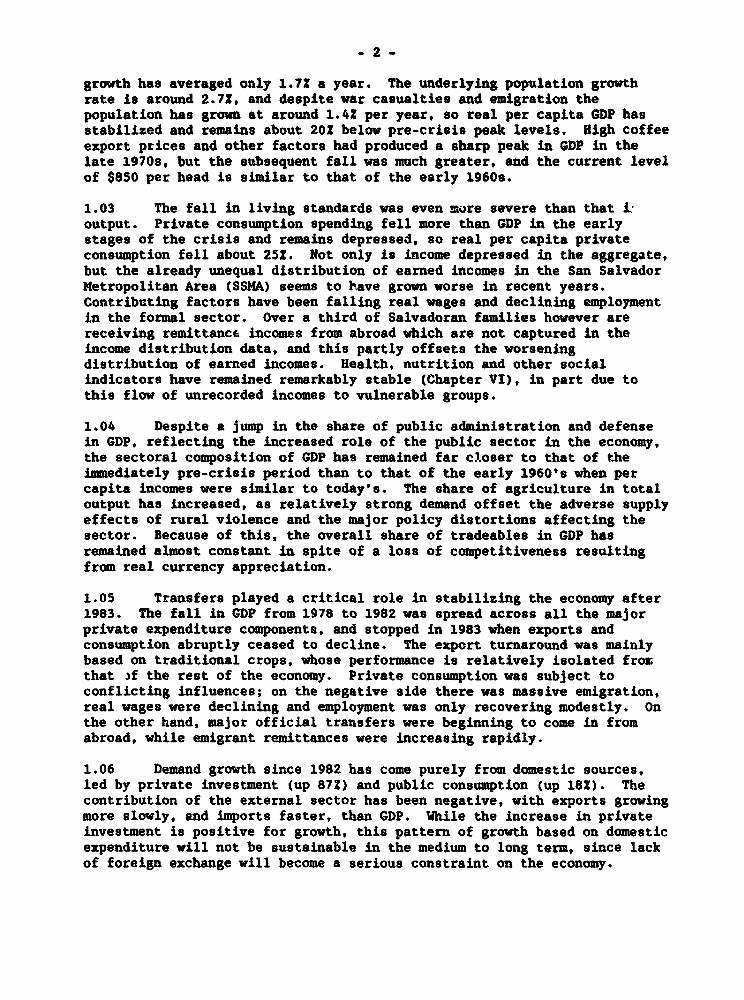
1.07 The longer-term behavior of GDP is closely related to the supplyof factors of production, particularly capital. The availability of bothlabor and capital declined importantly in the crisis years and, though ithas recently improved somewhat, remains well below the levels of the 1960sand 1970s. Private investment has had a part'.cularly strong influence ongrowth, as can be seen from Figure 1.2. From 1980 to 1984, there was notenough investment to maintain the capital stock, which fell by about 14X.Output fell faster than the capital stock, suggesting that a switch to morecapital-intensive production methods in response to increased labor costsand capital subsidies, and capital losses due to violence, expropriation orabandonment of assets were also important. With the recovery of privateinvestment the capital stock began to recover from about 1985, and has nowreturned almost to its historic relation to output.
1.08 Emigration, war casualties and military recruitment have allslowed the growth of the labor force. The growth of the working age(15-64) population slowed from 14.8? in 1970-75 to only 5.1Z from 1979 to1985. As emigrants came from the age groups with the highest labor forceparticipation, the labor supply declined even faster. The loss ofproductive labor due to military recruitment (44,000 from 1978-88) alsofell on these age groups, and the prime age (20-44) civilian malepopulation fell by 3.7? from 1979 to 1985, and had not yet regained its1978 level by 1988. The stock of human capital fell yet more sinceemigrants had an average higher skill levels than the population as awhole, and school enrollment ratios declined steeply. Recent years haveseen an improvement in labor supply, with the growth of the working agepopulation returning to 2.3Z a year by 1987, and school enrollment havingrecovered to pre-crisis levels. Many rural labor markets remainconstrained by emigration, including internal population movements.
Kigure 1.2
EL SALVADOR: Growth RatesGDP and Capital Stock
% per year
10
-6
-10
1951 1085 1960 19805 1970 1975 1980 1985
- GDP growth + Capital Growth
- 4 -
1.09 To sum up, over the last few years with substantial externalassistance the authorities have been able to stabilize the economy, and thetask is now to accelerat. growth and development. An important inter-mediate policy goal wi3. to stimulate efficient investment, in theprivate sector by providiz4 an appropriate framework of incentives, and Inthe public sector by improving project analysis, implementation andfinancing. The success of both sectors will depend on improved publicfinances. This will also help to reduce El Salvador's aid dependency,strengthen the balance of payments, and lay the groundwork for pricestability and reform of the financial sector. Major policy actions aretherefore needed to modify the external trade regime, where both thestructure of protection and the alignment of the exchange rate currentlydistort incentives and impede export growth and diversification. Theeffects of these distortions are particularly strong in the principalproductive sectors, agriculture and manufacturing. As the economy adjuststo new relative prices it will be necessary to protect the poorest segmentsof the population. Experience in other countries strongly suggests thatthe most effective way to do this will be to target government spending onthe social sectors in programs designed to reach these groups.
B. Public Finances
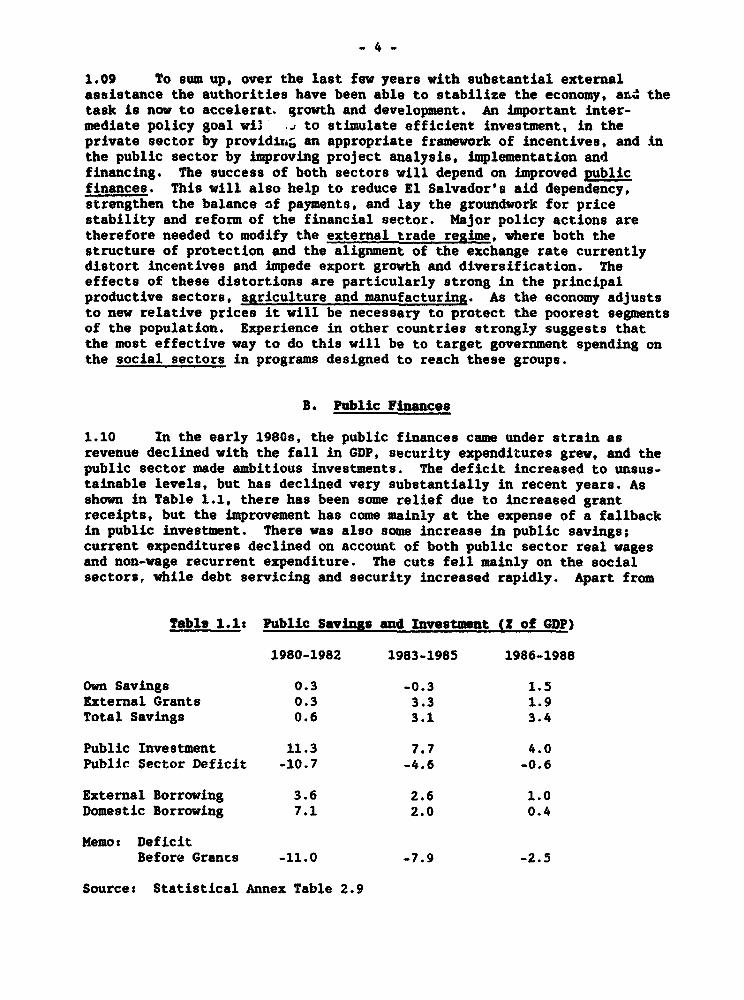
1.10 In the early 1980s, the public finances came under strain asrevenue declined with the fall in GDP, security expenditures grew, and thepublic sector made ambitious investments. The deficit increased to unsus-tainable levels, but has declined very substantially in recent years. Asshown in Table 1.1, there has been some relief due to increased grantreceipts, but the improvement has come mainly at the expense of a fallbackin public investment. There was also some increase in public savings;current expenditures declined on account of both public sector real wagesand non-wage recurrent expenditure. The cuts fell mainly on the socialsectors, while debt servicing and security increased rapidly. Apart from
Table 1.1: Public Savings and Investment (I of GDP)
1980-1982 1983-1985 1986-1988
Own Savings 0.3 -0.3 1.5External Grants 0.3 3.3 1.9Total Savings 0.6 3.1 3.4
Public Investment 11.3 7.7 4.0Public Sector Deficit -10.7 -4.6 -0.6
External Borrowing 3.6 2.6 1.0Domestic Borrowing 7.1 2.0 0.4
Memo: DeficitBefore Grants -11.0 -7.9 -2.5
Source: Statistical Annex Table 2.9
-5-
fluctuations due to coffee export tax revenues, the tax effort contributednothing to closing the fiscal deficit, and revenues remain at a low level.The adjustment was thus typical of the pattern found in many countriesundergoing financial crises, whereby the development component of publicexpenditure is sacrificed to meet the urgent need to control the deficit.
1.11 There are several difficulties with these public finance figures.Firstly, expenditures are increasingly made outside the budget and aresupported by borrowing and grants not shown here. This may causeinconsistencies between the major macroeconomic accounts, for instancebetween the balance of payments and the public finances. Secondly thenationalized banking system has incurred large unacknowledged losses whichare contingent liabilities of the public sector. Similar considerationsapply to the public sector's lending to agriculture. The public sectoritself has received sizeable subsidies from the banking system by borrowingat low controlled interest rates. Finally the public sector hasaccumulated a large floating debt, partly in the form of overdue interestpayments. These factors make it difficult to estimate the true financingneeds of the public sector. The actual deficit is probably much largerthan is shown here, and the actions required to make the fiscal positionsustainable are correspondingly stronger.
1.12 The monetary statistics broadly reflect the fiscal picture; up to1983 Lending to the public sector was responsible for the whole of thegrowth in the money stock (M2), while foreign exchange movements were a netsource of monetary contraction. Since 1983 reserve accumulation (mainly inthe form of reduced BCR short term obligations) has caused about 40X of thegrowth in M2, while the contribution of lending to the public sector hasbeen small. Both these changes are attributable to the increased inflow ofofficial transfers from 1983 onwards, and are in sharp contrast to mostcountries' experience during economic crises. Taking the period since 1979as a whole, lending to the private sector has accounted for half of theincrease in the money supply, followed by lending to the public sector(30?) and the accumulation of reserves (20?). However this improvement hasnot been reflected in reduced inflation.
1.13 El Salvador traditionally enjoyed low inflation, with the fixedexchange rate providing an anchor for the price level, but since 1975consumer prices have consistently risen faster than abroad. Theacceleration of inflation up to 1985 can be explained partly by monetaryexpansion and partly by cost pressures. From 1981 to 1985 the money stockrose more rapidly than nominal GDP, and by 1985 the velocity of circulationwas over 20? below its 1977-80 average. Cost pressures also contributed asreal wages rose (despite falling real GDP) reflecting considerable tradeunion power.
1.14 The average inflation rate of 25? since 1985 is harder to explain.There was a reduction in real money holdings, partly because real interestrates had become heavily negative, and by 1988 the velocity was almost backto its pre-1980 level. There were one-time price adjustments in responseto the major devaluation of the Colon in early 1986 but these had workedthrough the system by the end of 1987, and real wages were falling,reducing the importance of cost-push factors. However inflation hascontinued at above 20? through 1988. Two possible explanations for this

- 6 -
are the substitution of US dollars for domestic currency, adding to theeffective money stock, and supply shortages in the agricultural sector (oneof the most rigid and regulated in the economy), particularly in 1988. Toreduce currency substitution will require measures to attract remittanceinflows through the banking system. Policies to improve agriculturalsupply are considered in Chapter IV.
1.15 Improvements in the public finances are thus necessary for manyreasons. Investment, maintenance and recurrent social expenditures have tobe increased, to lay the foundations for growth without resorting toinflationary domestic financing. Public sector wages need to beselectively increased, as a means of improving efficiency. The publicsector must put itself in a position to cover its outlays without relyingon major transfers from abroad, in order to make El Salvador less dependanton aid. Provision must be made to meet the accumulated losses of thefinancial system, in order to put it in a position to finance moreproductive investment. And most importantly of all, the public sectorneeds the flexibility to increase public savings in support ofstabilization and adjustment objectives.
1.16 As a consequence of its fiscal cutbacks and access to grantfinancing, El Salvador does not have a particularly high public sectorexternal debt. At the end of 1987, the debt - at US$1667 Mn - was under352 of GDP, while interest amounted to 8? and total debt service paymentsto under 202 of exporta. Over 95Z of the debt is owed by the publicsector, and private creditors have been steadi':. repaying their foreignborrowings for several years. Almost all of the public sector's debt (952in 1987) is owed to official creditors, particularly USAID, and most of itis on concessional terms. As a reatlt, the average interest rate on theexternal debt was only 4.6? in 1987. Nonethelese net transfers (newlending less amortization and interest) to the public sector, after beinghighly positive in the early 1980s, have now dwindled almost toinsignificance, averaging US$12 Mn in 1986 and 1987.
C. The External Trade Resime and the Current Account
1.17 Because of its heavy dependance on a few export commodities, withunstable international prices, El Salvador suffers from extreme volatilityin its terms of trade.1 With the peak in world coffee prices, El Salvador'sterms of trade reached very favorable levels in 1976-79, about 50? abovetheir long run average. They then collapsed to levels below the long runaverage and (after a respite in 1986) are now as poor as at any time in thelast 30 years. The dependence on coffee also makes the cycle in coffeeproduction extremely important for the economy. Output boomed in the early19808 on the basis of investments made a few years before when coffeeprices were high. More recently investment has been low, and production isstarting to decline. Crop losses due to bad weather in 1988-89 areexacerbating this trend, and growth is suffering correspondingly.
I/ Revenues from coffee have increased in recent years to over 602 ofexport earnings, their highest level since the early 1960s.
- 7 -
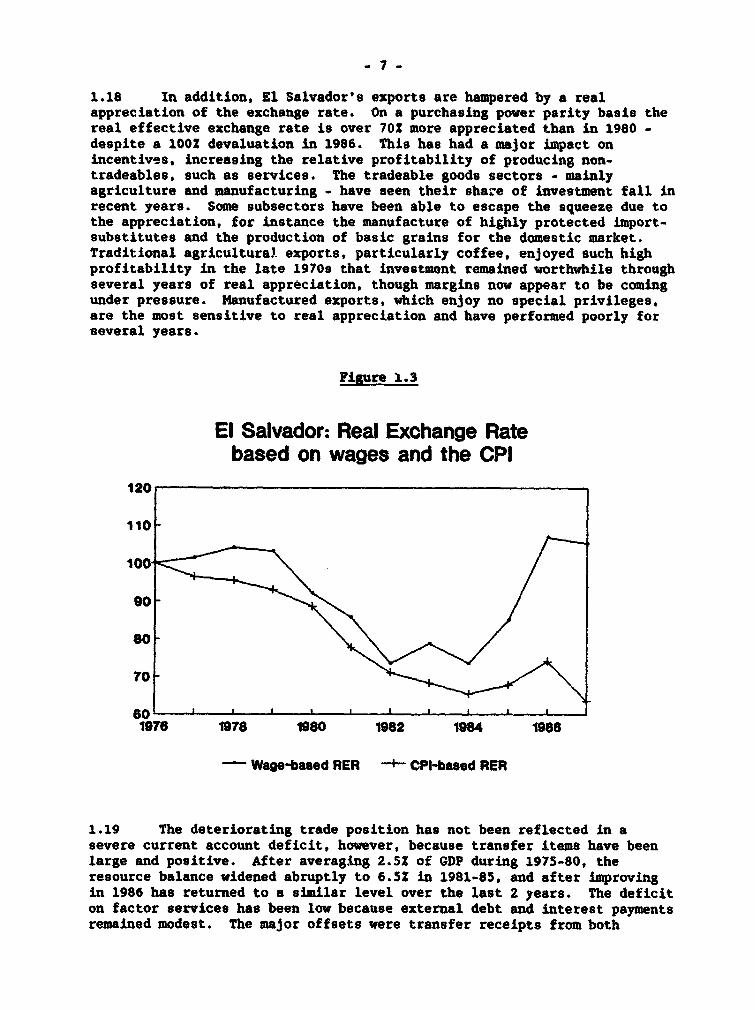
1.18 In addition, E1 Salvador's exports are hampered by a realappreciation of the exchange rate. On a purchasing power parity basis thereal effective exchange rate is over 702 more appreciated than in 1980 -despite a 1002 devaluation in 1986. This has had a major impact onincentives, increasing the relative profitability of producing non-tradeables, such as services. The tradeable goods sectors - mainlyagriculture and manufacturing - have seen their share of investment fall inrecent years. Some subsectors have been able to escape the squeeze due tothe appreciation, for instance the manufacture of highly protected import-substitutes and the production of basic grains for the domestic market.Traditional agricultural exports, particularly coffee, enjoyed such highprofitability in the late 1970s that investment remained worthwhile throughseveral years of real appreciation, though margins now appear to be comingunder pressure. Manufactured exports, which enjoy no special privileges,are the most sensitive to real appreciation and have performed poorly forseveral years.
Figure 1.3
El Salvador: Real Exchange Ratebased on wages and the CPI
120
610 ,
1976 1078 1980 1982 1984 1988
Wage-based RER +- CPI-based RER
1.19 The deteriorating trade position has not been reflected in asevere current account deficit, however, because transfer items have beenlarge and positive. After averaging 2.52 of GDP during 1975-80, theresource balance widened abruptly to 6.52 in 1981-85, and after improvingin 1986 has returned to a similar level over the last 2 years. The deficiton factor services has been low because external debt and interest paymentsremained modest. The major offsets were transfer receipts from both

official and private sources; during 1984-88 official grants averaged 5.22if GDP and private transfers 3.6? according to official figures. Eventhese figures may be underestimates; only a very small proportion ofprivate transfers come in through the official banking system, and the bt"lkis estimated rather than recorded. The actual amounts involved may be zFuchlarger, perhaps as much as 11? of GDP by 1987 2 These non-debt-creatingflows have supported levels of economic activity that would otherwise havebeen unsustainable, with obvious short-run benefits in terms of per capitaincomes and welfare. For instance, on official figures, they now financeover 5O0 of merchandise imports.
1.20 By increasing the trade deficit that is compatible with asustainable current account position, transfer inflows have contributed tothe real appreciation of the colon. The problem is similar to that whichfaced Mexico after the 1979 rise in oil prices greatly increased foreignexchange earnings. High coffee earnings in 1976-77, and later transferreceipts combined with restrictive imports policies allowed El Salvador toaccumulate foreign exchange reserves, increasing the money stock, the pricelevel and the real value of the currency. This was an equilibrium for theeconomy, and after the 1986 devaluation there was little premium in theparallel foreign exchange markets until early 1989. Tight money helpedkeep the premium to a low level, while trade taxes and restrictions reducedthe demand for imports. In this situation a devaluation of the officialexchange rate, together with control of domestic credit, would increasereserves, leading to monetary expansion and an increase in the domesticprice level rather than achieving a lasting real depreciation.
1.21 The present system of trade taxes results in a distorted patternof incentives which also discriminates against exports and increases thecost of economic growth. As in the other CACM countries, average tariffrates are not high but there is a wide dispersion of tariff and selectivetax rates giving many import-substituting industries heavy protection.Formal import quotas are not common outside agriculture, but the system ofexchange controls gi gs the authorities the power to selectively restrictthe quantity of imports. The incentive effects of this type of system arewell known from experience in other countries: it is biased againstexports and towards import substitution, particularly for consumer goods.Specific proposals for reform are described in Chapter III.
1.22 Poor trade performance has led to substantial real importcompression. Overall exports have fallen from US$950 million in 1977-81 toonly US$680 Mn in 1984-88 due to declines both in volumes and prices,crucially that of coffee. The value of imports also fell up to 1983 butthen recovered so that by 1984-88 they were almost as high (US$980 Mn) asthey had been in 1977-81 (US$990 Mn). Import volumes however have falleneven more than exports, and at constant prices imports of goods and non-factor services fell from 33? of GDP in 1977-79 to only 23Z In 1985-87.
21 See Annex 2. This discreprncy throws in question the credibility oft'e rest of the balance of payments account. If there are additionalcu_rent account transfer inflows, they must be matched by unrecordedoutflows, either for imports or capital flows.
-9-
This import compression is potentially a serious issue for thesustainability of growth, since it indicates a substantial demand forforeign exchange that is not being met through official channels. Howeverthere is reason to believe that some imports excluded from the officialbalance of payments figures are being financed by unofficial transfers.
1.23 Overvaluation improves welfare in the short term because it makesimports cheaper in domestic currency, but is dangerous because of itsnegative incentive effects on tradeables production - particularly exports.Just as they did in Holland with the advent of large-scale natural gasexports, or in Mexico after the 1979 oil price rise, agriculture andmanufacturing in El Salvador are progressively losing their capacity togenerate foreign exchange, the so-called 'Dutch disease' effect. And as inthe Mexican case, there is a danger that the exceptional levels of foreignexchange inflows responsible for the appreciation will disappear. Officialtransfers are likely to fall in the medium term, since they are linked toEl Salvador's exceptional security problems and earthquake damage. Theprospect for private transfers is much more difficult to gauge, since theinformation on them is so poor. The analysis in Annex 2, based on recentsurveys and projections of migration, suggests that the period of rapidly-growing remittances is over. Thus the foreign exchange needed for economicgrowth will have to come from the production of tradeable goo-'
1.24 The management of this Dutch Disease phenomenon is a majormacroeconomic policy issue for El Salvador. At first sight it might appearthat exceptional foreign exchange inflows provide an opportunity to expandaggregate demand through public investment or social spending withoutmeeting a binding foreign exchange constraint. However, this wouldincrease the demand for non-tradeable goods, increasing inflation and theovervaluation of the currency. It is not enough simply to devalue theColon either, since that would lead to a rise in the domestic price levelthat would cancel out the devaluation. Rather trade policy must bechanged, to alter the underlying conditions in the foreign exchange market.
1.25 As real wages have declined in recent years, El Salvador's costcompetitiveness has been restored to the level of the late 1970s. In thissense the 1986 devaluation was successful, and for this reason non-traditional exports began to increase for the first time in a decade in1988. While the fall in real vages has eased the pressure on the absolutelevel of manufactured export profitability and competitiveness, theexchange rate continues to weaken trade performance tairough the bias infavor of non-tradeables. It may therefore be possible to bring thecurrency back to its historic purchasing power parity without a further cutin real wages, using trade liberalization to increase competition and cutmargins.
1.26 The most effective way to achieve a real depreciation would be toliberalize imports from some of their restrictions. The fact that the realappreciation, fueled by transfer inflows, has been accompanied by importcompression, strongly suggests that import restrictions have been a majorinfluence on the exchange rate. The analysis in Chapter III, for inetance,suggests that trade taxes account for an overvaluation of 10-122. Relaxing

- 10 -
trade restrictions would cause an excess demand in the foreign exchangemarkets, which would have to be brought back into balance by a devaluationof the official exchange rate. Rather than making the country worse off(the effect of a devaluation in response to an unsustainable currentaccount deficit) this process would spread the benefits of foreign exchangeinflows to a wider group than before - critically including exporters.
D. Investment Performance and Prospects
1.27 After falling from 19X to 12Z of GDP in the early years of thecrisis in response to severe uncertainty, investment spending has been afairly constant share of GDP. There has however been a marked shift awayfrom public and towards private investment; from 1980-83 to 1984-87, publicinvestment contracted from 6.32 to 3.6Z of GDP, while private fixedinvestment grew from 5.72 to 8.62. This level of private investment isconsistent with an economic growth rate of 1-22 p.a. Each sustained 12increase in the share of private investment in GDP seems to entail about a12 increase in the growth rate, so for a target growth rate of 42, privateinvestment of about 122 of GDP would be required, a rate not seen since thelate 1970s. Public investment continued to decline into 1987 and 1988,despite large commitments of external funds for earthquake reconstruction,and is now well below the level necessary for growth. Public investmentwould have to increase together with renewed growth, both to complementprivate investment and to rebuild deteriorated infrastructure.
1.28 Besides increasing, the composition of private investment needs tochange if long-term growth is to be sustained. For instance, there was amarked rise in the share of residential construction in private investmentfrom 1978 to 1982, which has not yet been reversed. More ceriously, theshare of the tradeables sectors (agriculture and manufacturing) in totalinvestment has continued to decline (from 382 in 1975-78 to 282 in 1980-83and 262 in 1984-87), reflecting the falling competitiveness of thesesectors due to the exchange rate.
1.29 Public policy should aim at increasing the levels of both privateand public investment, and ensuring that their composition is appropriatelytailored for the needs of the economy. To do so successfully will involveaddTessing the current constraints on investment, particularly thoserelating to investor confidence, the availability of investment financing,and the structure of taxation.
1.30 Many of the constraints on private willingness to invest havediminished in recent years. At the height of the crisis there was extremeuncertainty about the physical safety of plant and personnel, an indicatorwhich is the fact that insurance cover for industrial investments wassuspended for several years. Since physical risk is intractable toeconomic policy measures it represents a fundamental constraint, and hashad a particularly severe effect on direct foreign investment, which hasall but dried up. It is extremely difficult to quantify such risks, andfor policymakers to persuade investors to revise their assessment in theshort term. With USAID assistance, insurance cover has now been restoredand premiums on plant (about 5/000) are small, compared with the implicitrisk premiums that investors have appl.ed to El Salvador. However full

- 11 -
investor confidence will not retutn without a settlement of the country'spolitical problems.
1.31 There is increased confidence in the degree of government supportfor private business. Confidence was undermined by lack of officialsupport in labor disputes, and the nationalization of agricultural andservice sector enterprises in 1979-80. The business community acknowledgesthat the government's attitude to labor relations problems has sincechanged in their favor, and the election in 1989 of a government withsubstantial business support has further relieved this uncertainty.
1.32 Excess capacity and confidence in the prospects for sustainedgrowth are important for investment. There was excess capacity to servedomestic and CACM markets due to the fall in demand in 1978-82. As notedabove, capital and output have since been moving towards their historicrelation, and the margin of excess capacity is much reduced. Surveyevidence suggests that industrial capacity utilization Is currently around70X, and that industry is once again investing in plant expansions aimed atthe domestic market. The most important remaining constraint on privatewillingness to invest may therefore be the expectation that growth willremain slow, in part because the authorities have been unwill ag toimplement aggressive expenditure-switching policies, such as devaluation,or fiscal policies consistent with sustainable growth. Credible policiesin these areas would increase private willingness to invest.
1.33 To finance an increase in private investment, it will be necessaryto mobilize increased savings. In the aggregate, private investment isfinanced by the sum of private savings, the public sector surplus ordeficit, and the resource gap, so a package of measures is needed whichwill move all three together. Experience from many countries suggests thatit is difficult to increase private savings in the context of depressedreal incomes, but tnat it is important to end the downward pressure onsavings due to heavily negative real deposit rates - if only to protect thedeposit base of the financial system. A more positive response of privatesavings can be expected later in the adjustment process, when per capitaincomes begin to rise. In El Salvador, a cut in the public sector deficitshould probably be achieved by increasing taxation rather than by furthercutting expenditure. It will be of crucial importance to avoid an increasein the burden of security related spending on domestic fiscal resources, ifthe economy is to be adjusted succe,sfully. An increase in the resourcegap (the excess of imports over exports) can be brought about by relaxingrestrictions on imports. This is also the prerequisite both for a realdevaluation and for improving the structure of incentives, and is thusfundamental to the policy recommendations of the report.
1.34 Investment is also affected by incentive distortions due to thestructure of trade and turnover taxes. Effective protection rates varywidely, leading to similar variations in the efficiency of resource use.Similarly El Salvador's fiscal system has relied increasingly in the 1980son a sales tax (stamp duty) which like the tariff structure discourages theproduction of lntermediate goods because it falls differentially hard ongoods which pass through several stages of processing within the country.Both of these taxes tend to diminish linkages among in the productivesectors. Moving to a more uniform external tariff as advocated in ChapterII1, and changing to a broad-based VAT system (see Chapter II) would helpto eliminate these biases.
- 12 -
1.35 The efficiency of investment has been low in recent years. TheICOR on private fixed investment increased from 1.7 (1960 - 1975) to 5.5(1982 - 1987), largely reflecting the existence of unused capacity and theslow return of the economy to a stable growth path. The underlyingefficiency of investment also deteriorated. Allowing for growth rateeffects, the capital cost of each unit of output growth during 1984-87 wasabout 70Z above that berore 1979. Improved price incentives, particularlyin the allocation of capital, are crucial to lowering the investment costof growth in the future.
1.36 The current policy of stimulating investment by keeping creditcheap and allocating it preferentially to agriculture and manufacturing isboth distorting and ineffective. Interest rates are under detailed BCRcontrol, by category of investment and loan. Bank credit is available tothe productive sectors at interest rates which are negative in real terms,and is rationed by administrative allocations. This worsens the allocationof investment resources by making inefficient projects appear viable, andleads to excessive self-financing. It also incurs deadweight costs bysubsidizing investment that would have occurred in any event. While thishas had a positive effect on credit to the favored sectors (particularlymanufacturing, see Chapter V) it is difficult to identify any effect oninvestment or growth. Non-bank credit markets, such as inter-firm lending,seem to be thin or nonexistent and many firms are financing investment outof retained earnings, a pattern which tends to constrain overall economicgrowth. In addition the artificially low cost of capital to those able toget credit tends to encourage more capital-intensive techniques ofproduction than the real scarcity of funds woul4 justify, reducing thedemand for labor.
1.37 In an undistorted economy, competitively determined interest rateswould be the best way to improve credit allocation as well as mobilize moresavings. They force financial institutions to support only the projectswith the highest returns, and make bank deposits more attractive to savers.Several obstacles need to be removed for El Salvador to adopt competitive,and presumably much higher rates. Firstly, the exchange rate must be setat a more competitive level so that agriculture and manufacturing are notpenalized. Secondly, there must be a reduction of the proportion of bankresources used to refinance non-performing loans to enterprises Wbhcheffectively effectively went bankrupt in 1979-82, but have not been forcedto cease operation or reorganize. The banks must r-;ire such non-performing loans, or an excessive share of new resources will be usedunproductively. k'inally, full interest rate liberalization would also callfor prior institutional changes to strengthen banking supervision, lendingprocedures and provision for future loan losses.
1.38 Recently the government has taken some measures to improveinvestment incentives, particularly by easing the climate for directforeign investment. However, foreign investment has been on a very smallscale since 1978. In manufacturing it has not exceeded 1OS of total fixedcapital formation since 1979, and since 1984 has averaged only 22, almostall in the form of reinvested profits. El Salvador is likely to facedifficulty for some time in attracting foreign investment, so it isimportant to concentrate mainly on giving incentives for efficientinvestment by local firms (which may be partly financed by capital

- 13 -
repatriation). Finally, the poor condition of public infrastructure as aresult of war damage and low levels of expenditure may already be anobstacle to private investment and growth; an in-depth investigation ofpublic investment is required to substantiate and quantify this.
E. Employment and Wages
1.39 The development of the labor market over the last 10 yearsreflects the emigration of 350,000 workers, internal migration involving afurther 200,000, the fall in economic activity, changes in real wages, andchanges in the structure of both employment and labor force participation.Four sub-periods can be distinguished: in 1979-80, the demand for laborfell rapidly as economic activity declined and real wages rose. Inresponse, there were sharp increases in both the open unemployment rate(from 42 to 9.3S in one year) and emigration (from 40,000 to 80,000 ayear). In 1981-82, real wages remained high and the economy continued todeteriorate, but there was continuing massive emigration (about 5? of thepopulation left in 3 years) and labor force participation fell as peopleturned to self-employment in the informal sector, so there was no furtherincrease in open unemployment. From 1982-84 the economy began to recoverand real wages began to fall, both of which stimulated some increase inlabor demand, and - though unemployment remained high - emigration slowedsomewhat. Finally since 1985 the real wage has fallen rapidly andemigration and unemployment have both declined. Open unemployment fellfrom 102 in 1985 to 72 by 1988.
1.40 A remarkable feature has been the dynamism of the informal sector.Its size is hard to estimate directly; in 1985 for instance some 222 of thelabor force was formally unemployed but not actively seeking work, andpresumably had alternative sources of income. In the SSNA in 1986, men inthe informal sector had an average labor income 132 higher than in theformal sector, so informal sector incomes seem to have held up better thanthose in the formal sector. Though informal incomes were lower in eachoccupational category the composition of informal employment was weightedmore heavily towards self employment, which paid better than wageemployment in the formal sector. For women however informal-sector incomeswere 412 below those in the formal sector. These figures suggest a fairlytight labor market for males, but that female labor force participation -which increased rapidly to substitute for the incomes of absent males -kept the overall labor market slack.
1.41 Real formal sector wages rose in the late 1970s to a peak in 1980,but have fallen steeply since 1984 and by 1987 the average was down by 332from its 1984 level, and by 422 from its peak. Nominal minimum wages werenot raised between 1980 and 1984 despite a 622 increase the cost of living,and from 1984 to 1988, they have been raised only 382 while the price levelhas gone up 1512. This has resulted in a fall in real minimum wages ofmore than 562 since 1978, with an important impact on agricultural laborcosts. The fall the real cost of labor to employers helps explain whyemployment in formal urban sectors has fallen less than output through theperiod as a whole. Recently, there has been a small increase in the formaldemand for labor, most of it from service sectors. Between 1980 and 1987the proportion of employees in agriculture and manufacturing fell from 442
- 14 -
to 41?, s0 employment in the private tradeables sectors has fallen inrelation to that in non-tradeables.
1.42 As a result of the switch from formal to informal employment, themigration of displaced rural people to urban areas and the fall in realwages, income distribution worsened significantly. From 1977 to 1985, theshare of urban households' earned income going to the bottom of 20S offamilies fell from 6? to 3Z¶ and that to the bottom 302 went down from 172to 14?. Meanwhile the share of the top 202 went up from 48? to 54?.Reflecting this, the Gini coefficient of the distribution increased from34.72 in 1977 to 41.32 in 1985. Remittances are thought to have increasedincomes of working families by up to 202, alleviating in part the fall inearned income. Household survey data suggest that there is substantial andincreasing employment at sub-minimum wages.
1.43 Underemployment and the low level of real wages are major sourcesof social problems in El Salvador cud deserve greater attention in relationto open unemployment. It appears that labor market distortions have notbeen a major constraint on economic growth: there is still a labor surplusat current levels of output, and outmigration is continuing, while wageshave shown considerable downward flexibility in real terms. The majoreffect of minimum wage legislation appears to have been to help fix theboundary of the informal sector, thus increasing the segmentation of thelabor market, rather than to protect the incomes of the poor. It is by nomeans obvious that the fall in real wages - which has presumably increasedthe already very high share of profits in GDP - has thereby raised domesticsavings. A soundly-based rise in real wages and personal savings will becrucial for sustaining medium-ternm growth.
F. Sumury of Policy Isues
1.44 El Salvador needs to make active use of macroeconomic policyinstruments, particularly fiscal, monetary and exchange rate policy, totackle its adjustment problems. In order to increase the country'sindependence from the vagaries of foreign assistance and improve publicsavings in the medium to long term, several fiscal reforms are urgentlyneeded. In particular, the public sector needs to be able to raise morerevenue in a less distortionary manner. The most important changes will bein taxation, and in the pricing of public sector enterprise output, asdescribed in Chapter II. The public sector should also improve salariesfor key personnel, and increase the funding for operations, maintenance andinvestment, to increase the economic contribution and efficiency of thepublic sector.
1.45 In the external sector, El Salvador should lower its barriers toimports and use devaluation to improve competitiveness and make theproduction of tradeables more attractive. This would have benefits interms of productivity and economic growth. Devaluation will have to besupported with appropriate fiscal and monetary policies to allow inflationto be kept under control. There would be substantial efficiency btzefitsfrom simplifying tariffs to make incentives more uniform among industriesand sectors. Specific recommendations on how to design and implement suchpolicies are the subject of Chapter III.

- 15 -
1.46 To maximise the growth benefits of these incentive changes in theeconomy, it will be necessary gradually to reorientate monetary and creditpolicy away from quantitative controls towards active use of interestrates. The short run policy goal should be to reduce the dispersion ofborrowing rates and the subsidies given to preferred borrowers, with theaim of improving the efficiency of investment. Steps should also be takento enable the banks to strengthen their loan loss reserves, and to retirelost loans from the portfolio. Government fiscal resources will be neededto meet some of these portfolio losses if the banking sector is to assistthe performance of other sectors of the economy. Such measures shouldaccompany or precede a major shakeup of economy-wide incentives.
1.47 An adjustment process of this kind, opening the economy up to theplay of market forces, has short run costs that may fall disproportionatelyhard on the poorest sections of the population - who in El Salvador arealready in a very precarious position. The best way to protect theirposition would be to expand the public sector's social programs. Thiscannot be done across the board, because of the very large fiscal coststhat would be involved, and it is crucial to improve the targeting ofsocial spending. This would involve emphasizing primary health care andnutrition programs over curative medicine, concentrating family planningservices in the rural areas, expanding primary education in the ruralareas, and opening the housing market to greater informal-sectorinitiatives. In all cases, subsidies should be withdrawn from middle- andupper-income users, who would rely increasingly on the private sector.
1.48 Recommending policies is a very different matter from implementingthem. Taken together the above measures would represent a major shift ineconomic policy, and the experience of the World Bank suggests that suchradical adjustments can successfully be implemented only if there isconsensus among the key actors in the economy. Since many of the policyactions aimed at overall economic benefits also involve private costs, theywould be opposed by vested interests - for instance the industriesthreatened by the reduction of protective barriers might opposeliberalization. Some beneficiaries, such as new business entrants, theworkers they would employ, and small savers cannot be identified inadvance, and have little economic power. Other beneficiaries may supportonly the part of the program which directly benefits them - for instanceexport producers will probably support devaluation, but may not back thetrade liberalization needed to make the devaluation work. Thus it is vitalthat the government be prepared to defend the changes as a package, or thepolitical process could easily render them ineffective.
1.49 A key pre:equisite to many policy changes will be to improve thepay and conditions of work of technical and managerial positions in thepublic sector, in order to attract and retain suitable entrants. Theproposed policy changes would change the role of the public sector awayfrom direct intervention towards regulation. For instance instead ofsetting interest rates and aliocating credit, the BCR would have to focuson supervising banks more tightly. Such regulatory tasks are bothunfamiliar, and inherently more difficult than current policies, since theyinvolve working "against" former colleagues, and devolving responsibilityfor day to day decisions. Other changes, such as trade liberalization,reduce the supervision functions of government, and efficiency may mean
- 16 -
reassigning personnel to other parts of the public sector or laying themoff altogether.
1.50 An aspect of public administration which would particularly repaystrengthening is the accounting of national income and expenditure. TheGDP aggregates are based in 1962 prices, and need to be updated to reducecompositional errors in growth estimates. The Balance of Payments accountsare defective, particularly in respect of private transfers. And mostseriously, the public sector financial statistics are incomplete, andcannot be reconciled with the other accounts. Better information on allthese aspects will be very important to the formulation of appropriateadjustment and growth policies.
- 17 -
II. GOVERNMZNT FINANCES
A. Overview
2.01 El Salvador's public finances reflect the adjustments during the1980s, whereby development-related spending - especially public investmentand the recurrent budgets of the social sectors - was sacrificed to theneed to meet exceptional security costs and keep the deficit under control.Recovering fiscal balance was vital for itabilization, inflation controland allowing funds to flow to the private sector, and maintaining it is akey objective. It is now important, especially for long term development,that investment and social spending be increased. Without this, it will bedifficult to achieve either the level of private investment needed forgrowth or the protection of the poor necessary for an equitable adjustmentprocess. However, it is only possible to meet both these objectives byincreasing the revenue effort - which has remained low and fairly constantthrough the decade - and by increasing the efficiency of publicexpenditure.
2.02 In addition increased revenues and efficiency are important toprotect public sector operations from undue dependency on transfers fromabroad. Taxation and adequate financing policies for public enterpriseservices are the keys to increasing the public sector revenue effort andseveral reforms are needed. The current tax system falls short of thecriteria of equity (fairness among taxpayers and relief for the poor) andefficiency (avoidance of distortions in production) by which modern taxsystems are judged, and public enterprise prices have not been adjusted tokeep up with general inflation, and have fallen below economic levels.
S. Taxation
2.03 El Salvador's tax system raised revenues averaging 12.52 of GDPfrom 1983 to 1988 (see Statistical Annex Table 2.3), the main instrumentsbeing taxes on sales, income, exports and imports. This is a very low taxeffort by regional standards. Among Central American countries, onlyGuatemala has recently had a lower share of taxes in GDP (92), while CostaRica had 24? and Honduras 13S. The average for Latin America is of theorder of 23?. Direct taxes and foreign trade taxes each made up quarter ofthe total. The public sector's reliance on export taxes - especially oncoffee exports - is one of the highest in the world,l exposing it toserious revenue fluctuations as prices change. This tends to make fiscalproblems coincide with trade deficits, complicating economic management.Moreover, the system is administratively inefficient and distorts economicincentives, discrimin ting in favor of capital and against exports. It istherefore crucial to review the key revenue sources, the gross sales,coffee and income taxes, modernize tax administration and reduce the costof fiscal incentives. Import taxation is potentially of great revenueimportance, and strongly affects incentives. It is examined in the contextof trade policy Chapter UII.
I/ World Development Report, 1988, p. 92.
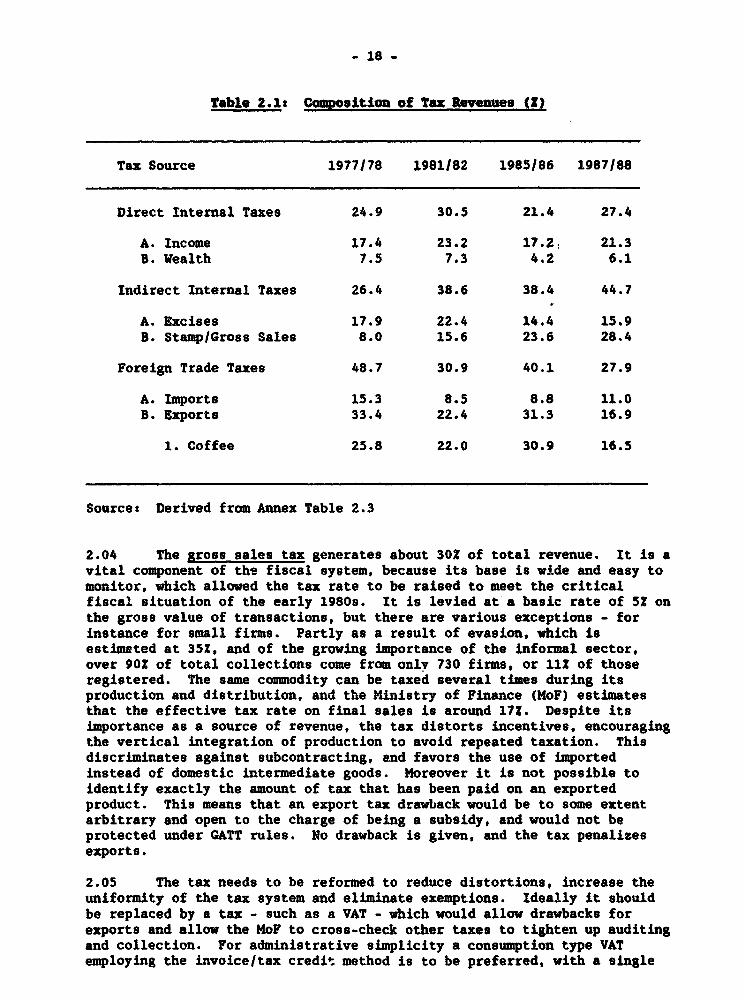
- 18 -
Table 2.1: Mposition of Tax Revenes (I)
Tax Source 1977178 1981/82 1985/86 1987/88
Direct Internal Taxes 24.9 30.5 21.4 27.4
A. Income 17.4 23.2 17.2 21.3B. Wealth 7.5 7.3 4.2 6.1
Indirect Internal Taxes 26.4 38.6 38.4 44.7
A. Excises 17.9 22.4 14.4 15.9B. Stamp/Gross Sales 8.0 15.6 23.6 28.4
Foreign Trade Taxes 48.7 30.9 40.1 27.9
A. Imports 15.3 8.5 8.8 11.0B. Exports 33.4 22.4 31.3 16.9
1. Coffee 25.8 22.0 30.9 16.5
Source: Derived from Annex Table 2.3
2.04 The gross sales tax generates about 302 of total revenue. It is avital component of the fiscal system, because its base is wide and easy tomonitor, which allowed the tax rate to be raised to meet the criticalfiscal situation of the early 1980s. It is levied at a basic rate of 52 onthe gross value of transactions, but there are various exceptions - forinstance for small firms. Partly as a result of evasion, which isestimated at 35Z. and of the growing importance of the informal sector,over 902 of total collections come from onlv 730 firms, or 112 of thoseregistered. The same commodity can be taxed several times during itsproduction and distribution, and the Ministry of Finance (HoF) estimatesthat the effective tax rate on final sales is around 172. Despite itsimportance as a source of revenue, the tax distorts incentives, encouragingthe vertical integration of production to avoid repeated taxation. Thisdiscriminates against subcontracting, and favors the use of importedinstead of domestic intermediate goods. Moreover it is not possible toidentify exactly the amount of tax that has been paid on an exportedproduct. This means that an export tax drawback would be to some extentarbitrary and open to the charge of being a subsidy, and would not beprotected under GATT rules. No drawback is given, and the tax penalizesexports.
2.05 The tax needs to be reformed to reduce distortions, increase theuniformity of the tax system and eliminate exemptions. Ideally it shouldbe replaced by a tax - such as a VAT - which would allow drawbacks forexports and allow the MoP to cross-check other taxes to tighten up auditingand collection. For administrative simplicity a consumption type VATemploying the invoice/tax credit method is to be preferred, with a single
- 19 -
tax rate and no exemptions. It can be argued that income distributionconsiderations require that some basic goods be exempted, but in generalprogressive effects on income distribution are more easily achieved bytargeting public expenditure on low income groups. The MoF estimates thateven incorporating all firms into the VAT network a uniform tax rate of15-162 will be required to yield the same revenue as the gross sales tax.To avoid an excessively high VAT rate exemptions should be kept to aminimum.
2.06 The economic case for a coffee export tax rests on two facts,firstly that coffee has traditionally been highly profitable at prevailingwage and exchange rates, and secondly that the ICO quota system createsmonopsony rents for producers. The tax is also fiscally vital; thoughrevenue is highly erratic, it has averaged over 20S of central governmentrevenues during the 1980s. Moreover, the tax is easier to enforce thancorporate income taxes, from which producers are exempt. Since worldprices are exogenous the tax falls entirely on producers.
2.07 It is charged at a rate of 301 on the excess of the internationalprice above S45tqq., so its average rate increases with the price. Atcurrent coffee prices, it raises the same revenue as a profits tax rate of36-38Z. However the fixed cost of coffee production is above $45, so thetax falls as a share of profits as the price rises. Since yield audefficiency differences mean that unit costs may diffe. by up to 60-70?, thetax also affects individual producers very differently. To make the taxmore progressive and equitable, it would be desirable to raise the tax-freeallowance, which has been constant since 1950. If this were to take placeat the same time as a devaluation, it would not necessarily involve a lossof public sector revenue.
2.08 The tax reduces the incentives for coffee exports, and this hasled to arguments that it be abolished - particularly as El Salvador iscurrently finding it difficult to fill its ICO quota. However the declinein exports is ultimately due to other problems, particularly insecurity andthe fact that real currency appreciation has greatly reduced theprofitability of coffee growing in the 1980s. If producers were, as analternative, to pay corporate profits tax they would be subject to a toprate of 35Z. If they were also to pay the gross sales tax, a combinedeffective profits tax rate of up to 66? would result. Switching to othermeans of taxing coffee profits would not necessarily improve exportincentives. Given the administrative problems with these taxes, it couldunder present conditions lead to a serious loss of fiscal revenues.
2.09 Since costs are not deductible, the coffee export tax givesgreater incentives for cost minimization at given output than a profits taxwould do. As sales are largely limited by ICO quotas, the export tax istherefore better for efficiency. One exception which would improve theincentive effects of this tax would be to allow the deduction of diseasecontrol expenditures, which have substantial external benefits. It isimportant that the tax rate not be manipulated to reduce profits whenprices are high, as happened in 1986.
2.10 Direct Taxation generally distorts resource allocation less, andrespects equity more than indirect taxation. El Salvador's personal and

- 20 -
corporate income taxes each raise only about 12 of GDP in revenue, and bothhave an excessive range of different rates and are unnecessarily complex.The major ways ii which the yield of direct taxation can be increased aresimplification and improved tax administration.
2.11 Tax changes in 1986 broadened the personal income tax base (forexample, by including dividends) but further reforms and simplification arestill needed. There are 25 different brackets with marginal rates from7.42 up to 602, and some 872 of collections comes from only 13,000taxpayers (272 of the total). There is no indexation and tax brackets havefallen considerably in real terms. It would simplify administration todrastically reduce the number of brackets and improve incentives to set themarginal rates in a narrower range (perhaps 102 to 502). The businessincome tax has five tax brackets, with rates ranging from 152 to 35?, whichshould be simplified to a single rate in order to promote economies ofscale both in tax administration and in production. In 1987, 177 firmspaid over three-quarters of this tax, and detailed tax audits shouldconcentrate on these large firms.
2.12 Tax Administration and Fiscal Incentives. The MoF estimates thatthe amount of tax evasion is at least 40X of the tax collected, equivalentto over twice the public sector deficit. The areas most prone to evasionare direct taxes and import duties (Chapter III). Income taxsimplification combined with the use of the central taxpayer file, cross-checking with other external data, and more external audits would certainlyincrease collections. Almost all direct tax audits are desk studies andmore, less complete, field audits should be made on a larger number oftaxpayers. The tax collection system is inefficient, with only 252 of taxcollections withheld at source. Independent professionals are not subjectto withholding or estimated tax payments. Delays in receiving some taxesare also excessive. and the sanctions for proven tax fraud are ineffective.As explained above, the substitution of a VAT for the gross sales tax wouldlend itself to cross-checking and assist in auditing if properlyimplemented.
2.13 Some progress has been made in tightening up the taxpayeridentification and tax collection system. The development of a centraltaxpayer file with all the basic data on each taxpayer under a singleidentification number ("Registro Unico de Contribuyentes") has beenunderway since late 1984. However, by February, 1988 the project hadproduced few tangible results and may be over-complex. Another project mayget underway by late 1989, to improve customs administration, budgetcontrol and execution, reduce tax evasion, and simplify the tax system.Further efforts along these lines remain an urgent priority. In 1986selective excise taxes, which generate about 172 of tax revenue, weremostly converted to an ad valorem base, as were import duties, and there isno serious problem of revenue erosion due to inflation.
2.14 Finally, El Salvador's many tax exemptions cause revenue losses,distort the allocation of resources and reduce the equity of the taxsystem. Many exemptions derive from fiscal incentives, and a studyreviewing the laws governing the personal and business income taxes, thepromotion of industrial and tourism development, and the concession ofimport tariff exemptions (franquicias aduaneras) is needed to estiuate the
- 21 -
tax losses. The 1986 export promotion law (described in Chapter III) is ofparticular concern, because it grants numerous tax exemptions. In othercountries this type of law has lent itself to tax fraud and given theinadequacies of fiscal control in E1 Salvador there is reason to fear itwill create further tax losses and resource distortions.
C. Public Expenditures
(a) Economic and Functional Classifications
2-.15 After averaging 33.42 of GDP in 1980-83, public expenditure fellsteadily to an estimated 18.82 in 1988. Current expenditure fell largelydue to the effect of declining public sector real wages, and its per capitavolume in 1986-88 was only 16Z less than in 1980-82. Public sector1inestment averaged 112 of GDP spending in 1980-83, but by 1984-88 it hadfallon to 4.42, reaching a decade low of 2.32 in 1988. This trendreflected tiv ftqueze on overall public expenditure, and illustrates thesactrUice of future growth that is being forced on El Salvador by itsfiscal prcbleas.
2.16 Despite the fall in real wage rates, the wage bill increased as ashare of public current expenditures (Annex Table 2.7) from 52.1? during1980-83 to 56.8Z during 1985-88, and the proportion oa current spending ongoods and services fell from 33.52 to 27.9?. These trends are indicativeof falling public sector efficiency in current programs. Falling realwages prevent the public sector from recruiting the skills it needs, andprograms are being progressively deprived of the materials with which towork.
2.17 The principal changes in functional classification of centralgovernment spending (Annex Table 2.8), have been increasing shares fo;national defense and public debt service and decreasing shares foreducation, health, housing and infrastructure development. In 1978-79spending on national defense and the public debt averaged 132 of totalexpenditures and by 1986-87 this had reached 412. Over the same periodspending on social programs fell from 402 to 24Z, and on infrastructuredevelopment from 19? to 92. Real per capita defense spending more thandoubled between 1978 and 1987, while real per capita social welfare outlaysfell by over 402. Again the economic contributior of public spending hasbeen greatly reduced.
(b) Wages and Employment
2.18 Total general government employment fell by 7.62 or 9,100 peoplefrom 1981 to 1988. It fell from 5.22 to 4.32 of the working age populationand from 692 to 552 (in 1987) of the total number of social securitycontributors. There was a drop in the central government, whiledecentralized institution employment remained essentially unchanged. Datahowever are not available for the public enterprises which are thought tohave increased their employment during the 1980s. Equally important arechanges in the structure and efficiency of public employment. It may wellbe that public employment should have fallen faster.
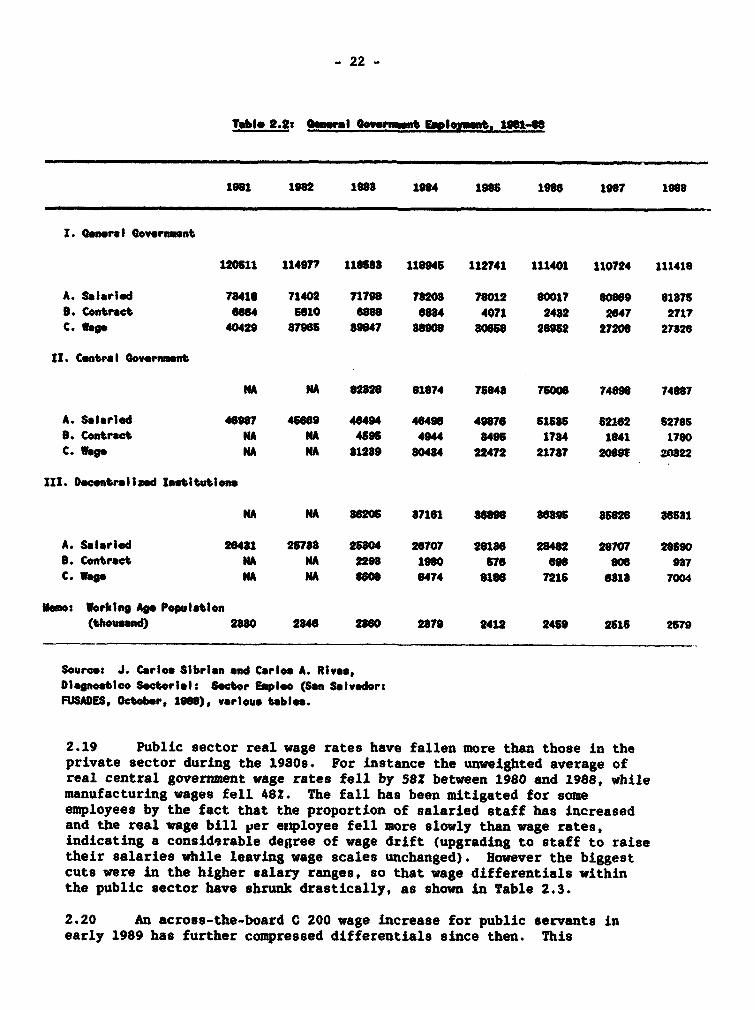
- 22 -
Tablo 2.2: Gemral eMentd bpl.vmet 11-6
1981 1982 ls88 1984 1985 1986 19S7 1988
T. Genral Government
120511 11497? 118588 119946 112741 111401 110724 111418
A. Salaried 78416 71402 71798 78208 78012 80017 80869 81876B. Contract m4 5610 6088 6884 4071 2482 2647 2717C. wage 40429 87965 89847 88908 80656 26952 27208 27826
I. Central Governmet
NA A 82828 81874 75U48 75006 74898 74887
A. Salaried 46987 45669 46494 46496 49876 S158S 521862 52785B. Contract NA NA 4595 4944 8495 1734 1041 1760C. MaA t NA 81289 80484 22472 21787 2089 2o022
III. Deentrallzd intltutlone
MA NA 86205 87161 8698 8685 s52s 83651
A. Salaried 26481 2C78 25804 26707 28186 28482 28707 285908. Contract NA A 2298 1980 576 698 806 937C. Wage NA MA 6 8474 0198 7215 68s1 7004
Mamo: Worklin Age Population(thouenld) 2880 2846 20 2879 2412 2469 2C15 2579
Source: J. Carlos Sibrion and Carlos A. Rivas,Dlagnostico Sectorl:ls Sector Empleo (San Selvador:FUUSAE, Octoer, 1988), varlou tables.
2.19 Public sector real wage rates have fallen more than those in theprivate sector during the 19809. For instance the unweighted average ofreal central government wage rates fell by 58Z between 1980 and 1988, whilemanufacturing wages fell 48X. The fall has been mitigated for someemployees by the fact that the proportion of salaried staff has increasedand the real wage bill per employee fell more slowly than wage rates,indicating a considerable degree of wage drift (upgrading to staff to raisetheir salaries while leaving wage scales unchanged). However the biggestcuts were in the higher salary ranges, so that wage differentials withinthe public sector have shrunk drastically, as shown in Table 2.3.
2.20 An across-the-board C 200 wage increase for public servants inearly 1989 has further compressed differentials since then. This

- 23 -
combination of wage ratio compression and falling real wages has adverselyaffected the ability of the public sector to retain qualified personnel.The resulting low level of public sector efficiency is already apparent forinstance in the ongoing Earthquake Reconstruction project of the IBRD.Routine decislons on design and procurement take many months longer thannecessary, due to the fragmentation of decision taking and lack ofqualitied staff. Efficiency problems will continue to undermine theprovision of public services and will hamper adjustment efforts unlessremedial action begins to be taken quickly. This may necessitate somefurther reduction in the number of public employees.
Table 2.s Publac sstowfte Katlo, Deow*er
1970 1981 1964 1906 106
x. Cnrta I Oov.rnmst
Highest Executive Salary/Service Wage 9.9 S.2 5.1 4.6 8.6Highest/Lowest Administrative Salary 2.4 1.9 2.0 1.9 1.5
Decentralized Insmttutlone
Hit Executive Salry/Service Wag 9.6 6.4 7.9 7.1 5.1Highest/Lowet Administrative Salary 8.9 8.9 8.7 8.4 2.7
Source: As Table 2.2
(c) Public Investment
2.21 Major changes are needed in the way that public investment isplanned and carried out. Spending is currently less than is needed tomaintain and replace existing assets (assuming an asset life of 20 years).In addition, there are concerns about its management and the projectselection and appraisal process. One source of problems is that investmentis financed largely from external sources - 70? of planned investment in1988 for example. This makes investment allocation less flexible,particularly since domestic fiscal resources are scarce. An indicator ofmanagement problems is that poor programming of funds and materialsresulted in siAstantial under-achievement of public investment targets in1988. The ability of the public sector to manage investment projects islimited partly because of the lack of appropriately qualified personnel.Another problem, resulting from the war, is that much of public investmenthas to be directed toward short-term repair and rehabilitation projectsthat do not add to the capital stock.
2.22 Until very recently there was little project evaluation ormonitoring. Since early 1988 the Directorate of Projects (DIGEPROY) inMIPLAN has been working (with UNDP) to create a data bank for monitoringinvestment projects and to train public sector personnel in the application
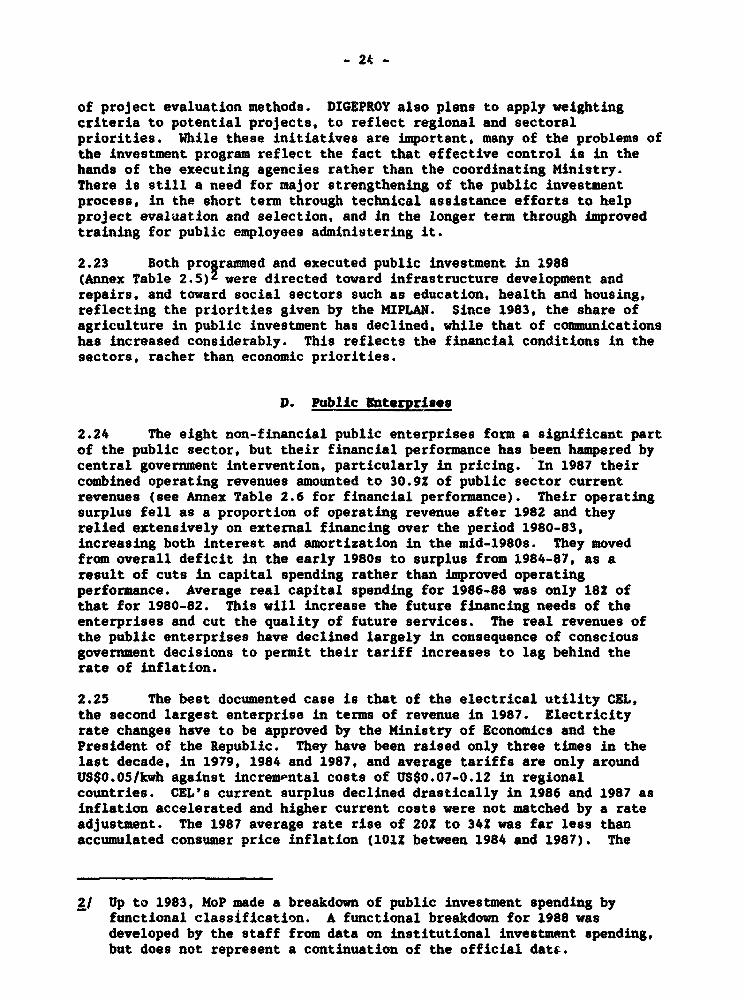
- 24 -
of project evaluation methods. DIGEPROY also plans to apply weightingcriteria to potential projects, to reflect regional and sectoralpriorities. While these initiatives are important, many of the problems ofthe investment program reflect the fact that effective control is in thehands of the executing agencies rather than the coordinating Ministry.There is still a need for major strengthening of the public investmentprocess, in the short term through technical assistance efforts to helpproject evaluation and selection, and in the longer term through improvedtraining for public employees administering it.
2.23 Both prorammed and executed public investment in 1988(Annex Table 2.5)z were directed toward infrastructure development andrepairs, and toward social sectors such as education, health and housing,reflecting the priorities given by the MIPLAN. Since 1983, the share ofagriculture in public investment has declined, while that of communicationshas increased considerably. This reflects the financial conditions in thesectors, racher than economic priorities.
D. Public Enterprises
2.24 The eight non-financial public enterprises form a significant partof the public sector, but their financial performance has been hampered bycentral government intervention, particularly in pricing. In 1987 theircombined operating revenues amounted to 30.9X of public sector currentrevenues (see Annex Table 2.6 for financial performance). Their operatingsurplus fell as a proportion of operating revenue after 1982 and theyrelied extensively on external financing over the period 1980-83,increasing both interest and amortization in the mid-1980s. They movedfrom overall deficit in the early 1980s to surplus from 1984-87, as aresult of cuts in capital spending rather than improved operatingperformance. Average real capital spending for 1986-88 was only 182 ofthat for 1980-82. This will increase the future financing needs of theenterprises and cut the quality of future services. The real revenues ofthe public enterprises have declined largely in consequence of consciousgovernment decisions to permit their tariff increases to lag behind therate of inflation.
2.25 The best documented case is that of the electrical utility CEL,the second largest enterprise in terms of revenue in 1987. Electricityrate changes have to be approved by the Ministry of Economics and thePresident of the Republic. They have been raised only three times in thelast decade, in 1979, 1984 and 1987, and average tariffs are only aroundUS$0.O5/kwh against incremental costs of US$0.07-0.12 in regionalcountries. CEL's current surplus declined drastically in 1986 and 1987 asinflation accelerated and higher current costs were not matched by a rateadjustment. The 1987 average rate rise of 202 to 34? was far less thanaccumulated consumer price inflation (1012 between 1984 and 1987). The
21 Up to 1983, MoP made a breakdown of public investment spending byfunctional classification. A functional breakdown for 1988 wasdeveloped by the staff from data on institutional investment spending,but does not represent a continuation of the official datu.
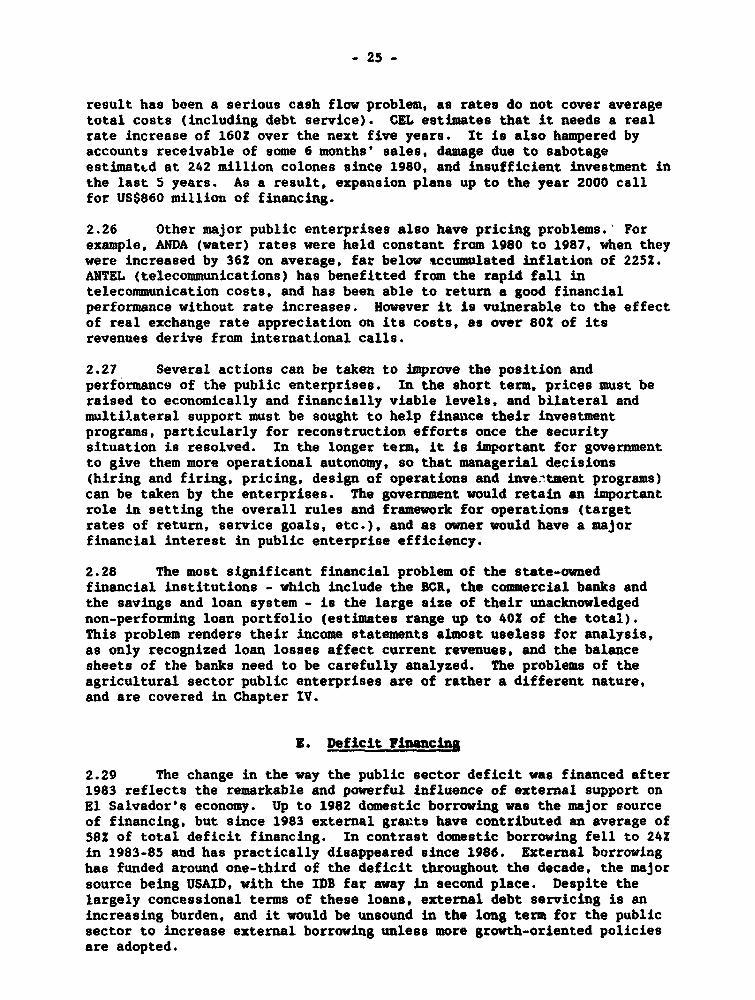
- 25 -
result has been a serious cash flow problem, as rates do not cover averagetotal costs (including debt service). CEL estimates that it needs a realrate increase of 1602 over the next five years. It is also hampered byaccounts receivable of some 6 months' sales, damage due to sabotageestimattd at 242 million colones since 1980, and insufficient investment inthe last 5 years. As a result, expatsion plans up to the year 2000 callfor US$860 million of financing.
2.26 Other major public enterprises also have pricing problems.' Forexample, ANDA (water) rates were held constant from 1980 to 1987, when theywere increased by 362 on average, far below accumulated inflation of 2252.ANTEL (telecommunications) has benefitted from the rapid fall intelecommunication costs, and has been able to return a good financialperformance without rate increases. However it is vulnerable to the effectof real exchange rate appreciation on its costs, as over 802 of itsrevenues derive from international calls.
2.27 Several actions can be taken to improve the position andperformance of the public enterprises. In the short term, prices must beraised to economically and financially viable levels. and bilateral andmultilateral support must be sought to help finance their investmentprograms, particularly for reconstruction efforts once the securitysituation is resolved. In the longer term, it is important for governmentto give them more operational autonomy, so that managerial decisions(hiring and firing, pricing, design of operations and investment programs)can be taken by the enterprises. The government would retain an importantrole in setting the overall rules and framework for operations (targetrates of return, service goals, etc.), and as owner would have a majorfinancial interest in public enterprise efficiency.
2.28 The most significant financial problem of the state-ownedfinancial institutions - which include the BCR, the commercial banks andthe savings and loan system - is the large size of their unacknowledgednon-performing loan portfolio (estimates range up to 402 of the total).This problem renders their income statements almost useless for analysis,as only recognized loan losses affect current revenues, and the balancesheets of the banks need to be carefully analyzed. The problems of theagricultural sector public enterprises are of rather a different nature,and are covered in Chapter IV.
Z. Deficit Finaaciua
2.29 The change in the way the public sector deficit was financed after1983 reflects the remarkable and powerful influence of external support onEl Salvador's economy. Up to 1982 domestic borrowing was the major sourceof financing, but since 1983 external grants have contributed an average of582 of total deficit financing. In contrast domestic borrowing fell to 24tin 1983-85 and has practically disappeared since 1986. External borrowinghas funded around one-third of the deficit throughout the decade, the majorsource being USAID, with the IDB far away in second place. Despite thelargely concessional terms of these loans, external debt servicing is anincreasing burden, and it would be unsound in the long term for the publicsector to increase external borrowing unless more growth-oriented policiesare adopted.
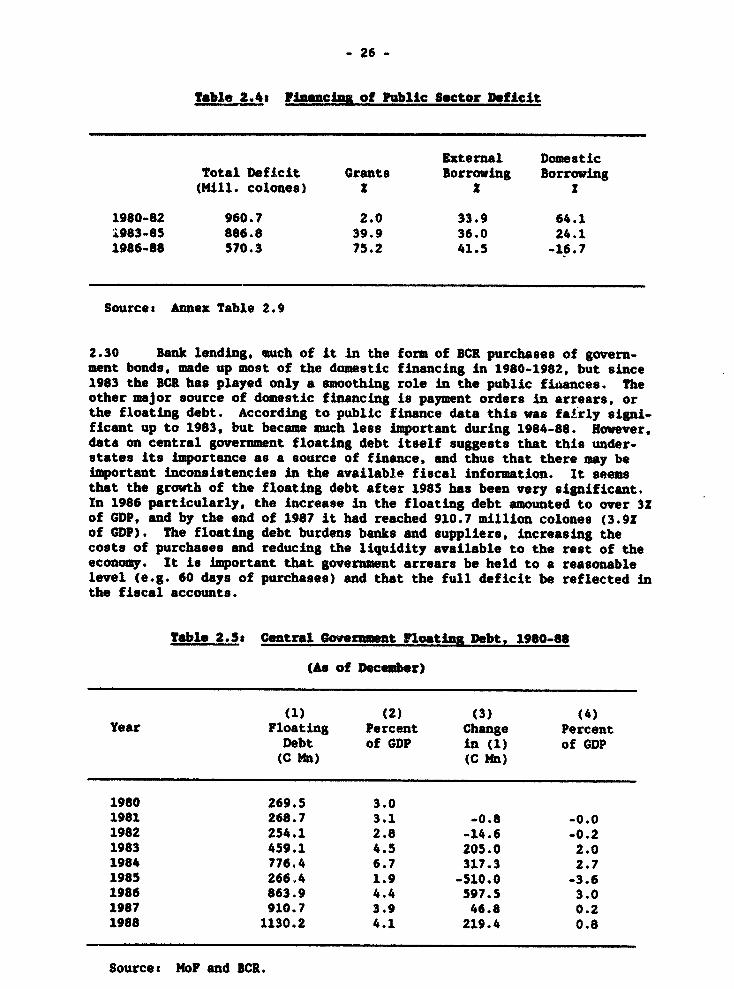
- 26 -
Table 2.4: Fiaancima of Public Sector Deficit
External DomesticTotal Deficit Grants Borrowing Borrowing(Mill. colones) Z 2 S
1980-82 960.7 2.0 33.9 64.1.983-85 886.8 39.9 36.0 24.11986-88 570.3 75.2 41.5 -16.7
Sources Annex Table 2.9
2.30 Bank lending, such of it in the form of BCR purchases of govern-ment bonds, made up most of the domestic financing in 1980-1982, but since1983 the BCR has played only a smoothing role in the public fiuances. Theother major source of domestic financing is payment orders in arrears, orthe floating debt. According to public finance data this was fa!rly signi-ficant up to 1983, but became much less important during 1984-88. However,data on central government floating debt itself suggests that this under-states its importance as a source of finance, and thus that there may beimportant inconsistencies in the available fiscal information. It seemsthat the growth of the floating debt after 1985 has been very significant.In 1986 particularly, the increase in the floating debt amounted to over 31of GDP, and by the end of 1987 it had reached 910.7 million colones (3.91of GDP). The floating debt burdens banks and suppliers, increasing thecosts of purchases and reducing the liquidity available to the rest of theeconomy. It is important that government arrears be held to a reasonablelevel (e.g. 60 days of purchases) and that the full deficit be reflected inthe fiscal accounts.
Table 2.5. Central Govermnuet Floating Debt, 1980-88
(As of December)
(1) (2) (3) (4)Year Floating Percent Change Percent
Debt of GDP in (1) of GDP(C Mn) (C Mn)
1980 269.5 3.01981 268.7 3.1 -0.8 -0.01982 254.1 2.8 -14.6 -0.21983 459.1 4.5 205.0 2.01984 776.4 6.7 317.3 2.71985 266.4 1.9 -510.0 -3.61986 863.9 4.4 597.5 3.01987 910.7 3.9 46.8 0.21988 1130.2 4.1 219.4 0.8
Sources MoF and BCR.

- 27 -
P. Fiscal Policy Management
2.31 The central government budget is supposed to be the majorinstrument of fiscal policy. Broad macroeconomic and fiscal goals areestablished in MIPLAN's Economic Program, and are discussed in a permanentcommission composed of representatives of the BCR, MoF, and MIPLAN. 'Whenthey have been decided (with the concurrence of the President of theRepublic), the MoF designs specific tax3 and spending measures to carrythem out. They are then incorporated in the central government budgetcontrolled by the MoF. Both income and expenditure are monitored weekly bythe Economic Committee, which is composed of the Ministers of Finance,Economics, Agriculture, Foreign Trade and Planning, and the President ofthe Central Bank. The Monetary Board ('Junta Monetaria'), presided over bythe Minister of Planning, may also intervene in the process.
2.32 In practice, the budget is used only to allocate money and not toset economic policy. It is drawn up in incremental fashion, taking theprevious year's budget as a point of reference. This incremental approachis carried out with Economic Program priorities in mind, but the changesmade do not take enough account of broader planning and budgetary goals.There appears to be no system to establish budgetary priorities and ad hocmechanisms are used to make cuts in the face of austerity, with capitalspending the first to be affected. It is urgent that priorities beestablished within and between government agencies, ideally reflecting costeffectiveness and cost-benefit analyses. A start is being made in DIGEPROYwith some of these techniques.
2.33 Several other budgets are used for carrying out public sectorexpenditure. This fragmentation is very damaging to the government'sability to manage fiscal policy, and improved coordination or integrationof these budgets is urgently needed. MIPLAN handles all thie resources inthe so-called Extraordinary Budget, which consist of donations or loansfrom external sources. Moreover, every public enterprise, decentralizedinstitution, and public sector financial institution has its own budget,with little centralized control. While public enterprises need not besubject to the same controls and rules as government ministries, thereshould be an integrated system of financial administration and controls forall public sector entities. Such a system is planned for instance inBolivia, to cover financial administration (budgeting and accounting),controls (internal and external audits), and administration (organization,programming of operations and public contracting).
2.34 The lack of policy coordination has also negatively affected theuse of fiscal policy for stabilization purposes. The BCR prepares themonetary program, HIPLAN the investment budget, and the MoF the centralgovernment budget, with little reconciliation between these threeexercises. The three bodies should better coordinate their activities toproduce a single set of numbers on which to base fiscal policy.
31 Legislative approval is needed for tax changes.

- 28 -
III. TRADE POLICY AND PERFORMANCE
A. Background
3.01 The main medium-term trade issue facing El Salvador will be how toencourage the export growth and diversification which are necessary bothfor growth and to substitute for future reductions in the current extra-ordinary levels of foreign transfers. There are two main domestic policyconstraints on exports. Firstly, as a result of past regional importsubstitution efforts, the structure of production is ill-adapted forexports outside the Central American region. Secondly, the real apprecia-tion of the currency has reduced the incentives for all exports, (includingtraditional crops) and import substitution. This chapter focuses on theformer aspect, suggesting reforms in the system of protection. Thesechanges would both necessitate and tend to produce a real dcpreiation inthe value of the currency.
3.02 As a member of the Central American Common Market (CACM), ElSalvador has since the 1960s had a tariff system which favored regionalimports over those from the rest of the world. in return, it receivestariff preferences on its own exports to CACM countries. In the 1960s, theregional share of El Salvador's exports rose rapidly (from 122 in 1960 to32Z by 1970), while exports remained more or less steady as a share of GDP.This shows that, as would be expected from the nature of the CACHcountries' economies, the main effect of the system of preferences was todivert rather than to increase trade. Regional trade began to declinearound 1980, reflecting the economic and political difficulties of mostCACM countries, and by 1987 took only 20X of El Salvador's exports. Never-theless El Salvador continues to be burdened by the uncompetitive structureof production that the CACM encouraged, and overall exports have shrunk.Exports remain extremely concentrated on a few products, and imports aredominated by intermediate goods for domestic assembly, as shown inTable 3.1.
3.03 In addition to import tariffs, E1 Salvador taxes exports ofseveral traditional commodities. It also has many non-tariff barriersagainst imports, which often add to the bias against non-regional trade.These have included domestic taxes, exchange control., quotas and priordeposit and prohibition schemes. Despite several recent moves to reducebarriers, the result is a set of incentives which is not only highly biasedagainst non-regional exports, but is not transparent to those involved inproduction and trade. Policy should be designed on the basis of thecombined incentive effects of all these barriers. However several of themare very hard to quantify, for instance the discretionary power of the BCRto restrict import applications and allocate foreign exchange amongimporters, and the fact that the government has never defined explicitlythe list of items subject to exchange controls.
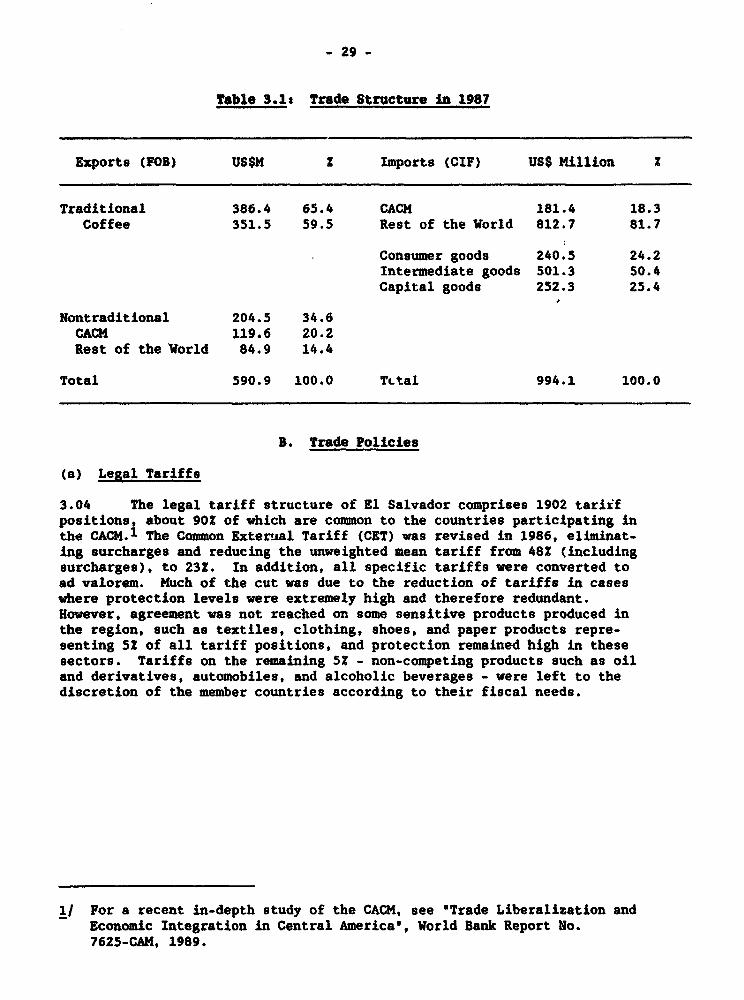
- 29 -
Table 3.1: Trade Structure in 1987
Exports (FOB) US$M Z Imports (CIF) US$ Million Z
Traditional 386.4 65.4 GACM 181.4 18.3Coffee 351.5 59.5 Rest of the World 812.7 81.7
Consumer goods 240.5 24.2Intermediate goods 501.3 50.4Capital goods 252.3 25.4
Nontraditional 204.5 34.6CACW 119.6 20.2Rest of the World 84.9 14.4
Total 590.9 100.0 Tttal 994.1 100.0
S. Trade Policies
(a) Lexal Tariffs
3.04 The legal tariff structure of El Salvador comprises 1902 tarirfpositions, about 902 of which are common to the countries participating inthe CACM.1 The Common Exterual Tariff (CET) was revised in 1986, eliminat-ing surcharges and reducing the unweighted mean tariff from 482 (includingsurcharges), to 23X. In addition, all specific tariffs were converted toad valorem. Much of the cut was due to the reduction of tariffs in caseswhere protection levels were extremely high and therefore redundant.However, agreement was not reached on some sensitive products produced inthe region, such as textiles, clothing, shoes, and paper products repre-senting 52 of all tariff positions, and protection remained high in thesesectors. Tariffs on the remaining 5 - non-competing products such as oiland derivatives, automobiles, and alcoholic beverages - were left to thediscretion of the member countries according to their fiscal needs.
1/ For a recent in-depth study of the CACM, see 'Trade Liberalization andEconomic Integration in Central America", World Bank Report No.7625-CAM, 1989.
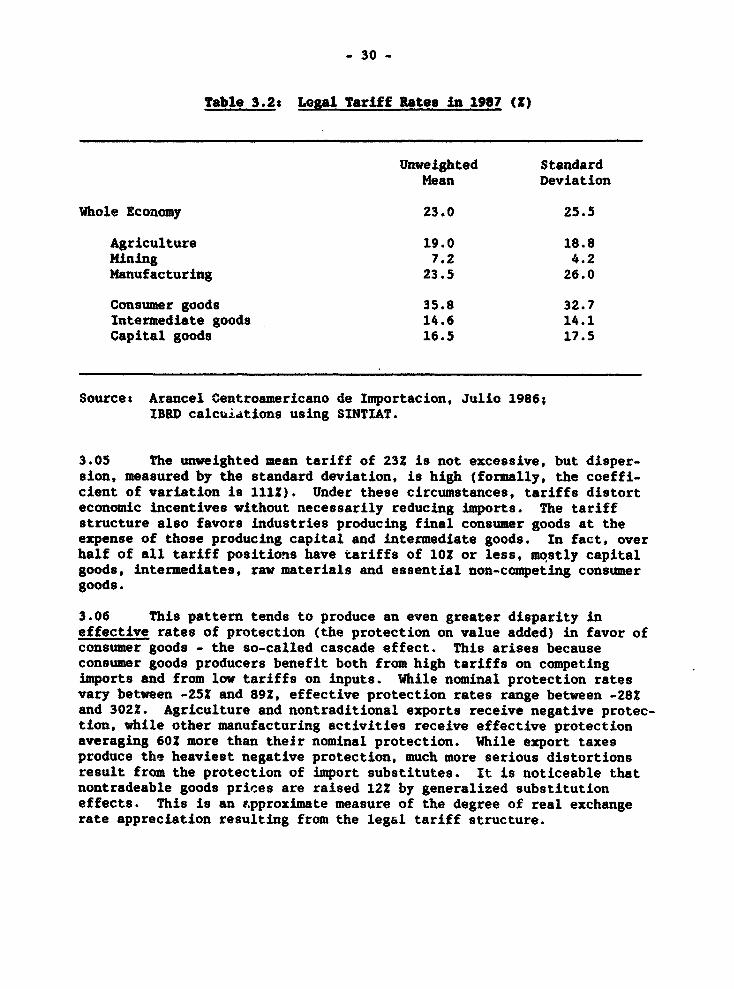
- 30 -
Table 3.2: Legal Tariff Rates in 1987 (Z)
Unweighted StandardMean Deviation
Whole Economy 23.0 25.5
Agriculture 19.0 18.8Mining 7.2 4.2Manufacturing 23.5 26.0
Consumer goods 35.8 32.7Intermediate goods 14.6 14.1Capital goods 16.5 17.5
Sources Arancel Centroamericano de Importacion, Julio 1986;IBRD calcuiations using SINTIAT.
3.05 The unweighted mean tariff of 23Z is not excessive, but disper-sion, measured by the standard deviation, is high (formally, the coeffi-cient of variation is 111Z). Under these circumstances, tariffs distorteconomic incentives without necessarily reducing imports. The tariffstructure also favors industries producing final consumer goods at theexpense of those producing capital and intermediate goods. In fact, overhalf of all tariff positions have tariffs of 102 or less, mostly capitalgoods, intermediates, raw materials and essential non-competing consumergoods.
3.06 This pattern tends to produce an even greater disparity ineffective rates of protection (the protection on value added) in favor ofconsumer goods - the so-called cascade effect. This arises becauseconsumer goods producers benefit both from high tariffs on competingimports and from low tariffs on inputs. While nominal protection ratesvary between -25Z and 892, effective protection rates range between -28Zand 302X. Agriculture and nontraditional exports receive negative protec-tion, while other manufacturing activities receive effective protectionaveraging 60X more than their nominal protection. While export taxesproduce the heaviest negative protection, much more serious distortionsresult from the protection of import substitutes. It is noticeable thatnontradeable goods prices are raised 122 by generalized substitutioneffects. This is an e.pproximate measure of the degree of real exchangerate appreciation resulting from the leg&l tariff structure.

- 31 -
Table 3.3: Nominal and Effective Trade Tax Protection in 1987 (1)
Sector Nominal 11 Effective
Coffee -25.0 -28.0Cotton 0.0 -9.8Other agriculture & mining products 4.8 -0.5Foodstuffs k9.7 93.7Beverages & tobacco 88.5 301.6Textiles 40.5 84.8Clothing, leather & footwear 41.7 75.1Wood & furniture 43.8 87.1Paper & printing 27.3 43.7Chemical products 12.2 7.9Rubber, plastic & non-metallic products 23.8 38.6Basic metal industries 14.2 14.1Mach nery & equipment 21.7 38.6Oil and electricity 6.1 2.3NoL radeable 2/ 12.0 10.7Non-traditional exports 0.0 -2.6
11 Unweighted average.
21 Change in the price of nontradeables induced by import and exporttaxes.
Source: IBRD calculations.
3.07 It would be misleading to assess either nominal or effectiveprotection solely on the basis of legal tariffs. This is because itignores the protective effect of non-tariff barriers such as priordeposits, quantitative restrictions, exchange controls and multipleexchange rates. Also the actual tariff paid by importers is often muchlower than the legal tariff, as exonerations are comnon in many sectors(this is taken up in section (c)).
3.08 Protection is intended to raise the production of protected goodsabove the levels that would prevail under free trade. Thus, if protectionrates are weighted by production the average should be higher than theunweighted rates. In El Salvador's case, the production-weighted averagefor tariffs in manufacturing is 342, while the unweighted average is only232.
(b) Non-Tariff Barriers
Selective Consumption Tax (SCT)
3.09 The SCT was in force from January 31, 1986 when the CET wasrevised, until February 1989. It was levied on imported goods at a higher
- 32 -
rate than on goods produced domestically (or in the CACM), so imports fromthird countries under the 250 tariff positions covered by the SCT bore animplicit tax, averaging 61? (unweighted). This raised average nominalprotection from 23S to 371 (from 362 to 662 in the case of consumer goods)and raised the coefficient of variation from 111% to 1532. The SCT raisedthe effective protection on consumer goods still further relative tointermediate and capital goods, thereby adding to the bias generated bytariffs. It also increased the degree of negative protection onagriculture and non-traditional exports, and raised the effectiveprotection of the manufacturing sector to 1502 above its nominalprotection, reinforcing the cascade effect. The SCT seriously aggravatedthe defects of the tariff system, and its abolition has been an importantmove in the direction of import liberalization.
Exchange Controls and Exchange Rate Arrangements
3.10 The BCR establishes priorities both for granting import licensesand for allocating foreign exchange, in particular when internationalreserves are low. Importers must first obtain a foreign exchange permitfrom the BCR, and in order to buy foreign exchange at the official rateimports must be given priority. This is only automatic in the case ofessential foodstuffs, medicines, fuels, raw materials, other productioninputs, and machinery. The BCR however has generally extended importlicenses freely in the last two years. To reduce smuggling, most importapplications were authorized in 1988.
3.11 Before January 31, 1988, many imports that did not receive foreignexchange at the official price were also subject to a prior deposit of 10O2of the import value. The deposit had a minimum term of 90 days and itsfinancial cost represented about 5s of the value of imports at currentinterest rates. This requirement has been gradually phased out in 1988 andis no longer in force.
3.12 Between 1982 and early 1986, a dual exchange market was in effect.The official market rate remained pegged at C 2.50 per US dollar, but inaddition a legal parallel market was set up in which the value of the colon(largely determined by the banks) was somewhat below that in the illegalparallel market. Between 1984 and 1986, foreign exchange transactions wereshifted gradually from the official to the legal parallel market, creatinglarge and rapidly-changing price distortions among different categories ofexports and imports. In early 1986 the official exchange rate was unifiedat C 5.00 per US dollar, eliminating these distortions. Favorable balanceof payments conditions up to 1988, particularly transfer receipts, allowedthe BCR to sustain the new parity without a large premium developing in theparallel market.
3.13 At the end of 1986, exporters of non-traditional products wereallowed to open US dollar accounts in domestic banks and sell foreignexchange to other importers or manufacturers at a free banking rate. Thisreintroduced a dual exchange rate system and, although the premium was lowin 1987-88 (around 5Z) it increased in early 1989 as balance of paymentsconditions have deteriorated and an increasing volume of transactions haspassed to the parallel market. As the premium has increased, so has theprotection on goods whose imports do not get foreign exchange at the

- 33 -
official rate. This means in the first instance non-essential consumergoods, which already enjoy high protection, so the dispersion of protectionto worsening. As the gap between official and parallel market ratesincreases, the authorities may rely increasingly on such exchange ratedistortions to try to keep the official market in balance. This wouldworsen the distortions in the trade system, further undermining exportprospects. It is lmportant to avoid such multiple currency practices,either by setting an official rate which clears the foreign exchangemarket, or by tightening domestic demand so far that the excess demand forforeign exchange disappears.
Quantitative Restrictions
3.14 E1 Salvador has legal provision for prohibitions and regulationsto reduce imports of luxury goods, passenger motor vehicles and goods*adequately supplied* domestically. A list of 200 prohibited items wasintroduced in 1986 but the number has since been reduced, and at the momentonly includes 28 tariff headings.2 Also, a number of agricultural productsand fertilizers require previous authorization by the MHG, but there are noformal quotas except one set by the CACH on imports of powdered milk. Theauthorities could establish quantitative restrictions on imports bylimiting the number of import applications they authorize. This system isused in many countries when an external payments crisis occurs. it isessential to avoid the use of these or similar restrictive practices, whichwould negate the incentive changes needed by the economy.
Export Taxes and Export Incentives
3.15 Taxes are levied on certain traditional exports, namely coffee,sugar, and shrimp. The coffee tax (see Chapter II) has the most seriousincentive effects, being charged at a marginal rate of 302. Shrimp aretaxed at the rate of 0.20 US dollars per pound exported. The tax on sugaris not applied if the price is C 10.00 or less per quintal. In 1987,revenue collection from all these sources represented 18S of total taxes,with the coffee tax accounting for 97S of export taxes.
3.16 An Export Promotion Law was introduced in 1986 to promote exportsof non-traditional products to non-CACM countries. Its provisions aresummarized in Table 5.1 (Page 54). Exporters of these products enjoycustoms duty exemption for the import of machinery, equipment, fuel andlubricants, and full exemption from income and wealth taxes over a ten-yearperiod. Firms or undertakings that export less than 25? of their outputare extended tax rebate certificates (CDTs) of a value equivalent to notmore than 302 of the value of exports. The percentage is deternined on thebasis of the producing structure of the undertaking and may never exceedthe amount of taxes incurred in the processing of the products imported.CDTs are made out to the bearer and may be used only for the payment of taxliabilities of any kind. The fiscal costs of this regime are high, ataround US$22 million in 1987 on non-traditional exports of US$85 million -a subsidy rate of 262. It will be important to review these tax breaks,particularly if devaluation is used to improve the competitiveness ofexports in the medium term.
21 Prohibitions are not absolute; the government can grant authorizationsto import when it considers it necessary.
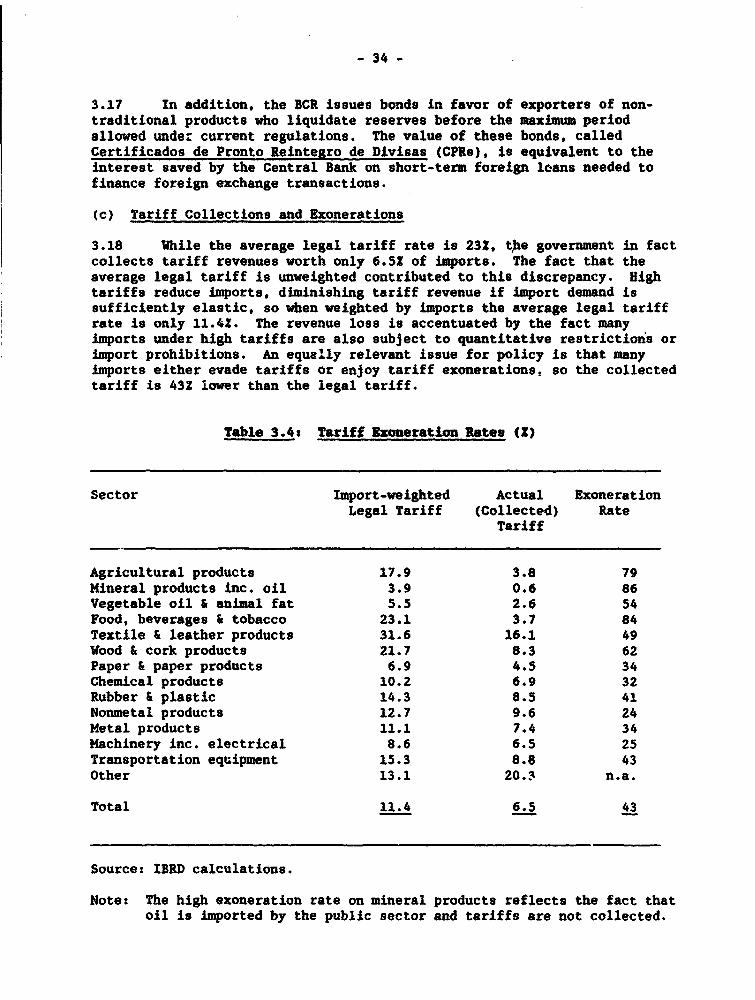
- 34 -
3.17 In addition, the BCR issues bonds in favor of exporters of non-traditional products who liquidate reserves before the maximum periodallowed under current regulations. The value of these bonds, calledCertificados de Pronto Reintegro de Divisas (CPRs), is equivalent to theinterest saved by the Central Bank on short-term foreign loans needed tofinance foreign exchange transactions.
(c) Tariff Collections and Exonerations
3.18 While the average legal tariff rate is 23Z, t~he government in factcollects tariff revenues worth only 6.5Z of imports. The fact that theaverage legal tariff is unweighted contributed to this discrepancy. Hightariffs reduce imports, diminishing tariff revenue if import demand issufficiently elastic, so when weighted by imports the average legal tariffrate is only 11.42. The revenue loss is accentuated by the fact manyimports under high tariffs are also subject to quantitative restrictions orimport prohibitions. An equally relevant issue for policy is that manyimports either evade tariffs or enjoy tariff exonerations, so the collectedtariff is 432 lower than the legal tariff.
Table 3.4: Tariff Exoneration Bates (1)
Sector Import-weighted Actual ExonerationLegal Tariff (Collected) Rate
Tariff
Agricultural products 17.9 3.8 79Mineral products inc. oil 3.9 0.6 86Vegetable oil & animal fat 5.5 2.6 54Food, beverages & tobacco 23.1 3.7 84Textile & leather products 31.6 16.1 49Wood & cork products 21.7 8.3 62Paper & paper products 6.9 4.5 34Chemical products 10.2 6.9 32Rubber & plastic 14.3 8.5 41Nonmetal products 12.7 9.6 24Metal products 11.1 7.4 34Machinery inc. electrical 8.6 6.5 25Transportation equipment 15.3 8.8 43Other 13.1 20.3 n.a.
Total 11.4 6.5 43
Source: IBRD calculations.
Note: The high exoneration rate on mineral products reflects the fact thatoil is imported by the public sector and tariffs are not collected.

- 35 -
3.19 The highest exoneration rates are on consumer goods such as agri-cultural products, food, beverages and tobacco, textiles and wood products.Since most exonerations are supposed to apply to intermediate and capitalgoods, rather than consumer goods, it seems that there is substantialtariff evasion through faulty use of exoneration mechanisms.3 The sacrificeof fiscal revenue due to tariff exonerations is very considerable.Potential duty revenue in 1987 was 440 million colones or US$88 Mn., ofwhich the government actually collected US$51.7 Mn. The foregone tariffcollection can be subdivided as followst
i) Sector promotion regimes4 $22.2 Mii) Oil import exemption $ 4.2 Miii) Other exonerations and evasion5 $ 9.8 M
Total Revenue loss $36.3 M
3.20 To compensate for this loss in fiscal revenues, the governmentlevies two domestic taxes, a sales tax on domestic oil consumption and theSCT. The former yields US$6.8 million, considerably more than the hypothe-tical revenue loss from uncollected oil tariffs. This tax has the sameeffect as a tariff since there is no domestic oil production. The SC-yields US$5.3 million, only 30? of potential collection of US$17.3 mix ion,suggesting that the same mechanisms that allow importers to evade or beexempted from tariffs on consumer goods also allow them to escape the SCT.Although these additional taxes offset most of the loss in tariff revenuedue to (ii) and (iii) above, they probably result in a greater dispersionin protection. Since most exonerations in category (i) are granted throughthe export promotion regime (temporary admission of imports, drawbacks,etc.) they should reduce the anti-export bias of the protection system andimprove competitiveness of nontraditional exports outside regional markets.
C. Reform Proposals
3.21 The fundamental aims of trade policy reform are to increase trade,particularly exports, and increase the efficiency of domestic resourceallocation as a means of supporting more rapid sustainable growth in thelong run, hence raising living standards and employment. In order toachieve these objectives, it is important to ensure that trade policies aredesigned as efficiently as possible. From the variations in effectiverates of protection, we know that it costs E1 Salvador far more to saveforeign exchange by import substitution than to earn it through exports.Hence it is important for efficient resource use to improve the incentivesfor exports in relation to those for import substitution, and this involves
3/ This evasion problem only applies to registered imports, and isadditional to the one resulting from contraband.
4/ See Chapter V. In 1987, export promotion accounted for 98? of thefiscal cost of all these regimes taken together.
5/ The main exoneration system in this group applies to goods acquired bythe government, autonomous official institutions and agencies, or bythe municipalities.
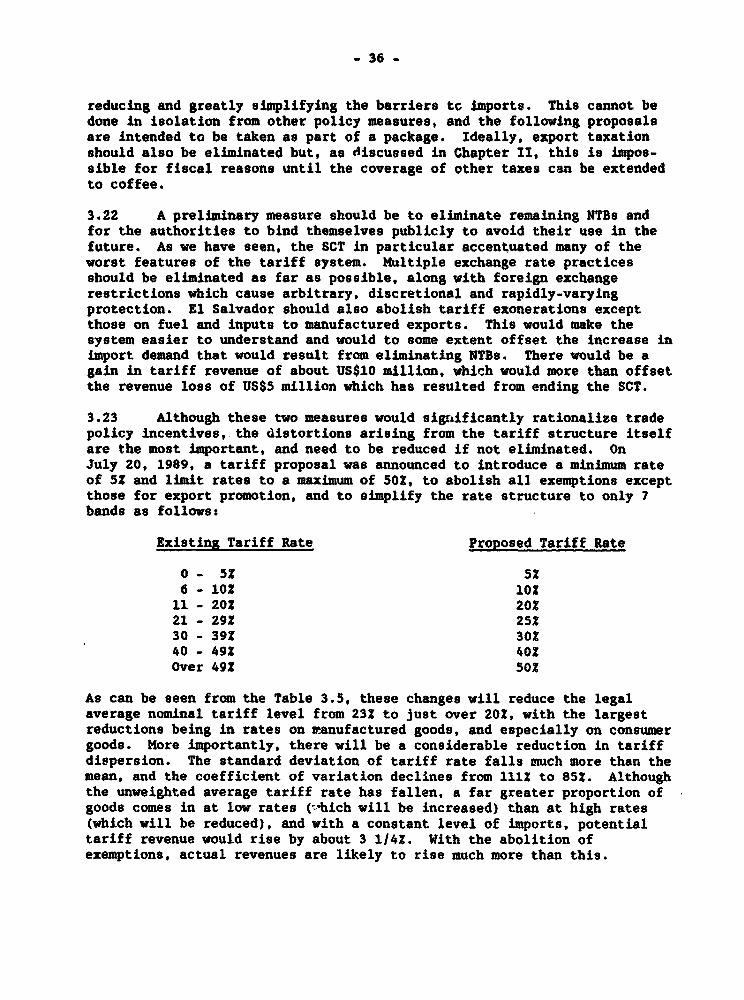
- 36 -
reducing and greatly simplifying the barriers tc imports. This cannot bedone in isolation from other policy measures, and the following proposalsare intended to be taken as part of a package. Ideally, export taxationshould also be eliminated but, as discussed in Chapter II, this is impos-sible for fiscal reasons until the coverage of other taxes can be extendedto coffee.
3.22 A preliminary measure should be to eliminate remaining NTBs andfor the authorities to bind themselves publicly to avoid their use in thefuture. As we have seen, the SCT in particular accentuated many of theworst features of the tariff system. Multiple exchange rate practicesshould be eliminated as far as possible, along with foreign exchangerestrictions which cause arbitrary, discretional and rapidly-varyingprotection. El Salvador should also abolish tariff exonerations exceptthose on fuel and inputs to manufactured exports. This would make thesystem easier to understand and would to some extent offset the increase inimport demand that would result from eliminating NTBs. There would be again in tariff revenue of about US$10 million, which would more than offsetthe revenue loss of US$5 million which has resulted from ending the SCT.
3.23 Although these two measures would significantly rationalize tradepolicy incentives, the distortions arising from the tariff structure itselfare the most important, and need to be reduced if not eliminated. OnJuly 20, 1989, a tariff proposal was announced to introduce a minimum rateof 52 and limit rates to a maximum of 50Z, to abolish all exemptions exceptthose for export promotion, and to simplify the rate structure to only 7bands as followes
Existing Tariff Rate Proposed Tariff Rate
0 - 52 526 - 1O0 10211 - 202 20221 - 292 25230 - 39Z 30240 - 49Z 402Over 492 502
As can be seen from the Table 3.5, these changes will reduce the legalaverage nominal tariff level from 23? to just over 2OZ, with the largestreductions being in rates on twanufactured goods, and especially on consumergoods. More importantly, there will be a considerable reduction in tariffdispersion. The standard deviation of tariff rate falls much more than themean, and the coefficient of variation declines from 1112 to 852. Althoughthe unweighted average tariff rate has fallen, a far greater proportion ofgoods comes in at low rates (-hich will be increased) than at high rates(which will be reduced), and with a constant level of imports, potentialtariff revenue would rise by about 3 1/4Z. With the abolition ofexemptions, actual revenues are likely to rise much more than this.
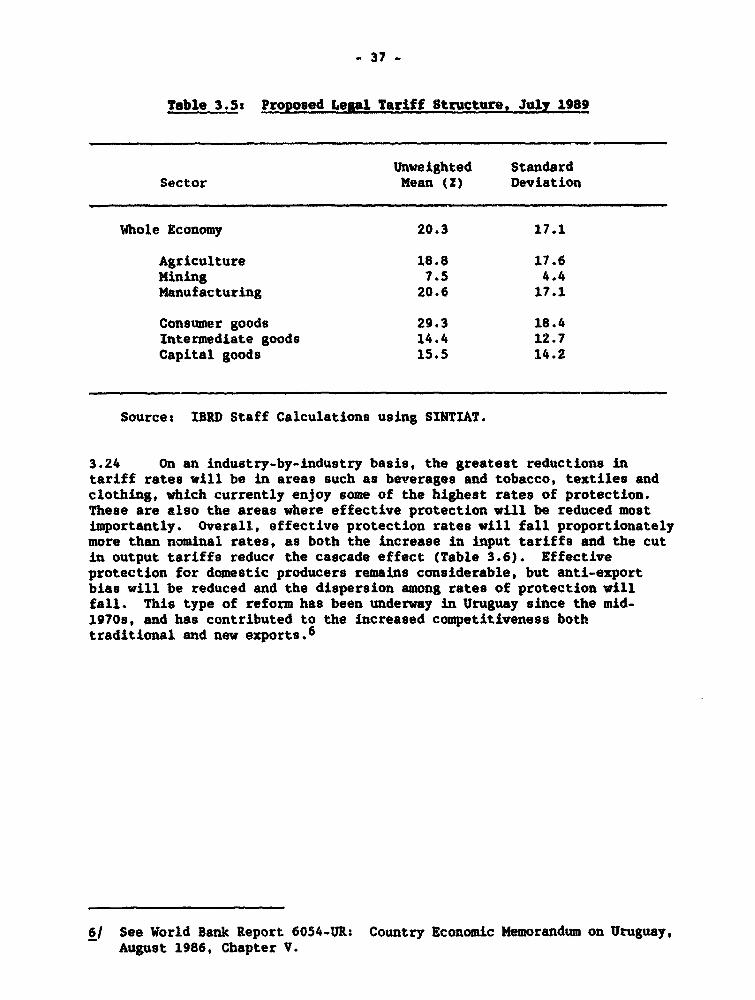
- 37 -
Table 3.5s Proposed Legal Tariff Structure, July 1989
Unweighted StandardSector Mean (2) Deviation
Whole Economy 20.3 17.1
Agriculture 18.8 17.6Mining 7.5 4.4Manufacturing 20.6 17.1
Consumer goods 29.3 18.4Intermediate goods 14.4 12.7Capital goods 15.5 14.2
Sourcet IBRD Staff Calculations using SINTIAT.
3.24 On an industry-by-industry basis, the greatest reductions intariff rates will be in areas such as beverages and tobacco, textiles andclothing, which currently enjoy some of the highest rates of protection.These are also the areas where effective protection will be reduced mostimportantly. Overall, effective protection rates will fall proportionatelymore than nominal rates, as both the increase in input tariffs and the cutin output tariffs reducf the cascade effect (Table 3.6). Effectiveprotection for domestic producers remains considerable, but anti-exportbias will be reduced and the dispersion among rates of protection willfall. This type of reform has been underway in Uruguay since the mid-19708, and has contributed to the increased competitiveness bothtraditional and new exports.6
6/ See World Bank Report 6054-UR: Country Economic Memorandum on Uruguay,August 1986, Chapter V.
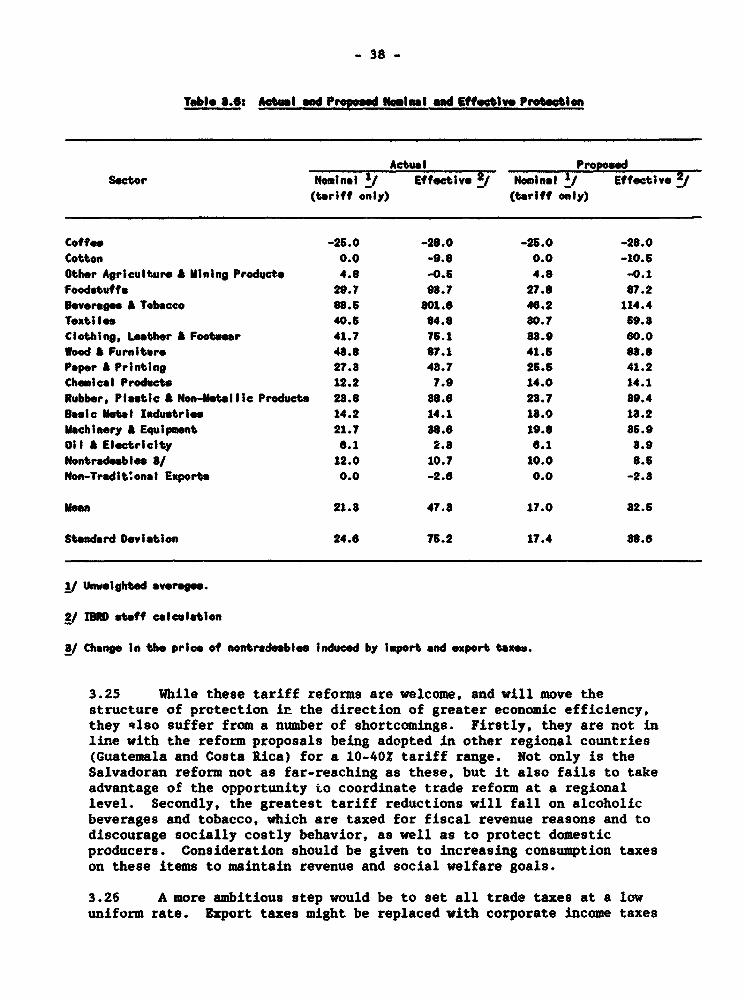
- 38 -
Table 6-.: Actual and frtsgo.d Nemnil and Effctilve Prateon
Actual P1opo2dSoctor Nominai N Effoctive Nominal !/ Effective J
(tariff only) (tariff only)
Coffee -25.0 -26.0 -26.0 -28.0Cotton 0.0 -9.6 0.0 -10.6Other Agriculture & Mining Products 4.6 -0.6 4.8 -0.1foodstuffs 29.7 9s.7 27.8 87.2Beverage. A Tobacco 88.6 801.6 40.2 114.4Textiles 40.6 64.8 80.7 69.8Clothing, Leather A Footwear 41.7 75.1 88.0 60.0Wood A Furniture 48.8 87.1 41.6 88.sPaper A Prlnting 27.8 48.7 26.6 41.2Chemical Products 12.2 7.9 14.0 14.1
Rubber, Plastic A Non-Metallic Products 28.6 860. 28.7 39.4
Basic Metal Industries 14.2 14.1 18.0 18.2Machinery A Equipment 21.? 88.6 19.8 86.9
OfI & Electricity 6.1 2.8 6.1 8.9
Nontradeablee S/ 12.0 10.7 10.0 8.5Non-Tradit'onal Exports 0.0 -2.8 0.0 -2.8
Mean 21.8 47.8 17.0 82.5
Standard Deviation 24.6 75.2 17.4 s6.8
1/ Uniht averages.
2/ IBRD staff calculation
/ Change in the price of nontradeablos Induced by Import and export taxe.
3.25 While these tariff reforms are welcome, and will move thestructure of protection in the direction of greater economic efficiency,they also suffer from a number of shortcomings. Firstly, they are not inline with the reform proposals being adopted in other regional countries(Guatemala and Costa Rica) for a 10-402 tariff range. Not only is theSalvadoran reform not as far-reaching as these, but it also fails to takeadvantage of the opportunity to coordinate trade reform at a regionallevel. Secondly, the greatest tariff reductions will fall on alcoholicbeverages and tobacco, which are taxed for fiscal revenue reasons and todiscourage socially costly behavior, as well as to protect domesticproducers. Consideration should be given to increasing consumption taxeson these items to maintain revenue and social welfare goals.
3.25 A more ambitious step would be to set all trade taxes at a lowuniform rate. Export taxes might be replaced with corporate income taxes

- 39 -
and auctions of quota rights under the ICO and in the US sugar market, toreduce monopoly rents. This would produce more-or-less uniform effectiveprotection at the same rate as the nominal tariff, greatly reducing dis-persion and giving similar incentives for all categories of production. Asmall bias would remain against exports, but their relative competitivenesswould be much improved, and it would be impossible to go much further inthis direction without giving up import tariff revenue altogether. Under a10? uniform tariff with all exonerations eliminated, preferential accessfor regional imports would be greatly reduced and trade with the rest ofthe world would increase by about 102. Combined with the rise in averagetariffs from 6.5Z to 10?, this would produce a C 190 Mn (USS 38 million)increase in tariff revenues - a gain of about 702.
3.27 This type of reform has been tried with considerable euccess inChile, and similar trade policies have been recently adopted in Mexico.The resulting changes in imports, exports and domestic production would bevery large, and it would be important to phase such changes in graduallyand with appropriate accompanying policies. Moreover there would be impor-tant challenges to the CACM countries, whose trade preferences in ElSalvador would be drastically reduced. Synchronization of similar changesin all the CACH countries would be the ideal context for the revitalizationof the regional economies and trade.
3.28 Trade liberalization must be accompanied by real exchange ratedepreciation to increase the incentives for exports and efficient importsubstitution activities, reducing adjustment costs and balance of paymentsproblems. If the official exchange rate is set in such a way as to reflectthe scarcity of foreign exchange, it will automatically depreciate asimport barriers are lowered. The nore ambitious the liberalization, thegreater will be extent of factor reallocation and the increase in tariffcollections as imports increase. The Government will also need to provideadjustment assistance to allow enterprises to take advantage of changingincentives, perhaps in the form of lines of credit for capacity conversion,export development and training. Where there are unavoidable capitallosses, the public sector may have to meet some of the costs of industrialtransformation.
3.29 With lower, more transparent and more uniform import barriers andunder a more realistic exchange rate, the need for special exportincentives would be greatly reduced. It would still be useful to grantimport-tariff drawbacks on intermediate goods (and VAT reliefs) toexporters, but there should be no need for income tax exemptions. Theexport incentives legislation should, therefore, be simplified accordingly,reducing the fiscal losses and the possibilities for tax evasion.

- 40 -
IV. AGRICULTURE
A. Pkoduction, Trade and Prices
(a) Overview
4.01 Already burdened with heavy population pressure on available land,El Salvador's agricultural sector has faced special difficulties over thelast 10 years. The real average world price of agricultural commoditiesfell by over 40S between 1978 and 1987, and this in combination with ElSalvador's real currency appreciation and large amounts of concessionalfood aid severely reduced real export prices. As shown in Figure 4.1, thereal prices received by Salvadoran agricultural producers have generallyfallen in line with what world prices of agricultural goods and the realexchange rate would warrant. From 1975 to 1987 the price of agriculturaloutput fell by over 50Z in relation to that of other sectors. All types ofagricultural products have been severely affected, though domestic marketprices fell less than those of export crops.
Figure 4.1
Real Prices of Agricultural Products(Colon index, 1978-100)
510
60 L
30 l l l l 1978 1980 1982 1984 1988
El 8alvador + World
4.02 Agriculture also saw far-reaching policy interventions as 252 ofland underwent tenure reform, and there was increased state control ofexport marketing and domestic pricei. Altogether 155,000 manzanas of farmland (52 of the 1971 total) has been abandoned, including 13Z of the coffeeand 852 of the cotton, due to the idling of about 102 of the crop land ofagrarian reform collectives and security problems. The rural areas werethe most heavily affected by the civil war, which has displaced largenumbers of people from the countryside, caused large capital losses andmade large areas unsafe for agriculture.
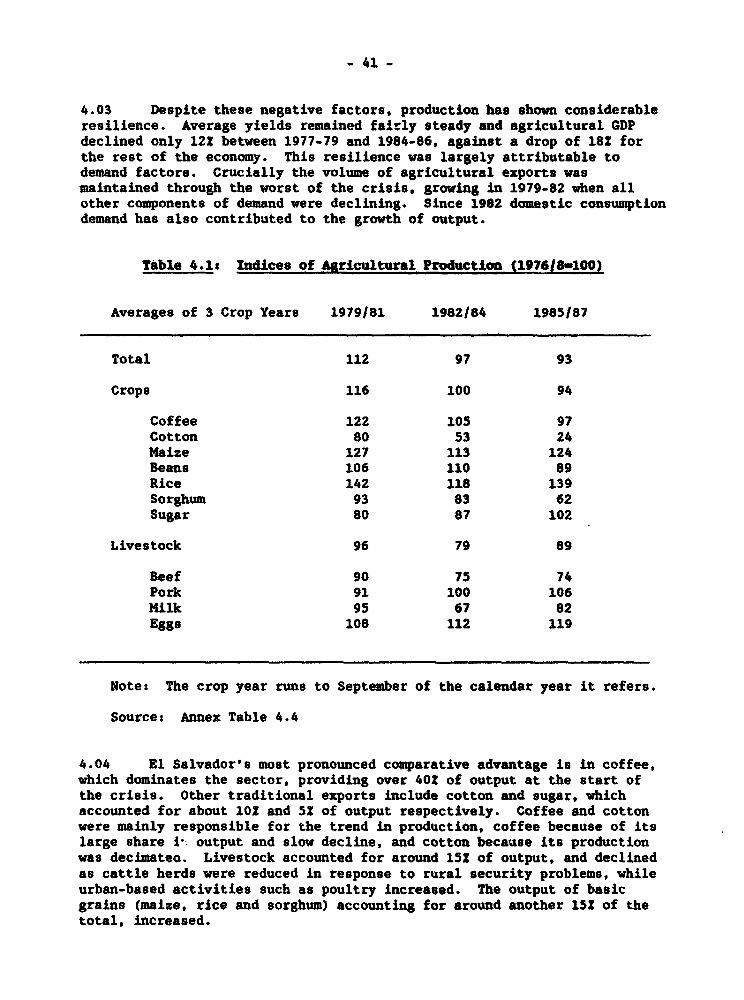
- 41 -
4.03 Despite these negative factors, production has shown considerableresilience. Average yields remained fairly steady and agricultural GDPdeclined only 12Z between 1977-79 and 1984-86, against a drop of 18Z forthe rest of the economy. This resilience was largely attributable todemand factors. Crucially the volume of agricultural exports wasmaintained through the worst of the crisis, growing in 1979-82 when allother components of demand were declining. Since 1982 domestic consumptiondemand has also contributed to the growth of output.
Table 4.1s Indices of Agricultural Production (197618-100)
Averages of 3 Crop Years 1979181 1982184 1985187
Total 112 97 93
Crops 116 100 94
Coffee 122 105 97Cotton 80 53 24Maize 127 113 124Beans 106 110 89Rice 142 118 139Sorghum 93 83 62Sugar 80 87 102
Livestock 96 79 89
Beef 90 75 74Pork 91 100 106Milk 95 67 82Eggs 108 112 119
Note: The crop year runs to September of the calendar year it refers.
Source: Annex Table 4.4
4.04 El Salvador's most pronounced comparative advantage is in coffee,which dominates the sector, providing over 402 of output at the start ofthe crisis. Other traditional exports include cotton and sugar, whichaccounted for about 10X and 52 of output respectively. Coffee and cottonwere mainly responsible for the trend in production, coffee because of itslarge share i-I output and slow decline, and cotton because its productionwas decimate*. Livestock accounted for around 152 of output, and declinedas cattle herds were reduced in response to rural security problems, whileurban-based activities such as poultry increased. The output of basicgrains (maize, rice and sorghum) accounting for around another 152 of thetotal, increased.
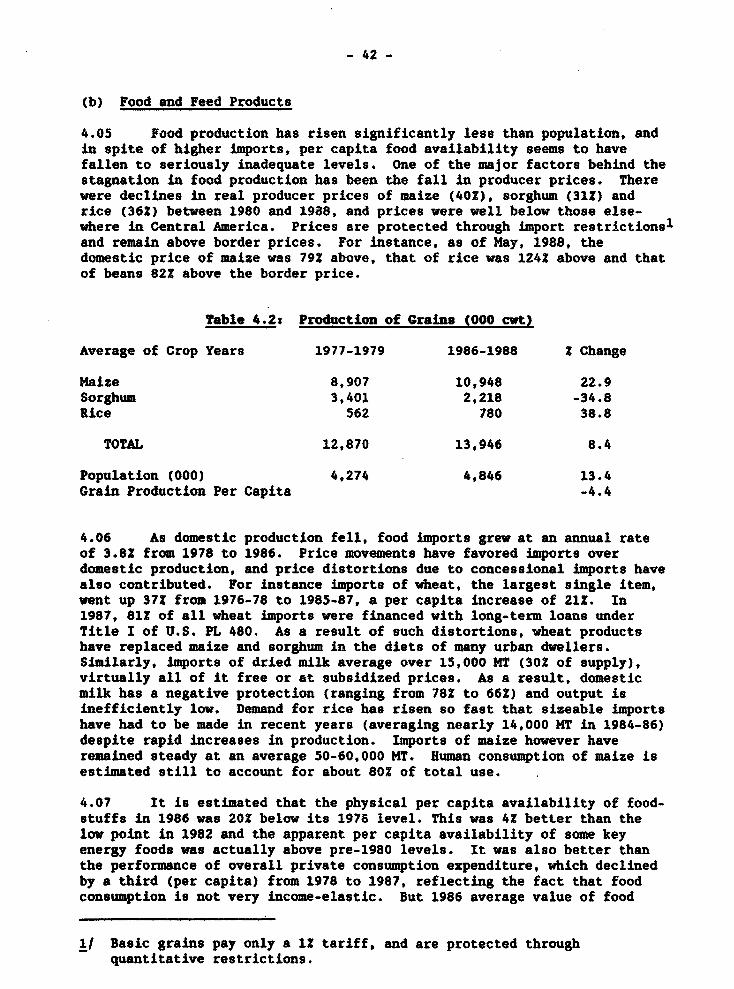
- 42 -
(b) Food and Feed Products
4.05 Food production has risen significantly less than population, andin spite of higher imports, per capita food availability seems to havefallen to seriously inadequate levels. One of the major factors behind thestagnation in food production has been the fall in producer prices. Therewere declines in real producer prices of maize (402), sorghum (312) andrice (362) between 1980 and 1988, and prices were well below those else-where in Central America. Prices are protected through import restrictions1
and remain above border prices. For instance, as of Hay, 1988, thedomestic price of maize was 792 above, that of rice was 1242 above and thatof beans 822 above the border price.
Table 4.2: Production of Grains (000 cwt)
Average of Crop Years 1977-1979 1986-1988 2 Change
Maize 8,907 10,948 22.9Sorghum 3,401 2,218 -34.8Rice 562 780 38.8
TOTAL 12,870 13,946 8.4
Population (000) 4,274 4,846 13.4Grain Production Per Capita -4.4
4.06 As domestic production fell, food imports grew at an annual rateof 3.82 from 1978 to 1986. Price movements have favored imports overdomestic production, and price distortions due to concessional imports havealso contributed. For instance imports of wheat, the largest single item,went up 372 from 1976-78 to 1985-87, a per capita increase of 21Z. In1987, 812 of all wheat imports were financed with long-term loans underTitle I of U.S. PL 480. As a result of such distortions, wheat productshave replaced maize and sorghum in the diets of many urban dwellers.Similarly, imports of dried milk average over 15,000 HT (302 of supply),virtually all of it free or at subsidized prices. As a result, domesticmilk has a negative protection (ranging from 78Z to 662) and output isinefficiently low. Demand for rice has risen so fast that sizeable importshave had to be made in recent years (averaging nearly 14,000 MT in 1984-86)despite rapid increases in production. Imports of maize however haveremained steady at an average 50-60,000 MT. Human consumption of maize isestimated still to account for about 802 of total use.
4.07 It is estimated that the physical per capita availability of food-stuffs in 1986 was 202 below its 1976 level. This was 42 better than thelow point in 1982 and the apparent per capita availability of some keyenergy foods was actually above pre-1980 levels. It was also better thanthe performance of overall private consumption expenditure, which declinedby a third (per capita) from 1978 to 1987, reflecting the fact that foodconsumption is not very income-elastic. But 1986 average value of food
1/ Basic grains pay only a 12 tariff, and are protected throughquantitative restrictions.
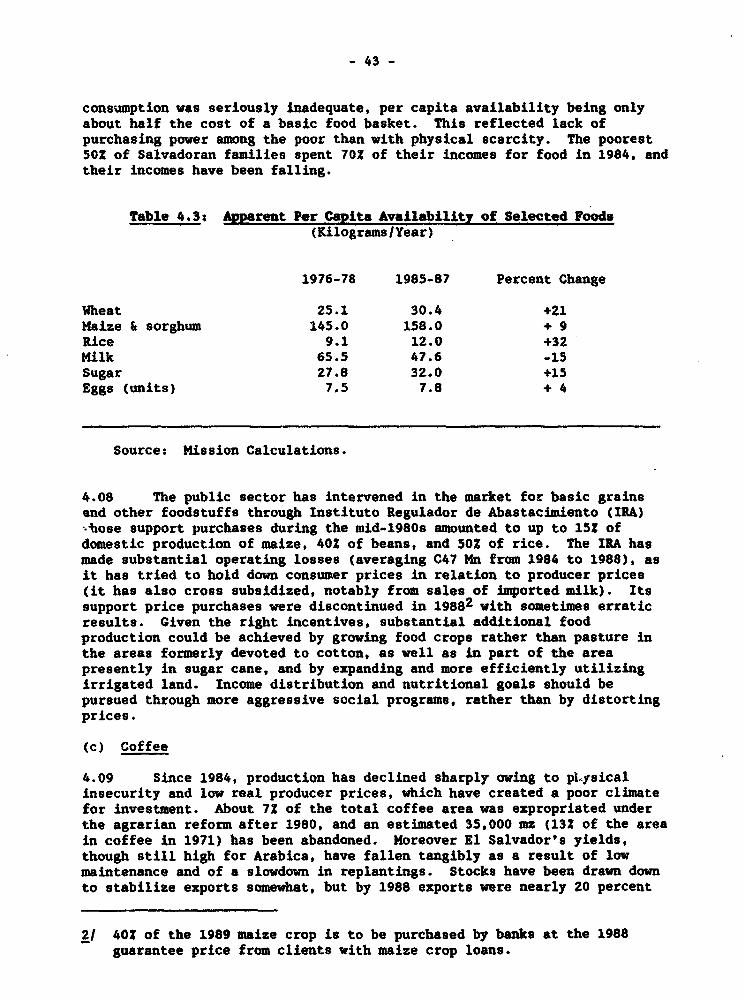
- 43 -
consumption was seriously inadequate, per capita availability being onlyabout half the cost of a basic food basket. This reflected lack ofpurchasing power among the poor than with physical scarcity. The poorest502 of Salvadoran families spent 702 of their incomes for food in 1984, andtheir incomes have been falling.
Table 4.3s parent Per Capita Availability of Selected Foods(Kilograms/Year)
1976-78 1985-87 Percent Change
Wheat 25.1 30.4 +21Maize & sorghum 145.0 158.0 + 9Rice 9.1 12.0 +32Milk 65.5 47.6 -15Sugar 27.8 32.0 +15Eggs (units) 7,5 7.8 + 4
Source: Mission Calculations.
4.08 The public sector has intervened in the market for basic grainsand other foodstuffs through Instituto Regulador de Abastacimiento (IRA)itose support purchases during the mid-1980s amounted to up to 152 ofdomestic production of maize, 402 of beans, and 502 of rice. The IRA hasmade substantial operating losses (averaging C47 Mn from 1984 to 1988), asit has tried to hold down consumer prices in relation to producer prices(it has also cross subsidized, notably from sales of imported milk). Itssupport price purchases were discontinued in 19882 with sometimes erraticresults. Given the right incentives, substantial additional foodproduction could be achieved by growing food crops rather than pasture inthe areas formerly devoted to cotton, as well as in part of the areapresently in sugar cane, and by expanding and more efficiently utilizingirrigated land. Income distribution and nutritional goals should bepursued through more aggressive social programs, rather than by distortingprices.
(c) Coffee
4.09 Since 1984, production has declined sharply owing to pLysicalinsecurity and low real producer prices, which have created a poor climatefor investment. About 72 of the total coffee area was expropriated underthe agrarian reform after 1980, and an estimated 35,000 mz (132 of the areain coffee in 1971) has been abandoned. Moreover El Salvador's yields,though still high for Arabica, have fallen tangibly as a result of lowmaintenance and of a slowdown in replantings. Stocks have been drawn downto stabilize exports somewhat, but by 1988 exports were nearly 20 percent
21 402 of the 1989 maize crop is to be purchased by banks at the 1988guarantee price from clients with maize crop loans.
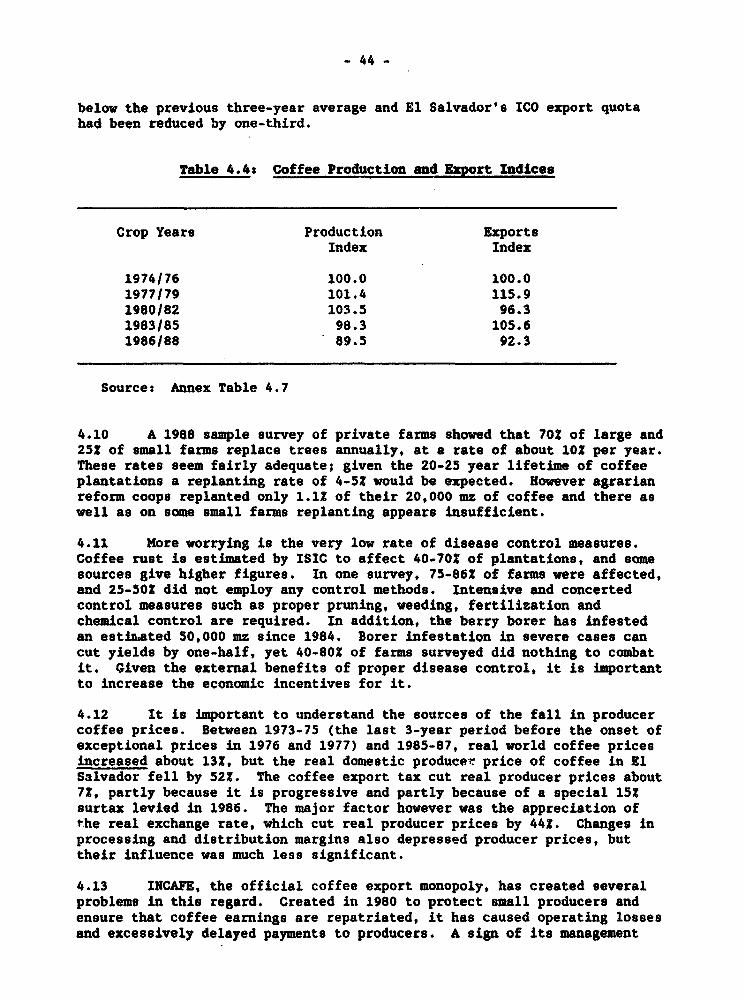
- 44 -
below the previous three-year average and El Salvador's ICO export quotahad been reduced by one-third.
Table 4.4s Coffee Production and Export Indices
Crop Years Production ExportsIndex Index
1974176 100.0 100.01977179 101.4 115.91980/82 103.5 96.31983185 98.3 105.61986188 89.5 92.3
Sources Annex Table 4.7
4.10 A 1988 sample survey of private farms showed that 70? of large and25? of small farms replace trees annually, at a rate of about 102 per year.These rates seem fairly adequate; given the 20-25 year lifetime of coffeeplantations a replanting rate of 4-52 would be expected. However agrarianreform coops replanted only 1.12 of their 20,000 mz of coffee and there aswell as on some small farms replanting appears insufficient.
4.11 More worrying is the very low rate of disease control measures.Coffee rust is estimated by ISIC to affect 40-70? of plantations, and somesources give higher figures. In one survey, 75-86Z of farms were affected,and 25-50? did not employ any control methods. Intensive and concertedcontrol measures such as proper pruning, weeding, fertilization andchemical control are required. In addition, the berry borer has infestedan estimated 50,000 mz since 1984. Borer infestation in severe cases cancut yields by one-half, yet 40-80 of farms surveyed did nothing to combatit. Given the external benefits of proper disease control, it is importantto increase the economic incentives for it.
4.12 It is important to understand the sources of the fall in producercoffee prices. Between 1973-75 (the last 3-year period before the onset ofexceptional prices in 1976 and 1977) and 1985-87, real world coffee pricesincreased about 132, but the real domestic producer price of coffee in ElSalvador fell by 522. The coffee export tax cut real producer prices about7Z, partly because it is progressive and partly because of a special 152surtax levied in 1986. The major factor however was the appreciation ofthe real exchange rate, which cut real producer prices by 44Z. Changes inprocessing and distribution margins also depressed producer prices, buttheir influence was much less significant.
4.13 INCAFE, the official coffee export monopoly, has created severalproblems in this regard. Created in 1980 to protect small producers andensure that coffee earnings are repatriated, it has caused operating lossesand excessively delayed payments to producers. A sign of its management
- 45 -
and financial problems is that its latest public financial report is for1983. INCAfE appears to be a reasonably efficient international marketingorganization, supplying an uniform quality and selling by forward contractto avoid the dangers of speculation, but it is not clear that it is givingbenefits commensurate with its cost. As long as coffee exports are withinthe framework of ICO quotas, there will be a need for some mechanism toavoid collusion by producers to control the quotas and protect smallfarmers. However it is not necessary to have a state monopoly of exportsto achieve this; a quota auction with wide participation could offer aneconomically efficient mechanism both for quota allocation and to collectthe export tax. It is recommended that the government study this and otheralternatives to the present institutional structure, such as cooperativemarketing for small producers.
4.14 Producers would obtain far more relief from a devaluation of thereal exchange rate than from revising the marketing practices of theofficial coffee export monopoly INCAFE. El Salvador has relatively littlescope to expand the area under coffee, which means that most futureincreases in output will have to come from enhanced productivity.Investment profitability would be greatly enhanced by a devaluation asimported inputs, on an efficiently run plantation, represent only about 20Xof total costs. But because of the long-term nature of coffee investment,input subsidies and concessionary interest rates on loans are of doubtfulvalue. At current prices and wages, there is still a substantial incentivefor investing in productivity enhancement using labor-intensive techniques.
(d) Other Products
4.15 El Salvador has little comparative advantage in sugar; cane yieldsare low (and have fallen 10? since 1980) because most of it is grown onrainfed marginal land. Cane is grown under contract to the sugar mills,and 402 of production is under the control of cooperatives. Since 1980 allmarketing and domestic pricing have been under the control of INAZUCAR, apublic corporation which also operates 5 out of the 10 sugar mills. Thebulk of sales are now in the domestic market (69Z in 1986-88 as against 44?in 1974-76), since world prices make exports mainly unprofitable.3 INAZUCARhas made substantial losses over the years, and in late 1988 owed the BCRC133 million. The main reasons have been low world prices and low non-quota exports which reduced capacity utilization, particularly in the early19808.
4.16 It is urgent that the sugar sector be restructured in view of thepoor long-term prospects for international prices. While devaluation wouldprovide some relief, access to the US market is likely to continue todecline and the marginal costs of efficient producers will determine thefree market price. There is little need for public sector production orcontrol of marketing, and further public investment or fiscal losses in thesector should be avoided. The role of INAZUCAR should probably be reducedto statistics and market information and allocation of shares in the USsugar quota. It would sell to the private sector its sugar mills and
31 El Salvador still has some access to the US quota market at prices wellabove the world levels in 1988 the regular quota was 19,000 tons, butan additional 9,000 was also given.

- 46 -
distilleries and end its market operations and price fixing. It is notclear that the domestic market price can be allowed to fall to world levelswithout eliminating domestic production, however, and tariff protection maybe required.
4.17 Current plans to distill alcohol as a fuel additive areeconomically and financially wasteful. The estimated cost of US$1.70 pergallon is well above that of largely loss-making fuel alcohol programs inother countries - over double that in Brazil for example - and it isextremely unlikely that El Salvador would have a comparative advantage inthis activity even after a major devaluation. Current excess milling anddistilling capacity may hold down marginal costs, but domestic demand isincreasing at about 3.52 a year and excess capacity will not persistindefinitely. Also a devaluation would increase the opportunity cost ofcane land for other crops.
4.18 Cotton production in 1987-88 was only 142, and exports only 32 ofthat in 1978-1979. Due to its location it was the most vulnerable crop toguerilla action. Producer prices also fell steeply; only about 25Z ofgrowers would have positive returns at current export prices (US$65 toUS$70 per cwt) and prevailing ginning and marketing charges. COPAL, theprivately-owned growers cooperative, retains monopoly trading rights thatdistort incentives and could threaten the textiles industry. There islittle rationale for these privileges, which should be abolished. Thecoastal plains where cotton was grown extensively were seriouslycontaminated by aerial insecticide spraying. The poisonous runoff willthreaten marine life for decades and has affected the health of numerousfarm worker families. Though there is a potential for the adoption of low-input methods of cultivation, pollution adds to the economic and socialcosts of cotton, and must be given serious consideration in any plan forits revival.
4.19 Fruit and vegetables offer opportunities for export diver-sification, efficient import substitution and rural income generation.Production and export to the US of cantaloupe and honeydew melons areincreasing, with US$26 million of exports expected in 1989. There are alsoexport prospects for watermelons, cucumbers, and pineapples. All existingand prospective non-traditional export crops except pineapples, cashewnuts, coconuts and soybeans however require irrigation, and growth willlargely depend on improving public sector irrigation policies and planning.
4.20 Fishery products appear to have a substantial export potential.Coastal aquaculture seems to have the best prospects in the medium term,with an estimated potential for 8,000 hectares of salt water shrimp andlangostino ponds. Freshwater shrimp cultivation is also said to have agood potential but is apparently receiving less attention. The much largercoastal industrial shrimping industry is affected by over-fishing.
B. Institutional Issues
(a) Price and Commodity Policies
4.21 During the past decade there have been major increases inintervention by several government agencies, through state trading,
- 47 -
subsidies, price controls and quantitative trade restrictions. Though onlymilk is under quota, there are import targets for staple foods that competewith domestic produce, set by the MAG4 and implemented either through IRAimports or by the Ministry of Economy (ME). The ME also sets priceceilings and import and export targets for edible oils, butter andmargarine, cottonseed and basic grains, "mediates" price setting forcotton, chickens and eggs and fertilizer, and sets trading margins forinfant dried milk and on sardines and mackerel. INCAFE and INAZUCARmonopolize trade in their respective products, and the BFA and INCAFE havesubstantial shares of the market for fertilizers and agrochemicals. Theintervention of these diverse agencies weakens the planning andcoordinating role of the MAG itself.
4.22 One area where there have been moves to liberalize the systemrecently is IRA buying and selling of basic food staples, which was stoppedin 1988. This was in some respects a positive experience; grain pricesheld up well under a bumper maize crop. Yet it is hazardous to liberalizepartially in the midst of so many other controls, particularly quantitativecontrols on imports, and agricultural protection needs to be converted toexplicit tariffs. Because of the inelastic nature of supply in the shortrun there is otherwise a risk of scarcities and wide price fluctuations.It is important that the public sector refrain from further intervention inthe market through price controls, and complement the actions already takenby permitting imports over a moderate, explicit tariff. The public sectorneeds to review thoroughly its role in the markets for agricultural inputsand outputs, particularly as it changes the rules for external trade inother sectors. As highly-protected import substitutes, the prices of basicgrains in particular could suffer more as a result of liberalization thanthey will gain from devaluation.
(b) The Agrarian Reform
4.23 Concentrated land ownership has been a fundamental social ancdeconomic issue in El Salvador for decades, and large scale land transferswere made after 1980 to address it. By the end of 1988 the transfers weremainly complete, with the results shown in Table 4.5. The proportions ofthe rural poor and of total farmland affected were less than intendedbecause Phase II, comprising properties over 143 mz (100 ha), was virtuallyannulled by the 1983 Constitution,5 and except for sugar cane and cotton,only a small proportion of good quality land was transferred. While thereform reduced the upper limit of holding size, roughly 12 of all propertyowners (2200) continue to hold 502 of the land, while 952 own only 302.
4/ Amounts are fixed at the beginning of the marketing year with theinformal participation of producer and processor representatives.
5/ The Constitution mandated a maximum holding size of 245 ha. and allowedexcess holdings to be sold over two years.
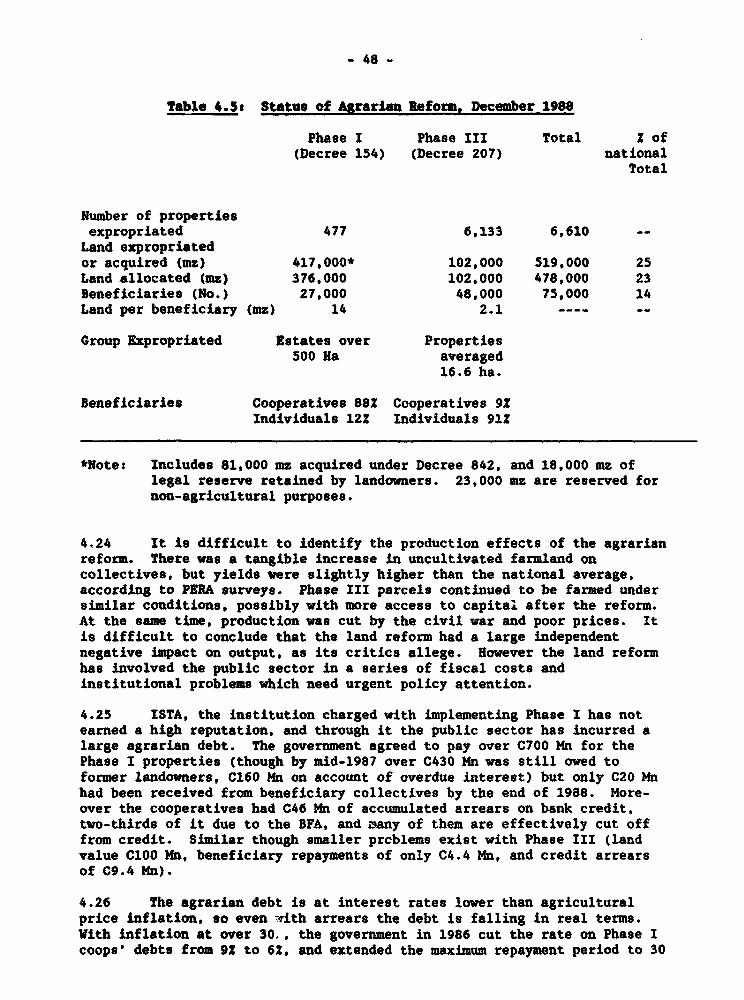
- 48 -
Table 4.53 Status of Agrarian Reform, December 1988
Phase I Phase III Total Z of(Decree 154) (Decree 207) national
Total
Number of propertiesexpropriated 477 6,133 6,610 --
Land expropriatedor acquired (maz) 417,000* 102,000 519,000 25Land allocated (mz) 376,000 102,000 478,000 23Beneficiaries (No.) 27,000 48,000 75,000 14Land per beneficiary (mz) 14 2.1 ---- --
Group Expropriated Estates over Properties500 Ha averaged
16.6 ha.
Beneficiaries Cooperatives 88Z Cooperatives 9ZIndividuals 12X Individuals 91t
*Note: Includes 81,000 mz acquired under Decree 842, and 18,000 mz oflegal reserve retained by landowners. 23,000 mz are reserved fornon-agricultural purposes.
4.24 It is difficult to identify the production effects of the agrarianreform. There was a tangible increase in uncultivated farmland oncollectives, but yields were slightly higher than the national average,according to PERA surveys. Phase III parcels continued to be farmed undersimilar conditions, possibly with more access to capital after the reform.At the same time, production was cut by the civil war and poor prices. Itis difficult to conclude that the land reform had a large independentnegative impact on output, as its critics allege. However the land reformhas involved the public sector in a series of fiscal costs andinstitutional problems which need urgent policy attention.
4.25 ISTA, the institution charged with implementing Phase I has notearned a high reputation, and through it the public sector has incurred alarge agrarian debt. The government agreed to pay over C700 Mn for thePhase I properties (though by mid-1987 over C430 Mn was still owed toformer landowners, C160 Mn on account of overdue interest) but only C20 Mnhad been received from beneficiary collectives by the end of 1988. More-over the cooperatives had C46 Mn of accumulated arrears on bank credit,two-thirds of it due to the BFA, and many of them are effectively cut offfrom credit. Similar though smaller problems exist with Phase III (landvalue C100 Mn, beneficiary repayments of only C4.4 Mn, and credit arrearsof C9.4 Mn).
4.26 The agrarian debt is at interest rates lower than agriculturalprice inflation, so even -ith arrears the debt is falling in real terms.With inflation at over 30., the government in 1986 cut the rate on Phase Icoops' debts from 92 to 62, and extended the maximum repayment period to 30
- 49 -
years. The fact that many cooperatives are not servicing these debts is anindicator of severe management problems. Rather than continued publicsector subsidies, they need training and management reforms. The mostimportant measures are, internally, to introduce tangible property rightsfor members and a means of deciding whether to continue with jointownership or apply for individual titles. Externally, they need betterfinancial arrangements for basic social services now being charged tooverhead, and a restructuring of credit arrears. Agrarian reformbeneficiaries also need stronger technical and financial support, perhapsthrough non-governmental institutions.
4.27 Several new land redistribution programs have been initiatedtapproximately 110,000 mz of abandoned properties are being settled bydisplaced families on small plots. A land bank began operations inFebruary, 1988, to help implement voluntary subdivision of remaining largeestates. Initial funding of C20m was committed by USAID but none of thismoney has been released. The proposal to convert FINATA to a permanentland bank merits support, and would be particularly worthwhile if aneffective land tax were also introduced. Such a tax would not onlystimulate land sales, but also force producers to make efficient use ofthis scarce and valuable resource.
(c) Agricultural Credit
4.28 Agricultural lending is in crisis. Total credit outstanding tothe agricultural sector in 1987 was only half its 1983 level in real terms,and loan arrears are serious, particularly for the Agricultural DevelopmentBank (BFA), whose delinquency rate is around 55?. Public sector lendingfor the agrarian reform has become a serious fiscal problem. Severalreforms are necessary. BCR lending quotas should be relaxed, leaving newshort-term credit decisions to depend on the credit rating of eachenterprise, and investment credit on project viability. Ceilings on loaninterest are from 13 to 17 percentage points below the rate of inflation,discouraging lending and encouraging inefficient use of credit, and need tobe increased. The spread between the regulated deposit and lendinginterest rates is too narrow, and the two major banks in the rural sector,the BPA and the BH, make more money with commodity imports - both foodunder PL 480 and farm inputs - than from lending operations. More effortsare needed to attract deposits in rural areas.
(d) Irrigation
4.29 Irrigated land is severely underutilized primarily because therelatively adequate existing water legislation is very poorly implemented,water user charges are too low to promote intensive water and land use, andin general water users' associations function poorly. Action to improvemanagement of the 35,000 ha. of existing irrigated land, and to bring moreof the additional irrigable area (perhaps 260,000 ha.), under irrigationcould make a contribution to agricultural growth. Competition amongvarious water uses is strong, so there should be a review of policies topromote efficient land and water use before undertaking major investment innew irrigation projects. Potential large projects have been identified fora total of 180,000 ha. using surface water sources, and groundwaterresources are already being exploited for small-scale projects. 70? of the
- 50 -
already irrigated area is in the possession of agrarian reform collectives,and former monopolies on the land in the most promising remaining areashave been removed. Private sector development of irrigation is important,given the limited implementation capacity of the public sector, but canonly be expected to develop when physical and land tenure security improve.
(e) Environment
4.30 The main current environmental problem is deforestation. Onlythree percent of the country is forested today and 902 of El Salvador'sconsumption of forest products is imported. Firewood is said still tofurnish 60% of the country's energy consumption, and large areas ofvulnerable land are being cultivated. Consequently soil erosion is severeand some areas are already irretrievably degraded, increasing the pressureon remaining land and siltation of reservoirs. In addition mangroveforests have been decimated by developers and cotton planters, destroyingthe breeding areas of shrimp and other marine life. Other problems includesoil contamination by long-term excessive application of insecticides tocotton, which will take decades to disappear because of the persistence inthe soil of the main chemicals, and pollution of rivers and lakes withuntreated industrial and urban effluents.
4.31 Within the agricultural sector, technical remedies includeemphasis on minimum tillage, cotton growing with non-chemical pest control,incentives for private reforestation, and integrated watershed managementplans for agricultural, forestry, hydro power and water supply institu-tions, including treatment of urban sewage. There are some successful butisolated initiatives, but there is no central policy direction, and untilrecently non-governmental organizations have little influence. Someadditional legislation is needed, but above all the application of laws andregulations already on the books, such as the control of the remainingmangrove forests which were nationalized in the 19708.
C. Policy Recommendations
4.32 The agricultural sector is of fundamental importance in theSalvadoran 3conomy, in terms of exports, income generation, employment andfiscal revenues. Nonetheless agriculture remains in deep trouble. Outputcontinued to fall from 1982 to 1987, when the rest of the economy wasbeginning to recover, a decline in coffee yields has set in and exports arefalling. Public sector intervention has been very costly, and cannot besustained in its present form. Many farms cannot service their debts tothe banking system. And agricultural prices, after a respite in 1986, havecontinued to fall in real terms. The sector thus poses a major policychallenge. It will be vital for growth and welfare to restore its role asan an employer, an earner of foreign exchange and a provider of food tomeet domestic needs. Substantial relief can be expected from improvedmacroeconomic policies, in particular a real devaluation. But the sectorwill need a careful overhaul of government policies and institutions if itis to take full advantage of such opportunities.
- 51 -
4.33 In order to expand and diversify exports, improve economic efliiciency and provide rural employment, El Salvador needs to concentrate onthose products where it enjoys a comparative advantage, particularlycoffee, fruit and vegetables, fishery products and some basic grains.These areas will all be benefitted by freeing up prices and trade in thesector. At the same time, several subsectors where production is high-costand inefficient - such as sugar or livestock - will likely decline.Indeed, the overall price level received by farmers could decline in realterms if trade liberalization proceeds too rapidly. As can be seen fromFigure 4.1, producer prices are somewhat above the level warranted by worldprices and the real effective exchange rate. To avoid unnecessarydisruption, the reduction of tariff protection for import-substitutesshould be spread over several years.
4.34 The sector is in need of more technical assistance rather thancredit subsidies. A reduction in the rate of inflation and the consequentfall in nominal interest rates would also stimulate output. In view of thespecial problems of food security, import quotas should be replaced withduties to achieve moderate, explicit levels of protection fer basic grains.IRA should be kept out of selling basic grains.
4.35 There are also considerable institutional problems. There isexcessive dispersion of control among different agencies, weakening theM4AG, and several of the post-1980 agencies need to be abolished. As inother sectors, the squeeze on public sector real wages has resulted inlosses of qualified agricultural staff, and lack of security and thedecline in non-wage current spending sharply limits their mobility.Management of the agrarian reform collectives needs to be improved, andthis may well involve the voluntary liquidation of many of them. Theadministration of agricultural credit will have to be brought into linewith commercial practices in most respects. This will involve ending mostinput subsidies to producers.
4.36 Several important changes will be needed in the external traderegime for agriculture. Due to the complex mixture of non-tariff barriersand restrictions, a first stage should be to simplify protection to a setof ad valorem tariffs with an equivalent impact on domestic prices. Thiswould increase both the transparency of the system and government taxrevenues. A second stage would be to reduce such of these tariff barriersas are excessively high, following the guiuelines suggested in Chapter III.In the case of agricultural products, special consideration may be neededin the design of tariffs, due to the variability of world market prices, toshield domestic producers from excessive price risks.
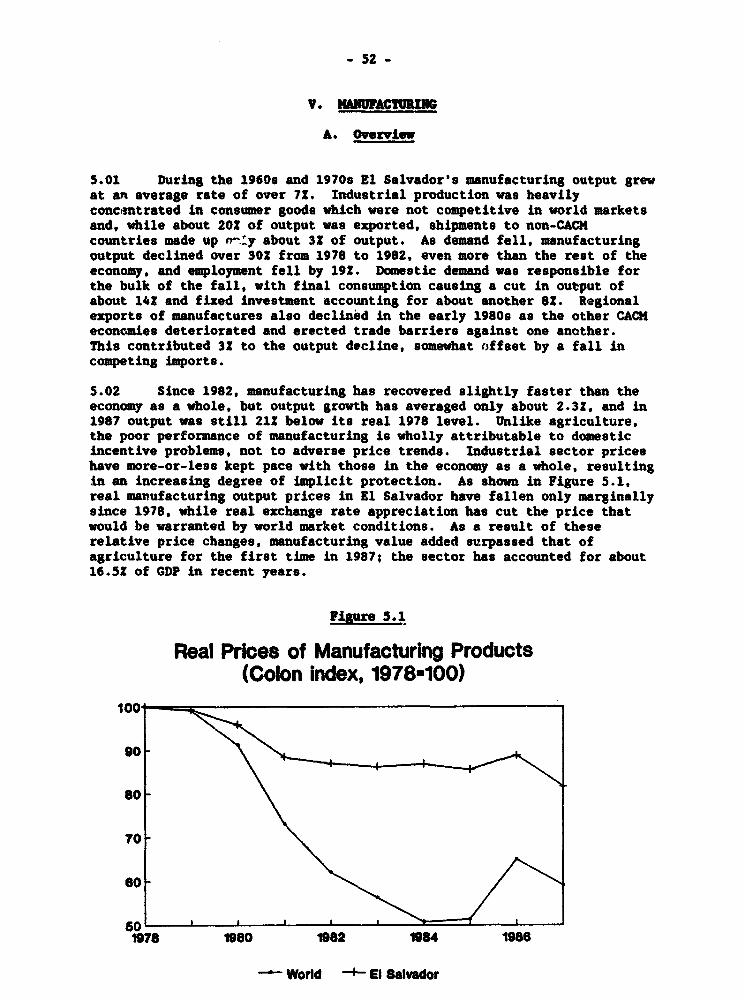
- 52 -
V. HAUACTUDE
A. Overview
5.01 During the 19609 and 1970s E1 Salvador's manufacturing output grewat an average rate of over 72. Industrial production was heavilyconcintrated in consumer goods which were not competitive in world marketsand, while about 202 of output was exported, shipments to non-CACHcountries made up P--y about 32 of output. As demand fell, manufacturingoutput declined over 302 from 1978 to 1982, even more than the rest of theeconomy, and employment fell by 192. Domestic demand was responsible forthe bulk of the fall, with final consumption causing a cut in output ofabout 142 and fixed investment accounting for about another 82. Regionalexports of manufactures also declined in the early 1980s as the other CACMeconomies deteriorated and erected trade barriers against one another.This contributed 32 to the output decline, somewhat offset by a fall incompeting imports.
5.02 Since 1982, manufacturing has recovered slightly faster than theeconomy as a whole, but output growth has averaged only about 2.32, and in1987 output was still 212 below its real 1978 level. Unlike agriculture,the poor performance of manufacturing is wholly attributable to domesticincentive problems, not to adverse price trends. Industrial sector priceshave more-or-less kept pace with those in the economy as a whole, resultingin an increasing degree of implicit protection. As shown in Figure 5.1,real manufacturing output prices in E1 Salvador have fallen only marginallysince 1978, while real exchange rate appreciation has cut the price thatwould be warranted by world market conditions. As a result of theserelative price changes, manufacturing value added sutrpassed that ofagriculture for the first time in 1987; the sector has accounted for about16.52 of GDP in recent years.
Figure 5.1
Real Prices of Manufacturing Products(Colon index, 1978-100)
100-
70 ,
80 -
1978 1980 1982 1984 1988
World B- El Salvador
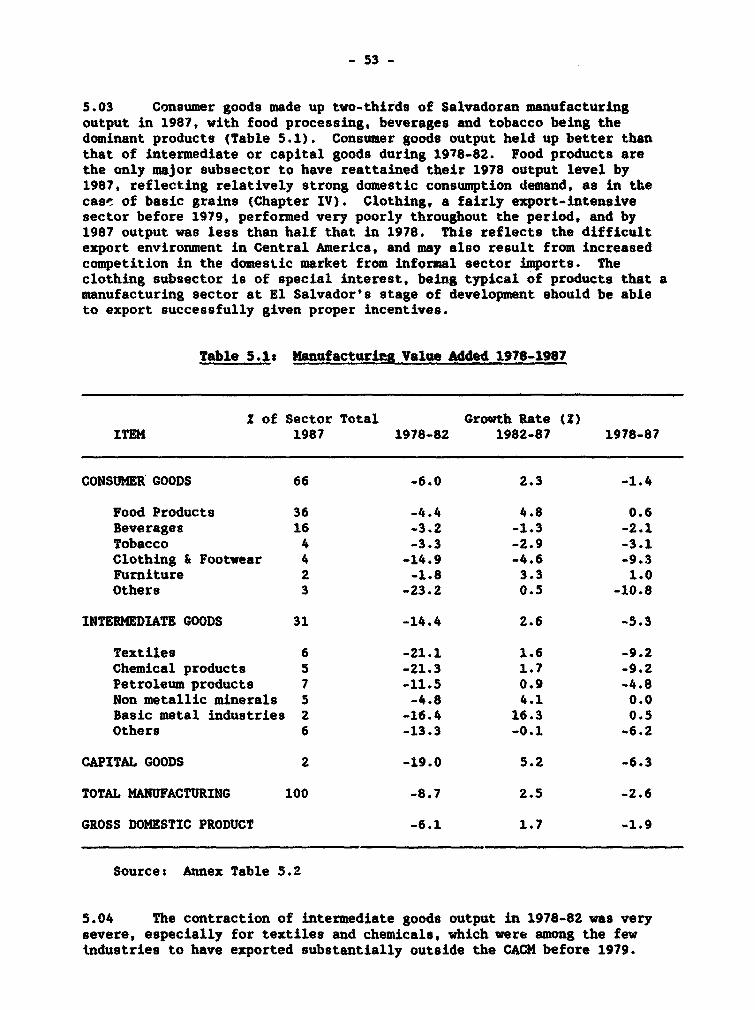
- 53 -
5.03 Consumer goods made up two-thirds of Salvadoran manufacturingoutput in 1987, with food processing, beverages and tobacco being thedominant products (Table 5.1). Consumer goods output held up better thanthat of intermediate or capital goods during 1978-82. Food products arethe only major subsector to have reattained their 1978 output level by1987, reflecting relatively strong domestic consumption demand, as in thecas'! of basic grains (Chapter IV). Clothing, a fairly export-intensivesector before 1979, performed very poorly throughout the period, and by1987 output was less than half that in 1978. This reflects the difficultexport environment in Central America, and may also result from increasedcompetition in the domestic market from informal sector imports. Theclothing subsector is of special interest, being typical of products that amanufacturing sector at El Salvador's stage of development should be ableto export successfully given proper incentives.
Table 5.1: Manufacturinr Value Added 1978-1987
X of Sector Total Growth Rate (Z)ITEH 1987 1978-82 1982-87 1978-87
CONSUMER GOODS 66 -6.0 2.3 -1.4
Food Products 36 -4.4 4.8 0.6Beverages 16 -3.2 -1.3 -2.1Tobacco 4 -3.3 -2.9 -3.1Clothing & Footwear 4 -14.9 -4.6 -9.3Furniture 2 -1.8 3.3 1.0Others 3 -23.2 0.5 -10.8
INTERMEDIATE GOODS 31 -14.4 2.6 -5.3
Textiles 6 -21.1 1.6 -9.2Chemical products 5 -21.3 1.7 -9.2Petroleum products 7 -11.5 0.9 -4.8Non metallic minerals 5 -4.8 4.1 0.0Basic metal industries 2 -16.4 16.3 0.5Others 6 -13.3 -0.1 -6.2
CAPITAL GOODS 2 -19.0 5.2 -6.3
TOTAL MANUFACTURING 100 -8.7 2.5 -2.6
GROSS DOMESTIC PRODUCT -6.1 1.7 -1.9
Sources Annex Table 5.2
5.04 The contraction of intermediate goods output in 1978-82 was verysevere, especially for textiles and chemicals, which were among the fewtndustries to have exported substantially outside the CACM before 1979.
- 54 -
Unlike agriculture, it thus appears that even access to world markets didnot enable any part of manufacturing to escape the general decline in theeconomy. Apart from basic metals and non-metallic minerals (mainly relatedto construction demand) the growth performance of intermediate goods hasalso been very weak since 1982.
5.05 The domestic supply problems underlying the poor performance ofmanufacturing in the 1580s fall broadly into three categories, namely war-related disruption of investment and production, the trade regime andconsequent dependance on the domestic market, and other incertivedistortions. In the first area, the risks posed by the civil war raisedthe cost of capital appreciably in the early 1980s, causing a one-time lossof output as part of the capital stock became unprofitable, and cutting thegrowth rate by reducing the attractiveness of investment. The efficiencyof manufacturing investment fell as indicated by an ICOR of about 4.6since 1983, well above the pre-crisis level of 3.0. This is partly theautomatic result of slower growth (which cuts the ratio of new capacitycreation to replacement investment), and may also reflect fasterdepreciation in the 1980s as a result of war damage and uncertainty.
5.06 The effects of the trade regime on incentives in manufacturing aremany and far-reaching, and it constitutes the most important constraint onmanufacturing growth. Its consequences include a strong bias againstmanufactured exports outside the CACM, which must be reduced or eliminatedif El Salvador is to diversify and expand foreign exchange earnings. Onlywith rapid export growth can the country sustain growth in per capitaincomes. The other major incentive distortion lies in the provision ofcredit to manufacturing. Originally designed to stimulate investment andgrowth, credit subsidies have instead reduced the efficiency of investment,reduced the degree of equit7 financing and cut the labor-intensity ofmanufacturing production.
S. Trade Regime
5.07 Adopted in the context of regional integration in the 19609,import substitution policies have been continued in the 19809 despite theerection of trade barriers within the CACM. The amall scale of theremaining protected (domestic) market has accentuated the well-knownproblems of these policies, including anti-export bias, discouragement ofintermediate goods production and strong incentives for low value-addedassembly operations, to cut the growth of the manufacturing sector. Theappreciation of the real exchange rate during the 19809 has further biasedincentives against all tradeable goods. The protected market ib now sosmall and constrained that it affords few profitable opportunities forgrowth. Policies to encourage sustainable manufacturing growth thereforeneed to start with trade policy changes in several major areas, includingreal devaluation and trade liberalization.
5.08 As mentioned (Chapter III) consumer goods manufacturing enjoys thehighest rates of legal tariff protection, and benefits from discriminatorySCT treatment. While overall legal tariff protection has fallen, its biasin favor of consumer goods has increased since 1982. Average legalprotection on manufactured consumer goods has fallen from 812 to 53Z, whilethat on intermediate goods has fallen from 44Z to 23Z, and the ratio has
- 55 -
increased from 1.8 to 2.3. Consumer goods also seem to have receivedincreasing implicit protection, as the value-added deflator for consumergoods increased somewhat faster (252 on average) than that of manufacturedgoods as a whole (17!) from 1982 to 1987. As in many other Latin Americancountries, much of the protection on consumer goods is redundant. It hasalso become increasingly ineffective due to contraband imports of consumergoods (funded by private remittances).
5.09 By contrast, non-traditional exports cannot benefit from tariffprotection, and suffer a loss in competitiveness from the rise in the pricelevel due to protection for import substitutes (in Table 3.5, theireffective protection is estimated at -32). Faced with this pattern ofincentives, it is not surprising that non-traditional exports - which aremainly manufactures - have performed so poorly. Their volume shrankcontinuously from 1980 to 1986, mainly in response to the loss of protectedmarkets in Central America. Non-traditional exports outside the region didbegin to recover in 1984 - perhaps in reflection of exporters' access to apreferential exchange rate - but lagged behind those of other CentralAmerican countries.
5.10 Salvadoran manufacturing wages are very competitive. In 1987 theywere the lowest in the CACM (outside Nicaragua), and among the lowest inthe CBI region, comparable with those in Haiti and the Dominican Republic.The reason for this is the rapid decline in manufacturing real wages since1984. After rising about 102 in 1980, real wages remained high up to 1982,then fell back to their 1978 level by 1984. Since then they have declinedsteadily, and by 1987 they were over 302 below their 1978 level. Theresult has been a restoration of the relative wage position El Salvadorenjoyed in the late 19709 (Figure 1.3).
5.11 El Salvador's wage competitiveness has to some extent been offsetby lower manufacturing productivity. Net output per employee fell by 18%between 1978 and 1983, and by 1987 was still 112 below its 1978 level. Themajor irreversible factor contributing to this has been the loss of skillsdue to emigration. Emigrants have tended to come from the urban areas andto have more education than the average for the population as a whole (8.7years versus 6.4 years). Other factors depressing productivity, such asshort-time working and the fall in real wages itself, will largely unwindas economic activity increases. Labor disputes, which increased rapidly inthe crisis years, are now less prevalent than in the early 1980s. Thoughat current output manufacturers do not report labor shortages, skills willbe a constraint if the manufacturing sector begins to grow again at therates seen in the 1970s, and increased policy attention is needed tovocational training (see Chapter VI).
5.12 The 1986 export incentives law attempts to counter the anti-exportbias of incentives. Howe; r the level of tariffs on competing products issuch that incentives remaLt strongly biased in favor of import substitu-tion. Also some of the same tax exemptions were given in the past forsectoral development purposes; for instance 10OZ import duty exemptions areavailable to industries such as tourism and fisheries, and are thought toapply to metals, handicrafts, cooperatives, livestock and various media
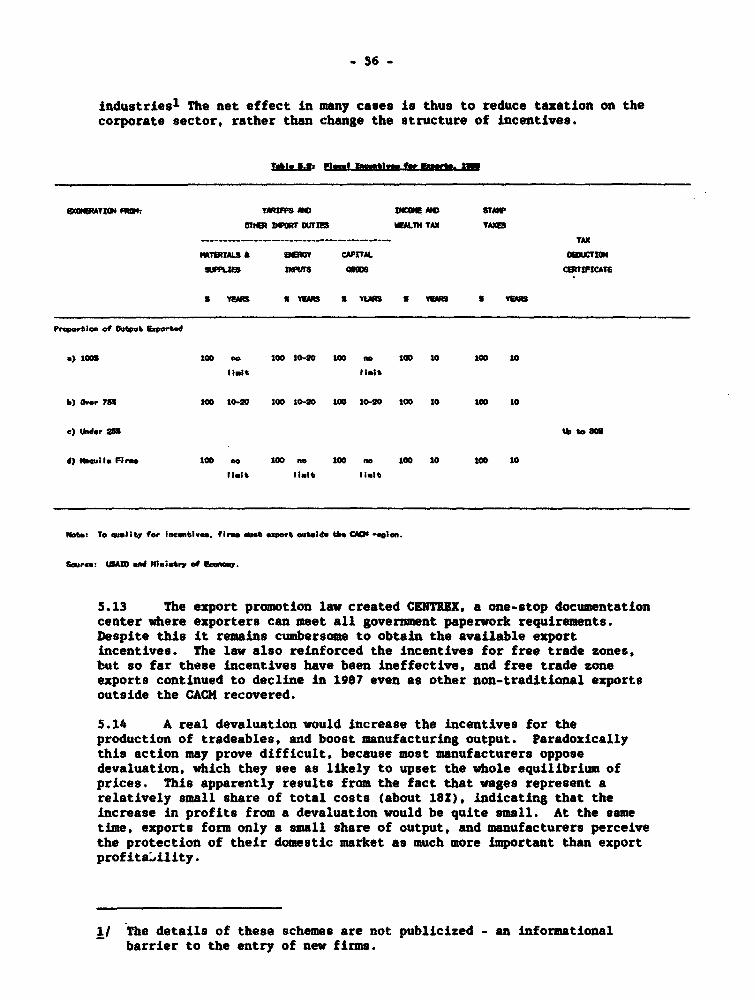
- 56 -
industriesl The net effect in many cases is thus to reduce taxation on thecorporate sector, rather than change the structure of incentives.
SOWA? TMM D vE AM STwa
CUM DCW mffWT WALTH TAX TAMI
-_ -----_ --- - -------- ------ TAX
UT5IMS a DOw CAPITAL mtw
SWU"I IlI 0S COCA1TE
I YENS SWam 5 TW * v_ * WI M
PraprSettn of Output Exported
a) 101s 100 1-20 100 no 0oo 10 100 10
b) Over 753 100 10-20 100 10-20 10o 10-20 t0o 10 1oo 10
a) Under 25 to so
d) Rauwl I Firm 100 no 100 no 100 no 100 10 1oo 10
*Intt lisit hlmt
Hes:t To xual itV for inauntive. firm mot export outside tbe CM" -eion.
Seue: WAI1D en NiutrZty of .- ,.
5.13 The export promotion law created CENTREX, a one-stop documentationcenter where exporters can meet all government paperwork requirements.Despite this it remains cumbersome to obtain the available exportincentives. The law also reinforced the incentives for free trade zones,but so far these incentives have been ineffective, and free trade zoneexports continued to decline in 1987 even as other non-traditional exportsoutside the CACM recovered.
5.14 A real devaluation would increase the incentives for theproduction of tradeables, and boost manufacturing output. Paradoxicallythis action may prove difficult, because most manufacturers opposedevaluation, which they see as likely to upset the whole equilibrium ofprices. This apparently results from the fact that wages represent arelatively small share of total costs (about 18X), indicating that theincrease in profits from a devaluation would be quite small. At the sametime, exports form only a small share of output, and manufacturers perceivethe protection of their domestic market as much more important than exportprofitaAility.
1/ The details of these schemes are not publicized - an informationalbarrier to the entry of new firms.
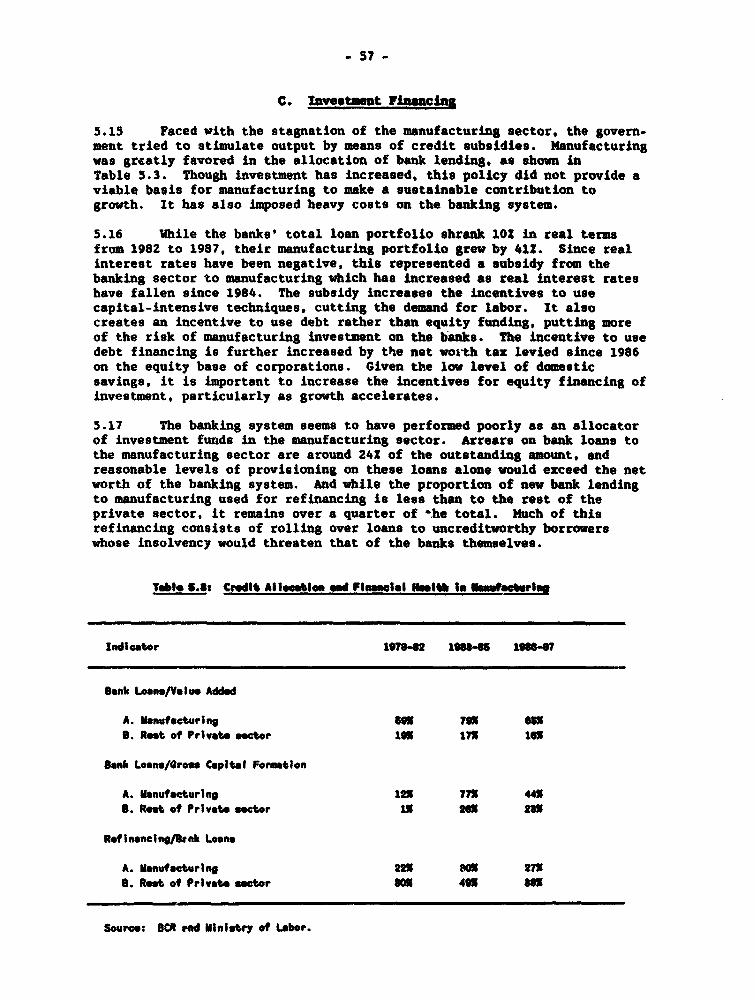
- 57 -
C. Iavestusut rFiascias
5.15 Faced with the stagnation of the manufacturing sector, the govern-ment tried to stimulate output by means of credit subsidies. Manufacturingwas greatly favored in the allocation of bank lending, as shown inTable 5.3. Though investment has increased, this policy did not provide aviable basis for manufacturing to make a sustainable contribution togrowth. It has also imposed heavy costs on the banking system.
5.16 While the banks' total loan portfolio shrank 1OZ in real termsfrom 1982 to 1987, their manufacturing portfolio grew by 411. Since realinterest rates have been negative, this represented a subsidy from thebanking sector to manufacturing which has increased as real interest rateshave fallen since 1984. The subsidy increases the incentives to usecapital-intensive techniques, cutting the demand for labor. It alsocreates an incentive to use debt rather than equity funding, putting moreof the risk of manufacturing investment on the banks. The incentive to usedebt financing is further increased by the net woith tax levied since 1986on the equity base of corporations. Given the low level of domesticsavings, it is important to increase the incentives for equity financing ofinvestment, particularly as growth accelerates.
5.17 The banking system seems to have performed poorly as an allocatorof investment funds in the manufacturing sector. Arrears on bank loans tothe manufacturing sector are around 24Z of the outstanding amount, andreasonable levels of provisioning on these loans alone would exceed the networth of the banking system. And while the proportion of new bank lendingto manufacturing used for refinancing is less than to the rest of theprivate sector, it remains over a quarter of %he total. Much of thisrefinancing consists of rolling over loans to uncreditworthy borrowerswhose insolvency would threaten that of the banks themselves.
Table 1.8t Crdit Allocation and FlPiel 1elth I. Meastessrlas
Indicator 19-62 1isU 1l?4
Sank Loans/Volvo Added
A. Uanufacturing us1 7 so51S. Rest of Privat, sector 1lo 171 16l
Bank Loans/Gross Capital Formtion
A. ainufacturing 12X 77X 44XB. Rest of Private sctor 1X 26X 23X
Reftinncing/S,ak Loons
A. Manufaeturing 221 so1 27XS. Rest of Private sector 801 463 so
Sourc: MR end Ministry of Labor.
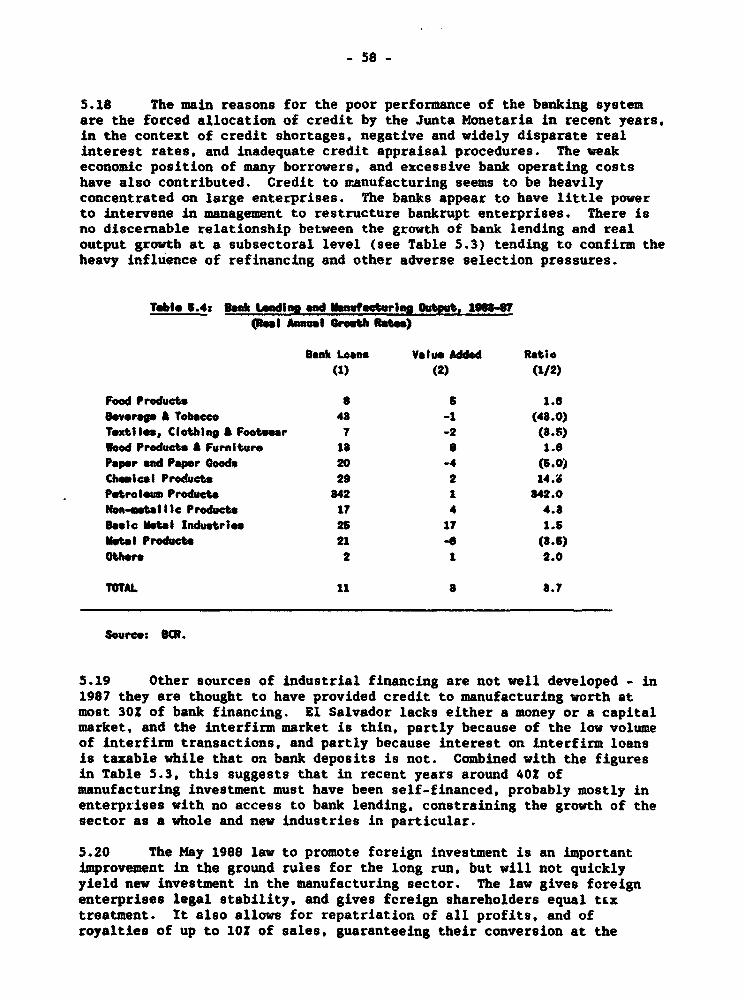
- 58 -
5.18 The main reasons for the poor performance of the banking systemare the forced allocation of credit by the Junta Monetaria in recent years,in the context of credit shortages, negative and widely disparate realinterest rates, and inadequate credit appraisal procedures. The weakeconomic position of many borrowers, and excessive bank operating costshave also contributed. Credit to manufacturing seems to be heavilyconcentrated on large enterprises. The banks appear to have little powerto intervene in management to restructure bankrupt enterprises. There isno discernable relationship between the growth of bank lending and realoutput growth at a subsectoral level (see Table 5.3) tending to confirm theheavy influence of refinancing and other adverse selection pressures.
Tale C.4: SaIk Lendig mWi sn0,fecturiag Oubpty 1988-671.l Anna Growth Rate)
Sank Loam Value Added Ratio(1) (2) (1/2)
Food Product. S 5 1.86btvra A Tobacco 43 -1 (48.0)ToAtil., Clothing & Footear 7 -2 (8.8)Wood Products A Furniture 18 8 1.6Papor and Paper Goods 20 -4 (5.0)Cheical Products 29 2 14.$Pstroiaiu Products 842 1 842.0Non-metl lIc Products 17 4 4.3Basic lNtal Industries 26 17 1.5Natal Products 21 4 (8.6)OthXe 2 1 2.0
TTAL 11 8 8.7
Source: CR.
5.19 Other sources of industrial financing are not well developed - in1987 they are thought to have provided credit to manufacturing worth atmost 30S of bank financing. El Salvador lacks either a money or a capitalmarket, and the interfirm market is thin, partly because of the low volumeof interfirm transactions, and partly because interest on interfirm loansis taxable while that on bank deposits is not. Combined with the figuresin Table 5.3, this suggests that in recent years around 40Z ofmanufacturing investment must have been self-financed, probably mostly inenterprises with no access to bank lending, constraining the growth of thesector as a whole and new industries in particular.
5.20 The May 1988 law to promote foreign investment is an importantimprovement in the ground rules for the long run, but will not quicklyyield new investment in the manufacturing sector. The law gives foreignenterprises legal stability, and gives fereign shareholders equal t&xtreatment. It also allows for repatriation of all profits, and ofroyalties of up to lOS of sales, guaranteeing their conversion at the
^ 59 -
prevailing official exchange rate. However the conversion of earnings intoforeign exchange is a two-step process, which can in practice take up to ayear to complete. The law also awaits proper implementation. A morefundamental problem is that foreign direct investment is heavilyconstrained by the perception of El Salvador as a high-risk environment.For this reason, direct investment in the manufacturing sector has beenvery small since the start of the crisis, particularly if the reinvestedprofits of subsidiaries - which have the same information as domesticinvestors - are excluded. Giving adequate incentives to domestic investorsis likely to be of more importance in the short run.
D. Price Coutrols
5.21 A final important element distorting the sector is the largenumber of price controls, which affect the input andlor output prices ofabout two-thirds of manufacturing. In general, price control policy seemto take little account of the structure of the markets concerned,particularly their openness to external trade. For instance, controlledcement prices are around lOZ above c.i.f. import prices, indicating only asmall degree of distortion in the domestic market, thanks largely to a lowlevel of tariff protection. In contrast, the prices of textiles,fertilizers, chicken and eggs are highly distorted. The ME intermediatesprice negotiations for these goods, for which there are quota restrictionsand/or high tariff barriers. Price controls have not necessarily beenineffective. The prices of some highly-protected consumer goods, such asbeer and sodas, have been decontrolled recently, and have risen relative toother prices suggesting that the former controls in fact had some impact inkeeping them down.
Z. Conclusions and Recommendations
5.22 The performance of the manufacturing sector is critical for ElSalvador's economic future. If the economy is to grow rapidly, it willneed increased and more varied exports of which the agricultural sectorwill only be able to provide a part. Even more importantly, manufacturingholds the key to increased urban employment generation and more even incomedistribution, which will be important considerations in view of populationpressures and the challenges of poverty. While El Salvador has thepotential to increase manufacturing exports, a far-reaching transformationof the sector will be required to achieve this potential.
5.23 Despite the fact that output remains below its pre-crisis peak,there is little scope for policies to stimulate growth by expandingdomestic or regional demand to utilize excess capacity. Capacity-utilization studies and interview data suggest that utilization rates areof the order of 60-802, which is close to ceiling levels for manydeveloping countries. This means that the priorities for the sector mustbe to increase capacity through increased investment, and through measuresto improve investment efficiency, including incentives changes, industrialtraining and improved physical security.
- 60 -
5.24 The most important policy area is the external sector, where ElSalvador is missing many growth opportunities. For instance, the exportsof other CACM countries to the USA have tripled since 1978, while those ofEl Salvador have fallen by 50Z. E1 Salvador's failure to exploit the USmarket, despite CBI privileges, indicates the degree to which the problemsare domestic rather than international. To revitalize the manufacturingsector, the following policy changes are requireds
i) Liberalization of the external trade regime, to lower importbarriers and make rates of protection more uniform amongactivities, by eliminating non-tariff barriers and reducing thedispersion of tariff rates.
ii) Real depreciation of the currency, to increase the incentive toproduce tradeable goods, particularly exports. This is alsoessential to maintain the profitability of efficient import-substituting enterprises, where liberalization could otherwisecause serious dislocation in the manufacturing sector.
5.25 Domestically, El Salvador needs to reduce the entry barrierscaused by discretional tax incentives, price controls, sectoral developmentlaws and credit allocations. A particularly important area will be theprovision of investment finance, the demand for which is likely to increaseat the same time as the pressure on the banking system from overborrowedincumbent firms reaches a crisis. Acknowledging the existing portfoliolosses in the banking system would wipe out its equity base. Thus thereform of incentives will both have to be accompanied by measures to makethe allocation of credit more responsive to market forces, and by measuresto strengthen the equity base of the banking system, particularlys
ij Moving to interest rates which more accurately reflect the costof capital,
ii) Maintaining an adequate spread between deposit and lendingrates while cutting bank operating costs, to allow theaccumulation of more adequate loan-loss provisions,
iii) Injecting new equity capital into the banking system, and
iv) Establishing and providing resources for a fund to liquidatebad loans. Similar to the existing CORSAIN, it would need tobe much larger to confront the problems of the banking system.
5.26 It will also be important for the growth of manufacturing tosmooth the transition between the informal and formal sectors. Presentincentives favor existing, large corporations, which have the negotiatingpower to get preferred access to loans, tax exemptions and price controlprivileges. This is reflected in market structure: output in mostsubsectors is dominated by large companies and family groups, but there areso many enterprises with 5 employees or less that the formal sectoraccounted for only 31? of manufacturing employment in 1985, according tohousehold survey data. Unusually, employment in small manufacturingenterprises seems to have performed worse than that in larger firms between1978 and 1985. Not only are informal manufacturing enterprises very small,but salaries are less than half the level in the formal sector, averaging
- 61 -
three quarters of the official minimum wage in 1985. Informal enterprisessurvive by evading regulation (including price controls and minimum wages)and taxation (including the stamp tax and social security contributions),but lack access to information and incentives. It is important to reducethe barriers to the growth of these firms to stimulate competition andgrowth in the manufacturing sector.
5.27 Taken together, such measures would have the effect ofdramatically restructuring the sector, forcing incumbent firms to improveproductivity and switch to new lines of production, mostly in the exportsector. Some would inevitably have to out of business, given the inheritedfinancial problems and El Salvador's lark of comparative advantage in manyareas. With appropriate external assistance, this could be offset by thegrowth of new enterprises in other areas. Clearly such a change would haveto take place gradually, allowing maximum possible time for capacity to beconverted and for management to improve.

- 62 -
VI. SOCIAL SCORS
A. Overview
6.01 One of the most impressive and positive features of El Salvador'sdevelopment record during the last decade has been the general maintenance.or improvement of basic social indicators, despite the very difficulteconomic and security situation. Infant mortality fell from 95/000 in 1971to 71 by 1982, 69 in 1985 and 53 in 1987.1 Also the prevalence ofcommunicable diseases has declined, as a result of massive immunizationcampaigns beginning in 1985. Accordingly life expectancy rose from 58 in1975 to 61 by 1986. Food availability increased, and malnutrition declinedas shown in Table 6.1. Some indicators of service provision, for instancethe number of medical consultations per capita, also increased.
Table 6.1: Malnutrition, 1965-1988(Percentage of children 0-5 years by weight for age)
Degree of Malnutrition:
Year Sample Normal Mild Moderate SevereSize
1965 578 35.1 34.8 22.8 7.31976 782 28.3 37.3 26.0 8.41978 1,108 49.6 32.5 15.0 2.91988 1,820 52.9 33.0 12.3 1.8
Sources: 1965 and 1976 - Instituto de Nutricion para Centroamerica yPanama (INCAP) and MoH
1978 - Central American Research Station, Center for DiseaseControl, Atlanta (CARS)
1988 - INCAP, Asociacion Demografica Salvadorena (ADS) andMoH
6.02 Despite these achievements, El Salvador still has some of thegravest social problems in the region. The rate of infant mortalityremains one of the highest in Latin America. Income distribution isradically unequal. Resources for public social services are scarce,reflecting public finance problems. School enrollment ratios dippeddrastically in the early stages of the crisis and real public expenditureon health fell 302 between 1979 £nd 1986. The proportion of the populationwith accets to safe water declined, leaving only 421 with access to safewater and 582 with sewerage services in 1987. Some but not all of theresource shortfall has been met by the increased efforts of NGOs, andrecords are poor so overall service availability is hard to gauge.
1/ The MoH believes that this decline, based on FESAL surveys, may beexaggerated.

- 63 -
6.03 New public sector initiatives are needed to improve socialservices over the next few years, particularly to mitigate the consequencesfor the poor and vulnirable of necessary economic adjustment measures.Given the scarcity of domestic resources, it will be critical to targetthem efficiently on the neediest groups. This is especially true ofsubsidy payments, which should be made explicit in the government finances,and restricted to the poorest. El Salvador should try to attract themaximum possible resources from abroad to supplement domestic efforts inthis sector. Efforts are also needed to improve the basic social data, andthe 1990 census will be of great importance in this regard.
S. Population
6.04 Two of El Salvador's most fundamental problems are rapid popula-tion growth and population pressure on cultivable land. The populationgrew at 3X per year from 1960 to 1978, and with about 350 people per squarekilometer of cultivable land the country is the most densely settled inLatin America. The natural rate of population growth has declined recentlyto 2.7Z per annum but is still among the highest in Latin America.Emigration has slowed the growth of the resident population substantiallymore, to only about 1.42 from 1978 to 1988 (Annex Table 6.1 gives popula-tion estimates).
6.05 There are many reasons for the high underlying rate of populationgrowth including low levels of education (particularly for women), unevendistribution of income and low levels of formal sector employment. Theeffects of two of these factors, namely urbanization and women's educationor women's desired number of children, are examined in Table 6.2 below.Because educated and urban women have better knowledge of and access tofamily planning, differences in completed family size tend to be evengreater.
Table 6.2, Desired Number of Children, by Residence and Education
El Salvadorl/ Latin America2/
Residence
Metropolitan 3.0Urban 3.4 4.1Rural 4.4 4.9
Education
None 4.7 5.3Primary 3.4 4.5Secondary and Above 2.6 3.6
Sources: 1, FESAL - 85 Final Report p. 867/ Derived from Kent and Larson, 1982, Family Size
Preferences. Unweighted averages of data from Colombia,Costa Rica, Dominican Republic, Guyana, Jamaica, Mexico,Panama, Paraguay, Peru and Venezuela.
-64 -
6.06 As urbanization proceeds, and as women's education improves,family size will undoubtedly fall in El Salvador and with it the rate ofgrowth of population. Another consequence of the current situation is alow prevalence of family planning. Only 47Z of women aged 15-44 were usingfamily planning in 1988, with use being especially low in rural areas(34?). Though use is above that in Honduras (35Z) and Guatemala (251),those countries continue to have population growth of around 32. Use ismuch lower than in Costa Rica (702). Panama (58?) or Mexico (53?) which areprojected to have population growth of only around 2? a year in the 1990s.Moreover female sterilization - the preferred method of contraception in ElSalvador - is often chosen by women who already have large families (over 4children on average), limiting its impact on population growth. Contra-ceptive use has, however, more than doubled since 1975, especially in urbanareas where access to family planning has been easier and women are moreeducated.
6.07 It is important to improve the availability of family planningservices, particularly in rural and peripheral urban areas. The 1988National Family Health Survey (FESAL 88) indicates that almost 20? of womenaged 15 to 44 are at risk (married or in informal union but not wanting achild) and in need of these services. Over two-thirds of them live inrural areas, where the MoH is the agency best placed to expand family plan-ning services through its existing health posts and clinics. Efficienttargeting requires that some public sector resources be switched away fromurban areas, which could be well covered by expanding the subsidizedcontraceptive distribution program of the Asociacion DemograficaSalvadorena (ADS) and private pharmacies.
C. Beq1th Services
6.a8$ As public sector resources have been squeezed, health spending hasdeclined from 32 of GDP in 1979-80, about the average for Latin America, toonly 1.5? in 1987. MoH expenditures have declined about 30? in real termssince 1979, mainly at the expense of real salary levels and real operatingexpenditures (materials, medicines, equipment and repairs) per patient.Despite these problems, the MoH managed to increase its total volume ofmedical attention faster than population between 1982 and 1987 (from 93 to116 per 100 people). Facilities are adequate after rapid increases inrecent years and reconstruction efforts underway.
6.09 Foreign aid, the private sector and NGOs have all made increasingcontributions to health care in El Salvador, helping to account for thecontinued progress of health indicators. Aid has financed MoH hospitalconstruction, medical supplies, equipment and repairs, as well as programsoutside the budget. Its share of total spending increased from about 2.32in 1983 to 8.1? in 1988, and reached 12? in 1987 during the restoration ofearthquake-damaged hospital facilities. The provision of services by theprivate sector and NGOs also increased after the 1986 earthquake. Theprivate sector is largely limited to outpatient care, but already has about400 hospital beds (compared to about 5,700 in the MOH), most of themdeveloped recently, and new projects are being considered.
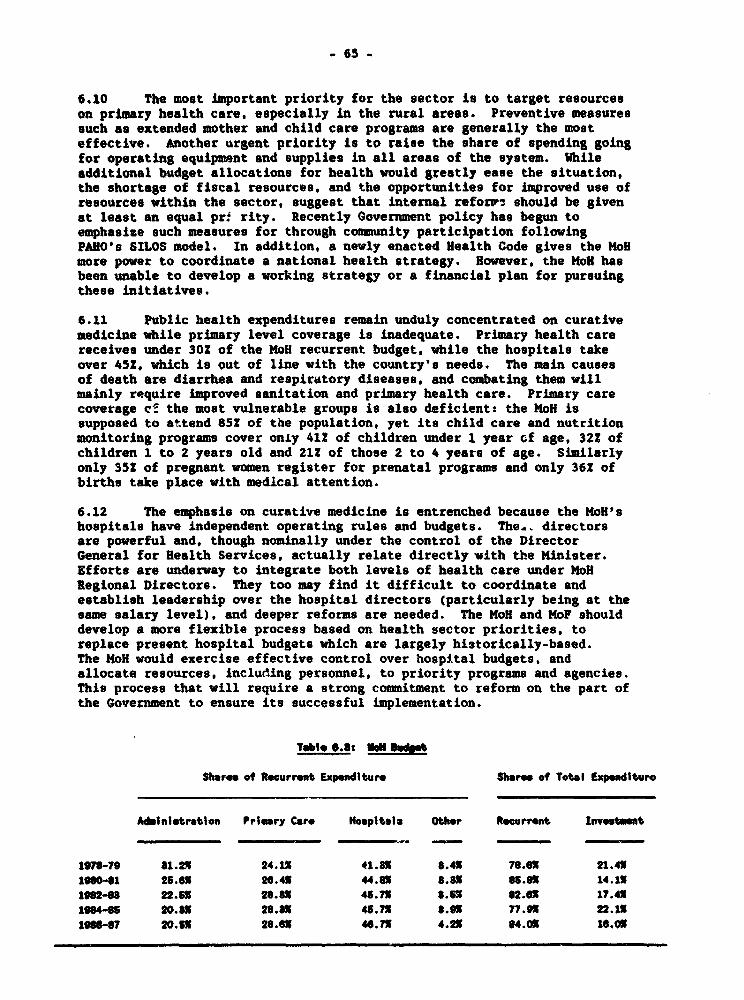
- 65 -
6.10 The most important priority for the sector is to target resourceson primary health care, especially in the rural areas. Preventive measuressuch as extended mother and child care programs are generally the mosteffective. Another urgent priority is to raise the share of spending goingfor operating equipment and supplies in all areas of the system. Whileadditional budget allocations for health would greatly ease the situation,the shortage of fiscal resources, and the opportunities for improved use ofresources within the sector, suggest that internal reforit should be givenat least an equal pr: rity. Recently Government policy has begun toemphasize such measures for through community participation followingPAHO's SILOS model. In addition, a newly enacted Health Code gives the MoHmore power to coordinate a national health strategy. However, the HoH hasbeen unable to develop a working strategy or a financial plan for pursuingthese initiatives.
6.11 Public health expenditures remain unduly concentrated on curativemedicine while primary level coverage is inadequate. Primary health carereceives under 302 of the MoH recurrent budget, while the hospitals takeover 4SZ, which is out of line with the country's needs. The main causesof death are diarrhea and respiratory diseases. and combating them willmainly require improved sanitation and primary health care. Primary carecoverage ca the most vulnerable groups is also deficient: the oH issupposed to attend 865 of the population, yet its child care and nutritionmonitoring programs cover only 412 of children under 1 year of age, 32Z ofchildren 1 to 2 years old and 21S of those 2 to 4 years of age. Similarlyonly 352 of pregnant women register for prenatal programs and only 361 ofbirths take place with medical attention.
6.12 The emphasis on curative medicine is entrenched because the MoH'shospitals have independent operating rules and budgets. The., directorsare powerful and, though nominally under the control of the DirectorGeneral for Health Services, actually relate directly with the Minister.Efforts are underway to integrate both levels of health care under MofRegional Directors. They too may find it difficult to coordinate andestablish leadership over the hospital directors (particularly being at thesame salary level), and deeper reforms are needed. The MoH and MoF shoulddevelop a more flexible process based on health sector priorities, toreplace present hospital budgets which are largely historically-based.The MoH would exercise effective control over hospital budgets, andallocate resources, including personnel, to priority programs and agencies.This process that will require a strong commitment to reform on the part ofthe Government to ensure its successful implementation.
Table*0.: 60Bda
Shae of Recurrent Expediture Shame of Total Expenditure
Adinietrat1on Priary Car. Hospitals Other Recurrent Investment
1976-79 81.2% 24.1X 41.8% 8.41 7.6 21.451166041 25.6x 20.41 44.31 8.81 s6.sX 14.1X
in2-es 22.51 28.81 45.7% 8.6X 62.61 17.411664-5 20.51 26.8x 45.71 8.9x 77.o 22.11196-7? 20.61 25.61 46.71 4.2X1 4.01 16.0o
- 66 -
6.13 With greater integration, increased user fees could help toincrease the amount and improve the allocation of recurrent resources.Fees are voluntary since tine Constitution guarantees free basic healthacare, and are currently less than one-tenth of those in the private sector.They are set and spent by community run entities mandated by law to allhealth facilities (patronatos), rather than the Ministry. Spending by thepatronatos however is largely controlled by hospital directors. Costrecovery needs to be increased by raising the level of voluntarycontributions, which cover only about 52 of hospital costs and much less inhealth posts and clinics.
6.14 Particular targeting preblems result from the low fees for payingbeds in public hospitals (pensionados). Fees are only about half of thosein private hospitals, and medicines are free of charge. The pensionadostherefore divert public sector resources, particularly hospital infra-structure, away from the neediest and towards the middle income groups theyserve. They also subsidize private practice in public hospitals where mostphysicians work only part time for the MoH. Charges should therefore beraised, and in particular a system of full cost recovery of medicinesshould be developed.
6.15 Another way to concentrate public sector resources on the poorestwould be to encourage private health insurance for formal sector employees,instead of enrolling them in the ISSS (which appears not to have thecapacity to attend new affiliates). Public employees are a particularlyimportant case. Even though there would be no short-term fiscal savingfrom providing them with private rather than public health care, it wouldhelp to dispel the image of the state as provider for middle-income groups.It would also encourage the development of additional private sector infra-structure, which might ease public sector budget constraints later.
6.16 It is also important to improve the efficiency of resource use inthe health sector. Administrative integration between primary health careand hospitals and the referral system need to be strengthened, so thathospitals are no. longer burdened with patients who could be treated at theprimary level. An emphasis on early treatment would greatly cut costs;for example rehydration cases cost less than US$1 to treat at the primarylevel, but if not attended on time require 4 days hospital care atUS$20fday. Some hospitals have their own diagnosis offices and refersuitable patients back to health centers, but this ad hoc solution isinsufficient. Administrative expenuitures could be cut below 202 of MoHrecurrent spending, since operating units have been decentralized andhospitals operate autonomously. Staffing patterns sLould be changed toincrease the number of auxiliary and paramedical personnel in relation tothe number of doctors from the current ratio of 2:1 to about 4:1 or 5:1.The MoH should also be given the incentive to cut personnel costs by allow-ing them to retain the budget for vacancies eliminated. These changeswould help restore the share of basic goods and serviceR in the MoH budget,which declined from 432 in 1975 to only 72 in 1988, and in the hospitalbudget (152 in 1988).

-67-
6.17 Efficiency problems in hospitals result in an average length ofstay of about 7 days, as against a Latin Amer4can average of only about 5.6days.2 To improve, hospitals will need adequate operating information, costaccounting systems and budget controls. Improving the referral mechanism,and emphasizing early treatment and prevention would also shorten length ofstay and relieve pressure on facilities. Higher fees could also shortentreatment - it is noticeable that paying patients in pensionados have amuch shorter stay, averaging only about 3 days.
6.18 In the medium term, the MoH should dev-lop a more decentralizedstructcre of primary health care. It should on a pilot basis transfer someprimar.y health care services to municipalities, providing some funds aspart of a financial scheme where other sources of funding are alsoconsidered. This has proven to be difficult in other countries, so atfirst only a few municipalities and communities should be involved. TheMoH should also allocate health care resources on the basis of servicesprovided, to induce increased coverage of health services. In addition,the MoH should consider, on a pilot basis, subcontracting hospital adminis-tration to private non-profit organizations. It should similarly try tointroduce information and cost accounting systems that could later beimplemented in the rest of the hospitals.
D. Education
6.19 In the early 1980s, concern focused on the plummeting level ofeducational enrollments. This has now stabilized, but concerns remainabout the quality of education. After free primary education was extendedfrom 6 to 9 years in 1968, the primary enrollment ratio expanded rapidly upto a peak of about 79Z in 1979. Substantial coverage problems stillremained, particularly in the rural areas. For instance in 1977, theenrollment ratio in rural primary education was only 53?, as against 109?in the urban areas. Enrollments declined disastrously with the onset ofthe civil war, and fell to a nadir of 61? in 1981. Since 1983 they haverisen at an annual rate of 4.4?, and the enrollment ratio had reached over80? by 1986 and 1987. A conspicuous feature of the recent increase hasbeen the rapid growth of private schoolirg, which expanded at an annualrate of 17.4Z, over six times the rate of growth of public school enroll-ments. By 1987, private schools accounted for 12.2? of primary pupils, upfrom 7.6Z in 1983.
6.20 There are several reasons for this increase, which is evidence ofa strong demand for education despite the fall in per capita incomes.Firstly, the public school system suffers from capacity problems because ithas been starved of recurrent and investment funds, and suffered majorlosses of facilities in the SSMA - estimated at 85-90? - in the 1986 earth-quake. Secondly, there has been a steady fall in teachers' real salariesand teachers work only part time, necessitating a second source of income.Though pupil-teacher ratios have been maintained, poor teacher motivationis a source of quality problems in public education. Also the need for
2/ Acute care only; unweighted mean of Argentina, Chile, Uruguay, Panama,Costa Rica, Colombia, Venezuela, Guatemala, Bolivia and Peru, fromnational sources, 1986.
- 68 -
second careers has probably increased the supply and reduced the cost ofprivate schooling. Lastly, there has been inadequate expenditure on booksand other educational equipment, adding to concerns about the quality ofpublic education. These problems raise doubts also about the quality ofprivate schooling, and there is a need for monitoring of the effectivenessof all schools.
6.21 Secondary enrollment ratios displayed a similar pattern, fallingfrom 26? in 1979 to 20S in 1981, and has increased even more rapidly since1983, reaching nearly 29S by 1987. Here too the public schools have lostsome of their share of enrollments, which stood at about 502 in 1987.There was a particularly rapid increase in the private share of secondarytechnical education, from 23Z in 1983 to 42Z in 1987. In general, totalenrollments have risen faster at higher levels of education than at thebasic levels - at 4.7? in secondary schools, and 9.5Z in higher education.The public universities were partially closed down frm= 1981 to 1984, andstudent numbers are now recovering to normal, and this is the only levelwhere public sector coverage has increased more rapidly than that of theprivate sector.
6.22 Foreign aid has partly compensated for the drop in public sectorfund.6ig of school construction and educational materials, and currentexpenditure per pupil has remained steady in rerl terms since 1983 inprimary and secondary public education. It has fallen rapidly at theuniversity level as the num er of students has returned to normal, whileexpenditures have not increased. University salaries have fallen even morein real terms than those of other teachers - between 1979 and 1987 theyfell by 62?, whereas those of other teachers fell by 52Z. The result hasbeen that the differential between recurrent expenditure per pupil atdifferent levels of education has fallen enormously. Expenditure peruniversity student in 1976 was over 9 times that per school pupil, fell to5.7 times by 1983, and by 1987 was only 1.8 times. The implications forquality, and especially for the retention of teaching staff, should beinvestigated.
6.23 The proportion of enrolled pupils completing their primary educa-tion has generally risen from 1978 to 1986 in the urban areas, and fallenfrom its already low level in the rural areas. The only major exception isin the first 2 grades, where desertion rates have fallen, as they have inthe urban areas. Part of the reason for the low rate of completion in therural areas is that few schools offer the full 9 years of basic education.Repetition rates have generally gone up somewhat, except for higher gradesin rural areas.
Issues and Recommendations
6.24 Education is one of the most important areas of long-term'nvestment for growth. The strong effective demand for education at alllevels and people's willingness to pay for it, gives the public sector theopportunity to reorient its expenditure towards the more disadvantagedsegments of the population, emphasizing rural schooling, primary education,and vocational and technical training. This would lay the basis forraising the productivity and wages of the poor in the long run. Theprivate sector would continue to expand to satisfy the demand of othersegments of the population.

- 69 -
6.25 Though some progress has been made in the recruitment andselection of teachers, substartial further reforms are urgently needed.There are no incentives for well-trained teachers to enter the publicsystem, nor for further vocational training or education. A new wage scaleshould be implemented and selective real wage increases should be madeaccording to levels of education, experience, further training andperformance. Continued improvements in the soct.al security of teachersseem desirable, and incentives to work full time at public schools shouldbe introduced.
F.26 The coverage of adult literacy and skills training programs hasincreased rapidly (over 152 pa since 1983) but remains restricted by therequirement that trainees have completed secondary school. Public trainingprograms at low(r levels of schooling are almost non-existent, and shouldbe given higher priority. This is necessary to upgrade the skills ofworkers entering the labor market, a great proportion of whom have notreached the secondary level. Public technical education should be improvedand private sector involvement in this type of education should bepromoted, following recent trends. The low current level of universityexpenditures per student should enable El Salvador to avoid the problem,,ncountered by many developing countries, of over-spending at the tertiarylevel.
E. Housing
6.27 El Salvador's housing problems have been serious for a number ofyears. In 1977, 532 of households in the SSMA lived in substandarddwellings such as temporary housing (tugurios), older dwellings (mesones)or squatter settlements without proper title, and consequently lackingwater and sewerage facilities. A large proportion of dwellings (442 in theSSMA, and 862 in the rural areas) had only one room, and about half wereconstructed of temporary materials. This situation has since beenaggravated by the fall in real incomes, by internal migration, by a fall ingovernment spending, and in the SSMA by the severe earthquake of October,1986.
6.28 Since 1980, over 500,000 people are thought to have left theirhomes, mainly in the rural areas, due to the security situation. This addsto housing demand, especially in the urban areas. Over 200,000 migrantshave come to the SSMA, where many of them are housed in camps in publicspaces or on the urban periphery. Despite the fall in real incomes,private investment in housing has increased almost continuously, both inreal terms and in relation to GDP, since the mid-1970s. Public spending onhousing also increased rapidly in relation to GDP between 1979-81 and1982-84 (though it increased only 72 in real terms), but has since fallenback steeply, and showed no sign of a recovery in 1988 despite thereconstruction activity after the earthquake. The fall has been sharpenough to reduce total housing investment.
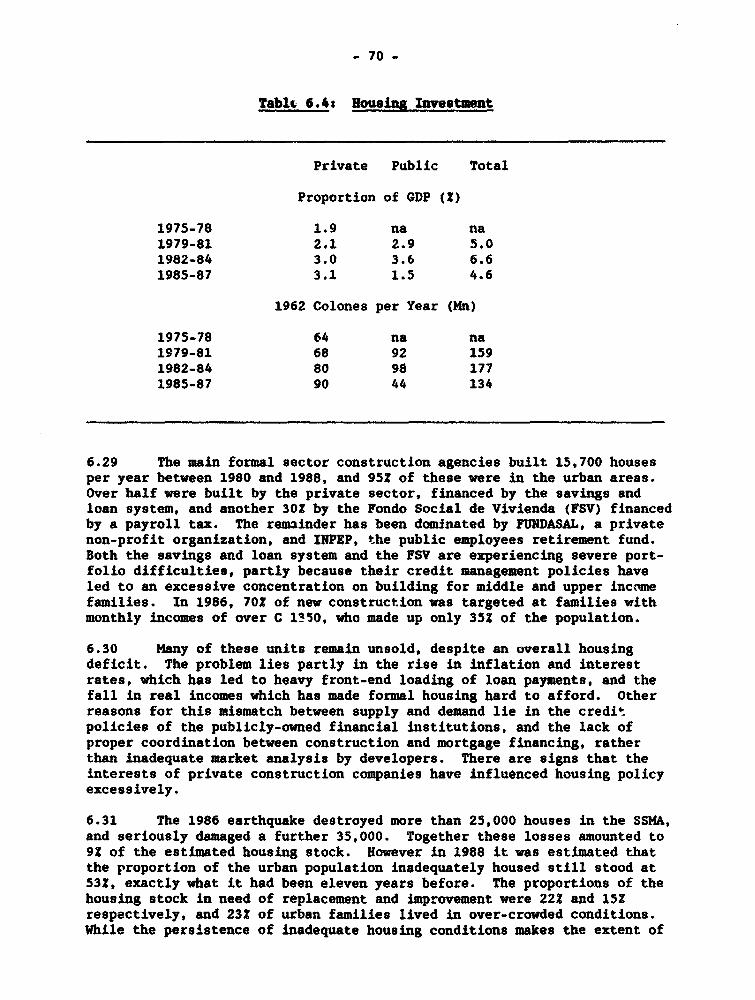
- 70 -
TablU 6.4: Housing Investment
Private Public Total
Proportion of GDP (X)
1975-78 1.9 na na1979-81 2.1 2.9 5.01982-84 3.0 3.6 6.61985-87 3.1 1.5 4.6
1962 Colones per Year (Mn)
1975-78 64 na na1979-81 68 92 1591982-84 80 98 1771985-87 90 44 134
6.29 The main formal sector construction agencies built 15,700 housesper year between 1980 and 1988, and 95Z of these were in the urban areas.Over half were built by the private sector, financed by the savings andloan system, and another 30Z by the Fondo Social de Vivienda (FSV) financedby a payroll tax. The remainder has been dominated by FUNDASAL, a privatenon-profit organization, and INPEP, the public employees retirement fund.Both the savings and loan system and the FSV are experiencing severe port-folio difficulties, partly because their credit management policies haveled to an excessive concentration on building for middle and upper incomefamilies. In 1986, 70S of new construction was targeted at families withmonthly incomes of over C 1350, who made up only 35Z of the population.
6.30 Many of these units remain unsold, despite an overall housingdeficit. The problem lies partly in the rise in inflation and interestrates, which has led to heavy front-end loading of loan payments, and thefall in real incomes which has made formal housing hard to afford. Otherreasons for this mismatch between supply and demand lie in the creditpolicies of the publicly-owned financial institutions, and the lack ofproper coordination between construction and mortgage financing, ratherthan inadequate market analysis by developers. There are signs that theinterests of private construction companies have influenced housing policyexcessively.
6.31 The 1986 earthquake destroyed more than 25,000 houses in the SSMA,and seriously damaged a further 35,000. Together these losses amounted to92 of the estimated housing stock. However in 1988 it was estimated thatthe proportion of the urban population inadequately housed still stood at532, exactly what it had been eleven years before. The proportions of thehousing stock in need of replacement and improvement were 22? and 15Xrespectively, and 23? of urban families lived in over-crowded conditions.While the persistence of inadequate housing conditions makes the extent of
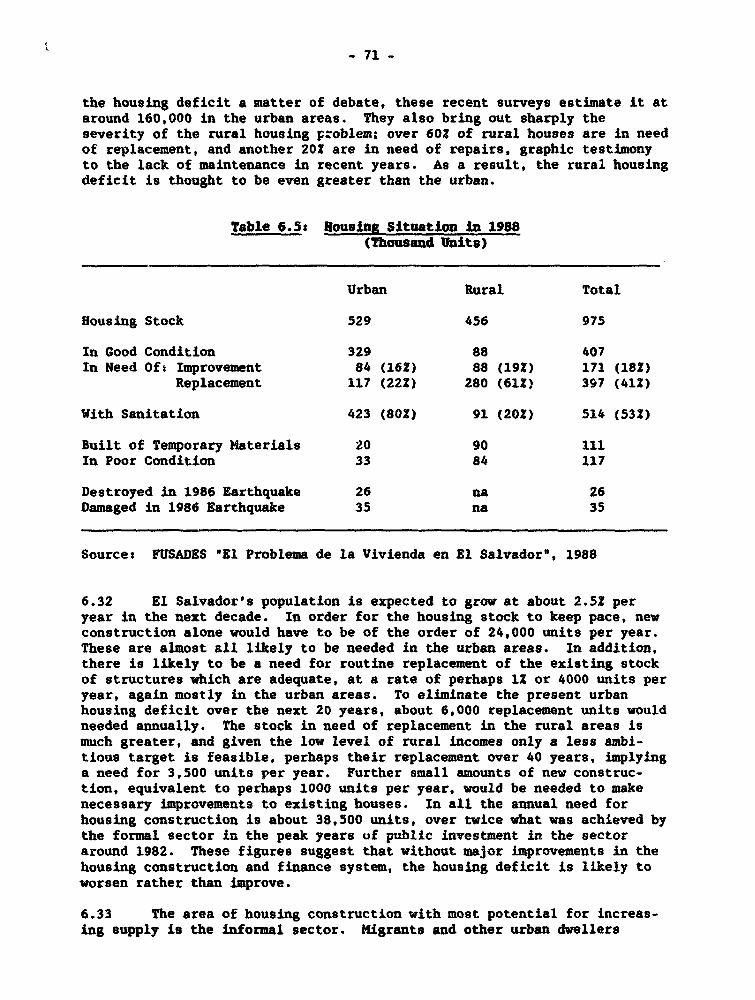
_71 -
the housing deficit a matter of debate, these recent surveys estimate it ataround 160,000 in the urban areas. They also bring out sharply theseverity of the rural housing pVoblem; over 602 of rural houses are in needof replacement, and another 202 are in need of repairs, graphic testimonyto the lack of maintenance in recent years. As a result, the rural housingdeficit is thought to be even greater than the urban.
Table 6.5: Housing Situation in 1988(Thousand Units)
Urban Rural Total
Housing Stock 529 456 975
In Good Condition 329 88 407In Need Oft Improvement 84 (162) 88 (192) 171 (182)
Replacement 117 (222) 280 (612) 397 (41Z)
With Sanitation 423 (802) 91 (202) 514 (532)
Built of Temporary Materials 20 90 111In Poor Condition 33 84 117
Destroyed in 1986 Earthquake 26 na 26Damaged in 1986 Earthquake 35 na 35
Sources FUSADES 'El Problema de la Vivienda en El Salvador', 1988
6.32 El Salvador's population is expected to grow at about 2.52 peryear in the next decade. In order for the housing stock to keep pace, newconstruction alone would have to be of the order of 24,000 units per year.These are almost all likely to be needed in the urban areas. In addition,there is likely to be a need for routine replacement of the existing stockof structures which are adequate, at a rate of perhaps 12 or 4000 units peryear, again mostly in the urban areas. To eliminate the present urbanhousing deficit over the next 20 years, about 6,000 replacement units wouldneeded annually. The stock in need of replacement in the rural areas ismuch greater, and given the low level of rural incomes only a less ambi-tious target is feasible, perhaps their replacement over 40 years, implyinga need for 3,500 units per year. Further small amounts of new construc-tion, equivalent to perhaps 1000 units per year, would be needed to makenecessary improvements to existing houses. In all the annual need forhousing construction is about 38,500 units, over twice what was achieved bythe formal sector in the peak years ox public investment in the sectoraround 1982. These figures suggest that without major improvements in thehousing construction and finance system, the housing deficit is likely toworsen rather than improve.
6.33 The area of housing construction with most potential for increas-ing supply is the informal sector. Migrants and other urban dwellers
- 72 -
unable to afford even a minimal finished house (estimated at 20-40Z of theurban population in 1985) try to obtain a building plot, and construct andupgrade their dwellings in line with their income and needs over a periodof years or even decades. This process, almost universal in developingcountries, has received little help from the public sector in El Salvadorthough it has been assisted through some foreign aid programs. Obstaclesinclude difficulties in obtaining legal title to building plots, and lackof credit.
6.34 The land problem is maybe the most fundamental. Since mostinformal owners lack clear tenure, they have no security or legal rights,and are in a weak position to lobby for public infrastructure, cruciallywater and sewerage. A resulting problem is the evasion of buildingstandards. Illegal developments bypass urban development regulations,resulting in a poor quality of construction (which is particularlydangerous in an earthquake-prone area such as the SSMA) but probably alsoproducing higher profits for landowners, since density can be much greater.Credit difficulties also partly flow from this lack of tenure; owners haveno security to offer for loans. However the major problem seems to be thelack of credit institutions to address the needs of the informal sector.
Issues and Recommendations
6.35 The problems of the housing sector are persistent and many solu-tions have been tried over the years, so it is hard to give definitiverecommendations. Large injections of public funds under existing institu-tional arrangements are unlikely to produce results. More consistent andcomprehensive planning for the sector are needed to identify demand, andlay the basis for meeting the needs of all sectors. The problems of theurban lind market merit special study and policy attention, to meet theneeds of low income families. The aim would be to facilitate thedevelopment of sites and services projects, construction materials creditsand other initiatives which have proven useful in other developingcountries, but which have yet to take root in El Salvador.
6.36 The savirns and loan system is in need of reform and recapitaliza-tion, perhaps as part of a more general strengthening of the financialsystem. There is also a need for new types of mortgage instrument, to helpborrowers over 'he difficult initial liquidity problems of high-interestborrowing. If these structural problems can be resolved, then an increasein personal incomes and savings resulting from the adoption of growth-oriented macroeconomic policies could produce major increases in housinginvestment.

- 73 -
VII. ECOMOMIC PROJECTIONS
A. Introduction
7.01 El Salvador's economic prospects will depend on the policy choicesmade by the authorities. The purpose of this chapter is to illustrate someof the consequences of different choices of exchange rates, taxation andpublic spending, and (to a lesser extent) monetary policy in the context ofa simple consistency and financing model. El Salvador's debt, capitalstock and natural resource endowments are taken as given, and the focus ison the connections between these trade and fiscal policies on the one hand,and the balance of payments and growth on the other.
7.02 Macroeconomic policy choices result in the structure of prices andincentives which affect efficiency. The crucial efficiency linkageconsidered in the model is that between investment and GDP growth.Improved incentives reduce the amount of investment needed to achieve agiven growth rate, and thus the financing required both domestically andfrom abroad. This in turn has an important bearing on the financialfeasibility of the entire program. The strength of the linkage betweenpolicy and efficiency is obviously hard to estimate, and the assumptionsmade here are illustrative in nature.
7.03 Some elements are outside policymakeLs' control, such as worldmarket conditions for commodities and interest rates. They are assumed todevelop as currently estimated by the World Bank's International EconomicsDepartment. The main assumptions are as follows:
Xi) Growth in the industrial economies will slow dowr from over 42in 1988 to about 21 by 1990, then average 2.72 pa through the19908.
(ii) Inflation in the industrial economies will rise somewhat fromrecent levels, to an average of about 4? pa through the 1990s.
(iii) LIBOR, the measure of international interest rates, willdecline gently and will average about 8Z during the 19909. ElSalvador will have to pay a constant premium of 314? over LIBORon its international commercial borrowings.
(iv) World coffee prices, after recovering in 1988, will fallgradually in real terms up to the mid-1990s, then begin to riseagain. This projection assumes that the International CoffeeAgreement continues to set export quotas.
7.04 Important qualifications of the projections are necessary inrespect of certain aspects of the economy which do change in response topolicy, but which have been treated here as exogenous. Like efficiency,they are likely to change slowly and in a way which is difficult to aodelconvincingly. Two particularly critical variables of this kind ia the caseof El Salvador are migration and the internal security situation.

- 74 -
7.05 Improved economic performance would reduce emigration andworsening performance would increase it. This would tend to stabilize thelevel of per capita incomes, at least in the short run. However it isimpossible to say how large the effect would be, and the main result oftryinS to project such changes in migration would be to blur the differencein economic results between good and bad policy performance. In all policyvariants, emigration is assumed to continue at a rate of about 30,000persons per year through the 1990s. This projection is part of a largerprojection of worldwide flows of migrantsl based on comprehensive informa-tion from both labor-exporting and labor-importing countries. The flow outof El Salvador will be substantialiy less than in the early and mid-1980s,and by the end of the century will be under 1/22 of the population eachyear. Accordingly, the growth of the resident population will riseslightly, from around 21 in 1988 to 2.6Z by the mid 1990s. The growth ofremittances is the same in both projections, and is described in Annex 2.
7.06 Rather different considerations led to the implicit assumptionhere that the cost of the war will contained at its present level, eitherdirectly by expenditure restraint or by increased levels of bilateralsupport. A more optimistic economic scenario could be constructed on thebasis of falling security expenditures and economic damage. However itwould be unwise to rely on such an outcome when planning economic policychoices.
B. Prospects with Present Policies
(a) Ass- iptions
7.07 It is assumed that there is no change from the overall directionof economic policies in early 1989. Fiscally, the public sector continuesto run a small deficit of around 2-3X of GDP. This is achieved by keepingpublic investment low, at 2.32 of GDP. A severe monetary squeeze bringsinflation down to international levels in 1-2 years. The nominal exchangerate is held constant, meaning that there is some further deterioration inthe real effective exchange rate and in the profitability of producingexports up to 1991, though they are stable thereafter.
7.08 The growth of exports is slow, reflecting the real exchange rate.Coffee exports slump, affected by severe weather conditions in 1988, thengradually recover. However there is another setback in 1991, reflectingweak producer prices, and exports only reach their 1987 level again in1995. Exports of the other traditional commodities (cotton, sugar andshrimp) are generally small. Cotton exports in particular remain less than10 of their pre-crisis peak level, reflecting lack of competitiveness atcurrent exchange rates (an continuing security problems in the growingareas). Exports of manufactures grow at the same rate as demand in thedeveloped countries, reflecting the assumption that exporters can convertforeign excIange at the parallel rate so that profits are relatively immunefrom the overvaluation of the colon. Overall, exports grow at around 3Xduring the 19908.
11 Arnold: Worldwide Estimates and Projections of InternationalMigration, 1980-2000t An Assessment, East-West Population Institute,November 1988.

-75 -
7.09 The volumes of most categories of imports are projected to move inline with GDP, except for imports of capital goods, which are linked toinvestment spending, and are thus more responsive to the rate ox GDPgrowth. Import prices are determined by international inflation. lmportsremain fairly low in relation to GDP (around 241) through the forecast, sothe current degree of import compression is not relaxed.
7.10 Without adjustment measures El Salvador enjoys little credit-worthiness, and accordingly its access to commercial funding is almostzero. There can be no IMF program, and the sizes of the multilateraldevelopment banks' lending programs are also severely restricted to aboutUS$50 million per year. Bilateral loan funding is US$50 Mn annually, butthere are no suppliers credits, or official or private commercial borrow-ing, and net capital inflows remain small. In the late 1990s the countryfaces increasingly negative net flows, as new commitments fall well shortof the amortization of existing debt.
(b) Outcome
7.11 Since it is assumed that reserves are maintained at about theirpresent level, the current account has to remain almost balanced. Thetrade position has to improve to offset a gradual decline in bilateralgrant financing. This involves a constriction of imports and correspondingcuts in investment and GDP. Domestic savings remain low, at about 52 ofGDP through most of the 1990s, but are forced up at the end of the periodby the need to generate a current account surplus.
7.12 In this scenario, GDP growth is constrained by lack of access toimports. Even initially, the economy is unable to grow as fast as popula-tion, so per capita GDP falls continuously. From 1991 onwards, real GDPitself starts to contract, at a rate of about 12 per year. As the capitalaccount turns negative in the late 1990s, the position grows still worse,and the decline in GDP accelerates to about 22 per year. By 1997 percapita incomes are over 25! below their 1987 real level, representing agreater fall than in the 19708.
7.13 This is clearly not a sustainable scenario. At - minimum, it isunreasonable to assume that El Salvador will cut growth and incomes toservice external debt with few prospects of further external borrowing orgrants through the 1990s. More importantly, several of the policiesassumed here could not be supported indefinitely. The official exchangerate would eventually have to be devalued in response to pressures in theparallel markets. Similarly the government would be under pressure toembark on expenditures to stimulate growth that it would only be able tofinance through money creation, destabilizing the price level.
7.14 The main purpose of the scenario is to show just how unsustainablepresent policies are. While adjustment actions carry a short-term cost,the longer term damage from doing nothing is certainly greater. It isparticularly interesting to observe that even the short-run respite underthis base case is so small. Growth is only 1-1.5Z in 1989-90, involvingheavy costs to all sections of Salvadoran society as real incomes fall.

- 76 -
C. Prospects with Economic PolicZSbCages
(a) Assumptions
7.15 This is a different type of forecast from the one above. Autarge;)t rate of GDP growth of 4Z is assumed, and growth rates are assumedto increase rapidly towards this level from 1990 onwards. Tr. .s produces anannual increase in per capita incomes of about 1.52, which is not particu-larly ambitious in terms of welfare: for instance incomes are still 14Zbelow their pre-crisis peak by 1997. The model is then used to project theamount of external financing that would be needed to sustain this rate ofgrowth, given appropriate domestic policies to increase exports, savingsand the efficiency of investment.
7.16 The key policies are a 502 devaluation, taken at the beginning of1990 and its supporting measures. After 1990, the exchange rate remainspegged to the US Dollar at the new rate of 7.5 Colones up to the end of theforecast. Import volumes are squeezed as their domestic currency pricerises. The devaluation is large enough to more-or-less restore thepurchasing-power parity of the late 19708, and to importantly increase ElSalvador's cost competitiveness. It is probably greater than would becompatible with equilibrium in the parallel foreign exchange markets, andwould have to be accompanied by policies to increase the demand for foreignexchange. This pattern of a large one-time change in the nominal exchangerate is only one among various possible policy approaches '- achieving areal devaluation. The same result could also be achieved -.nrough a managedfloat or by a series of smaller devaluations between fixed parities.
7.17 Important trade liberalization measures are assumed to underliethe projection. In the short run there is a relaxation of exchange controlrastrictions and other non-tariff barriers to increase the demand forforeign exchange and make the devalued official rate an equilibrium. Thiswould involve the coniversion of non-tariff barriers to tariffs, increasingpublic sector revenue. Over the medium term (3-5 years), there is acompression of tariff differentials as maximum rates are cut and a minimumrate imposed. This changes the pattern of imports, but their overall levelwill not necessarily increase, because increased import substitution inintermediate goods would tend to offset the increase in consumer goodsimports. The net revenue effects of tariff simplif4:sition would be smallbecause the cut in average tariff levels would be offset by increasedimports of relatively high-tariff items.
7.18 Several fiscal reforms are envisaged. Major revenue-enhancingmeasures in 1990, including broadening the tax base, eliminating taxexemptions and raising public enterprise prices to economic levels yield2-32 of GDP. This eliminates the public sector deficit, an essentialmeasure to eliminate the need for inflationary bank financing, stabilizethe price level and maintain the real devaluation. There is an immediateincrease in trade tax revenues in domestic currency due to the realdevaluation and tLe switch from NTBs to tariffs. There are also increasesin domestic revenues from broadening the tax base and eliminatingexemptions. These changes enable the public sector to increase its currentspending on salaries and supplies by about 102. Later tax refcrms, such asthe conversion of the stamp tax to a VAT and tariff simplification are
- 77 -
assumed to be revenue neutral, and most medium-term gains come from theinherent buoyancy of the tax system and from tax administration improve-ments. There are however important efficiency improvements from thesepolicies.
7.19 Inflation increases to 20.51 in 1990, due to the effect ofdevaluation on the import content of domestic expenditure and to publicenterprise price and indirect tax increases. This is partly compensaled bytrade liberalization measures, which increase the competition in domesticmarkets, and tend to depress producer prices. Overall, consumer pricesrise by about 102 more than international rates in 1990, but thereafter areassumed to rise at the same pace. The social costs of adjustment areassumed to be mitigated by public sector programs in the social sectors.Devaluation also directly assists those receiving remittances.
7.2.0 Due to trade and financial sector reform there are both immediateand long run improvements in investment efficiency. In the short run, themarginal capital-output ratio is assumed to improve by 20? in 1990 asinterest rates are raised, non-performing loans are restructured andinvestment ceases to be directed towards economically loss-making enter-prises. From 1993 onwards, a trend increase in investment efficiency setsin at a rate of about 42, reflecting the increasing preponderance of trade-ables production and the more even pattern of incentives available afterthe trade reform. However, even by the end of the forecast, the marginaland incremental capital output ratios are still well above (lesR efficientthan) in the 1960s and 1970s.
7.21 For illustrative purposes, it is assumed that official capitalflows increase in response to improving credit-worthiness and growthprospects. Major programs are concluded with the IMF in 1990-1994, leadingto disbursements of around 672 of quota each year. Project lending and aseries of structural adjustment loans from 1991 to 1995 in support of thereform efforts described above are assumed from multilateral and bilateralagencies. On the other hand, it is envisaged that bilateral reliefprograms will wind down as distress is reduced, and particularly that USloan assistance will increase only to the extent needed to compensate forthe fall in its grant assistance. This produces declining level of netflows from the US to El Salvador. Additional capital requirements areassumed to be borrowed at commercial rates, and the average terms of over-all new lending get harder, as more commercial rate funds are substitutedfor concessional assistance.
(b) Outcome
7.22 Overall export growth is rapid, reaching over 82 pa by the late1990s. However, this is achieved entirely through the recovery of tradi-tional exports to their pre-crisis levels, and rapid (15? pa) growth ofnon-traditional products to non-regional markets in response to theirimproved profitability. By 1991, these new exports account for 232 of thetotal, and dependance on coffee has fallen to under 502.
7.23 Imports grow somewhat more slowly than GDP, due to the devalua-tion, the increase in investment efficiency and because it is assumed thatfood import demand will rise less rapidly than GDP as a whole. There are

_ 78 -
some further savings, particularly in the import of intermediate goods, dueto the restructuring of industry in the mid- and late 19909.
7.24 The resource gap stabilizes in US dollar terms from 1992 onwards,and after increasing to over 9? of GDP in 1990 due to the relative priceeffects of the devaluation, falls steadily to around 62 of GDP by the endof the forecast. Most of this gap is initially financed by transfers butofficial grants fall throughout the period, and total transfers only amountto 41 of GDP by 1997, the bulk of them coming from private sources after1990. As a result, the current account deficit increases slowly, reachinga peak of 5? of GDP by 1995.
7.25 Even given the generous levels of official financing which havebeen assumed, there is a need for additional financing, which increases inthe late 1990s as the effect of IMF programs and adjustment lending beginsto unwind. Debt indicators remain within reasonable limits up to 1997,with MLT debt servicing standing at about 6? of GDP and 27? of exports butare still rising. The implication is that El Salvador will need eithermore concessional lending terms in the 1990s, or still more rapid exportgrowth, to make a 4? GDP growth rate consistent with complete credit-worthiness.
7.26 Saving and investment both increase in the early part of the fore-cast, but as investment efficiency improves the amount of investment neededto sustain the 4? growth rate drops somewhat. Domestic savings rise from3.2X of GDP in 1989 to 7.7? by 1997, reflecting higher incomes and theimproved position of the public finances. Foreign savings fall, as thevolume of official grant assistance declines.
D. Conclusions
7.27 The economic outturns of the two projections are clearly verydifferent, particularly in terms of the long-term prospects of the country.Under a continuation of present policies, El Salvador ends the decade in aworse economic position than at present, with the economy contracting.Under the assumed policy changes, it generally improves its position, butalso acquires a heavy burden of debt. Both, however, are dominated to alarge extent by costs inherited from the recent past; weakened competitive-ness, low investment, aid dependency, heavy war expenditure and war damage,and weakened institutions. Accordingly, it is hard to make incomes grow.Under present policies they decline, and even with policy changes, far-reaching reform actions, efficiency improvements, and a great deal ofexternal finance are needed to produce rather modest improvements. Anearly resolution to the conflict, which is consuming over 25? of publicsector revenue or 5? of GDP in unproductive expenditures, would clearly beof enormous benefit to the economy. But as plans should be laid which arefeasible even with the current security situation.
7.28 The key requirement is for the authorities to make active andconsistent use of the major tools of economic policy to try and boost thegrowth rate. A danger to be constantly borne in mind is that of under-taking an incomplete program of measures. For instance devaluation alona,without trade liberalization and fiscel and monetary stabilization, would
- 79 -
not produce the necessary results. Inflation would increase, offsettingthe gain in competitiveness in a very short period of time, and destabiliz-ing the economy. Liberalization without devaluation, on the other hand,would devastate the import-substituting sectors, without increasing theincentives for increased export production. Similarly, fiscal and monetarycontractioa without trade measures would depress incomes and leave theeconomy in a low-level equilibrium.
7.29 A final caveat is that very little is so far known about thepotential costs of the financial sector reforms envisaged in tbh% projec-tion, both to the public finances ano to the productive sectors. Thisreform, as the experience of other countries suggests, will be very diffi-cult to implement. It can also end up giving subsidies to those who havealready gained from inefficient incentives, and who are able to walk awayfrom problem enterprises, leaving the costs to be borne by the publicsector. This is an area in which it will pay to be cautious, and parti-cularly to avoid measures which would quickly expose the weakness of thefinancial system.
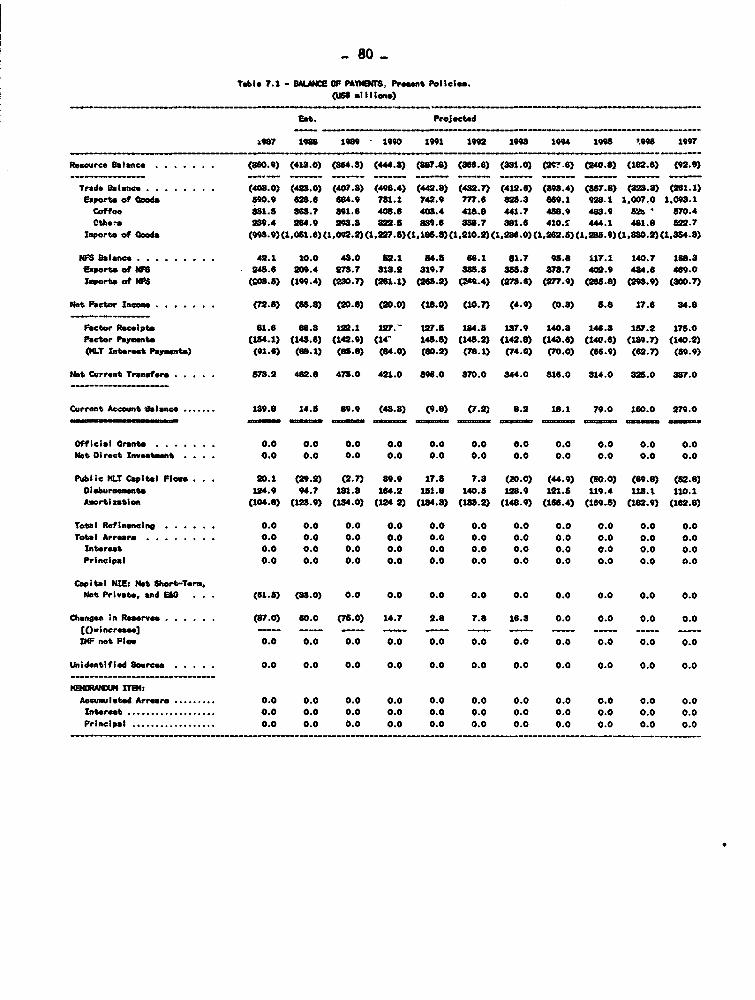
_ 80 _
Table 7.1 - eALANF OP P*M?4r Presemi Policies.(US l II i.)
Sot. Proj sated
MY67 19go 1"96 - 1990 1991 1992 1998 1994 1995 '9es 1997
Reource Balance .. .. (80) (418.0) (864.8) (444.8) (867.6) (866.6) (861.0) 22 S6) (240.8) (162.6) (92.9)
Teade SalaceC .... . . . . (403.0) (42S.0) (407.8) (496.4) (442.8) (462.7) (412.6) (898.4) (851.0) (8.S) (261.1)Exports of Oma 590.9 628.6 684.9 731.1 742.9 777.6 2.3 869.1 928.1 1,007.0 1.093.1
Coffee 851.5 8S8.7 891.6 406.6 403.4 418.8 441.7 456.9 488.9 621' 570.40th*- 289.4 264.9 298.8 8s2.5 189.6 58s.7 881.6 410.S 444.1 481.8 522.7
Imports of 0ods (998.9)(1.051.6)(1e2.2) (1227.5)(1 1e5a)(1210.2) (1 26.)(1262.5) (i.288.)(1.80.2)(1.84.8)
NFS Balan . .. . . . . . . 42.1 10.0 48.0 52.1 88.5 66.1 81.7 95.8 117.1 140.7 168.8Emport of IFS 24S.6 209.4 273.7 81S.2 819.7 8S5.6 S56.8 878.7 402.9 434.6 469.0Imports at S (208.5) (199.4) (230.7) (261.1) (268.2) (1.4) (27.6) (277.9) (265.8) (293.9) (8O.7)
Not etet orIn . ... . . . (72.5) (65.8) (20-.) (20.0) (18.0) (0.7 (.) (0.8) 5.8 17.6 84.8
Facto R ccIpte 61.6 68.8 112.1 127.- W27.6 184. 187.9 140.8 148.8 157.2 175.0factor Payment (154.1) (148.6) (142.0) (14- 145.5) (148.2) (142.8) (140.6) (140.6) (189.7) (140.2)(NLT Interest Paymnt.) (01.6) (68.1) (88.6) (84.0) (00.2) (78.1) (74.0) (70.0) (66-9) (62.7) (59.9)
Not Current Trwfrs . 578.2 482.8 478.0 421.0 896.0 870.0 844.0 8.0 814.0 325.0 887.0
Current Accomt Ilnce ....... n69.8 14.6 69.9 (48.8) (9.8) (7.2) 6.2 18.1 79.0 160.0 279.0
Official Orania . ...... 0.0 0.0 0.0 0.0 0.0 0.0 0.0 0.0 0.0 0.0 0.0Not Direct Inveatnt . . . . 0.0 0.0 0.0 0.0 0.0 0.0 0.0 0.0 0.0 0.0 0.0
Public SLT Capital Flom . . . 20.1 (29.2) (2.7) 89.9 17.5 7.8 (20.0) (44.9) (60.0) (69.8) (52.8)Di.ura.mante 124.9 94.7 181.8 164.2 151.6 140.5 126.9 121.5 119.4 118.1 110.1Aaortlzation (104.8) (128.9) (134.0) (12 2) (184.3) (138.2) (148.9) (168.4) (159.5) (182.9) (162.8)
Total Refin aing .... . . 0.0 0.0 0.0 0.0 0.0 0.0 0.0 0.0 0.0 0.0 0.0Total Arrears .... . . . . 0.0 0.0 0.0 0.0 0.0 0.0 0.0 0.0 0.0 0.0 0.0
Interest 0.0 0.0 0.0 0.0 0.0 0.0 0.0 0.0 0.0 0.0 0.0Principal 0.0 0.0 0.0 0.0 0.0 0.0 0.0 0.0 0.0 0.0 0.0
Capital NIE: Not Short-Tern.Net Private., and E0 . . . (61.6) (88.0) 0.0 0.0 0.0 0.0 0.0 0.0 0.0 0.0 0.0
Changes in Raarves .(.6.. . . (87.0) 60.0 (75.0) 14.7 2.8 7.8 18.8 0.0 0.0 0.0 0.0CO-i acrem. -] - --- -- …
IMP net Flow 0.0 0.0 0.0 0.0 0.0 0.0 0.0 0.0 0.0 0.0 0.0
Unidentifiad Source. 0.0 0.0 0.0 0.0 0.0 0.0 0.0 0.0 0.0 0.0 0.0
-H ITBNAccuwulatad Arrears ......... 0.0 0.0 0.0 0.0 0.0 0.0 0.0 0.0 0.0 0.0 0.0
Interst ................... 0.0 0.0 0.0 0.0 0.0 0.0 0.0 0.0 0.0 0.0 0.0Principal .................. 0.0 0.0 0.0 0.0 0.0 0.0 0.0 0.0 0.0 0.0 0.0
_ _ _ _ _ _ _ _ _ _ _ _ _ _ _ _ _ _ _ _ _ _ _ _ _ _ _ _ _ _ _ _ _ _ _ _ _ _ _ _ _ _ _ _ _ _ _ _ _ _ _ _ _ _ _ _ _ _ _ _ _ _ _ _ _ _~~~~~~~~

- 81 -Table 7.2 - KfW DIISC VWICAT00S. Prrm_t Policles.
Est. Projetd
1986 1987 108 1I89 199O 1991 1992 199M 1994 1998 1996 1997
rwt Rbte percent):OP .......................... 0.61 0.61 1.01 1.01 1.81 -1.01 -1.01 -1.01 -1.01 -1.61 -1.81 -2.01MP Par capita .. -1.O -1.11 -0.71 -8.31 -8.41 -8.51 -3.51 -4.01 -S.91 -4.81
Cmuu a tipen .................. 0.11 -1.41 8.6 AS3 1.S 0.311 -1.61 -1.01 -1.73 -. 2.1 -2.81 -3.81Conmiptton per capita . 1.81 -1.91 -1.31 -2.01 -4.01 -4.31 -4.1 -4.71 -S.O0 -8.41
Dbet Indicate.. Totsl 001 O%illion UN) ..... 1.718 1.769 1.728 1.718 1.742 1.740 1.48 1,724 1.679 1.69 1.559 1,806
VIP CRT ( I I Ion US) ...... (84) 0 0 0 0 0 0 0 0 0 0 0Total W-!&p*rUaS$ S 1.... 175.8 211.8 200.2 178.7 1lS.8 164.6 157.1 146.8 188.1 192.4 108.1 98.4
Total 00-. Corrent CDP (S) .... 43.9 38.0 80.4 26.0 24.0 24.6 24.6 23.9 22.8 21.8 19.7 18.6
HLT Debt servIce (lill ion USI) 211 2w8 224 232 220 go 219 227 2g6 236 248 223
ILT Deht eerwice/Curret CDP ( 6.8 4.8 8.9 8.6 8.1 8.2 8.1 3.2 3.2 8.1 8.1 2.7
N.LT Debt servic./Ezprt SF8 21.2 22.6 24.2 21.8 18.7 18.9 17.8 17.3 17.1 16.0 15.4 12.8
Interest L? (M4l II ion US$) ... 7' 92 88 88 s 0o 78 74 70 67 es sOIsteret NLT/Export OF8 (1). 7.4 10.0 9.8 7.9 7.2 6.7 6.8 8.0 8.1 4.8 3.9 6.4Interet NLT/Curent COP (1).. 1.9 2.0 1.8 1.8 1.2 1.1 1.1 1.0 1.0 0.9 0.8 0.7
National Aceont.a. * of currant COP:Toal Inv.tomt 12.8 11.2 10.9 11.6 9.0 9.0 9.0 9.0 8.6 8.6 8.1
Tobal Caneunption 94.9 96.1 94.6 94.8 96.4 98.1 9s.C 98.0 94.6 93.7 98.0Dometic Savigs 8.1 8.9 8.4 8.2 8.6 8.9 4.4 8.0 8.4 6.8 7.0
National Saving. m/. . 1t.8 11.8 12.8 10.9 8.9 8.9 9.1 9.8 9.6 10.6 11.6
.2.. 12.8 11.8 7.8 -11.8 -9.0 -9.0 -9.0 -6.0 -8.7 -4.8
External Trade Indicator. (percent):Export. OFS -eat grewth rate -12.6 9.7 -6.0 6.7 2.6 -o.s 2.8 8.2 2.8 8.8 8.8 8.4
Ewport. OF8 ninal grwt re 8.6 -14.8 0.2 14.4 8.9 1.8 4.7 8.9 8.4 7.1 8.8 8.4Export. of NFS/rea MQP ..... 18.6 20.8 19.0 20.1 20.4 20.8 21.1 22.0 22.6 28.9 25.1 2S.S
Import. SF8 real growth rate -2.8 -0.8 -0.6 0.8 2.4 -s.8 -1.0 -1.0 -1.0 -2.4 -1.8 -2.9
Imorts SN5 nominal r-Wh ra -4.9 6.8 4. 8.7 12.8 -2.6 2.0 2.0 2.0 2.0 8.8 1.9
Iort. of 4^S/raal CDP..... 28.0 22.8 22.4 22.8 22.8 21.8 21.8 21.8 21.8 21.8 21.8 21.1
Imort Elaticity (incl. NF8) 1.0 1.0 1.0 1.0 1.0 1.0 1.0 1.0 1.0 1.0
Current Account/Current CDP ... .8 8.0 0.8 1.4 -0.6 -0.1 -0.1 0.1 0.2 1.0 2.0 8.4
Resource Smlance/Current GDP . -8.8 -7.7 -7.8 -8.6 -6.8 -8.8 -8.2 -4.6 -4.0 -8.2 -2.8 -1.1Terms at Trade Indx (1967 * 100) 100.0 106.0 104.6 99.8 a .8 97.7 97.2 97.0 98.9 98.9 98.0
MP (million U51):Currant Account ...... 99 140 14 90 (48) (10) (7) 6 16 79 160 279Export of OCod* & Service 976 897 838 989 1,044 1,068 1,118 1,179 1.248 1.381 1.442 1.862
a/. Exclude. Currant Transfers.
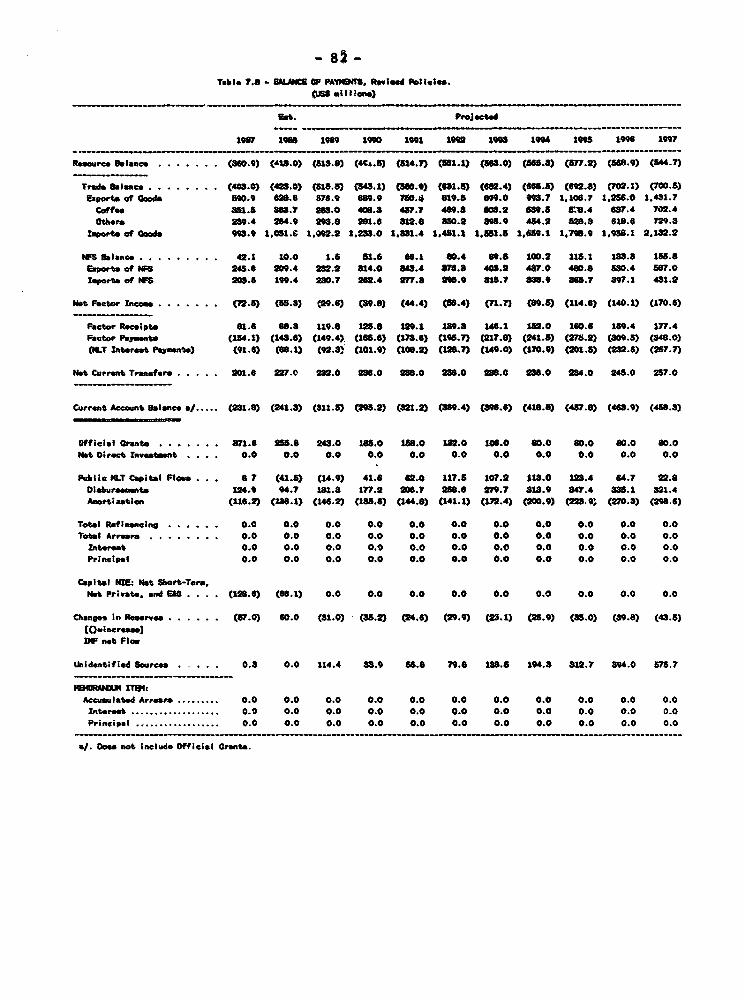
- 82 -Table 7.8 - 8aLM O OF PAWII. Revised Policles.
cW6 mUllen.)
Eat. Proeted
1907 1988 1989 1990 1991 199l 1Q" 194 1998 19" 199
R.wrc Balance . ... . (.60.9) (418.0) (818.6) (4C&.5) (814.7) (881.1) (86.0) (868.8) (87.2) (5R.9) (544.7)
Trial Balsce .. (408.0) (428.0) (518.8) (3.1) (88.4) (681.8) (682.4) (668.8) (692.8) (.1) (70-.)Export. of Goods 590.9 628.6 878.9 689.9 M0. 619.5 9.O 9.7 1,106.7 1,256.0 1.431.7
Coffee 381.5 863.7 283.0 408.3 437.7 469.8 88.2 83.8 W0.4 637.4 702.4others 289.4 284.9 209.8 281.6 312.8 880.2 898.9 484.2 82.$ 81.6 79.3
Imports of Goods 93.9 1,U.6 1,9X2.2 1,.23.0 1,S91.4 1,451.1 1.5151.8 1,618.1 1,79.9 1,958.1 2,182.2
NF4 Balance . 42.1 10.0 1.8 81.6 6.l 80.4 69.8 100.2 118.1 183.3 1SS.8Export of NFS 248.6 209.4 282.2 814.0 343.4 376.8 408.2 437.0 4E0.8 830.4 88T.0Zporte of Ws 203.8 199.4 280.7 S22.4 277.8 298.0 81.7 886.9 368.7 897.1 431.2
Not Factor Incoe . 6 (72.) (88.3) (99.6) (89.6) (44.4) (86.4) Cn1.7) (89.8) (114.6) (140.1) (170.8)
Factor Recipts 81.6 88.8 119.8 125.8 129.1 19.8 14.1 131.0 180.6 169.4 177.4Fhctor Paymnt. (154.1) (148.6) (149.4) (165.8) (18.6) (198.7) (217.8) (241.8) (27S.2) (809.5) (548.0)(ILT Interes Pamenmt) (91.6) (18.1) (92.3) (101.9) (168.2) (128.?) (140.0) (170.91) (201.6) (232.8) (26.7)
Not Current Transfer .201.8 227.0 282.0 282.0 238.0 288.0 138.0 23a.0 2S4.0 248.0 257.0
Current Accont Balance a/ . (231.8) (241.8) (811.5) (298.2) (821.2) (S89.4) (89.48) (418.8) (457.8) (465.9) (488.3)
Official Gants .8.1.. . . . an.6 2S8.8 243.0 163.0 181.0 1. 106.0 68.0 68.0 68.0 80.0Nt Oirset Ineatt . . . . 0.0 0.0 0.0 0.0 0.0 0.0 0.0 0.0 0.0 0.0 0.0
Public tlLT Capital Flom . . . 8 7 (41.8) (14.9) 41.6 62.0 117.8 107.2 118.0 1t2.4 64.7 22.8ieburment 124.0 94.7 11.8 177.2 106.7 288.8 279.7 S18.9 847.4 888.1 321.4
Aort.iation (118.2) (138.1) (148.2) (1S.6) (144.8) (141.1) (172.4) (100.9) (22S 1 (270.8) (298.6)
Total RefinancIng . 0 .0 0.0 0.0 0.0 0.0 0.0 0.0 0.0 0.0 0.0 0.0Tetal Arrears.0.0 0.0 0.0 0.0 0.0 0.0 0.0 0.0 0.0 0.0 0.0
Ierest 0.0 0.0 0.0 0.O 0.0 0.0 0.0 0.0 0.0 0.0 0.0Principal 0.0 0.0 0.0 0.0 0.0 0.0 0.0 0.0 0.0 0.0 0.0
Capital NIE: Nat Short-Tere,Net Private, nd E10 . . . . (86.1) 0.0 0.0 0.0 0.0 0.0 0.0 0.0 0.0 0.0
Change in Resrves .(87.0) 60.0 (81.0) (3S.2) (24.6) (29.9) (23.1) (26.8) (35.0) (89.8) (49.8)tO.incream.)DFU net Flow
Unidentified Sources . 0. 0.0 114.4 88.9 88.8 79.8 1a8.8 194.8 812.7 894.0 87s.7
Accumlated Arrears ..... 0.... O. 0.0 0.0 0.0 0.0 0.0 0.0 0.0 0.0 0.0 0.0Interet ................... 0.0 0.0 0.0 0.0 0.0 0.0 0.0 0.0 0.0 0.0 0.0Principal .................. 0.0 0.0 0.0 0.0 0.0 0.0 0.0 0.0 0.0 0.0 0.0
s/. Does not include Official Grants.

- 83 -
Tabl- 7.4 - EW SOaC DOICATOR. Rewleed Policlea.
Gt. Proectd
1967 1968 10 89 19C0 1 19 1992 198 1994 19" 1996 190?
Growth Retes (percent)tOP ............................ 0.65 1.05 1.05 2.05 8.051 4.05 4.05 4.0O 4.05 4.05 4.05COP per capite . -1.0O -1.15 -0.A .O .SS 1.t iS 1.45 1.45 1.4111 1.41Consumption . 8.08 8.05 -1.85 1.65 8.05 .65 3.55 8.45 8.8s 8.28Coneumption per capite . 1.85 0.86 -3.45 -0.65 0.51 1.05 O."5 o.8s o.7s D.65
Debt IndicetorsTotal OW (MlllIion US$) */ .. 1,770 1.728 1.828 1,9?7 2,161 28425 2,744 8.110 8.822 8.946 4,568
DlCFtEDIT ( lll onw0US0 ........ 0 O 0 70 140 210 2S0 888 a8 280 s0oTotal DOD/Exporte OM (5) . ..... 2. .208.2 225.9 196.8 197.5 208.1 210.4 217.4 221.9 220.9 226.8Total OD/Current COP ) .... 8.. 3.0 80.4 27.7 87.0 88.4 40.8 42.9 48.6 47.7 49.2 82.51. Debt service (Hillion USS) b 206 2Z4 2S8 284 248 282 298 4S 895 476 841
MLT Debt service/Curret MP (5) 4.8 8.9 8.6 4.4 4.8 4.2 4.7 8.0 8.4 6.9 6.2tLT Debt erlce /Exporto GOMS ( 24.8 26.8 29.5 2a.8 22.2 21.1 22.6 24.0 24.9 26.6 26.8Interees MLT 6(MlIIlon USS) b/ ... 92 a8 92 1 106 10 149 171 202 283 "66Intareest LT/Exports ONFS (1) ... 10.9 10.5 11.4 10.2 9.9 10.8 11.4 11.9 12.7 18.0 13.8Interest .MLT/Current ODP CS)5.) 2.0 1.8 1.4 1.9 1.9 2.1 2.8 2.5 2.7 2.9 8.1
National Account. e # ot current ODP:Total lnvetnt ....... 1........ 12.8 11.2 11.0 12.8 13.7 14.6 14.4 14.8 14.2 14.1 14.,Total Consumption ..... ........ 94.9 96.1 96.8 9.8 95.5 94.6 94.4 94.0 98.5 93.0 92.8Domestic Saving ..... 8......... 6.1 a.9 8.2 8.5 4.5 5.4 8.6 6.0 6.4 7.0 7.?National Sewings ...... ........ 15.8 11.8 9.9 10.7 10.8 10.6 9.9 9.4 9.1 9.8 9.6
IR . . . .12.8 11.8 8.8 8.9 8.1 a.8 8.8 8.2 8.2 8.2
External Trade lndicetore (perant':Exort. WS real .rmO rate .. -8.0 -9.8 21.8 t.6 6.6 6.4 8.7 7.0 7.4 7.9Export ONFS nominal growt ret. 0.2 -6.5 24.1 9.0 9.8 9.1 9.7 11.0 12.8 18.0Export. of OS/real OOP .... 7... .9 16.7 18.0 17.8 18.4 16.0 19.4 19.9 20.4 21.1 21.9Imports OU reel growt rate -0.6 0.8 2.9 4.4 8.4 8.7 8.7 8.7 8.7 8.7Import ONFS minal growth rate 4.5 8.7 18.0 7.6 8.61 S 6.9 6.9 8.8 8.8 8.8Import. of OUS/reel OP ....... 25.7 28.8 25.2 25.4 26.7 26.1 26.0 28.9 28.9 25.8 28.7Import Elasticity (inal. WMS) 1.0 1.0 0.8 1.0 1.0 1.0 1.0 1.0 1.0 1.0
Current Accoun/Current MP .... a .0 O. -1.0 -2.1 -2.9 -4.0 -4.8 -8.0 -5.1 -4.6 -4.4Resource Selance/Current CDP ... -7.7 -7.8 -7.8 -9.2 -9.1 -9.2 -8.8 -4.8 -7.8 -7.1 -6.8Terme of Trade Index (1987 a 100 100.0 106.0 108.9 98.5 92.5 91.7 91.2 91.0 90.0 90.1 90.0
SOP (a*llin kw8):
Current Account n/ .............. 140 14 (68) (110) (168) (287) (291) (9 (87) (384) (387)Export. of Goode & Services .... 887 688 609 O .00t 1.094 1.196 1.804 1.43 1 S.7 1,786 2.019
*/. Includes Official Orant.b. Including unidentified *eurce ot finance det ervice.
- 84 -
ANNMX IPage 1 of 2
The Role of Ron-governmental Organizations
Introduction
A1.01 There are more than 600 voluntary, non-profit organizations activein El Salvador, the majority of them indigenous. Only a few of these arelarge enough for their individual operations to be of interest, butcollectively they make up a sector of considerable importance for thedelivery of relief and social expenditure, especially at the grass-rootslevel. The majority of the foreign NG0s are of US origia with a secondimportant group made up of organizations which are local branches ofexternal NGOs; many are church-related.
Size and Nature of Operations
A1.02 The size of NGO operations can be gathered from funding orcoordinating agencies data. NGOs themselves, particularly indigenous ones,are rather reluctant to divulge financial information, and the quantitativeinformation gathered is thus partial and indicative. Sources of funds forNGO operations are mostly foreign, with USAID the most important singledonor, and Canada and several European governments also steady contributorsto NGO activities. Data from various sources indicate an annual financialflow of at least $130 million during the last two years. The availabledata on USAID funding adds up to $30 million, while funding from someEuropean countries and UNICEF was US$112 millions. This is an exceptionallevel, produced by a large grant for housing construction, to beadministered by FUNDASAL.
A1.03 NGO operations in El Salvador are largely of an emergency nature.Thus, the NGOs studied were employing unusually large staffs -- a roughaverage of about 20 each. It vas not possible to arrive at reliableestimates of the size of the target population of NGO activities, butalmost all aim to target the poorest.
A1.04 The priorities, capabilities, objectives and modus operandi ofNGOs are fundamentally different from those of official agencies. Theyaddress the poorest sectors which official programs scarcely reach, theirprojects tend to be very small and they aim at enabling disadvantagedsectors to participate in development. The success of an NGO project isoften appraised in terms of the local initiative and community actiongenerated. For instance a "Save the Children" representative explainedthat the important part of their low income housing package is organizingeach cluster of houses into organizations aiming to enable the group tolobby for itself to obtain land titles, electricity and running water,rather than the number of houses itself.
Relation with Government Programs and Official External Agencies
Al.05 El Salvador's exceptional circumstances have led to the cooptingof NGOs by the I {ernment and USAID for carrying out mass assistance
-85- ADM=X IPage 2 of 2
programs such as refugee settlement and some have become mere delVverymechanisms for these funds. USAID since 1983 has been identifying NGOswilling to work with pacification programs. Several local and expatriatevoluntary organizations evidence concern about participating in USAID-sponsored programs. However, NG0s with a longer in-country track record donot seem to be troubled by such partnerships. The need for thiscooperation is widely accepted in E1 Salvador government circles. NGOefforts have not replaced public social programs, in part because it wasnot the NGOs' aim and because of the phenomenal growth of demand for theseservices.
A1.06 The ircrease in cooperation between the government and indigenousNGOs during the 1980s has been significant, especially after the 1986earthquake. The Escuela Nueva experiment illustrates a successful jointventure among an NGO, a government agency and a multilateral organization,designed to experiment with options to reform elementary school curriculaand methods.
Trends in NGO Activlties
A1.07 The number of NGOs -- notably the domestic variety -- working inEl Salvador has increased dramatically during the present decade, and thescale of their operations and their fields of interest have broadened. Aschannels for large sums of money from tUSAID and other donors, NGOs areattempting to carry out programs on an exceptionally large scale, whereassmall-scale operations are their main strength.
A1.08 Only peripheral attention has been paid to monitoring,coordinating and evaluating NGO activities. Although all expatriate NGOshave to en'c-r into an agreement or counterpart relationship with somegovernment office, the government apparently has no specific guidelines formonitoring and follow-up procedures. The only attempt at voluntarycoordination among NGOs was the creation of CIPHES in 1986 but this neverhad a chance to consolidate itself. NG0 performance is far below what itcould be if an effective coordinating and monitoring system were in place.
Preliminary Conclusions and Recommendations
A1.09 A number of the larger NGOs seem to have accumulated rich andextensive experience in dealing with the specific problems of El Salvador.If maximum positive impact is to be expected from NGO participation, theymust be tr, 'ted as equal partners capable of providing a much needed linkwith the beneficiaries, rather than as mere implementers of programs orprojects. The NGO must be responsible for program or project design andall associations between NGOs, government and bilateral and multilateralagencies should include impartial performance monitoring and feedback onimpact on the target population. The administration and operation of somebasic services could be transferred from government to informal communitiesor municipalities assisted by experienced, reputable NGOs. A central databank for NGO activities is urgently needed.
- 86 -
AM=X 11Pawg 1 of 5
Private Transfer Receipts
Introduction
A2.01 Private transfer receipts from abroad are an extremely importantbut poorly-measured aspect of-El Salvador's economy. They have 3 principaleffects:
i) To make the size distribution of total incomes more equal thanthe distribution of earned incomes alone. This occurs becauseremittances are sent directly to poor and disadvantaged groupsof the population, particularly displaced-persons and familieswith few p'nime-age adult workers in the country;
ii) To finance a considerable proportion of goods imports andcapital outflows, including amounts not officially recorded.This relieves the foreign exchange constraint and accelerateseconomic growth;
iii) To supply foreign exchange to the parallel market for Colones,holding down the parallel market rate which reduces the premiumavailable to non-traditional exports in the official parallelmarket. This also makes it possible for the authorities tosustain a fixed official exchange rate despite rapid realappreciation on a purchasing-power parity basis. Realappreciation in turn erods the profitability of tradeables byallowing the authorities to maintain an overvalued officialrate. Transfer receipts thus distort the pattern of economicgrowth.
A2.02 Private transfer inflows mav also be producing an accumulation ofUS dollars in the country and thus be increasing the effective monetarybase. Tnis could contribute to inflationary pressures, and help explainthe fact that inf:ation in 1988 continued at around 202 despite much slowergrowth in the Colon money stock.
A2.03 It is crucial for several aspects of macroeconomic analysis tohave estimates of the amounts involved. However, very little of the moneyremitted comes through official channels such as the banking system, so theflows are not captured statistically for balance of payments purposes. Norare there are any official sample surveys of remittances, and BCRprocedures for estimating the inflow of remittances are both indirect anddeliberately conservative to avoid introducing large unexplained changes inthe balance of payments account. It was therefore decided to work withdata from the most recent unofficial sample survey, namely two enquiriestaken by the Universidad de Centroamerica (UCA) in 1986-87. Since theconclusions of the UCA study are controversial, they were reworked to someextent.
87- AM ItPage 2 of 5
Official Estimates and their Problems
A2.04 Until 1979, the BCR measured remittance directly from bankreceipts, but with the development of a parallel foreign exchange marketthese receipts began to fall and estimates were developed-. Currently ituses an estimate of remittances based on the number of Salvadorans in theUSA (given by the US embassy), and obtains its figure for total inflows bymultiplying by an estimate of average remittances ner emigrant. In 1979these were $300 and this figure is adjusted for inflatia.r arn the parallelmarket premium. The average for 1987 was $308 per emigraat, and totalprivate remittances were estimated at $202 million. Only 8-92 of thisamount passed through the banking system, but even so the BCR estimate oftotal remittances seems on the low side for a number of reasons.
A2.05 Firstly the number of Salvadorans in the USA, according to BCRfigures, is only 656,000, well below the estimates used in other studies.In particular, CELADE figures based on deme-raphic data indicate acumulative net total of 946,000 emigrants from El Salvador since 1950. Upto 150,000 of these are thought to be in Medico or in neighboring CentralAmerican countries, implying a figure of aroun4 800,000 in the USA. Thisis conaistent with the UCA survey evidence which suggests that 35.6Z offamilies in El Salvador have relatives in the USA, and that each suchfamily has an average of 2.74 relatives ir the USA. With an estimated9l,000 families in E1 Salvador, this lead's to figures of 328,000 familieswith emigrant relatives, and 900.000 Salvadoran emigrants in the USA (thisestimate includes children born abroad to £lvadoran parents, whereascumulative migration totals do not.)
A2.06 Secondly, the BCR estimate takes no account of increases in theearning power of Salvadorans in the USA from 1979 to 1987, even thoughaverage hourly earnings in US manufacturing rose by 482 (IFS). This may bejustifiable since it is doubtful that the earnings of the averageSalvadoran in the USA rose this much. The majority of immigrants hasarrived in recent years, and new arrivals start at the lower end of thewage range, thereby reducing the average for all migrants. In the UCAsurvey, for instance, illegal immigrants reported average earnings only 152above che full-time minimum wage, whereas legal imdgrants reportedearnings 702 above it. Many migrants initially receive only minimum wages,and from 1980 to 1987 the minimum wage rose by only 8.4?. Such effectscould in principle largely offset the increase in average wages.
A2.07 Thirdly, the BCR procedure produces a constant or fallingpropensity to remit out of earnings. This ignores the crisis nature ofmuch of Salvadoran emigration during the period since 1979. Salvadoranshave emigrated largely to maintain family welfare in the face of scarceemployment opportunities and poor living standards in El Salvador, andrecent emigrants seem to remit a substantially higher proportion ofearnings. The critical economic conditions in El Salvador may also haveincreased the remittances of Salvadorans already in the USA before 1979.
Alternative Estimates
A2.08 While the official figures for total remittances seem too low,those calculated in the recent UCA study are so much higher (of the order
- 88 -
Page 3 of S
of $1.4 billion in 1986, or eight times the official estimate) as to bethemselves in question. Their estimate was arrived at in the followingmanners
i) In a survey of 1530 Salvadorans resident in El Salvador, it wasfound that the average total monthly amount remitted by eachSalvadoian in the USA was thought to be around $113.6.
ii) Using a rough estimate of one million Salvadorans residerst inthe USA, this grosses up to an annual total of $1,363 nillion.
This procedure is open to at least two criticisms. Firstly, the iumber ofSalvadorans in the USA is on the high side; from paragraph A2.05 above, afigure of 800,000-900,000 would appear to be more reasonable. Secondly,the use of figures based on recipients estimates of the amount sent seemsunnecessarily indirect, and produces figures that are inconsistent withwhat families in El Salvador say they are receiving.
A2.09 An estimate can be based on the average amount which eachrecipient family surveyed says it gets from all its relatives in the USA($128 per month), and the estimate of 328,000 recipient families (paragraph2.05). This results in estimated total remittances of about $504 millionin 1986, only half of the original UCA estimate but about triple theofficial estimate ($174 million).
A2.10 This can be more or less reconciled with the data on remittingIndividuals in the USA, (where a sample of 1304 emigrants reported monthlyaverage remittances of $116.67), by assuming that the US sample representsheads of households rather than the entire emigrant population. Thoughemigrant household size data is not available, the survey data indicatesthat 312 of the sample were accompanied by spouses, and 53S by one or morechildren. Under these circumstances, average family size cannot be lessthan 1.85. Using this factor would give a remitting population of at most432,000, and maximum remittances of $605 million per year.
Past Growth
A2.11 These two estimates give a range of remittances per Salvadoranresident in the USA of from $625 to $750 per year, or 2 to 2.5 times theBCR figure based on 1979. They can be combined with UCA survey data on therelationship between years' residency in the USA and amount remitted, andthe CELADE time profile of Salvadoran emigration, to give estimate totalremittances year-by-year. The calculation proceeds in 3 stages:
i) A normal distribution curve was fitted to theresidency/remittance data for 1986/87, giving a smooth profileup to 33 years residency in the USA (an outlying data point atyear 0 was omitted, since it was based on only 5 observations).
ii) This profile was used to determine total remittances for eachyear at 1986 prices.
iii) Remittances were deflated to current prices using average wagesin US manufacturing.
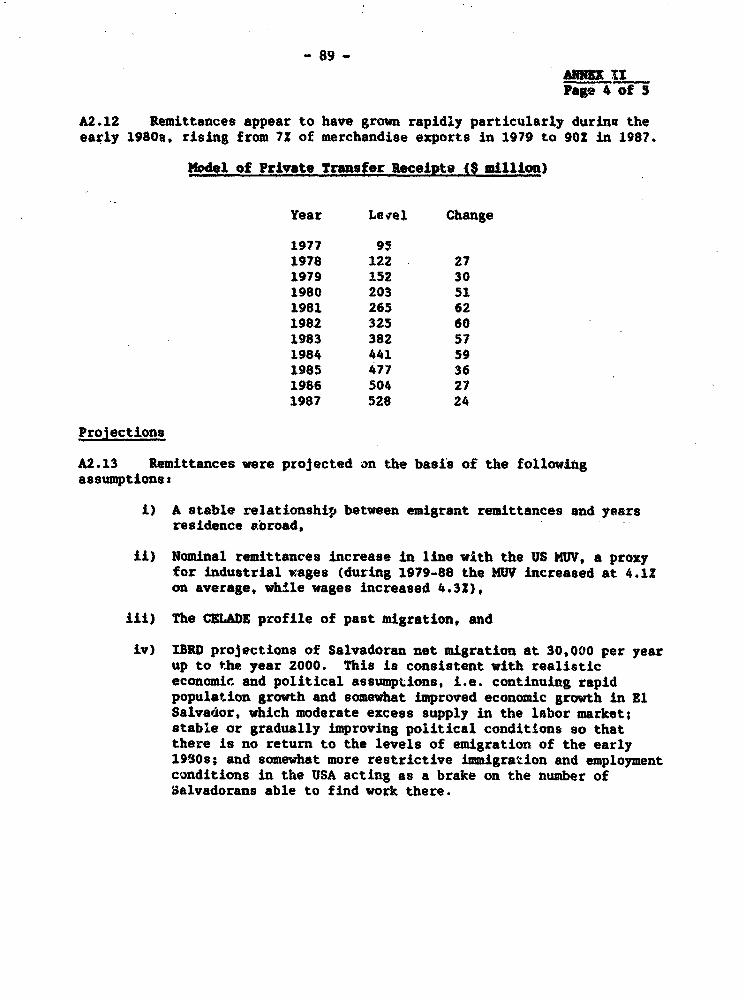
- 89 -ANNEX lIPate 4 of 5
A2.12 Remittances appear to have grown rapidly particularly durinv theearly 1980u, rising from 72 of merchandise exports in 1979 to 902 in 1987.
Nodal of Private Transfer Receipts ($ uillion)
Year Lerel Change
1977 951978 122 271979 152 301980 203 511981 265 621982 325 601983 382 571984 441 591985 477 361986 504 271987 528 24
Prolections
A2.13 Remittances were projected -an the basis of the followingassumptionst
i) A stable relationship between emigrant remittances and yearsresidence a,oroad,
ii) Nominal remittances increase in line with the US MWV, a proxyfor industrial vages (during 1979-88 the MUV increased at 4.12on average, while wages increased 4.32),
iii) The CKLAJE profile of past migration, and
iv) IBRD projections of Salvadoran net migration at 30,000 per yearup to the year 2000. This is consistent with realisticeconomic and political assumptions, i.e. continuing rapidpopulation growth and somewhat improved economic growth in ElSalvadior, which moderate excess supply in the labor market;stable or gradually improving political conditions so thatthere is no return to the levels of emigration of the early19309; and somewhat more restrictive immigration and employmentconditions in the USA acting as a brake on the number ofSalvadorans able to find work there.
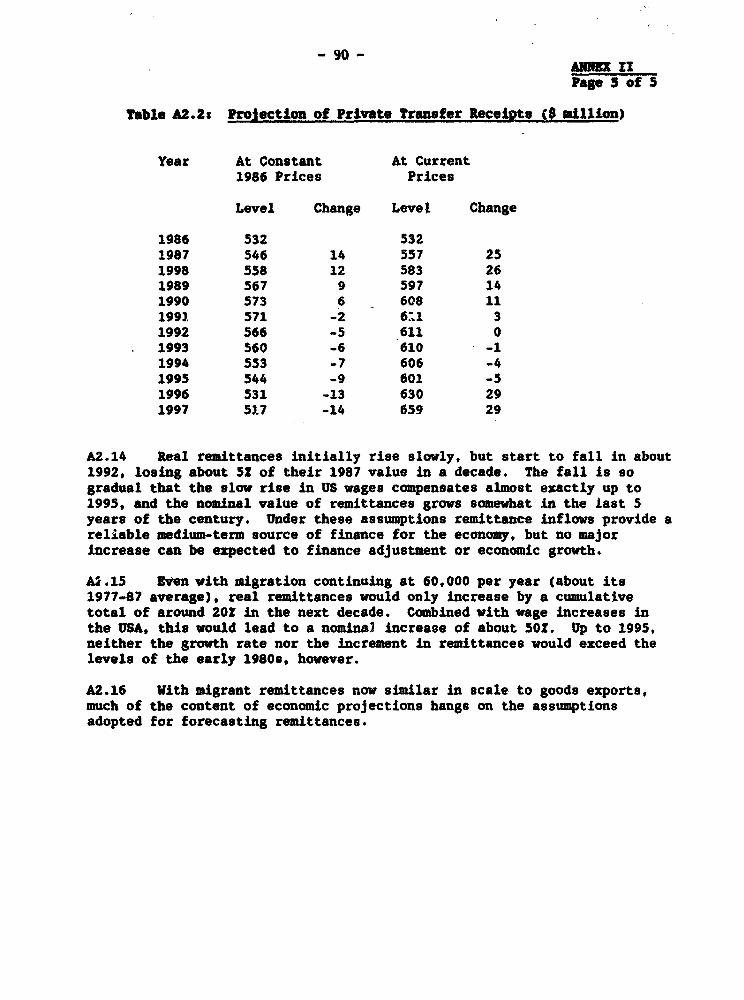
- 90 -AMI IIPage 5 of S
Table A2.2s ProJection of Private Transfer RecelQts (9 million)
Year At Constant At Current1986 Prices Prices
Level Change Level Change
1986 532 5321987 546 14 557 251998 558 12 583 261989 567 9 597 141990 573 6 608 111991 571 -2 6^1 31992 566 -5 611 01993 560 -6 610 -11994 553 -7 606 -41995 544 -9 601 -51996 531 -13 630 291997 517 -14 659 29
A2.14 Real remittances initially rise slowly, but start to fall in about1992, losing about 52 of their 1987 value in a decade. The fall is sogradual that the slaw rise in US wages compensates almost exactly up to1995, and the nominal value of remittances grows somewhat in the last 5years of the century. Under these assumptions remittance inflows provide areliable medium-term source of finance for the economy, but no majorincrease can be expected to finance adjustment or economic growth.
A2.15 Even with migration continuing at 60,000 per year (about its1977-87 average), real remittances would only increase by a cumulativetotal of around 20S in the next decade. Combined with wage increases inthe USA, this would lead to a nominal increase of about 5OS. Up to 1995,neither the growth rate nor the increment in remittances would exceed thelevels of the early 1980., however.
A2.16 With migrant remittances now similar in scale to goods exports,much of the content of economic projections hangs on the assumptionsadopted for forecasting remittances.

- 9! -
STATISTICAL APPENDIX
Table of Contents
Section I. Rational Accounts
1.1 Gross Domestic Product by Sector (current Colones) ............... 931.2 Gross Domestic Product by Sector (1962 Colones) .................. 941.3 Gross Domestic Product by Expenditure (current Colones) ... 951.4 Gross Domestic Product by Expenditure (1962 Colones) ... 961.5 Gross Fixed Capital Formation by Major Sector (current Colones).. 971.6 Gross Fixed Capital Formation by Major Sector (1962 Colones)..... 981.7 Prices, Wages & Inflation.... ... ...... . 991.8 Implicit Deflator for Gross Domestic Product at Market
F.rices by Expenditures ... ...... ................ 1001.9 Impl.'it Deflator for Gross Domestic Product at Market
Priz-,e by Sector ....... 1011.10 Real Wage Indexes ................................................ 102
Section II. Public Finances
2.1 Consolidated Non-Financial Public Sector ......... . ..... 1032.2 Central Government Consolidated Operations . 1042.3 Central Government Revenues .. 1052.3a Central Government Own Cash Revenues .. 1062.4 Current and Capital Expenditures of the Non-Financial Public
Sector ................................. 1072.5 Public Investment by Sector .1082.6 Financial Conditions of the Non-Financial Public Enterprises . 1092.7 Percentage Composition of the Current Expenditures of the
Central Government, the Non-Financial Public Enterprises,and the Non-Financial Public Sector ..l
2.8 Central Government Expenditure by Functional Category .1112.9 Financing Sources of the Non-Financial Public Sector Deficit .....112
Section III. Balance of Payments
3.1 Balance of Payments ........................... 1133.2 Value, Volume and Unit value of Principal Exports . . 1153.3 Economic Classification of Imports .................... 116
Sections Iv. Agricultural Statistics
4.1 Area Production and Yield of Principal Crops ..................... 1174.2 Indices of Agricultural Production ............................... 1184.3 Value of Food Imports .......................... 1................... 194.4 Volume of Food Imports ........................................... tZo4.5 Coffee Production and Exports ...... 1214.6 Average Annual Consumer Prices of Staple Foods Subsidized
by IRA on Open Market and in IRA Shops .1224.7 Coffee Exports anl ICO Quotas .123

- 92 _
Section V. Industrial Statistics
5.1 Gross Value Added Manufacturing .............. ................... 1245.2 Gross Value Added Manufacturiug, 1962 Caloues .1255.3 Deflatora of the Industrial Manufacturing Sector ................. 1265.4 Gross Value of Production, 1978-87 ...... 127S.5 Employment in Manufacturing ........ .. .. . 128
Section VI. Population and EmPloyment
6.1 Population, 1950-2000 . .129
Section VII. The #NkLng System
7.1 Accounts of the Banking System . .. 1307.2 Interest Rate Regulations ...................................... 1317.3 Minimum Capital, Reserve and Portfolio Requirements .............. 133
Section VIII. External Debt
8.1 External Debt . ............ .134

T.bet 1.1EL SALVAMit: 0E1Wt1 FfiOIrT 8rV sOf
(Hi tll, of Current C04000*)
1976 19 17? 1970 197o 1960 1s1 192 1918 sq14 1965 191S 1917 188 a/
Priu& Y Producticn 8.0 1622.2 2882.2 2017.4 2617.7 2491.5 21108.6 20.0 2175.7 2a80.0 2631.3 299.6 8236.5 3797.2Agriculture 1028.2 1014.4 2874.1 2048.9 2508.2 2480.2 2106.0 207.4 21o.6 2319.6 2*10.8 3968.9 3198.4 377D.2t:ninq 7.4 7.8 8.1 8.5 9e. 11.$ 12.8 13.6 15.2 18.2 20.7 26.7 38.1 47.0
Semtdory Production 1107.S 1288.3 1460.4 8516.0 1s41.6 t814.4 UNA. tS2.1 219.4 2473.6 3116.0 4050.9 6262.4 415.2Ilnfawtv1ng 681.3 982.0 1046.0 IM4.7 N7.e 139.4 189.1 1UB1.6 157l.1 1687.1 2345.7 O0S5.7 40".8 48o3.3Conetruction 219.4 21.8 W27.8 819.8 '336.6 806.9 284.2 200.6 343.4 355.3 437.0 847.1 710.4 019.6Public utilI iet. S0.0 69.4 106.5 131.6 167.2 169.1 191.6 1"9.7 243.9 281.2 335.3 418.1 497.2 33s.3
Services 2334.8 2.4 3304.4 897s.8 4248.0 480,6 4693.0 4993.1 3816.7 643.6 Sl.S 11716.4 14651.7 1738.1Traneport & commnictMons 187.6 211.1 242.8 291.0 29l.9 813.5 828.2 840.7 411.S 480.6 613.3 8SS.0 1060.8 1197.2tommerco 1112.1 1411.6 1600.9 1903.6 2005.5 2037.7 2097.6 208s.9 2309.5 2994.8 38s7.0 s8.62 72.3 s861.8Blnking, Ineur. A Real Estate 128.2 156.9 234.4 259.8 286.2 801.9 298.2 830.8 3s7.0 82.1 442.0 364.0 640.0 179.2
Couming 171.9 192.2 27.0 294.0 318.3 308.9 45118 471.0 8W.9 629.S 747.4 939.3 1182.1 1S2D.3Pub. min. & Def"ee 383.8 483.7 570.7 718.s 785.7 916.4 943.5 1049.7 1170.9 1360.2 1602.8 1976.5 2207.1 237t.6Per.onal services 3st.2 3a7.9 428.6 489.4 362.4 637.2 60.7 700.0 683.1 982.4 1218.2 1794.3 2286.4 273.0
DP at Marelt Prices 44,7.7 670S.9 7167.0 7692.2 8607.3 6916.5 8646.4 S896.2 10151.8 11087.2 14330. 19762.9 23140.6 27M3.
3/ Prelieinary.
Source: Central Bank of El Satvedor .06881.W(1
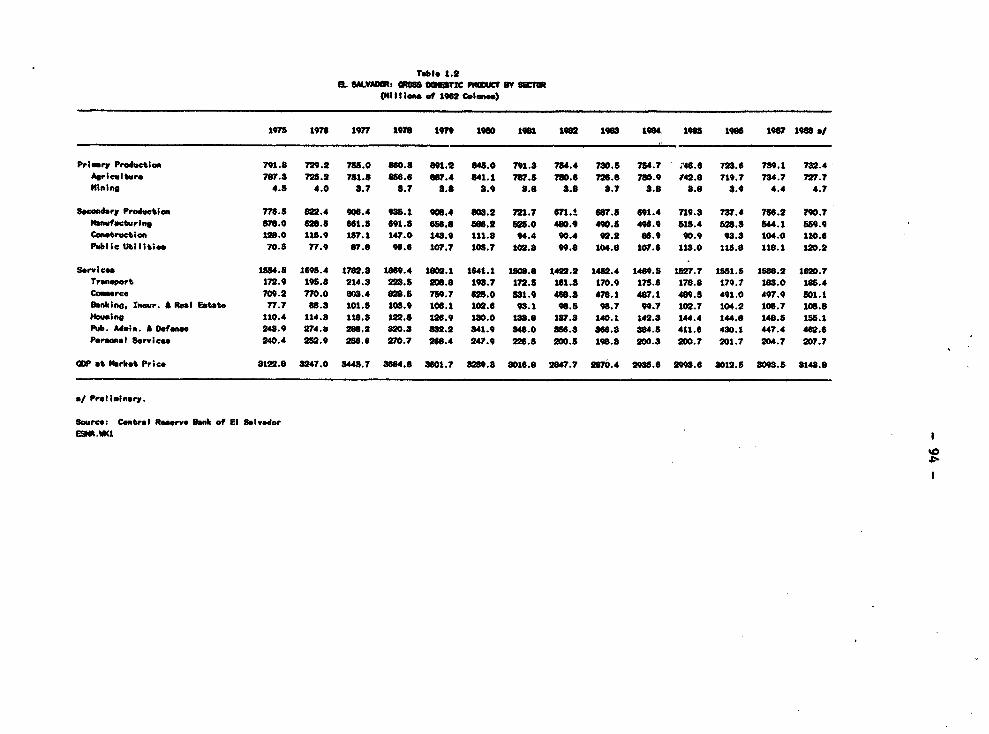
Table 1.2EL SALVADR: a5 DOTIC 1NOCW BY SS
(1IiI..I .4 1f62 Colon".)
1975 1975 197 197o 1979 1960 1981 1962 196 3 t1O8S 19 17 196 a
P.imry Production 791.8 729.2 78.0 060.8 091.2 845.0 79.8 754.4 730.5 754.7 .'48.6 728.0 7.1 732.4Ariceulture 787.3 75.2 7M.8 088.6 6s7.4 041.1 7?7.5 750.6 726.8 70.9 142.8 719.7 74.7 727.7Mining 4.5 4.0 3.7 3.7 3.s 8.9 3.0 8.6 s.7 8.0 8.6 8. * 4.4 4.7
Secondary Prwduction 776.5 622.4 906.4 985.1 906.4 606.2 M.7 671.1 667.5 691.4 n9.3 7s7.4 76.2 790.7Manufacturing 576.0 628.6 66S1. 691.5 68. M88.2 652.0 480.9 490.5 496.9 515.4 s28.a 44.1 589.9Conetruction 120.0 115.9 17.1 147.0 148.9 111.8 94.4 90.4 92.2 86.9 90.9 98.8 104.0 110.6Public UtilI ti 70.8 77.9 07. 96.6 10r.7 105.7 U02.8 9.6 104.8 107.6 11.0 115.8 118.1 120.2
Services 1584.5 1695.4 1782.3 1869.4 1602.1 1641.1 1s8a.s 1422.2 1452.4 1409.s 1527.7 1581.5 t6se.2 1620.7Tranaport 172.9 195.s 214.3 223.5 206.8 196.7 172.5 161.8 170.9 175.6 178.8 179.7 188.0 185.4Commerce 709.2 770.0 80.84 628.5 789.7 625.0 831.9 466.8 476.1 487.1 409.8 491.0 497.0 801.1Seeking. Iaur. A Real Eatat. 77.7 88.9 101.8 106.9 106.1 102.6 98.1 9e.5 98.7 99.7 102.7 104.2 106.7 108.6Hualng 110.4 114.3 116.8 122.5 126.9 10.o 13.6 187.8 140.1 142.8 144.4 144.8 148.8 135.1Pub . Ads;e. A 0of.ne 248.9 274.8 288.2 820.8 862.2 841.9 846.0 S6.8 866.3 304.5 411.6 430.1 447.4 462.6Personal Services 240.4 252.9 256.6 270.7 266.4 247.9 Z26.8 200.8 190.8 200.3 200.7 201.7 204.7 207.7
CDP *t tMrket Price 8122.6 247.0 8448.7 3684.s 8601.7 3289.8 3016.6 2847.7 2570.4 2985.6 29.6 8012.5 83o.5 8148.0
*/ Preliminary.
Source: Central Raogrv* ean ot El Salvador
E0
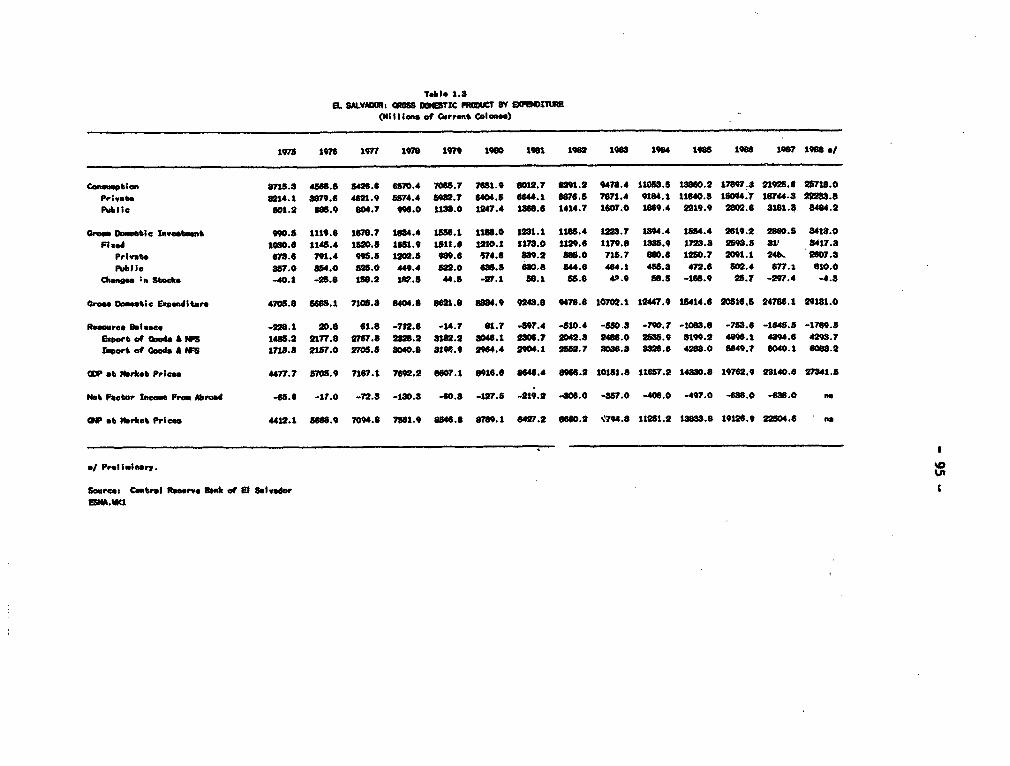
Table 1.8EL SALVADOtR: 86068 OS*TIC PROEUCT SY Eo nzE
(Ml Ins of Crrent Won**)
197s 197$ 1977 1976 19 80 1980 181 1962 1988 1964 1e85 1986 197 1988 */
Co_tt~b1es 8715.8 4565.5 s5.6 6570.4 7065.7 7151.9 0012.7 8091.0 9478.4 110583.5 1*60.2 17897 2192.6 Wi71s.0Private 8014.1 3887.6 462.9 1874.4 540.7 6404.5 644.1 76.5 78n.4 9184.1 1140.3 1094.7 187444 S9s.sPub ic 601.2 6.9 804.7 9".0 1186.0 1247.4 I6.6 1414.7 1607.0 1869.4 2219.9 2802.6 8181.8 8484.2
Cross O tmebe Investsut 990.5 1119.6 178.7 1884.4 1556.1 116.0 I8.1 165.4 103.7 84.4 54.4 2619.2 280.5 841t.0FPied 10.6 1145.4 1500.5 166.9 1511.0 1210.1 1178.0 1129.$ 1179.8 18.9 1728.3 259.5 81- 9417.8
Private 67.6 71.4 995.5 1202.5 98e.6 S74.6 89.2 S8S.0 715.7 880.6 1250.7 2091.1 24b. 607.8PubI le 857.0 854.0 505.0 449.4 802.0 mW.s 680.8 S44.6 414.1 455.8 472.6 502.4 577.1 810.0
Changes t Stock. -40.1 -25.8 158.2 1p7.5 4.5 -27.1 58.1 55.8 44.9 58.5 -151.9 28.7 -297.4 -4.3
Croas Do_estic Eip,snture 470S.8 665.1 7105.9 8404.8 8621.8 a884.9 948.8 s476.8 10702.1 12447.9 15414.6 20516,5 24786.1 29181.0
Resource blance -228.1 20.8 61.8 -712.6 -14.7 1.7 -507.4 -S10.4 -55.3 -79O.7 -1088.8 -753.6 -1645.5 -1789.5espxwt of Coeds A N 1485.2 2177.8 2767.8 2826.2 8182.2 S046.1 2s06.7 2042.8 2486.0 21535.9 819.2 4896.1 4894.5 4296.7lort of Coods a Ws 171S.8 2157.0 2705.5 8040.8 319e.9 2094.4 204.1 2582.7 8306.8 S826.6 4288.0 5e49.7 6040.1 6088.2
5MP st arkt Prices 4477.7 s5s.s9 717.1 7692.2 8607.1 8916.6 8646.4 8966.2 10151.8 11657.2 14330.8 £9762.9 28140.6 27341.5
Nat FPctow tIcom FrPo Abroad -es.6 -1.0 -72.8 -130.3 -40.3 -127.S -19.2 4306.0 -857.0 -406.0 -497.0 -6e6.0 -66.0 n
@W *t Karbet Price 4412.1 5688.9 7094.6 7581.9 8546.8 8789.1 8427.2 0860.2 74s.8 11251.2 13s8a.8 19126.9 22504.4 no
*/ Preliolnuy.
Sourcel Central Resrve Beno of El Se lvdo'ESMA.UK
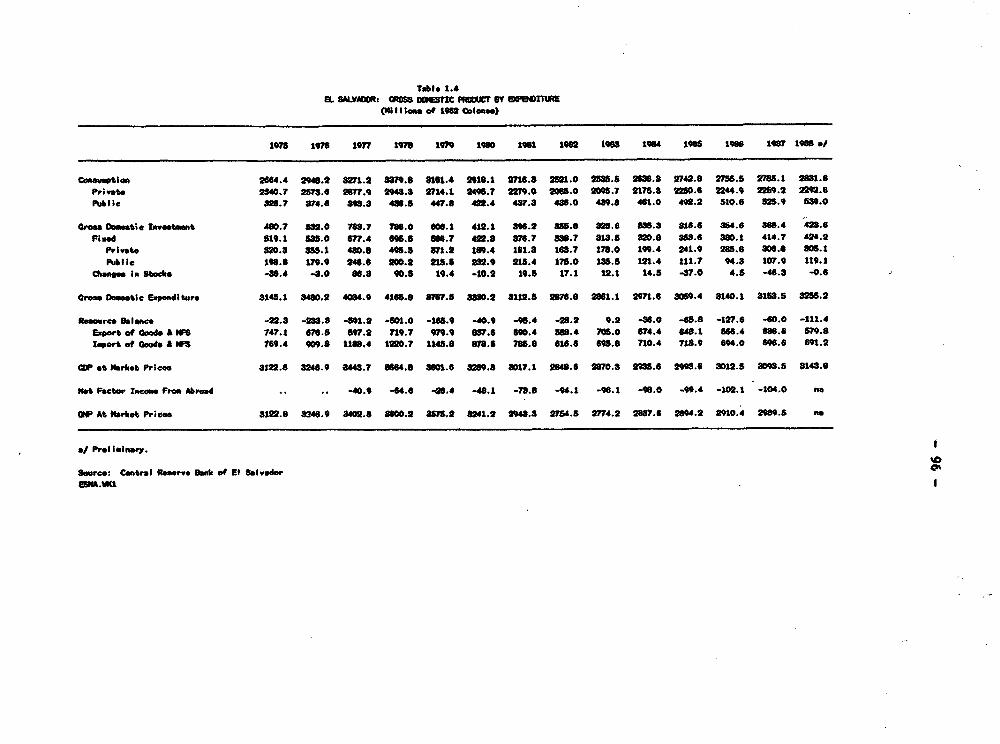
TAle 1.4EL SiLVAR QSS ar8 RDUC FM=, 8Y WO9ITUE
(HiIlon a9f 1962 CWols)
1975 1976 19e7 1976 1979 100 1981 1962 198 19t 1s0 1906 <17 19"8 /
Commotian 2664.4 2946.2 82n.2 8379.0 3161.4 2910.1 276.8 2S2t.0 253.8 2636.3 2742.8 2755.5 2785.1 2631.6Private 2840.7 2578.4 2677.9 2943. 2714.1 2498.7 2279.0 208s.0 20".7 2175.3 220.6 2244.9 2259.2 22M0.6Publlc S28.7 8374.0 8.8 486.5 447.8 422.4 437.8 430.0 489.0 461.0 402.2 510.6 52.9 539.0
toae. DOstie Investmen 400.7 S32.0 763.7 7e6.0 606.1 412.1 896.2 855.8 825.6 858.3 818.6 364.6 868.4 428.6Flood 519.1 3S.0 677.4 M6.5 56.7 422.8 876.7 8SS.7 813.5 820.0 858.6 380.1 414.7 424.2
Privt. 820.3 8.1 480.8 495.8 871.2 189.4 161.8 168.7 178.0 19.4 241.9 285.8 306.0 S6.1Public 198.8 179.9 246.6 200.2 218.8 232.9 215.4 175.0 15.5 121.4 111.7 94.3 107.9 119.1
,ana. to stjol -88.4 -3.0 06.8 90.s 19.4 -. 0.2 19.5 17.1 12.1 14.5 -8.0 4.5 -46.3 -0.6
aros Oamotic Ewpadltur. 3814.1 3480.2 4084.0 4165. 3767.6 888.2 SU2.5 2976.8 2061.1 2971.6 3809.4 8140.1 I 1S8.5 8265.2
R.a-re Bala -22.3 -288.3 -891.2 -801.0 -188.9 -40.9 -95.4 -2S.2 0.2 -4.0 64.8 -127.6 -60.0 -111.4Expert of Goodo & WNS 147.1 676. 9 S47.2 719.7 979.9 67.6 690.4 580.4 705.0 674.4 648.1 566.4 68s.6 579.8Import of aOmod A WFS 169.4 909.8 118.4 1220.7 1145.8 078.6 785.0 616.6 695.8 710.4 718.9 694.0 696.6 691.2
CDP t Narkot PHces 3122.8 8248.9 443.7 S664.8 8601.6 826.8 8017.1 248.6 2870.8 2X35.6 2"9.6 8012.5 8096.5 3148.0
Not Factor Ince_ Frm Abroad .. .. -40.9 44.6 46.4 -48.1 -78.8 -94.1 -"6.1 4.0 -w.94 -102.1 -to4.0 no
UW At NarIIo Prices 8122.8 3246.9 8402.8 8600.2 S575.2 8241.2 294.3 275.S 274.2 2887.6 2894.2 2910.4 2989.5 r.
*/ ProlUinary.
Sourc.: Cntral Ramrv. San of El Salvador °-9MM
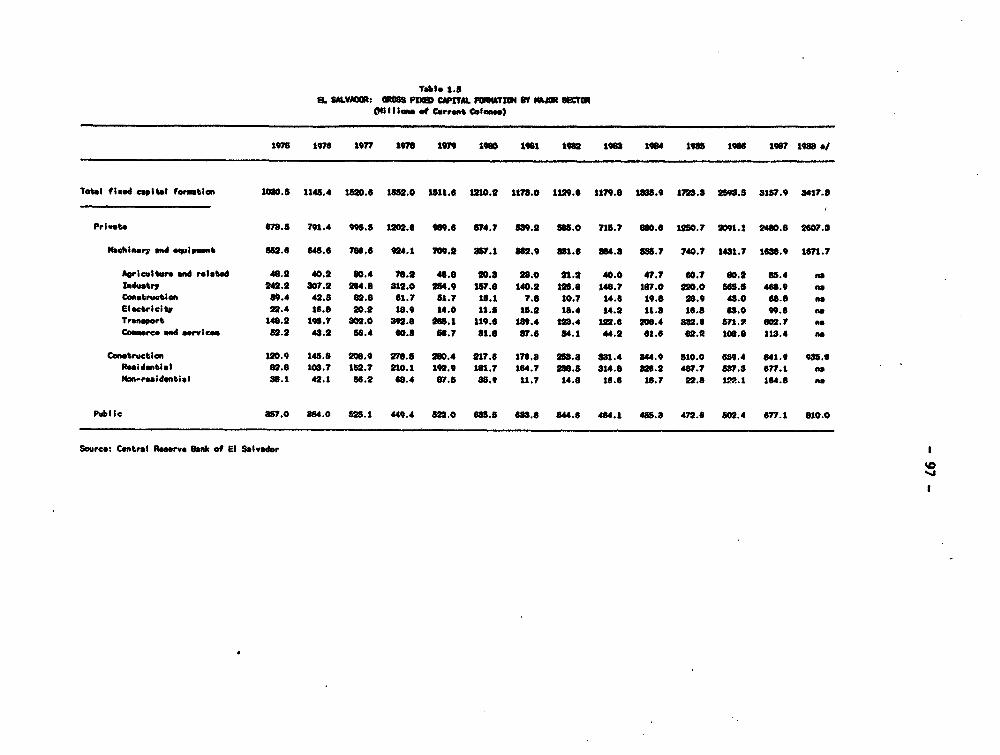
Table 1.8EL SALV46OIR 0 CWZAL W.TIW4 BV /jM As
(HiII lo, of Crrent Calome)
75s 16 1977 19e7 19t" 1980 1981 192 1M 1984 1965 19 1987 1M68 */
Torhl fired caPitaI foratla 103.5 1145.4 182.5 602.0 111.6 120.2 1175.0 1129.6 1179.8 386.9 1728.8 2593.8 3157.9 8417.6
Private 678. 791.4 955 12.# 969.6 6Y74.7 639.2 asO.0 715.7 600.6 s2e0.7 2091.1 2480.6 2607.3
Machinery Vd equipment 88.6 648.6 786,6 924.1 709.2 3s5.1 I 62.9 831.6 384.3 666.7 740.7 1431.7 1638.9 1671.7
Aorlculture nd retlte 48.2 40.2 60.4 78.2 46.0 20.5 23.0 21.2 40.0 47.7 60.7 60.2 65.4 ma
Industry 242.2 307.2 204.8 811.0 254.9 157.6 140.2 125. 146.7 187.0 2i0.0 665.5 468.9 as
Construction 80.4 42.5 62.8 61.7 51.7 18.1 7.5 10.7 14.8 19.0 20.9 43.0 68.8 na
Electricity 22.4 16.0 20.2 10.9 14.0 u. 15.2 15.4 14.2 11.3 16.8 63.0 e9.6 i
Transport 148.2 198.7 302.0 392.0 A.1 119.s u9.4 125.4 122.6 28.4 82.6 871. 602.7 as
Commerce ad services 82.2 4a.2 56.4 60.5 86.7 1.s 874.6 84.1 44.2 61.# 02A 16. 113.4 as
Cmtrtctlon 120.9 145.8 200.9 278.5 200.4 217.6 170.3 238.8 831.4 844.9 510.0 659.4 041.9 935.6
Residential e2.8 103.7 152.7 210.1 192.9 101.7 164.7 288.5 814.0 826.2 467.7 637.a 677.1 as
3on-reaidentiol 30.1 42.1 56.2 68.4 67.8 as. 1U.7 14.6 16.6 1S.7 22. 1MA.1 184.8 A
Publ3e 7.0 864.0 82.1 449.4 823.0 SM.S 68.0 844.6 454.1 488.8 472.6 80.4 677.1 010.0
Sorce: Central Raeervt Bank of El Salvador
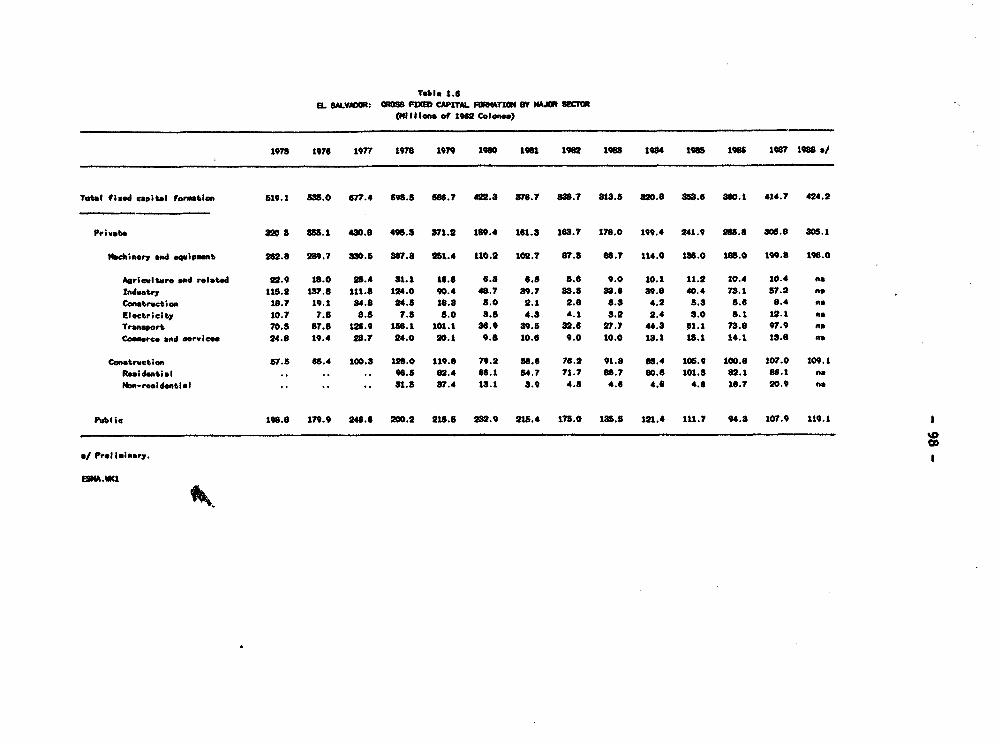
Table 1.6
IL SALVA8R: In ss9 CAPITAL FOeITrWN BY NAJR s0fT
1978 1976 1977 1978 1979 9O 1981t 1982 1966 1984 1968 19ss 1907 1908 */
Total fixed capital formation 819.1 83 .0 677.4 698.5 506.7 422.8 378.7 866.7 818.8 820.8 853.6 360.1 414.7 424.2
Private 320 S 3SS 1 43o.8 495.8 371.2 189.4 161u. 163.7 178.0 19.4 241.9 208.0 80.8 0S8.1
Nchmanery and eupmab 262.0 289.7 S30.S 867.3 28.4 110.2 102.7 87.8 06.7 114.0 180.0 188.0 199.0 196.0
Agrimultur and related 22.9 18.0 28.4 81.1 16.8 6.8 6.8 5.8 9.0 10.1 11.2 10.4 10.4 fiIndustry 11S.2 137.6 l1.8 124.0 90.4 46.7 39.7 83.3 38.6 89.6 40.4 7.1 57.2 noCamabructico 18.7 19.1 s4.8 24.6 10.8 8.0 2.1 2.8 8.8 4.2 5.8 8.t S.4 naElectr;city 10.7 7.5 8.8 7.8 8.0 3.8 4.8 4.1 8.2 2.4 3.0 8.1 12.1 I ..Traneport 70.8 87.6 126.9 156.1 101.1 3s.9 39.8 32.6 27.7 44.8 61.1 73.6 97.9 noCommerce and seryicee 24.6 19.4 28.7 24.0 20.1 9.6 10.8 9.0 10. 13.1 I5.1 14.1 18.0 8
Conetruetion 87.5 65.4 100.8 120.0 119.0 7.2 88.6 76.2 91.8 65.4 10S.9 100.8 107.0 109.1Residential es.s 82.4 06.1 54.7 71.7 80.7 60.0 101.8 82.1 06.1 n.MNon-residential 81.8 87.4 18 1 8.9 4.8 4.6 4.6 4.6 10.7 20.9 n.
Public 19S.8 179.9 24S.6 200.2 218.8 282.9 215.4 178.0 135.5 121.4 l1.7 94.8 107.9 119.1
a/ Profi miary.
EM.WKI

Table 1.7EL SALVAOR: Prices, Walbs and Inflation, 1997-88
IM 1977 1976 1979 1980 1981 1992 1986 1984 1985 1986 16? 1968
Consuer Price Index 67,1 76.0 86.2 100.0 114.7 128.2 145.1 162.0 108.2 281.4 826.6 m1.
Annl Growth Rate:
Consumer Pries 11.7 18.8 12.1 17.4 14.7 11.7 18.1 11.7 22.4 81.9 24.9 19.8
Wholesale Pricesi ce offee 47.8 -19.8 7.6 16.8 l1.O 8.5 6.6 5.9 18.6 na a
Wholale Pricesexel coffee 11.8 4.6 10.1 10.4 12.4 6.5 8.0 7.1 17.9 19.7 15.4 no
OPbe tlator 18.4 9.9 18.9 18.4 6.7 9.0 12.8 12.8 26.6 87.9 14.0 10.8
usimal Minimum Wa a/
Industr TradeAnd Service
San Salvador SO me 9.0 11.0 11.0 11.0 11.1 18.9 18.9 16.0 15.O 10.5
Agriculture A Livestock
Older than 10 NO 5.2 6.2 6.2 5.2 5.2 6.2 5.2 6.9 6.0 9.9
eI in Colome, per8 hobur of doily work. ^°
Source: Central Resrve Bank of El Salvador.ESPRICEMIK
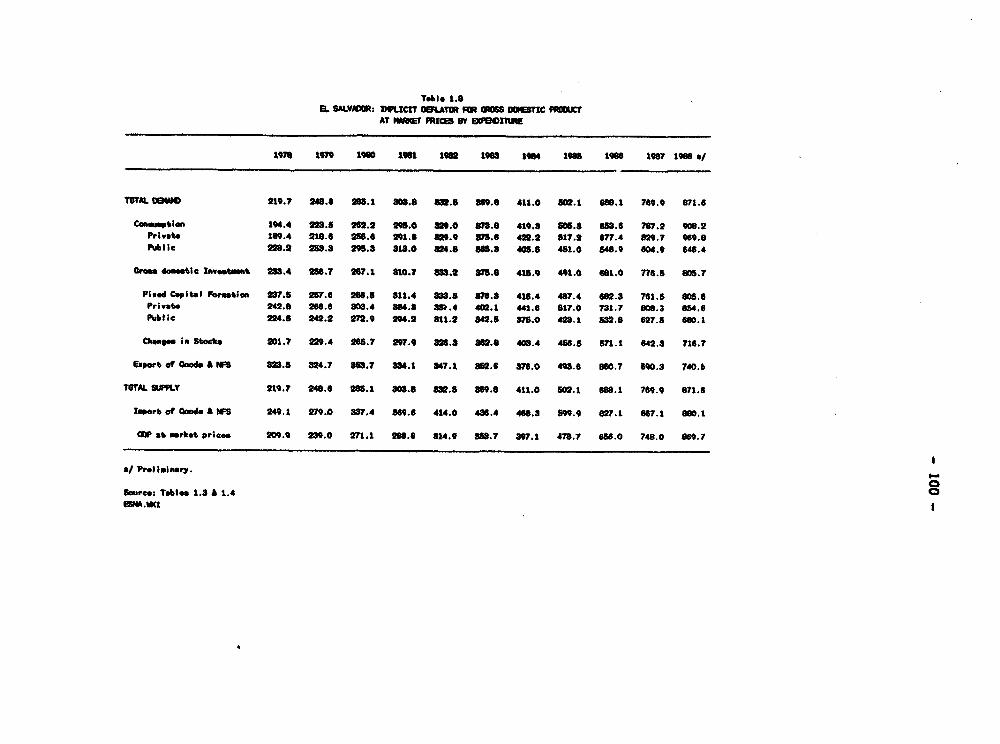
Tabl 1.8B. SALVA0Ut fIt CIT 8OUITR FOR IDS O2TC FRe m Cc
AT "MM(5 FfMS BY 80BQrlW
1970 1979 1960 1901 1932 Igo 1964 195 1966 1987 tess */
TOTAL Cowl 219.7 246.6 13.1 306.0 862.6 869.0 411.0 602.1 688.1 769.9 871.6
Cciasuptien 194.4 28.6 262.2 2905.0 2.0 87.8 410.8 S06.8 653.6 707.2 908.2Private 189.4 218.6 256.6 291.6 82.9 87.6 422.2 517.2 77.4 2.7 969.8Public 238.2 25z.8 296.8 818.0 #4.8 868.8 406.6 481.0 54.9 604.9 646.4
Ore.a d_nbic Iwmeste_t 283.4 256.7 2817.1 810.7 313.2 7s.s 418.9 491.0 68.0 776S. aos.?
Ftied Capital Forutiun 287.5 257.6 266.5 811.4 838.5 076.8 416.4 487.4 682.3 761.5 605.6Privat* 242.8 266.6 808.4 834.8 8S.4 402. 441.6 817.0 731.7 806.3 6s4.6Pu.blic 224.5 242.2 27.9 294.2 311.2 842.5 8S.0 423.1 532.6 627.8 4O6.1
Cbane i n Stlcks 201.7 229.4 268.7 2e7.9 826.3 862.8 408.4 466.5 571.1 642.8 716.?
Cerit of Goods a WS 28.5 8247 868.7 3S41 847.1 862.6 876.0 498.6 860.7 o0.8 740.b
TOTAL SUPPLY 219.7 240.6 285.1 303.6 832.5 S86.8 411.0 802.1 68.1 769.9 671.8
lwort of Good A NFS 249.1 279.0 337.4 69.6 414.0 436.4 4608.3 89.9 827.1 66.1 660.1
(DP at m_rk. pric. 209.9 289.0 271.1 286.6 814.0 858.7 897.1 478.7 65e.0 748.0 86.7
*/ Pre l imnary.
Smarte: Table. 1.8 A 1.4ESN.WtK1
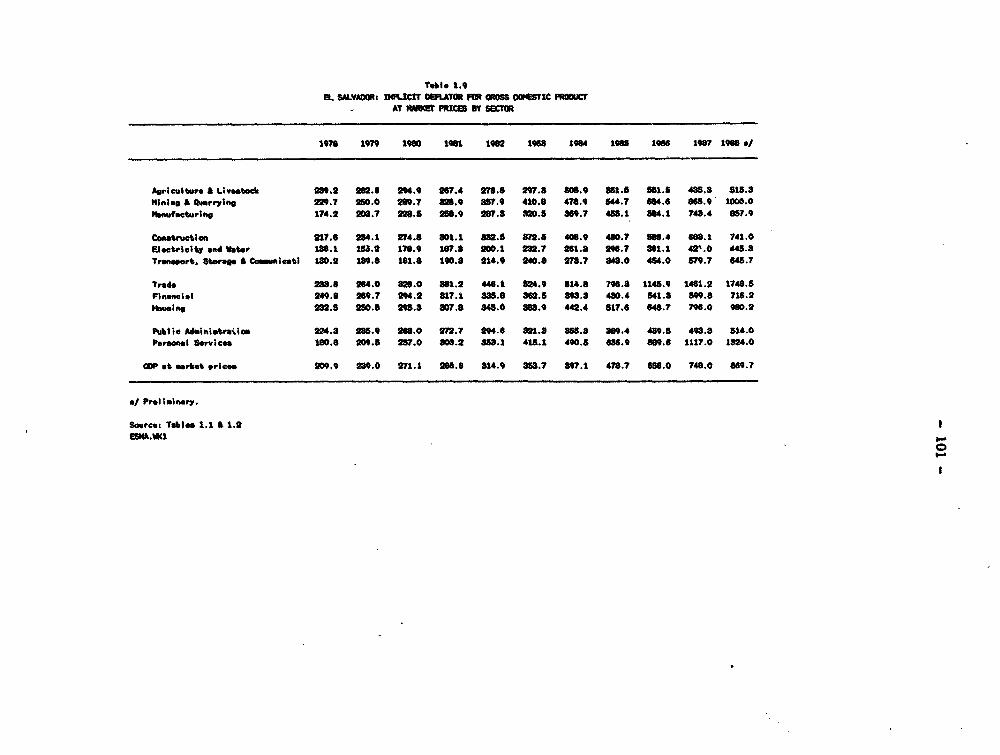
Tablo 1.9
EL SALVAtOR DPLICIT 0eEFATO FOR 0 00POTMC PROIXICtAT NOWc8 PRICES BY skiM
1978 1979 1960 1981 1982 1965 1984 1985 19S6 1987 19680*
Aprcultere & Livletoc. 289.2 262.8 204.9 267.4 276.8 297.8 808.9 851.5 551.5 435.3 815.3
"inZn a 4btryino 229.7 250.0 2s9.7 828.9 8f7.9 410.8 478.9 544.7 6e4.6 868.9' 100.O
lf teaturl"we 174.2 208.7 228.5 28.9 8?7.8 820.5 869.7 45S.1 864.1 743.4 S67.A
Conetruction 217.6 234.1 274.8 801.1 882.5 82.5 408.9 460.7 566.4 688.1 741.0
Electrlicty and Water 1IN 13.2 178.9 187, 200.1 232.7 261.a 296.7 361.1 42".0 4465.
Traoeprt, Stefg A Coulcatl 180.2 189.8 181.8 190.8 214.9 240. 278.7 843.0 454.0 579.7 646.7
Trade 288.6 264.0 826.0 386.2 445.1 524.9 614.8 7".S 1145.9 1461.2 1748.5
Fnancial 249.8 269.7 294.2 817.1 385.8 862.5 898.8 480.4 541.8 599.8 716.2
H"mino 232.5 250.8 29.8 s07.8 843.0 838.9 442.4 517.6 648.7 796.0 980.2
Puablc Adeinistebi,n 224.3 2s5.9 266.0 272.7 294.6 821.8 85.8 389.4 4O9.8 498.8 514.0
Pereanl Services 180.0 209.5 257.0 S03.2 8S5.1 415.1 490.5 6.9 s89.6 1117.0 IS04.0
CDP at srigt prices 209.9 289.0 271.1 288.6 814.9 85S.? 897.1 478.7 686.0 748.0 869.7
*J Prellsei.y.
Source: Table 1.1 1 1.2IMAKW .w1 . o~~~~~~~~~~~~~~~~~
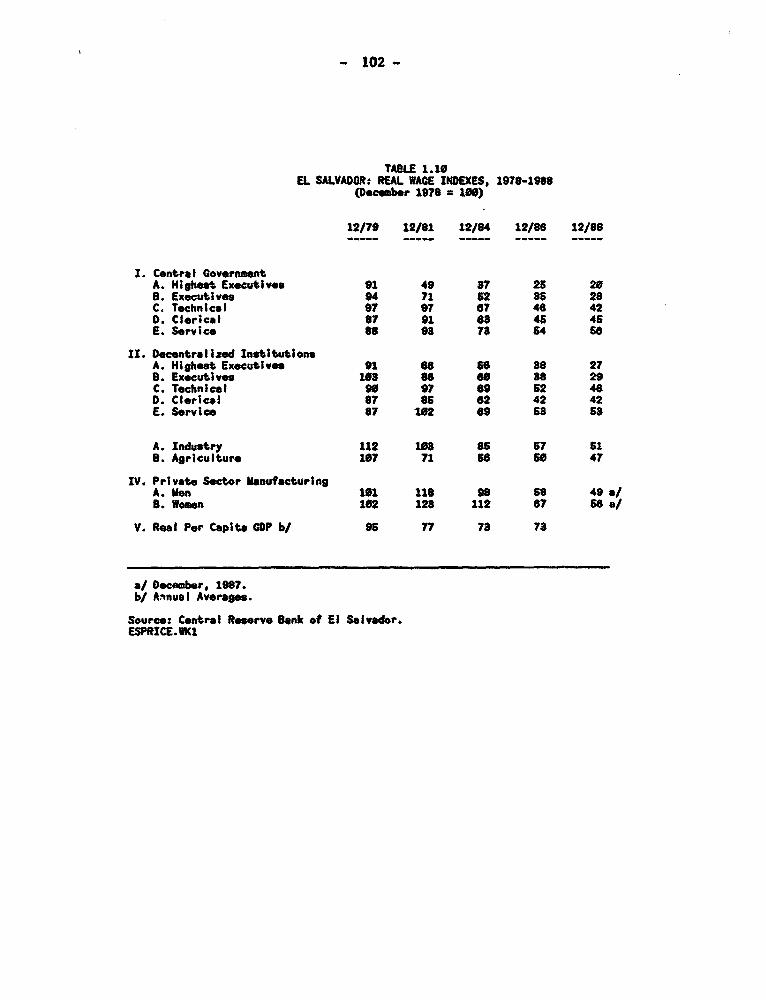
- 102 -
TABLE 1. 10EL SALVADOR: REAL WAGE INDEXES, 1978-1988
(December 1978 a 100)
12/79 12/81 12/84 12/86 12/88
I. Central GovernmentA. Higheat Executive 91 49 37 25 20B. Executives 94 71 62 a5 28C. Technical 97 97 67 46 42D. Clerical 87 91 63 45 45E. Service 88 98 78 54 s6
II. Decentralized InstitutionsA Highest Executives 91 66 56 a8 2798 Executives 103 86 69 88 29C. Technical 90 97 69 52 48u. Clerical 87 86 62 42 42E. Service 87 102 69 58 sa
A. Industry 112 103 85 57 51B. Agriculture 107 71 E6 so 47
IV. Privato Sector ManufacturingA.Men 101 118 98 s8 49*/0 Women 102 123 112 67 S6s/
Y. Real Per Capita GOP b/ 96 n 73 73
a/ Decesbers 1887.b/ A,nuat Averages.
Source: Central Reserve BDnk of El Salvador.ESPRICE.WK1

Table 2.1EL SALVADOR: CONSOLIDATEI) OPERATIONS OF THE HONFINANCIAL PUBLIC SECTOR
(Ml lions of Cotones)
Transactions 1980 1981 1982 9883 1984 1985 1968 1987 1968
I.Current Revenues (A+S-C) 1,753.4 1,676.7 1,98M.4 2,246.4 2,627.0 2,862.6 4,1C1.4 4,385.7 4,659.2
A. Tax 989.8 9W.8 962.2 1,079.6 1,350.0 1,659.4 2,581.8 2,542.8 2,847.4
S. Non-Tax 769.4 90a.8 1,083.8 1,171.4 1,184.6 1,196.6 1,621.9 1,616.4 1,712.8
C. Adi. for taxes not chsrge 26.6 17.4 6.1 5.6 6.1 (6.6) 41.8 9.0 S.9
UI.Current Expenditures (A+.BC) 1,M77.1 1,689.9 1,918.8 2,817.1 2,649.8 2,785.2 8.614.7 4,117.6 4,842.6
A. Consumption 1,612.5 1,596.9 1,614.6 1,871.2 2,187.4 2,848.7 8,001.8 &,51.6 3,09.6
1. Ws S laries 984.7 988.1 1,92.8 1,129.9 1,498.0 1,629.5 1,662.2 2,298.3 2,484.6
2. Goods a Servie. MS.6 618.6 686.2 741.8 784.4 714.2 1,019.1 1,209.8 1,210.7
B. Interest 71.0 126.7 189.2 8O998 887.8 248.6 478.1 494.0 403.71. Internal Debt 81.8 80.7 156.6 228.0 221.0 162.2 264.6 193.) 149.7
2. External Debt 40.8 49.9 80.7 86.2 116.2 64.4 2098.6 211.1 254.9
C. Transfers 94.0 118.4 112.8 138.1 174.1 144.9 146.3 206.4 248.8
III.Current Savins (I-II) (24.7) 87.7 64.1 (71.7) (122.8) 127.8 646.7 240.9 217.7
IV.Copital Revenues 69.6 8.1 7.9 562.8 892.7 168.5 814.6 607.4 418.6
V.Capital Expenditures (A+S+C) 761.8 1,212.6 761.1 1,827.9 Z09.6 738.8 809.5 928.5 778.6A. Fixed Capital Formalon 69O.9 990.7 690.4 1,968.7 592.6 596.7 69.6 668.5 651.8 o
S. pRochase of Iand 0.9 9. 9.9 0 0.0 9. 9.0 190.9 189.5 64.8
C. Transfer* 71.8 221.8 79.7 269.2 98.0 184.6 103.9 70.6 87.7
VI.Not LendIng 79.4 08.8 108.8 (26.6) (77.6) (25.9) 78.7 19.2 111,.8
VII.OVERALL .StPLUS/DEFICIT(-) (O06.6) (1,280.0) (795.4) (619.8) (842.4) (421.6) (67.0) (99.4) (246.6)
VII.N.t Total Financing (A+B) 809.8 1,280.0 796.4 610.8 842.4 421.6 67.0 99.4 246.6
A. Internal (1.2) 699.6 846.2 417.4 892.0 122.6 168.1 (188.? (100.8) 2.4
1. Central Bank 477.7 OO0.9 471.9 (199.) 172.2 223.8 (295.6) 122.2 8a9.9
2. Other Source 181.8 245.2 (64.5) 501.8 (49.7) (70.7) 146.8 (222.6) (887.6)
8. External (1-2*8) 196.8 884.6 876.9 418.3 219.9 2B8.S 225.? 199.7 240.2
1. Dlsbursemnt 228.2 416.0 849.9 429.2 816.8 806.4 491.6 487.9. 469.72. Amortization 26.7 86.4 60.8 67.9 07.2 77.4 215.1 288.2 228.6
8. Other (1.2) 4.2 78.4 47.0 (28.7) (19.6) (50.0) 0.0 0.9
Source: Central Resrve Bank of El Salvador.
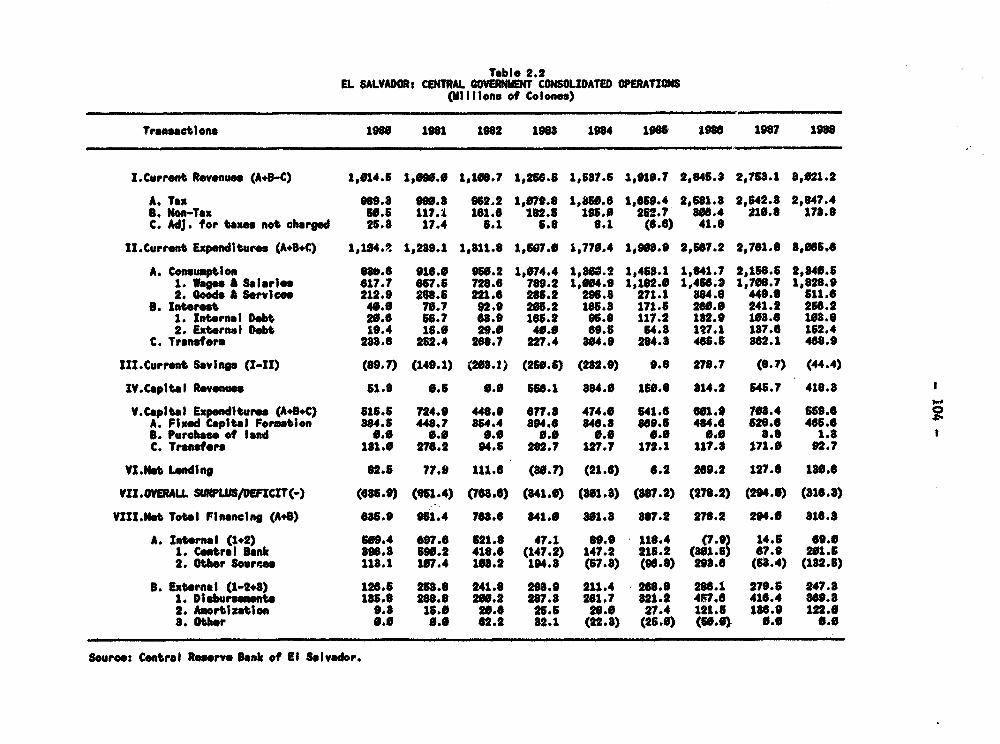
Table 2.2EL SALVADOR: CENTRAL GOVERNMENT CONSOLIDATED OPERATIO
(Millions of Colonos)
Tranactione 1980 1961 1982 1983 1964 196 1960 1987 1986
I.Curront Revenue (A4-C) 1,014.5 1,000.0 1,1U9.7 1,26G.5 1,587.6 1,9U1.7 2,845.2 2,763.1 8,021.2
A. Tas 989.8 99.8 92.2 1,078.8 1,856.8 1,65.4 2,681.8 2,642.8 2,847.4S. Mon-Tax 6W.6 117.1 181.0 182.5 195.0 25!.? 308.4 219.8 178.0C. AdJ. for taxes not cherge 25.8 17.4 5.1 6.8 6.1 (6.6) 41.8
II.Curr.nt Expedltures (A+*C) 1,104-. 1,209.1 1,811.8 1,507.0 1,770.4 1,896.9 2,587.2 2,701.6 8,096.4
A. Consumption 88o.6 016.0 960.2 1,074.4 1,80*.2 1,45S.1 1,U41.7 2,158.6 2,14.51. Was Salaries 017.7 657.5 726.6 789.2 1,694.9 1,182.0 1,456.2 1,7098.7 1,828.92. Goods A Services 212.9 268.5 221.6 286.2 295.0 271.1 884.0 449.6 611.6
8. Interet 40.0 70.7 .9 206.2 185.8 171.5 260.0 241.2 268.21. Internl De 20.6 66.7 08.9 106.2 95.6 117.2 182.9 108.6 108.82. Extrnal Debt 19.4 16.0 29.0 40.0 69.5 64.8 127.1 187.0 162.4
C. Transfer 281.8 262.4 28.7 227.4 804.9 284.3 405.6 862.1 408.0
III.Curren Savings (I-I1) (89.7) (149.1) (208.1) (266.5) (282.9) 9.8 278.7 (8.7) (44.4)IY.Capital Revenue 51.6 0.5 0.0 560.1 864.0 160.8 814.2 545.7 418.3
V.Capital Expeditures (A4.C) 516.5 724.9 449.9 077.3 474.0 641.6 801.9 708.4 659.6 oA. Fixed Capital Formtion 884.5 44S.7 854.4 894.0 846.8 809.5 484.0 628. 466.6B. Purchase of land 0.8 9.9 o.0 0.. 9.* 4., O.l a.8 1.SC. Trsnsfers 181.9 276.2 94.5 282.7 127.7 172.1 117.3 1n.9 92.7
VI.Nst Leding 82.5 77.9 111.6 (80.7) (21.6) 0.2 269.2 127.0 1B0.6
VIL.0VERALL S&MPUS8/DEFnCIT(-) (686.9) (51.4) (768.6) (841.0) (891.8) (887.2) (27.2) (294.e) (816.8)
VIII.Nst Total Financing (A-B) 086.9 951.4 708.0 841.9 801.8 887.2 270.2 294.0 316.8
A. InOornal (1*2) 669.4 097.6 521.8 47.1 89.9 110.4 (7.9) 14.5 09.01. Contral Sank 896.8 608.2 418.0 (147.2) 147.2 215.2 (891.5) 7.9 201.62. Other Souroes 118.1 107.4 108.2 194.8 (67.8) (90.6) 293.0 (51.4) (182.6)
S. External (1-2*8) 1265 258.6 241.8 208.9 211.4 260.6 266.1 279.6 247.31. Dlobur_mnts 185.0 268.8 200.2 287.8 261.7 821.2 467.0 410.4 86".82. Amortlartlon 9.8 15.9 20.0 28.5 29.0 27.4 121.5 186.9 122.08. Other o.9 6.9 02.2 82.1 (22.8) (26.9) (560.9) 9.0 .0
Source: Central Roserve Bank of El Salvador.
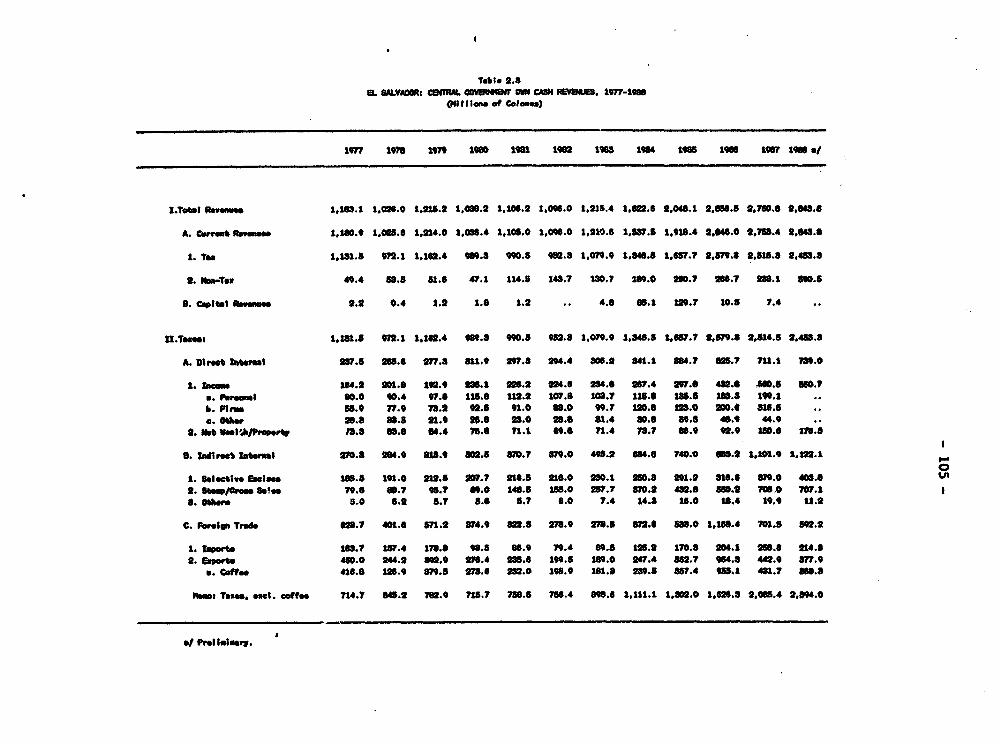
EL SAIX: 51RW. 00B1W6 OM CASH PEADAM. 197-1988(WI1 I Iwo. of C.oe.)
1977 1971h 1979 1160 1911 1961 1908 1964 1"6 1196" 16 I9S*t
2.7.4I Revw 1132.1 1,06.0 1.1152 t,M1.0 3 .21.1 1,0.0 1,215.4 1,40.6 2,046.1 2,0.5 2,76.6 2.6.6
A. Cw,rw as,... 1,J1.9 1,026.6 1,214.0 1,01.4 1,106.0 1,03.0 1,210.0 1,16. 1,O98.4 2,6.0 2,11.4 2,68.4
1. Tax 1,'1.5 972.1 1,1.4 6.3 990.5 15.3 1,079.9 1,386. 1,67.7 1,s9.3 1,15.8 2,41.8
2. "If-Tea 49.4 63.s 51.6 47.1 114.5 143.7 13.7 180 1.7 216.7 2m.1 3.0
U. bpi.l Pea1 2.2 0.4 1.2 1.6 1.2 .. 4.8 86.1 129.7 10.5 7.4
tt.Tloss 1.18.5 972.1 1,162.4 6.8 9w.s 959.8 1,079.9 1,84.5 1,67.7 1,679.3 2,514.5 2,41.8
A. Dils 1.4vaI 237.5 16.6 7.8 8.9 997.8 294.4 8.2 1 41.1 8.7 M.7 7.1 78.0
1. S'_ 164.1 201.6 1992.9 131 6.2 204.6 214.8 26.4 297.6 489.6 6.5 560.7P. nr_ms. 60.0 0.4 97. 1s.8 111.2 107.6 103.7 15.$ 18S.6 6. s1.1
b. itno 16.0 77.9 78.1 92.6 91.0 86.0 99.7 120.6 1.0 20.4 8.O. o 20.8 38.5 91.9 16.6 23.0 2a.6 81.4 30.6 69.8 46.9 44.9
2. Pe0b WaIs I A/Pr. 13.8 66.6 04.4 76.6 71.1 69.6 n.4 78.7 66.9 2 12. 0 M. 110.8
3. nor% Internal 270.5 294.9 818.9 302.5 870.7 379.0 496.2 64. 740.0 86.2 1 1o1.9 1.W1.1
1. selftbi ble. 18s.5 191.0 112.8 20.7 216.5 21.0 130.1 250.8 291. 316.6 6W.0 40.0 Vs1. stoplor. 3'.e 7.8 66.7 96.7 80.0 14.5 155.0 267.7 50.1 482.6 80.2 70S,0 707.1S. oth1r. 5.0 5.2 6.7 8.6 5.7 6.0 7.4 14.8 16.0 16.4 19.9 U.2
C. Porio Tr. 613.7 401.6 s71.2 674.0 8.6 6.0 9 73.5 672.6 513.0 1,16.4 701.5 592.2
1. sq.r4 163.7 17.4 176.8 96.6 66.9 79.4 69.5 126.1 170.3 21.1 156.6 n14.82. Eap.w4 480.0 244.2 812.9 270.4 215. 199.5 169.0 247.4 862.7 964. 442.0 s7.9
*. Coffe 416.6 1.9 579.5 1.2. 212.0 198.9 161.8 239.5 857.4 U.1 431.7 86$.8
P... Tne.., *"l. offe 7 n4.7 646.2 76.0 71.7 786.6 7.4 6.6 1,111.1 1.302.0 1,66.5 2,065.4 2*4.0
at Pr. t.Ieeu'.
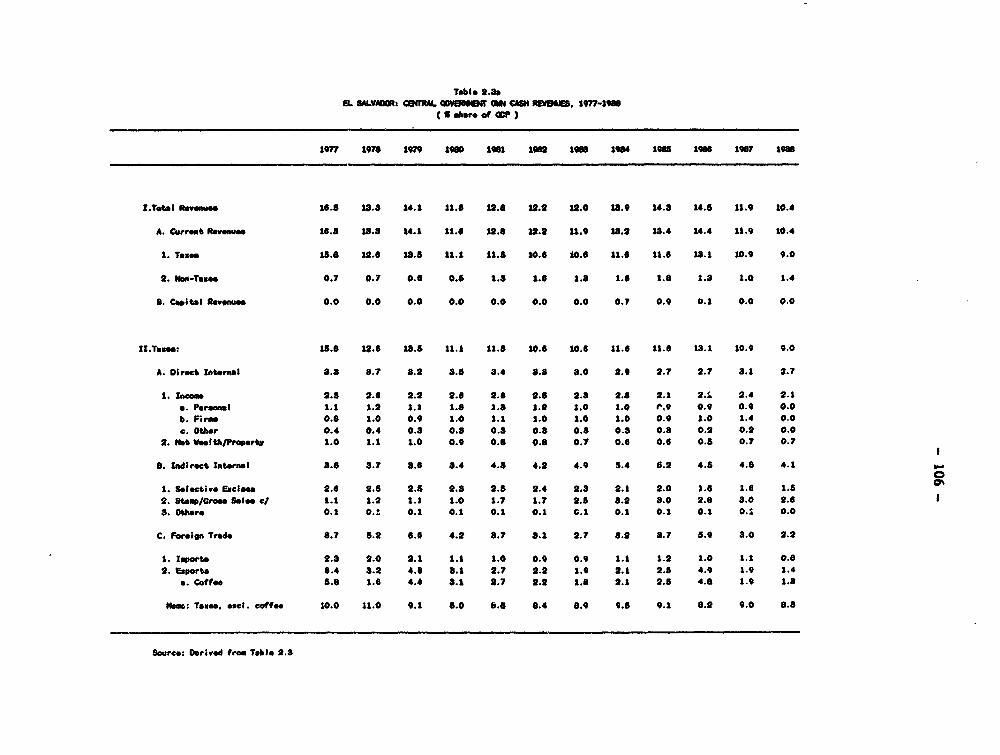
Tabl. 2.8aB. SALWVAR: WTrAL 18VBE UM CASH 11MM. 1977-108"
107 1978 179 1080 1*1 t0o 19 19#84 1988 1088 1987 10n
IT.t1.1 Revene 16.5 18.8 14.1 11.6 12.8 1.2 12.0 18.9 14.8 16.5 11.9 10.4
A. Curnt Revenue. 16.8 18.8 14.1 11.6 12.6 2.2 11.9 18.2 18.4 14.4 11.9 10.4
1. Texas 15.8 12.8 18.8 11.1 11.8 10.6 S .e 11.6 11.6 18.1 20.9 0.0
2. km-Taxes 0.7 0.7 0.6 0.8 1.8 1.8 1.8 1.6 1.8 1.8 1.0 1.4
S. C4*it*l Revenue 0.0 0.0 0.0 0.0 0.0 0.0 0.0 0.7 0.9 0.1 0.0 0.0
II.Taxos: 18.8 12.6 13.6 11.1 11.6 10.6 10.6 11.6 11.6 1..1 10q. 9.0
A. Direct lnteral 8.8 8.7 8.2 8.8 3.4 8.8 8.0 2.9 2.7 2.7 3.1 2.7
1. Inc.. 2.8 2.6 2.2 2.6 2.6 2.5 2.8 2.3 2.1 2.. 2.4 2.1a. Persal 1.1 1.2 1.1 1.8 1.8 1.2 1.0 1.0 P.9 0.9 0.9 0.0b. F;rm 0.8 1.0 0.9 1.0 1.1 1.0 1.0 1.0 0.9 1.0 1.4 0.0c. Other 0.4 0.4 0.8 0.8 0.8 0.8 0.8 0.8 0.8 0.2 0.2 0.0
2. "at V.alth/Proerty 1.0 1.1 1.0 0.9 0.6 0.8 0.7 0.6 0.6 0.8 0.7 0.7
S. Indirect Internal 8.8 3.7 8.6 8.4 4.8 4.2 4.9 5.4 6.2 4.8 4.8 4.1
1. Selective &clw 2.6 2.5 2.8 2.8 2.5 2.4 2.8 2.1 2.0 1.6 1.6 1.52. step/Cre Sole C/ 1.1 1.2 1.1 1.0 1.7 1.7 2.5 8.2 8.0 2.8 8.0 2.6$. Other. 0. O. 0 .1 0 .1 0 .1 0 .1 0 .1 0 .1 0 .1 0 .1 0 .1 0 0.0
C. For*ein Trae 8.7 5.2 6.6 4.2 8.7 8.1 2.7 8.2 8.7 5.9 8.0 2.2
1. IqVorta 2.8 2.0 2.1 1.1 1.0 0.0 0.9 1.1 1.2 1.0 1.1 0.82. Esports 8.4 8.2 4.8 8.1 2.7 2.2 1.4 2.1 2.5 4.9 1.9 1.4
*. Coffee 5.8 1.6 4.4 8.1 2.7 2.2 1.8 2.1 2.5 4. 1.9 1.8
Nom-, Ta.... eacl. coffe 10.0 11.0 9.1 8.0 b.8 0.4 8.9 9.8 9.1 8.2 9.0 8.8
Sourew: Derivod free Table 2.8

Table 2.4EL SALVAIOR: CURRENT AND CAPITAL EXPENDITURES OF THE NON-FINANCIAL PUBLIC SECTOR
1960-1966
EXPENDITURES PERCENTAGE TOTAL REAL EXPENDITURES REAL PER(MIlltons of Colones) COMPOSITION AS X (Mlillons of 1962 Colon.) CAPITAL TOTAL
Year _ OF GDP EXPENDITURESturrent Capital Total Current Capital Current(*) Capitalb Top l (1962 Colon..)
1996 ,776.1 701.8 2,539.4 70.0 80.0 28.6 602.1 279.0 881.1 194.71981 1,839.0 1,212.6 1,061.6 60.3 89.7 86.8 687.6 412.1 999.0 218.11962 1,918.8 781.1 2,077.4 71.6 28.4 29.9 590.0 244.0 884.6 1890.61908 2,817.1 1,827.9 8,645.0 88.0 80.4 81.9 684.8 387.7 1,022.0 219.21904 2,849.8 690.0 8,889.9 79.8 20.7 28.? 605.8 184.2 887.6 177.91986 2,785.2 788.8 8,408.5 79.9 21.1 24.2 606.6 178.8 7?9.8 163.61986 8,614.7 869.6 4,464.2 6.6 19.4 22.7 656.6 108.2 StI.7 109.01987 4,117.8 9.6 S,00.8 61.6 18.4 21.6 6094.6 140.2 640.0 170.41986 Est. 4,U42.6 77a.8 5,116.8 64.9 16.1 18.6 691.0 112.8 608.8 169.7
(a) Deflated by the National Account. Implicit Price Deflator for Public Sector Consumption(b) Doffated by the National Accounts Implicit Price DOeiltor for Public Sector Flxi Capital Investmat
Source: £l1borated on the basis of data provided by the Ministry of Financo and the Centrol Resrve Bankof El SAlvador.
0
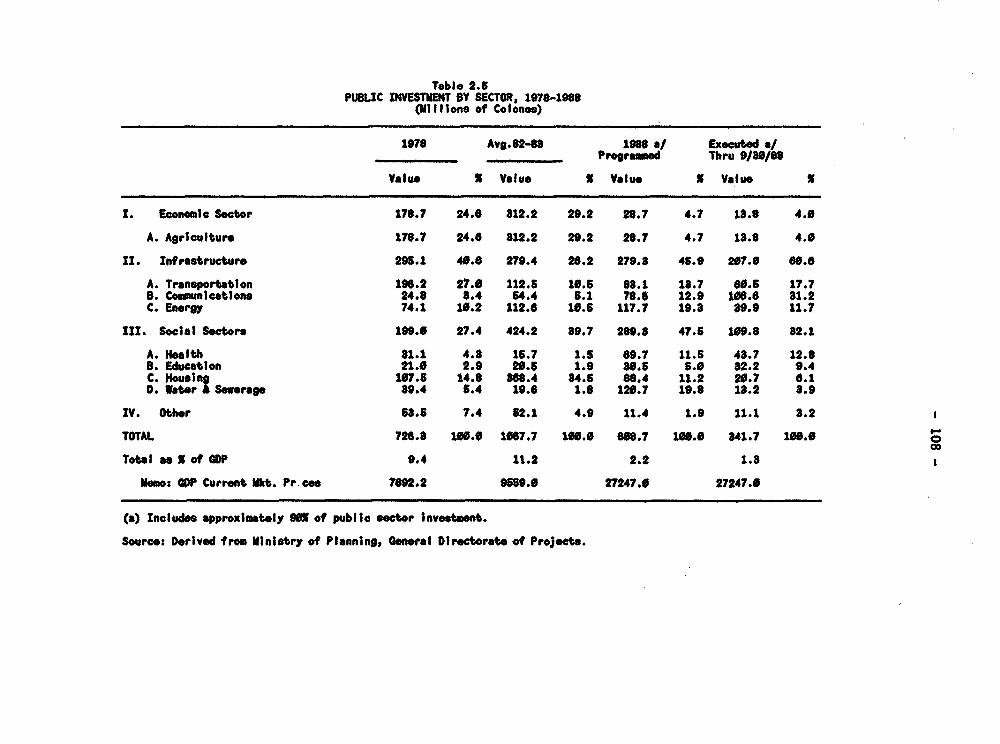
Table 2.5PU8LIC INVESTMENT BY SECTOR, 1978-1988
(Millions of Colones)
1978 Avg.82-83 1988 */ Executed a/Prormed Thrt 9a.0/ss
Value x Value x Value x Vlueo x
I. Economie Sector 178.7 24.6 812.2 29.2 28.7 4.7 18.8 4.0
A. Agriculturo 178.7 24.6 812.2 29.2 28.7 4.7 18.8 4.0
II. Infrastructure 295.1 40.6 279.4 28.2 279.8 45.9 207.0 68.6
A. Transportatlon 196.2 27.0 112.5 10.6 88.1 18.7 80.6 17.7B. Conunlcatlons 24.8 8.4 54.4 6.1 78.5 12.9 106.8 81.2C. Energy 74.1 10.2 112.6 10.6 117.7 19.3 89.9 11.7
III. Social Sectors 199.0 27.4 424.2 89.7 289.5 47.6 109.8 82.1
A. Health 81.1 4.8 15.7 1.5 89.7 11.6 48.7 12.8B. Education 21.0 2.9 20.5 1.9 80.5 5.0 82.2 9.4C. Housing 107.5 14.8 588.4 84.6 88.4 11.2 20.7 8.10. Water A Sewerage 89.4 6.4 19.6 1.8 120.7 19.8 18.2 8.9
IV. Other 58.5 7.4 52.1 4.9 11.4 1.9 11.1 8.2
TOTAL 728.8 100.0 lIi7.7 10.0 808.7 100.0 841.7 100.0
otol as X of GOP 9.4 11.2 2.2 1.8
Memo: GOP Current Mkt. Pr cos 7692.2 9559.8 27247.0 27247.0
(a) Includes approximately 9WX of public sector lnvestment.
Source: Derived from Ministry of Planning, Genoral Directorato of Projects.
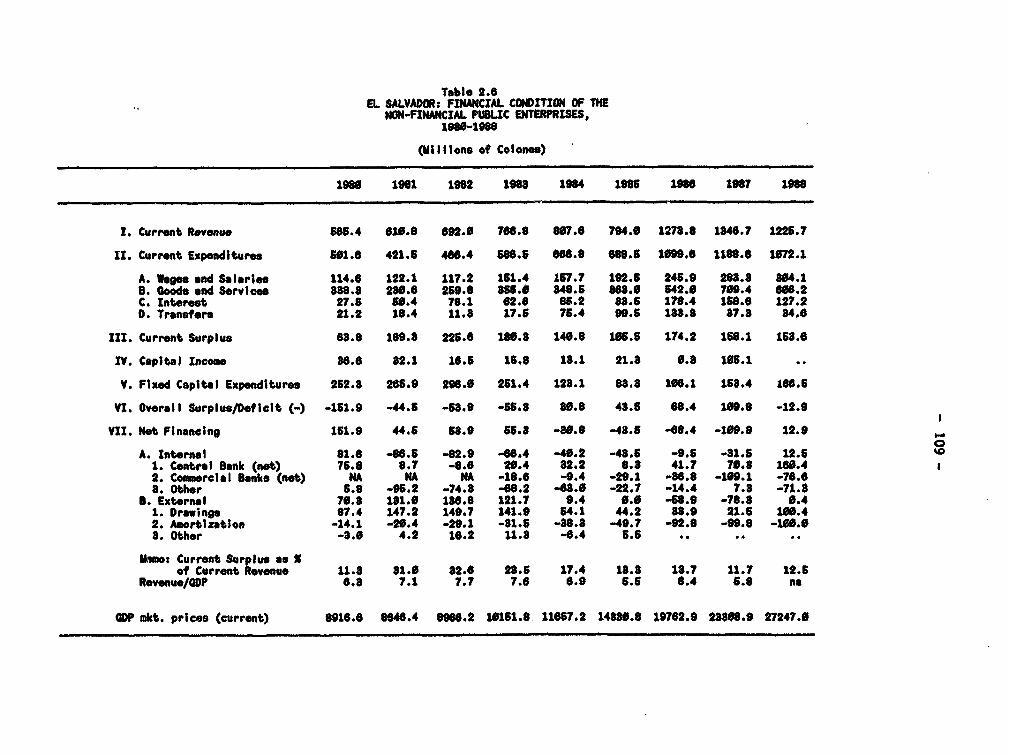
Table 2.0EL SALVADOR: FINANCIAL CONDITION OF THE
NON-FINANCIAL PUBLIC ENTERPRISES,1980-1688
(Millions of Colonos)
1980 1961 1982 1988 1964 1986 1966 1967 198
I. Current Revenue 565.4 010.6 092.0 7B6.8 807.0 794.0 1278.8 1840.7 1226.7
I1. Current Expenditures 501.8 421.6 400.4 560.5 660.8 688.6 1999.0 1188.6 1072.1
A. Wages and Salaries 114.6 122.1 117.2 161.4 167.7 192.5 245.9 268.8 804.1B. Goods end Services 886.8 2BO.8 269.6 866.0 84s.6 883.0 542.0 708.4 606.2C. Interest 27.6 50.4 76.1 62.6 86.2 88.5 178.4 159.0 127.20. Transfers 21.2 16.4 11.3 17.5 76.4 99.6 188.8 87.8 84.6
II. Current Surplus 68.6 189.8 225.6 180.8 140.8 106.6 174.2 168.1 165.6
IV. Capital Income 3.8 0 2.1 18.6 16.8 13.1 21.8 0.8 106.1
V. Fixed Capital Expenditures 252.8 266.9 296.0 251.4 128.1 68.8 106.1 158.4 160.6
VI. Overall Surplus/Deficit (-) -151.9 -44.6 -58.9 -66.8 80.8 43.5 66.4 199.6 -12.9
VII. Net Financing 161.9 44.6 58.9 56.8 -80.8 -48.6 -09.4 -109.8 12.9
A. Internal 61.8 -96.6 -62.9 -6.4 -40.2 -48.5 -9.6 -31.5 12.51. Central Bank (not) 76.8 8.7 -8.8 20.4 82.2 6.8 41.7 79.8 18.42. CommercIal Banks (net) NA NA NA -18.6 -9.4 -29.1 -80.8 -149.1 -70.B8. Other 6.8 -96.2 -74.8 -09.2 -08.0 -22.7 -14.4 7.8 -71.8
B. Externsl 70.8 181.0 130.6 121.7 9.4 0.0 -68.9 -78.8 0.41. Drawings 87.4 147.2 149.7 141.9 64.1 44.2 88.9 21.5 109.42. Amortization -14.1 -20.4 -26.1 -81.6 -88.8 -49.7 -92.8 -99.6 -100.08. Other -380 4.2 16.2 11.8 -8.4 5.6
Mno: Current Surplus as Xof Current Revenue 11.8 81.0 82.0 28.6 17.4 18.8 18.7 11.7 12.6
Revenue/GDP 6.8 7.1 7.7 7.B 6.9 6.6 6.4 6.8 na
GOP mkt. prices (current) 8916.6 6648.4 89.2 10151.8 11667.2 14880.8 19762.9 28808.9 27247.0
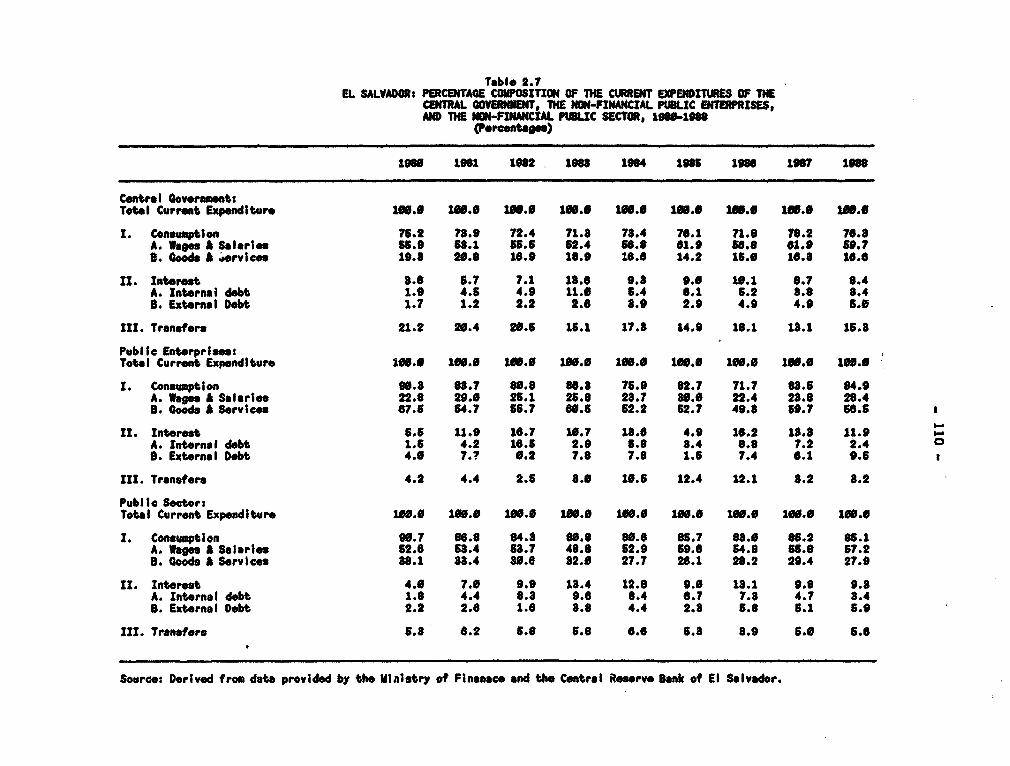
Table 2.7EL SALVADOR: PEItCENTAGE COMSITION OF THE CURN EXPENDIUES Of THECNRAL GOVERNIi, THE NON-FIANCIAL PUUC ENTRSES,
AND TE NON-FNWCIAL PMUC SECTOlt, 180-19S8(Percentage)
1960 1981 1982 1988 1984 1986 1988 1987 1998
Centra I Government:Total Crrent Epnitur. 10.9 10.0 100.0 196.0 11..O 196.0 196.0 196.0I. Cons tion 76.2 78.9 72.4 71.8 78.4 76.1 71.0 78.2 70.8A. Wa. A a Salaries 65.9 88.1 55.6 52.4 56.1 61.9 56.8 61.9 59.7B. 40ods A ervices 19.8 20.8 16.9 18.9 16.6 14.2 16.0 16.8 10..I. Interest 8.6 6.7 7.1 18.6 9.8 9.0 19.1 8.7 8.4A. Internai debt 1.9 4.6 4.9 11.0 5.4 6.1 6.2 8.8 8.4B. External Debt 1.7 1.2 2.2 2.0 3.9 2.9 4.9 4.9 6.0III. Transfers 21.2 20.4 20.5 15.1 17.8 14.9 18.1 18.1 16.8Publile EnterpriosesTotal Current Expenditure 180.0 100.0 188.0 180.0 108.0 100.0 1W6.0 100.0 100.0I. Consumption 90.8 88.7 80.8 86.8 75.9 82.7 71.7 88.6 84.9A. Wages A Salaries 22.8 29.0 26.1 26.8 28.7 80.0 22.4 23.8 28.4B. Goodb A Services 67.6 64.7 56.7 80.5 52.2 62.7 49.8 69.7 66.5rr. Interest 5.6 11.9 16.7 10.7 18.0 4.9 16.2 18.8 11.9A. Internal debt 1.6 4.2 16.6 2.9 5.8 8.4 8.8 7.2 2.4 4B. External Debt 4.0 7.? 0.2 7.8 7.8 1.5 7.4 6.1 9.6rrr. Transfers 4.2 4.4 2.6 8.0 10.6 12.4 12.1 8.2 8.2Pubilc Sector:Total Current Expenditure 100.0 100.0 190.0 196.0 1N0.0 100.0 106.0 1S8.0 100.0I. Consumption 90.7 86.8 84.8 80.8 80.6 85.7 83.0 85.2 85.1A. Wages A Salaries 62.6 65.4 58.7 48.6 62.9 69.8 54.6 65.8 57.2a. Goods A Services 88.1 8B.4 80.8 82.0 27.7 26.1 28.2 29.4 27.9ll. Interest 4.0 7.0 9.9 18.4 12.8 9.0 18.1 9.8 9.3A. Internal debt 1.6 4.4 8.3 9.8 8.4 6.7 7.3 4.7 8.4S. External Debt 2.2 2.6 1.8 8.8 4.4 2.8 6.8 t.1 6.9III. Transfero 6.8 0.2 6.8 5.6 6.6 5.8 8.9 6.0 5.8
Source: Derived from data provided by the Mianstry of Finanace and the Central Reosrve Sank of El Salvador.
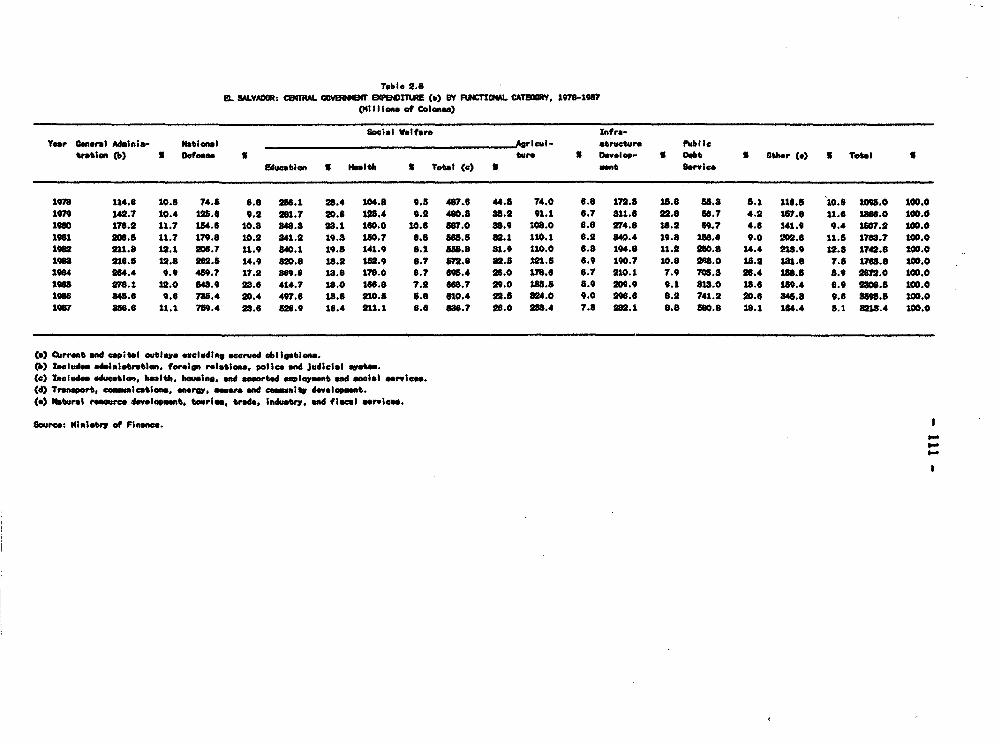
Table 2.8EL SALVAR: CcetRAL COVERNf O(PD(OIT8UE (a) BY FRIONCJ CATOA*, 1978-1987
(iII 1Ion. of Colnes)
Socistal Welfare Infra-
Year Oeral Adminis- Natat ion_lrIcuIl- otructure Public
tation (b) S Dcf.. S I te I Develop- S Debt S Otbr) S Total 8
Edwction S HIsitS # TytaI (c) S sent Servce
1978 114.6 10.0 74.8 6.8 206.1 28.4 104.8 9.5 487.9 44.5 74.0 6.8 172.5 18.8 8.8 8.1 116.8 1o.0 2095.0 0.0
1979 142.7 10.4 122.6 9.2 281.7 20.6 125.4 9.2 480.8 88.2 91.1 6.7 811.6 22.8 86.7 4.2 187.8 11.6 1*66.0 10.0
l190 176.2 11.7 1"4.6 10.3 48.8 28.1 160.0 10.6 887.0 88.9 108.0 6.8 274.6 18.2 69.7 4.6 141.9 9.4 I107.2 100.0
1981 206.8 11.7 179.8 10.2 841.2 19.3 1S0.7 8.8 8s.8 82.1 110.1 6.2 840.4 19.8 186.6 9.0 202.6 11.5 1768.7 00.0
1lt2 211.8 12.1 206.7 11.9 840.1 19.8 141.9 8.1 85.8 31.9 110.0 6.8 194.8 11.2 260.8 14.4 218.9 12.8 1742.8 1O.0
1968 216.5 12.8 262.5 14.9 820.8 18.2 182.9 8.7 872.8 82.8 M.8 6.9 190.7 10.8 28.0 18.2 181.8 7.8 16.8 100.0
1984 264.4 9.9 489.7 17.2 86s.8 18.8 178.0 6.7 696.4 26.0 178.6 6.7 210.1 7.9 708.8 26.4 156.5 8.9 262.0 100.0
186 278.1 22.0 848.9 28.0 414.7 18.0 108.8 7.2 668.7 29.0 185.8 8.9 209.9 9.1 818.0 18.6 189.4 6.9 2#0.S 100.0
1986 548.6 9.6 738.4 20.4 497.6 18.8 210.8 5.8 810.4 22.8 824.0 9.0 290.6 8.2 741.2 20.6 a48.8 9.6 89m8.5 100.0
1987 8M6.6 11.1 759.4 28.6 826.9 10.4 211.1 6.6 686.7 20.0 288.4 7.8 262.1 8.8 880.8 18.1 184.4 5.1 821.4 100.0
(a) Current ad capital utlay. excluding accrued dbligation.(b) Lncludnc aintieration, foweipn relation, police wnd judicial evetem.
cc) bsclude. educatio, helti. housing. end aeort.d plosmnt Nd sccial service.
(d) TraportS. canication., enrw. _easr nd coemmnity development.(e) Natural Mrer JeWvl0et. tourIe., tfade. Indust, and fisca sermicee.
Sourc: Hinets of Finane.
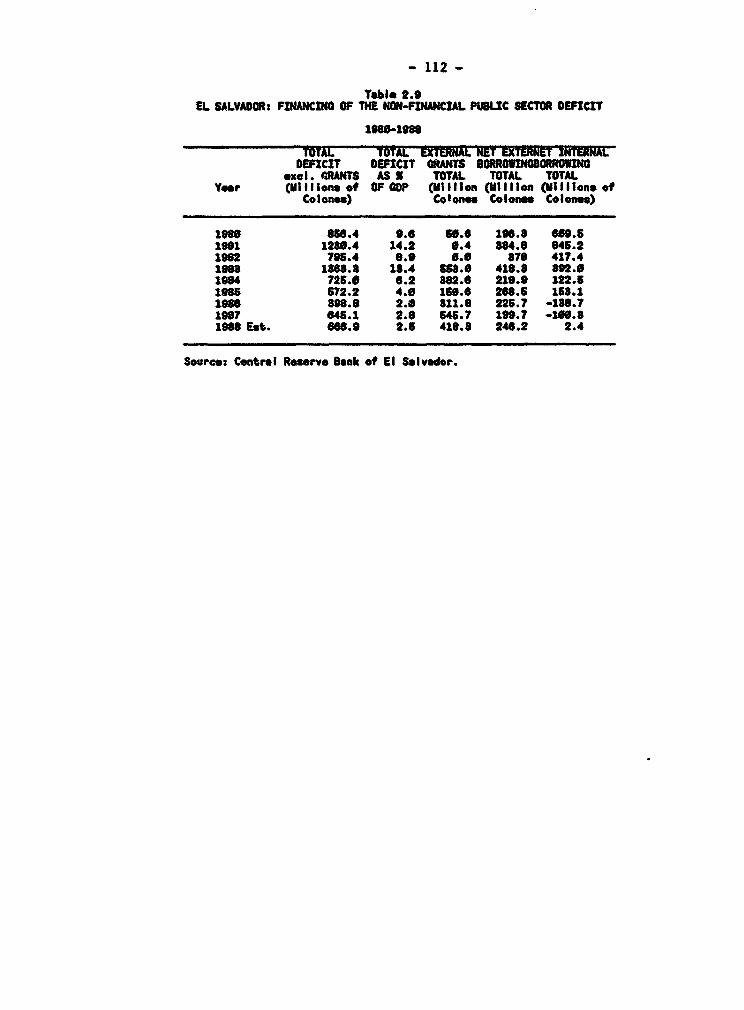
- 112 -
Table 2.0EL SALVADOR: FINANCING OF THE NON-FINANCIAL PFtISC SECTOR DEFICIT
TOTAL TOTAL EXTERNAL NEY EXTERNET INTERNALDEFICIT DEFICIT GRANTS SORR NOFfNO
*xel GRANTS AS S TOTAL TOTAL TOTALYear (Illitons of OF GDP (Millton (MlIIIon (MlIIIon* of
Colon.s) Colo3ne Colones Colones)
1088 856.4 9.8 56.6 16#.8 "09.61961 1280.4 14.2 0.4 884.8 045.21982 795.4 8.9 0.6 870 417.41088 1868.3 18.4 658.0 418.8 802.01984 726.0 6.2 882.6 219.9 122.51985 672.2 4.0 166.6 266.5 168.11986 898.8 2.0 811.9 225.7 -188.71987 645.1 2.6 545.7 190.7 -109.81986 Est. 686.0 2.5 416.8 246.2 2.4
Source: Central Reserve Bank of El Salvador.

- 113 -Table 8.1. EL SALVADOR: Deti led Balance of Payaenta, 190-88
(in. iAllions of U.S. dollars)
19-80 191 1982 1983 1984 1945 1986 1987 Prel.198B
Current Accont S0.8 (217.8) (68.2) (82.3) (S3.2) (56.9) 116.6 139.7 S8.7
Goods Mad Sae,-Vc" (18.3) (298.4) (295.6) (80.8) (387.9) (S37.2) (267.4) (483.S) (451.1)
lhrchendiae Trade I/ 113.8 (186.6) (157.2) (134.9) (251.6) (266.2) (180.0) (408.2) (405.8)
Trmnportation 6.6 (6.2) 8.3 9.8 21.0 35.0 22.9 23.6 2J.0Travel (92.7) (55.1) (40.0) (66.2) (81.5) (66.2) (89.4) (30.0) (5.8)
FPetor Income (83.8) (87.7) (119.2) (130.7) (124.8) (116.7) (116.7) (122.7) (109,S)
Direct Investmnt (19.3) (28.0) (83-4) (38.0) (81.4) (31.6) (88.3) (41.0) (42.1)
Interest (64.5) (89.7) (8.-8) (94.7) (93.4) (85.1) (33.4) (81.7) t67.2)Covernmmt Trantction (4.1) 8.6 (1.0) 2.5 2.4 11.8 87.0 50.8 57.1
Other Services 42.4 81.6 18.5 16.2 86.6 26.6 8.8 48.5 (10.6)
Tranaer Pe~nt 48.9 80.9 207.4 271.5 314.7 319.3 884.0 873.2 609.8
Private 17.4 65.7 94.2 107.4 141.? 125.5 166.9 201.6 227.0
Pubblia 81. 135.2 118.2 164.1 173.0 199.8 218.1 871.6 282.8
Capital Account (386.7) SS.8 85.2 122.6 (0.2) a8.8 (48.9) (29.9) (168.6)
Private Capital (478.4) (133.6) (100.9) (53.1) (42.9) 66.8 (80.9) (19.8) (105.1)
Direct Inest_ent 4.9 (5.7) (2.0) (0.4) (1.0) 12.4"LT LOa'S (11.2) (18.8) (14.7) (12.2) 4.8 (8.4)Short-Term (Iel. neterror, A mlwesions) (467.1) (114.6) (84.2) (40.5) (46.2) 49.5 (80.9) (19-8) (105.1)
Official Capital 78.9 174.1 119.7 148.6 88.9 91.6 51.3 89.8 81.9
Central Overnment 2/ 69.7 168.0 71.7 104.8 82.9 10.5 e8.2 87.1 49.3Rest of eneral governomt (0.9) (0.2) (0.4) (0.4) (0.4) (0.2) (0.8) (0.4)
Publlc Enterprlee 10.1 10.2 46.2 44.1 6.4 (11.5) (16.7) (16.8) 8.0
Financial Publc IntermdIaries 1.8 11.8 91.6 25.2 (47.8) (55.7) (50.8) (50.4) (112.4)
Contrsl eeerv. SBank 8/ 80.0 86.8 45.6 40.0 (47.4) (20.6) (64.8) (68.2) (114.4)
Depseit & Mortgage Banks (48.8) (28.6) 27.6 (32.5) (1.3) (48.6) 0.7 (0.1) (O.?
Lbon-Ten. (pot) 8.0 (0.2) (0.8) (0.4) (0.4) I.l (0.1) (0.7)
Short-Tere (hnt) (48.8) (81.6) 27.8 (81.7) (0- s) (48.2) (0.4)
Other public financialintermdiaries C2.4) 8.6 18.4 17.T 0.9 13.5 12.8 17.9 2.7
Tranacti one with nrnaonetary
international agencies 0.9 0.0 (25.7) 8.8 3.1 (6.3) (1,7)
SDR Allocation. 4/ 5.1 2.7 (1.5) (1.4) (1.5) 2.7 8.2
Ovorall alance (Dcficit -) (386.1) (162.2) (8.0) 90.2 (53.4) 31.9 67.7 109.8 (106.9)
Change in Arrere (decrear -) S/ 86.7 88.8 (5.2) (32.9) 42.3 (3.6) (71.4) (16.1) 11.8
Refinancing of Arreare throughgovernment dollIe bonds 6/ 24.9 12.8 1.1 0.6
Refinancing of Arrears throughcentral government dollarbonds 7/ 3.3 42.4 0.2
Short-Torm liabilities convertedinto mdium term 15.0 3.2 16.7 94.0 38.8 9.5 2.6 .. 60.0
Net official reerve (Cinee -) 284.4 182.7 (83.4) (164.1) (28.8) (41.7) (41.3) (93.9) 35.1
Nat use of I1 roeoureea 5.4 38.S 5.0 9.3 (18.8) (16.9) (45.8) (87.8) (5.5)
Other net official reasrve,(groes of reecheduling) 294.0 87.6 (82.5) (79.4) 23.3 (15.8) 7.1 (56.6) 40.6
Reschedul ins (15.0) (3.2) (16.7) (94.0) (38-3) (9-6) (2.6)
Soure: Central Reaerv Bank of El Salvador and RW Staff fatimates

- 114 -
1/Import. *.e b. *nd tmos c.l,f.2/ Exclude government dollar lOda issued to refinance arrears but includes
Pasy_nt of goverrnmet dol lur bond.8/ Exelud medium-ters Iiabilities converted from short-term.4/ lnclude veluation adjuet mt.S/ Iclud"e crer . with the* ret of Central Amrice6/ ExalWdee repayments which are included in the central aovernment debite7/ Latuda repayments, hich *r* Included in mdiu_- and lorg-term debits of the Central Reerve Sank8/ Thi; Is cectully readheduling of medium-term liabilities.which Is defired as a one-year roll-ov*r of a medium-term liabilitp.
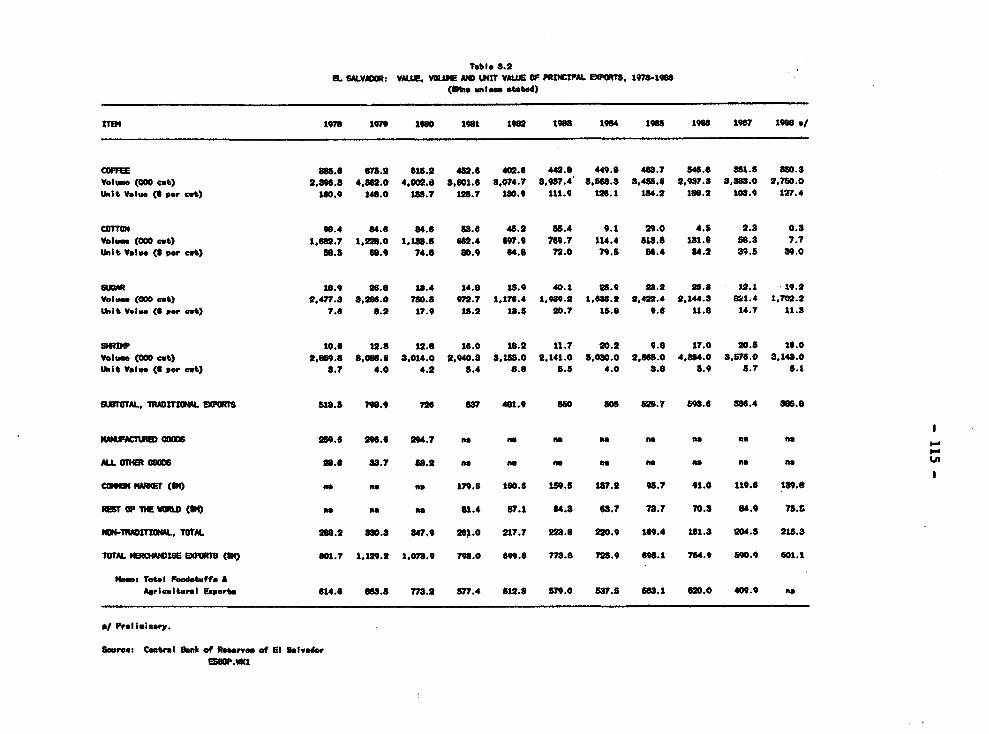
Table 8.2EL SALV/CRt VMIAE, VAE M AD MT VA1UE OF PRINCIPAL MMPOR?8, 1978-1918
(394. unmle *t.trd)
ITEM 1978 1979 1960 1961 162 1908 1984 1966 1906 1987 198 */
COFFM 1888.6 678.2 615.2 482.6 408.6 442.8 449.8 488.7 646.8 851.5 850.3Volume (000 cat) 2,89.8 4,862.0 4,080.0 8,601.6 8,074.7 8,987.4 8,666.8 8,486.6 2,97.8 38,.0 2,750.0Urit Volue (e par cat) 180.9 148.0 18.7 126.7 180 111.9 12. 1 134.2 188.2 103.9 127.4
COTTO 96.4 84.6 84.6 s8.6 4S.2 88.4 9.1 29.0 4.8 2.3 0.3Volme (000 cati) 1,66.7 i,.o 2 1,mU.5 662.4 69t.9 769.7 114.4 81.8 181.6 56.3 ?.7Unit Valvo (S per cot) s6.8 6e.9 74.6 00.9 64.6 72.0 79.5 56.4 84.2 8".8 S9.0
Gum 18.9 26.8 18.4 14.0 18.9 40.1 25.9 28.2 28.8 A2.1 19.2Volum (am cml) 2,477.S 8,268.0 760.8 972.7 1,178.4 1,969.2 1,86.2 2,422.4 2,144.3 8I1.4 1,72.2ULimt Value (S per cat) 7.6 8.2 17.9 18.2 18.5 20.7 1s.8 9.s 11.8 14.7 11.3
SRIP o10.6 12.8 12.8 16.0 18.2 11.7 20.2 9.6 17.0 20.5 16.0Volume (000 cat) 2,691.6 8,066.6 8,014.0 2,940.8 8,188.0 2,141.0 8,000.0 2,668.0 4,864.0 3,576.0 u.14o.0UWit V*lue (6 per cmt) 8.7 4.0 4.2 8.4 5.8 8.8 4.0 0.8 8.9 8.7 8.1
SlrOAL, lST104AL EXP8RI 813.5 796.9 72 6r 481.9 560 SOS s28.7 890.6 886.4 a86.0
11ANkMFACPCf 00 259.6 2".6 s94.7 as no am no nma
ALLOITHOODS 28.6 88.7 8.2 as a he as as n on a n u
CUl NAD (n) am nam a 179.6 160.6 159.6 187.2 98.7 91.0 119.6 18.8
RETU OTlS D (SeL as am 61.4 87.1 64.8 68.7 78.7 70.8 64.9 78.S
NO-TRADITIMAL., T0TAL 286.2 80.8 847.9 2s.0 217.7 228.8 220.9 169.4 M.8 204.6 218.8
TOTAL FECSiISE EXPORI (SO 001.7 1,129.2 1,078.9 78.0 69.6 778.6 7.9 698.1 764.9 890.9 601.1
Nam: Troel Fodatuffs AAerlcultural Exports 614.6 686.8 M.2 677.4 812.8 879.o 67.6 683.1 620.0 409.9 "a
/ Prelilmnary.
Sau*: Contral IOmak of Reerves of El Salvadore;#.Wc
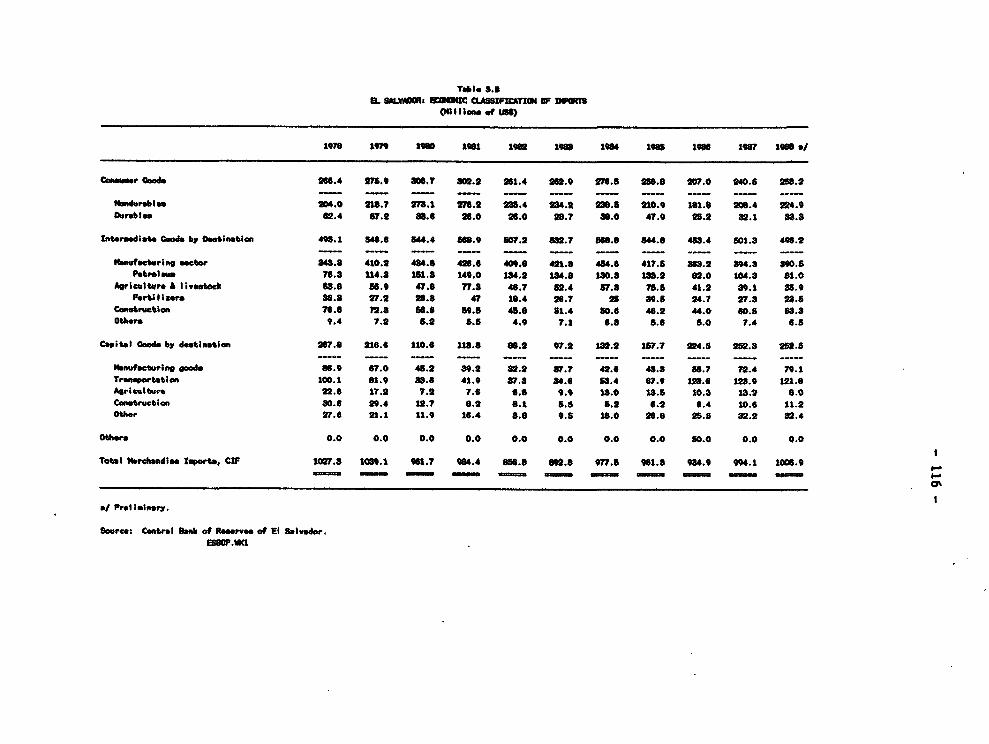
Table 8.8E SALVADOWt iOUC LASNIPASS TIOCT OF DW 3Rl
("iti ins of US$)
ion to" a9B aw8t 1962 u aos. 198S 19a 118? 1968 *r
Ccaauur Coed 266.4 275.9 806.7 802.2 281.4 262.9 276.5 2S8.8 207.0 240.5 2a8.2
lbndsrtbl. 204.0 2n8.7 278.1 278.2 235.4 234.2 M.5 210.9 181.8 26S.4 224.9Durablen 62.4 57.2 88.6 28.0 26.0 28.7 83.0 47.9 25.2 82.1 83.3
Intermediate Coo" by D_tinuticn 49S.1 548.6 544.4 58.9 807.2 882.7 568.8 J44.8 453.4 501.3 496.2
lbufaetur;ng _cter 84.8 410.2 4S4.8 428.6 409.6 421.8 454.8 417.5 8f3.2 894.3 300.5PetrolNo 78.3 114.8 151.3 140.0 134.2 1S4.8 I80.$ 10S.2 82.0 to4.8 81.0
Agriculture & I ivetm* 6S.8 86.9 47.8 77.8 46.7 52.4 57.8 78.5 41.2 89.1 as.9FertI itore 31.3 27.2 28.8 47 18.4 2B.7 25 39.5 24.7 27.8 23.8
Catr.ctlon 76.6 72.8 s6.6 S9.5 45.8 81.4 S0.6 46.2 44.0 60.5 683.3Other. 9.4 7.2 5.2 5.5 4.9 7.I 6.8 5.6 S.0 7.4 6.5
Capital lC, by dtbin et.n 267.8 216.6 110.6 118.8 88.2 97.2 182.2 157.7 224.5 252.8 2S2.5
lhouftctsuwi goo"e 86.9 57.0 48.2 89.2 82.2 87.7 42.6 4S.3 S8.7 72.4 79.1TrwpoUettion 100.1 81.9 88.8 41.9 87.8 84.6 53.4 87.9 128.6 123.9 121.8Aricalttu 22.6 17.2 7.2 7.6 6.6 9.9 15.0 18.5 10.3 13.2 6.0Construction 80.6 29.4 12.7 0.2 8.1 5.6 5.2 6.2 6.4 10.6 11.2Other 27.6 21.1 11.9 16.4 8.8 9.5 18.0 26.8 25.8 32.2 82.4
Others 0.0 0.0 0.0 0.0 0.0 0.0 0.0 0.0 68.0 0.0 0.0
Total urcedeie lteorta CIF 1027.3 108.1 961.7 984.4 886.8 89.8 97.5 961.8 984.9 994.1 1006.9
*/ Prelfl-nury.
S4urce: Centrol BanI of Reerve. of El Salvor.ESmOOP.M
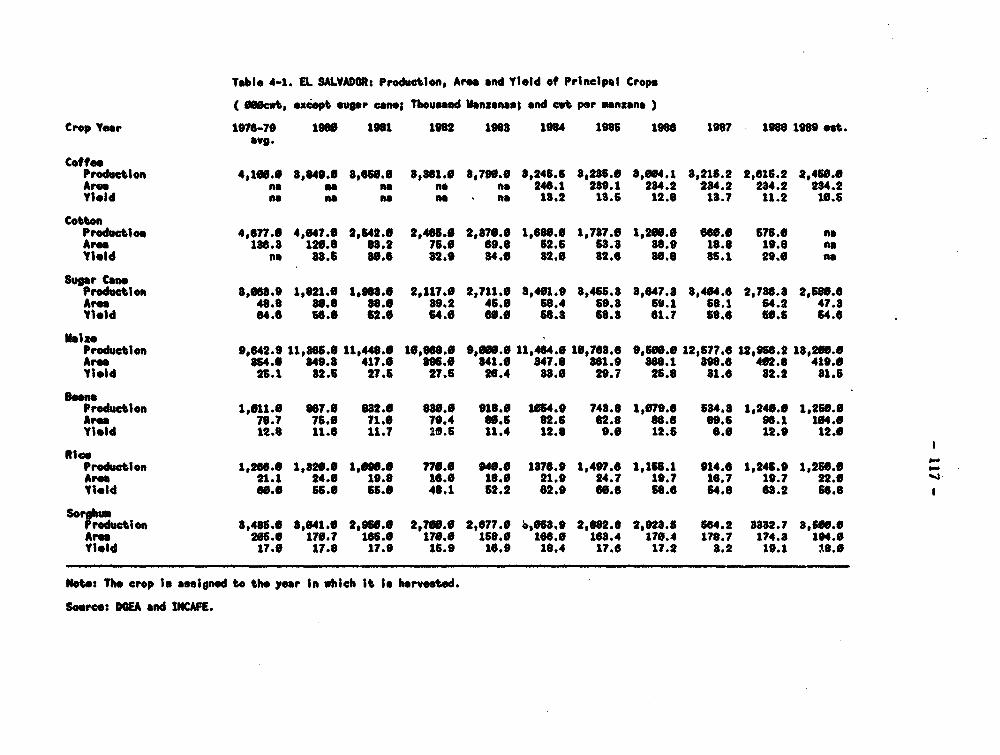
Table 4-1. EL SALVADOR: Production, Area and Yield of Principal Crop*
( 000cwt, xcept supa cane; Thousnd Uanxanase and cot per eanzsna )
Crop Year 1970-79 190 1981 1982 1988 1984 1985 1980 1987 1988 1989 out.
avg.
coftfeProduction 4,160.0 8,849.0 8,660.0 8,861.0 8,790.0 8,246.5 8,286.0 8,064.1 8,215.2 2,616.2 2,460.6
Area no n a no h 246.1 289.1 284.2 284.2 284.2 284.2
Ytild na na na ma a 18.2 18.6 12.8 13.7 11.2 16.5
CottonProduction 4,677.6 4,047.6 2,542.0 2,406.0 2,870.0 1,686.6 1,787.6 1,200.0 6S6.0 676.6 na
Area 186.8 120.8 88.2 75.0 69.8 62.6 68.8 38.9 18.8 19.8 as
Yield Qa 83.8 80.6 82.9 84.6 82.0 82.6 86.8 36.1 29.0 a
Sugar CaneProduction 8,68.9 1,821.6 1,988.0 2,117.0 2,711.0 8,401.9 8,465.8 8,647.8 8,464.6 2,786.8 2,560.6
Area 48.8 80.6 38.6 9.2 46.0 68.4 9.8 569 1 68.1 64.2 47.8
Yield 64.6 5. 62.6 64.0 60.0 6.8 658.8 61.7 65.6 60.6 64.6
MaixeProduction 9,642.9 11,865.6 11,44S.0 14,6668.6 9,00.0 11,464.0 10,768.6 9,600.0 12,577.6 12,956.2 18,2006.
Area 854.0 849.8 417.0 86.6 841.6 847.8 881.9 868.1 898.6 402.6 419.6
Yiold 26.1 82.t 27.5 27.6 26.4 83.6 29.7 26.0 81.6 82.2 81.5
Production 1,611.6 B67.0 832.6 6S0.0 918.0 1064.9 748.8 1,079.6 654.8 1,246.0 1,25.0
Area 78.7 76.6 71.0 79.4 80.5 62.6 82.8 86.0 98.6 90.1 104.6
Yield 12.8 11.1 11.7 10.6 11.4 12.8 9.6 12.6 6.O 12.9 12.0
RicOProduction 1,266.0 1,82060 1,696.6 770.0 940.0 1876.9 1,497.6 1,165.1 914.6 1,245.9 1,256.0
Area 21.1 24.0 19.8 16.6 18.0 21.9 24.7 19.7 16.7 19.7 22.0
Yt-ld W0. 66.0 65.0 46.1 62.2 82.9 60.6 68.6 64.8 68.2 68.8
SorghumProdution 8,485.6 8,041.0 2,950.0 20700.0 2,1677.0 4,65.9 2,892.6 2,923.6 664.2 8882.7 8,600.0
Are 205.6 170.7 116.0 170.0 168.10 166. 168.4 170.4 178.7 174.8 194.6
Yield 17.0 17.8 17.9 16.9 16.9 18.4 17.6 17.2 3.2 19.1 18.0
Noe.: The crop Is assigne to the year in which it Is harvestet.
Source: OOEA and ICAFE.
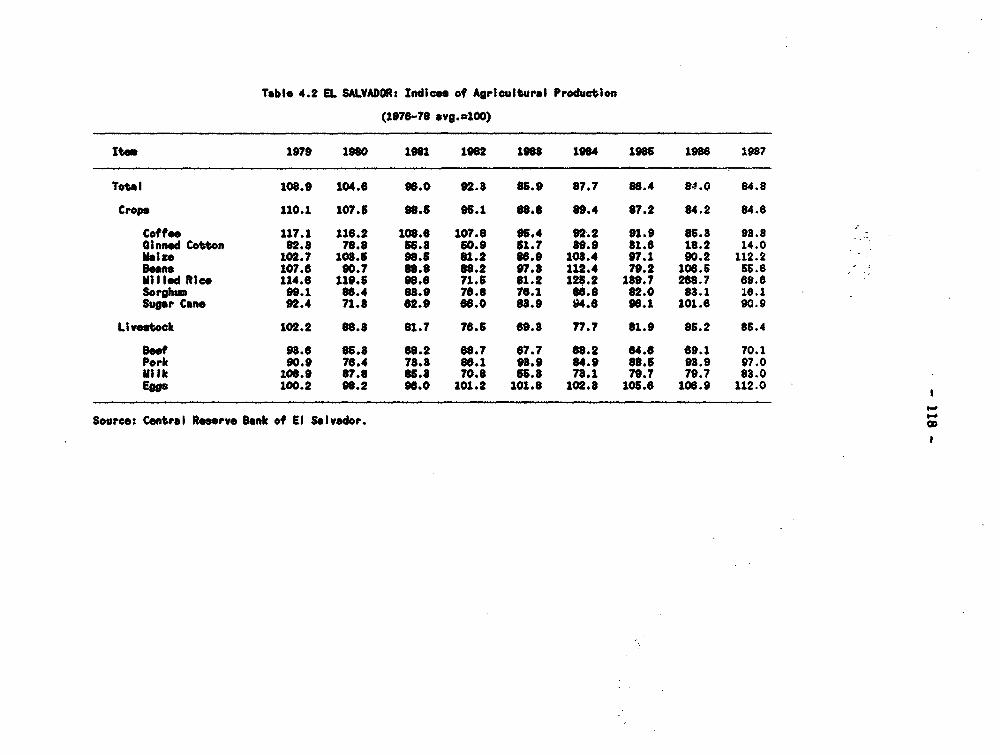
Table 4.2 EL SALVADOR: Indies of Agricultural Production
(1978-78 svg.=O00)
Ite 1979 1960 1981 1982 1988 1984 1986 1986 1987
Total 108.9 104.6 96.0 92.8 85.9 87.7 86.4 e4 .0 84.8Crops 110.1 107.6 96.5 95.1 86.8 89.4 87.2 84.2 84.8
Coffee 117.1 116.2 108.8 107.6 96.4 92.2 91.9 85.8 98.8Qinnod Cotton 82.8 76.8 56.8 50.9 61.7 89.9 81.6 18.2 14.0Maize 102.7 108.6 9,6. 61.2 86.9 108.4 97.1 90.2 112.2Boons 107.6 90.7 88.6 68.2 97.8 112.4 79.2 106,5 55.8Milled Rice 114.6 119.5 98.6 71.5 81.2 125.2 189.7 268.7 69.8Sorghum 99.1 86.4 68.9 76.8 76.1 86.6 82.0 83.1 16.1Supg Cane 92.4 71.8 82.9 86.0 68.9 94.8 96.1 101.6 90.9Livestock 102.2 88.8 81.7 78.6 69.8 77.7 81.9 86.2 85.4
SeeW 98.6 85.8 66.2 68.7 67.7 88.2 84.8 89.1 70.1Pork 90.9 76.4 78.8 86.1 98.9 84.9 8.6 983.9 97.0Milk 108.9 67.8 85.8 70.8 56.8 78.1 79.7 79.7 83.0Eggs 100.2 98.2 96.0 101.2 101.8 102.3 105.6 106.9 112.0
Source: Central Reserve Bank of El S lvodor.
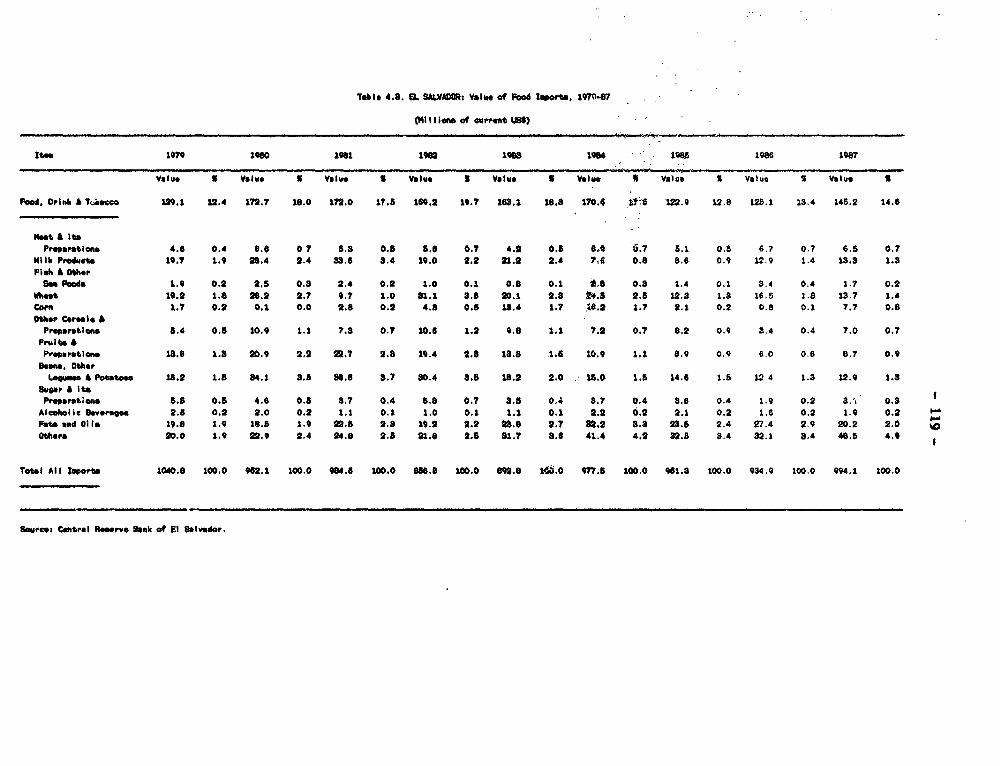
Table 4.3. E SALVAOR: Voluc of Food Import, s970-87
Mlt I cIl of curret mS)
Its_ 1979 1990 1981 1982 198s 1964 19S 1986 1987
Value 5 Valug I Voluo S Value s V.. 1 Vlew W VVluo Valve 5 Valua s
Food, orI lre A kacco 129.1 12.4 172.7 18.0 172.0 17.5 169.2 19.7 182.1 18.8 170.4 1?8 12.9 12.8 t..1 13,4 14B.2 14.6
Meet a ItsPrpratilon 4.6 0.4 .6 0 7 6.8 0.b a.6 0.7 4.2 0.6 6,* 6.7 5.1 O.$ 6.7 0.7 6.5 0.7
Hiltk Product 19.7 1.9 28.4 2.4 33.6 3.4 19.0 2.2 21.2 2.4 t14 0.8 8.6 0.9 12.9 1.4 13.3 1.3
FPi.h & 0orSe Foods 1.9 0.2 2.6 0.8 2.4 0.2 1.0 0.1 0.8 0.1 *-O 0.8 1.4 0.1 3.4 0.4 1.7 0.2
Whest 19.2 1.8 28.2 2.7 9.7 1.0 81.1 8.6 201 2.8 dAI 2.5 12.3 1.3 16.5 1.8 13.7 1.4
Cor" 1.7 0.2 0.1 0.0 2.8 0.2 4.8 0.5 18.4 1.7 18.2 1.7 2.1 0.2 0.8 0.1 7.7 0.8
Other Cereal. &
Preopratio%& 8.4 0.8 10.9 1.1 7.3 0.7 10.6 1.2 9.8 1.1 7.2 0.7 8.2 0.9 3.4 0.4 7.0 0.7
Fruits APrep.r.tl)e I3.$ 1.3 20.9 2.2 22.7 2.3 19.4 2.5 13.3 1.8 10.9 1. 8.9 0.9 6.0 0.6 8.7 0.9
age", OtHerLegme a Potato". 15.2 1.8 34.1 3.8 Sa.6 3.7 30.4 3.6 18.2 2.0 15.0 1.5 14.6 1.S 12.4 1.3 12.9 1.3
Preopratioe S.8 0.6 4.6 0.5 3.7 0.4 B.8 0.7 3.5 0.4 3.7 0.4 8.6 0.4 1.9 0.2 3.' 0.3
Alcoholic Beverages 2.8 0.2 2.0 0.2 1.1 0.1 1.0 0.1 1.1 0.1 2.2 0.2 2.1 0.2 1.6 0.2 1.9 0.2
Faes and 0 la 19.8 1.9 18.S 1.9 22.8 2.3 19.2 2.2 2a.8 2.7 82.2 8.3 23.6 2.4 27.4 2.9 20.2 2.0
other. 20.0 1.9 22.9 2.4 24.0 2.8 21.8 2.8 8t.7 's. 41.4 4.2 82.8 8.4 32.1 8.4 48.5 4.9
Total All Ieorft 1040.8 100.0 962.1 100.0 984.6 100.0 886.8 100.0 689.8 140.0 977.5 100.0 961.8 100.0 934.9 100.0 994.1 100.0
Sourcrs Central Reervo Sank of El Salvador.
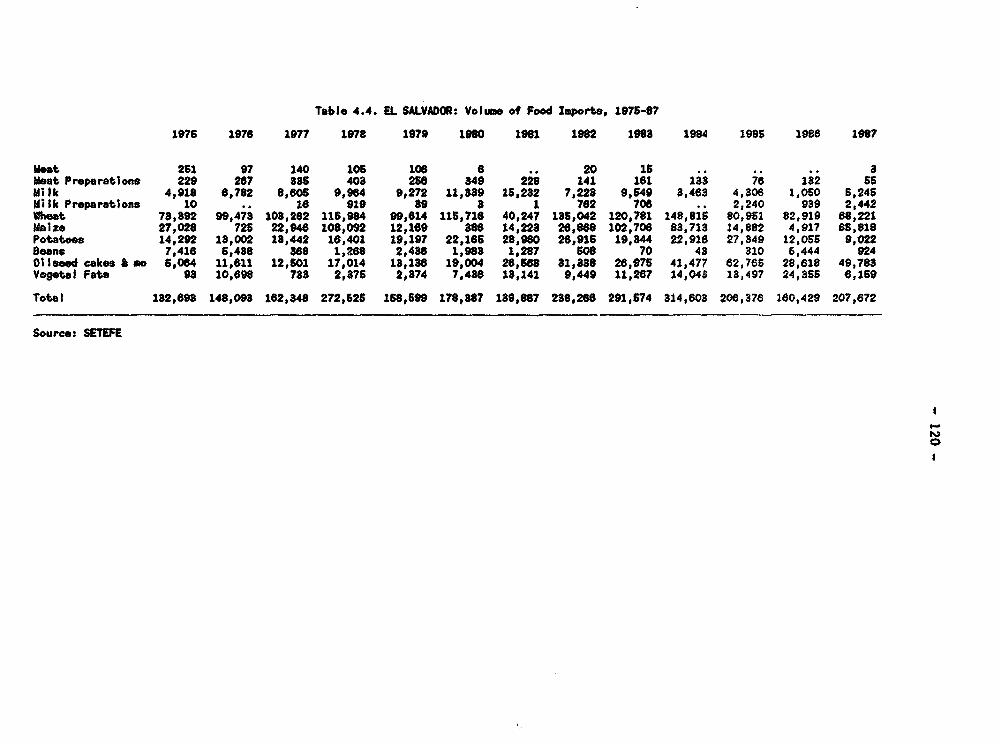
Table 4.4. EL SALVADOR: Volume of Food Imports, 1975-87
1976 1976 1977 1978 1979 1980 1981 1982 1983 1984 1985 lse 1987
meat 261 97 140 106 106 6 . 20 15 .. .. aMeat Preparation* 229 267 8s8 403 268 849 228 141 161 133 76 132 65Milk 4,918 6,782 8,605 9,964 9,272 11,889 15,282 7,228 9,649 8,463 4,306 l,oso 5,246Milk Preparations 10 18 919 89 8 1 762 706 .. 2,240 939 2,442Wheat 78,392 99,473 108,262 115,984 99,614 115,716 40,247 135,042 120,781 148,815 80,951 82,919 88,221Maize 27,028 725 22,948 108,092 12,169 s88 14,223 26,868 102,708 83,713 J4,882 4,917 66,818Potatoes 14,292 18,002 13,442 18,401 19,197 22,186 28,960 26,916 19,844 22,916 27,349 12,056 9,022Bans 7,416 6,488 s88 1,268 2,488 1,988 1,287 608 70 43 310 5,444 924Oilseed cakes & me 5,064 11,811 12,501 17,014 13,136 19,004 28,68s 81,888 26,976 41,477 82,786 28,618 49,783Vegetal Fats 98 10,698 788 2,376 2,874 7,488 13,141 9,449 11,287 14,043 13,497 24,365 B,159Tote1 182,698 148,098 162,848 272,525 158,65 178,887 189,687 2s8,268 291,674 314,608 208,378 180,429 207,672
Source: SETEFE
._
0
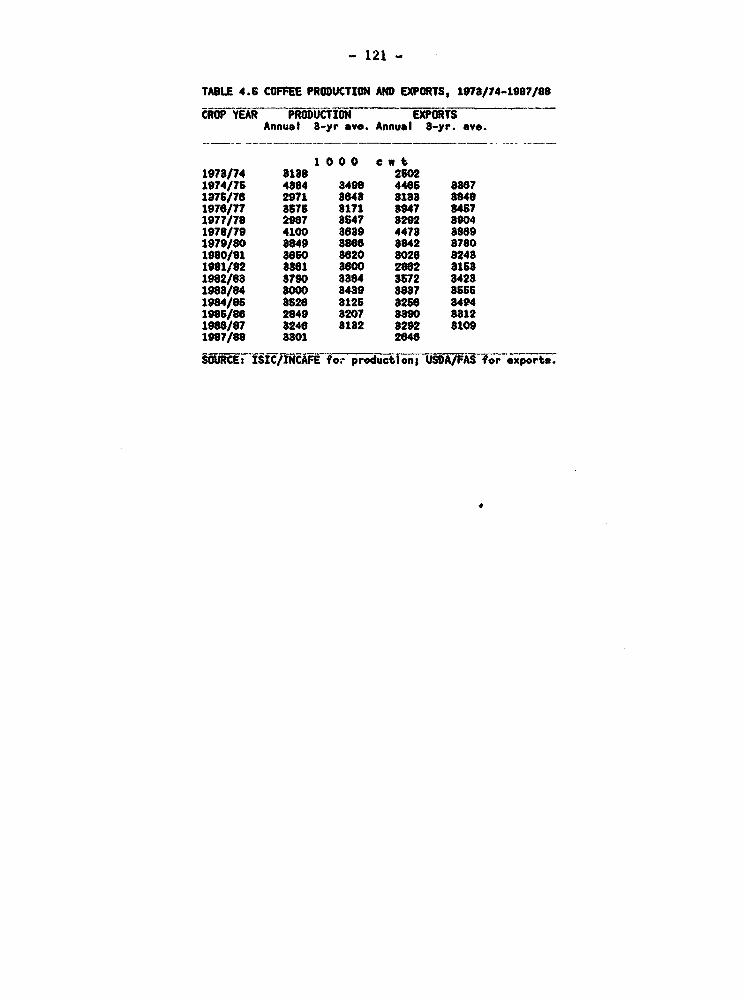
- 121 -
TABLE 4.5 COFFEE PRODUCTION AND EXPORTS, 1973/74-1987/89
CROP YEAR PROdUCTiON EXPORTSAnnual 3-yr eve. Annual 8-yr. eve.
1 000 c w t197n/74 al8s 2S021974/76 4a84 8498 4465 8O8T1n75/78 2971 8648 8188 39481976/77 576 5 8171 8947 84571977/78 29W7 8547 8292 89041978/79 4100 8689 4478 88891979/80 8849 3868 a842 87801960/81 85so a820 026e 824a1981/82 a8el s36o 2862 81681982/83 3790 3884 8572 34281988/64 8000 8489 8687 ass61984/86 3626 8125 8256 849419s5/86 2849 8207 8890 8312198M/87 8246 8182 8292 81091987/88 8301 2646
SOURCE. fSIC/TCAFE i T*MI production; USDA/FAS for export.
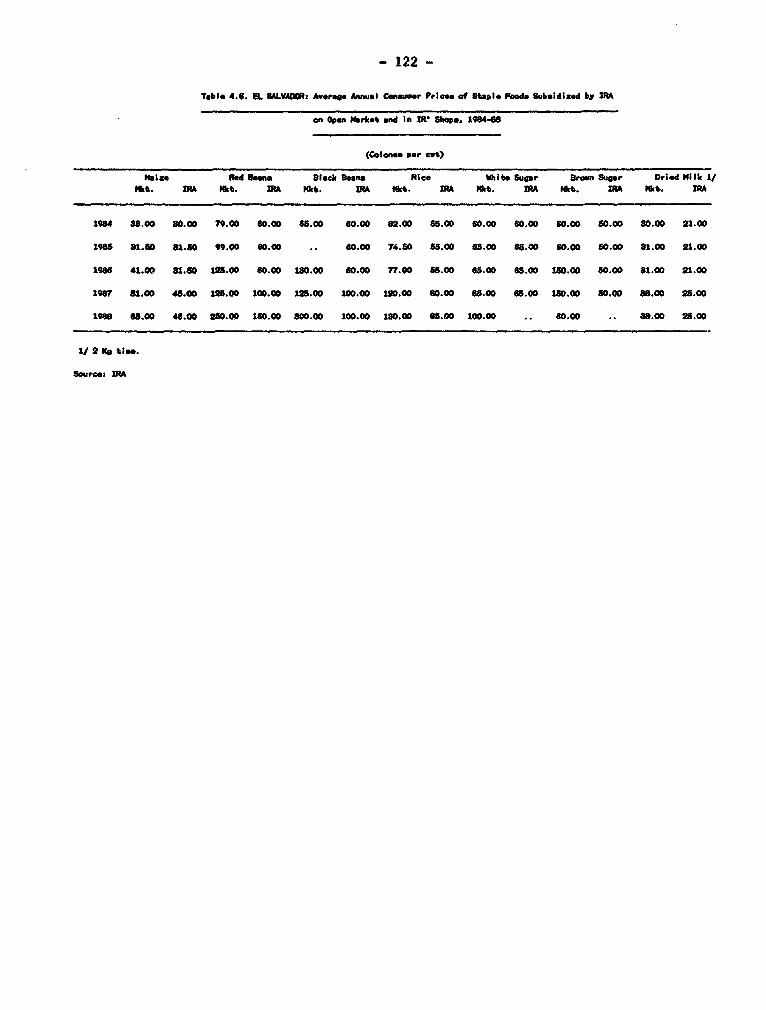
- 122 -
Table 4.4 EL SJALVAD(1Rz Average Am al C.nausgr Prioes at Staple Poad Subsidized by IRA
an Open Mtrket *nd In IR Shop&. 19448
(Colon" per cat)
Wae Red Bean Slack BSean Rice White Sugar Bran Sugar Oried "ilk 1/Mkt. IR Mkt. IFA Dkb. IRA Mat. in kt. IRA 1kt. IRA Mat. 1RA
194 88.00 80.00 79.00 60.00 68.00 60.00 82.00 85.00 60.00 60,00 60.00 80.00 a0.00 21.00
198 81.50 81.50 W9.00 60.00 .. 60.00 74.50 85.00 65.00 65.00 60.00 50.00 81.00 21.00
1986 41.00 81.80 12.00 60.00 180.00 60.00 77.00 66.00 8.00 6e.00 180.00 80.00 s1.00 21.00
19Y 81.00 48.00 1g2.00 10.00 15.00 100.00 120.00 80.00 68.00 65.00 150.00 80.00 88.00 25.00
1985 68.00 44.00 280.00 160.00 800.0O 100.00 18.0 85.00 100.00 .. 60.00 .. 88.00 28.00
1/ 2 Kg tine.
Source: IR
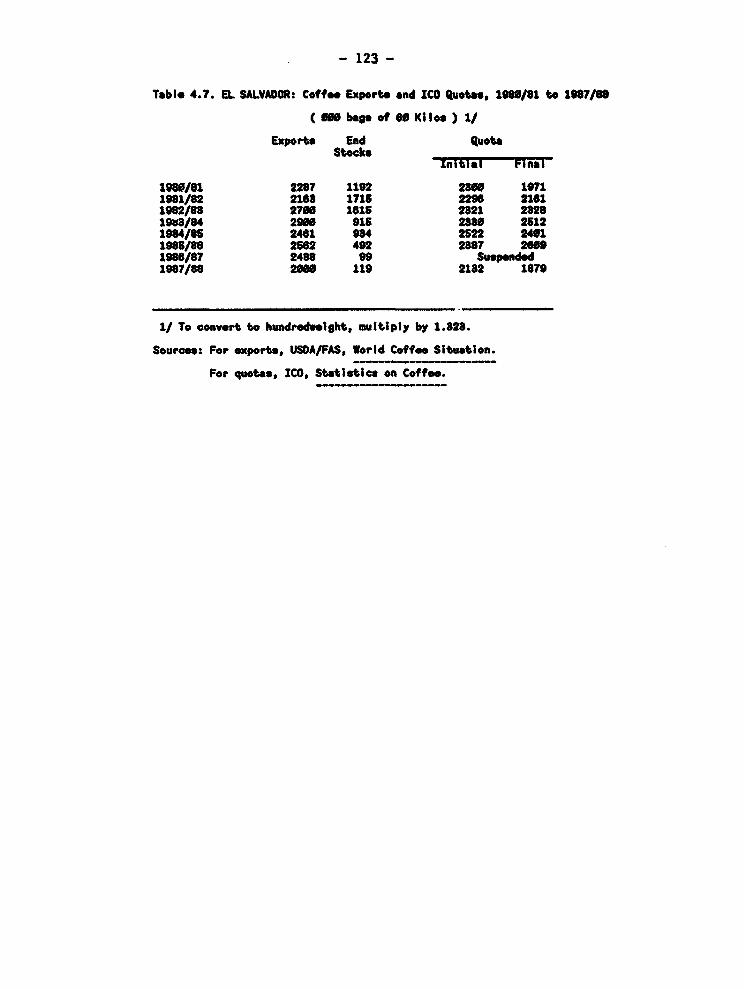
- 123 -
Tabl- 4.?. EL SALVADOR: Cof.. Exports and ICO Quotas, 190/1 to 198?7/88
( 100 bas of 60 KI los) 1/
Exports End QuotaStocks
InItal0 Final
19810/1 2207 1192 280 10711981/82 2168 1715 2296 2101902/88 2710 1615 2821 2820198B/84 2900 016 2380 26121984/85 2461 984 2522 24011l8o/86 2562 492 2887 2109108/87 2488 99 Suspended1887/08 2000 119 2182 1870
1/ To convert to hundreaeight, multiply by 1.823.
Source: For exports, USDA/FAS, World Coffe Situation.
For quotas, ICO, Statistics on Coffee.
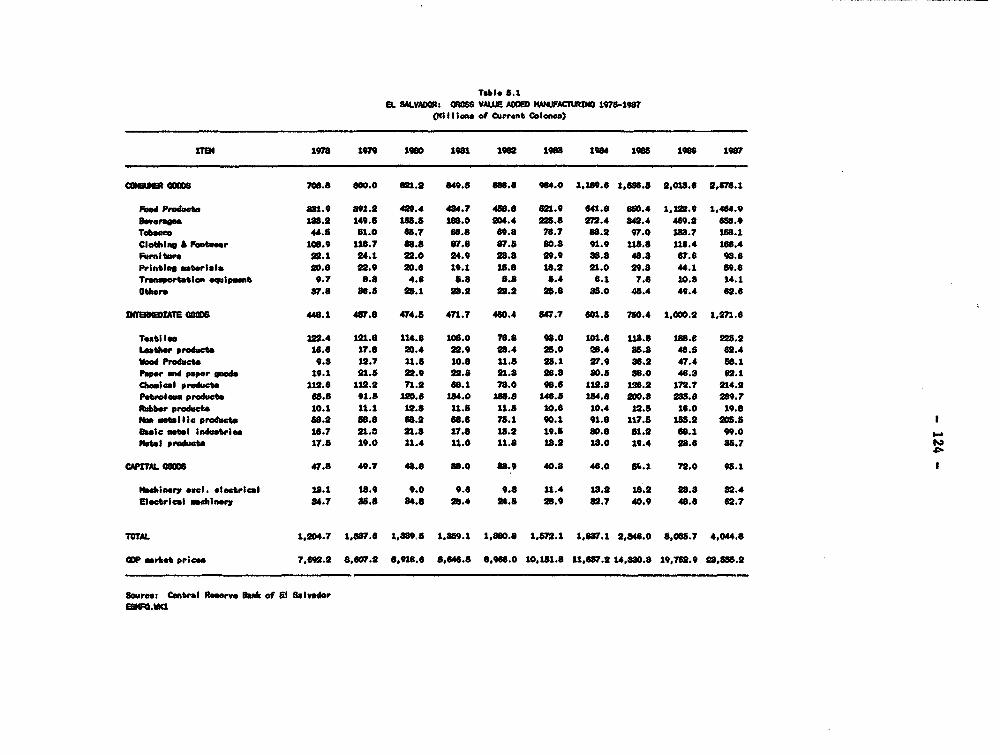
Table 5.1EL SALVA6t 8ft8068 VAUE ADIM AtNUFACTLKII 1975-1987
(i1 II iw of Current Colono
ITet 1978 19s7 180* 198l 1I92 1908 1964 1985 196 1987
cmasu a060s 708.s 600.0 821.2 840.8 888.8 984.0 1*19.6 1,5B6.5 2,018.8 2.878.1
Food Produ. 811.9 891.2 4e.4 484.7 46e.8 s21.9 641.S 080.4 1,122.9 1,484.9awerae 188.2 149.8 10s.5 18.0 204.4 895.0 M.4 842.4 489.2 85s.9T _oacc 4".5 81.0 68.7 66.8 s9.8 76.7 8s.2 97.0 188.7 188.1Clothing & Fiooer 10c.9 118.7 88.8 87.8 87.5 80.5 91.9 115.8 118.4 186.4Furniture 22.1 24.1 22.0 24.9 28.8 29.9 88.8 48.3 e7.8 96.6printing materisl. 20.8 22.9 20.8 19.1 18.8 18.2 21.0 29.8 44.1 89.6TrarA_ortation qi@pment 0.7 8.8 4.6 8.8 5.8 5.4 6.1 7.8 10.8 14.1Others 87.8 86.5 25.1 28.2 22.2 25.8 85.0 45.4 49.4 62.8
INsMJAh 0a06 448.1 487.8 474.5 471.7 460.4 847.7 61.8 780.4 1000.2 1,271.6
Taetiles 122.4 121.8 114.6 105.0 76.8 98.0 101.6 118.8 188.6 265.2Leatber products 18.8 17.8 20.4 22.9 28.4 25.0 28.4 85.8 40.5 62.4wood Prduct. 9.8 12.7 11.5 10.6 1.5 28.1 27.9 86.2 47.4 58.1Pa"r and paPer god, 19.1 21.5 22.9 22.8 21.8 26.3 80.8 88.0 48.3 62.1Cheamcal products 112.8 112.2 7.2 88.1 78.0 98.6 112.8 126.2 172.7 214.2Petroleu product, 65.5 91.5 120.B 194.0 18.8 1"8.5 14.s 200.8 28s.8 219.7Rubber products 10.1 11.1 12.8 11.5 U.S 10.8 10.4 12.8 18.0 19.8
"n mltelc prducte 88.2 56.8 68.2 68.s 75.1 90.1 91.8 117.5 155.2 205.5be). metal indamtriem 16.7 21.3 21.8 17.0 15.2 19.5 80.8 81.2 68.1 99.0
til preduct 117.5 1.0 11.4 11.0 11.8 18.2 18.0 19.4 23.8 85.7 6
CAPITA. O5 47.8 49.7 48.8 a8.0 8s.9 40.8 48.0 5o.l 72.0 98.1
b)nery asel. electrical SS.1 18.9 9.0 9.8 9.0 11.4 18.2 15.2 21.8 82.4iatctrical Achinery 84.7 88.8 84.0 2b.4 24.5 28.9 82.7 40.9 48.8 62.7
TOTAL 1,204.7 1,887.6 1,8s9.s 1,859.1 1,880.8 1,.572.1 1,887.1 2,848.0 8,065.7 4,044.8
MP maete primc 7,5.2 8,807.2 8,918. 8,46.5 8,968.0 10,151.8 11,867.2 14,880.8 19,762.9 28,66.2
Source: Central e"r,. Sanki of El SalvadorESO.wa

TAKE 5.2. MM VALUE A0 1978-1967OliltIona of 1962 Colon.)
IT 1970 1979 1960 1961 19s2 1966 $984 190 1916 1987
Ca#S18 GOODS 468.0 44T.9 419.9 88.7 361.9 89.6 869.6 890.8 897.4 406.4
Food Prodct 244.9 289.8 2a4.0 217.8 206.0 216.7 268.1 268.8 2O8.6 289.8vrage 96.3 ee.4 9.4 89.0 86.4 75.4 n.4 74.0 77.2 81.1
Tobacco 27.6 26.2 29.2 27.2 24.1 26.1 21.4 19.9 20.4 20.8Clothing A Footer 885.2 S2.9 21.7 20.8 16.8 14.8 18.4 18.8 14.8 14.6Furniture 16.9 14.9 18.6 14.6 12U' 14.6 18.0 13.8 14.8 16.1Printing materials 14.0 18.2 11.9 10.6 6.4 6.4 6.2 6.0 5.2 8.3Tranqeortatiom eipment 4.3 8.0 1.4 1.4 1.2 1.1 1.1 1.1 1.1 1.1oterc 24.8 19.6 11.8 8.7 7.4 7.4 8.1 7.4 8.7 9.0
IMTN IATE 000 198.0 174.0 189.4 117.5 108.7 114.2 111.1 107.6 111.7 110.0
Testis Im 36.6 81.6 26.2 21.0 14.2 15.1 14.8 12.8 14.8 18.4Leather prdut. 5.4 5.2 4.4 4.4 8.7 3.6 8.8 2.8 2.3 2.3Woed Producte 8.8 4.7 4.2 8.6 3.a 7.8 7.8 7.4 7.9 8.8
per and papr goo 18.2 12.4 11.9 9.6 7.2 8.6 7.7 6.9, 5.6 8.5Cieomica produect 69.8 8.7 16.2 14.7 18.2 17.1 17.S 15.6 16.1 18.6Petroleum producbt 45.0 44.O as.0 29.6 27.6 25.6 27.7 27.4 27.7 26.8Ribber product. 2.7 2.2 1.9 1.4 1.6 1.2 1.0 0.9 0.7 0.8in metallic products 27.1 2.8 26.8 22.9 9e.2 26.8 21.4 29.4 26.6 27.1Obole metl industriOS 10.5 10.7 9.0 6.6 8.1 5.0 8.1 9.2 10.8 10.9"ota producu t.a 8 .1 4.1 8.5 8.8 8.6 2.4 2.5 2.1 2.8
CAPAL 00008 6O.8 84.9 26.8 18.8 1s.8 16.7 16.2 17.1 19.8 19.0
Machinery ecl. electriatl 10.0 10.0 5.7 4.9 4.8 4.7 8.0 6.9 6.6 6.8Electric l mawnery 25.8 24.9 21.2 14.0 11.0 12.0 11.2 11.2 12.7 1l.0
TiTAL 691.s MMM.8 66.2 M8.0 480.9 490.8 496.9 8S.4 528.8 844.1
Source Control Reerve bani of E Salvdor.
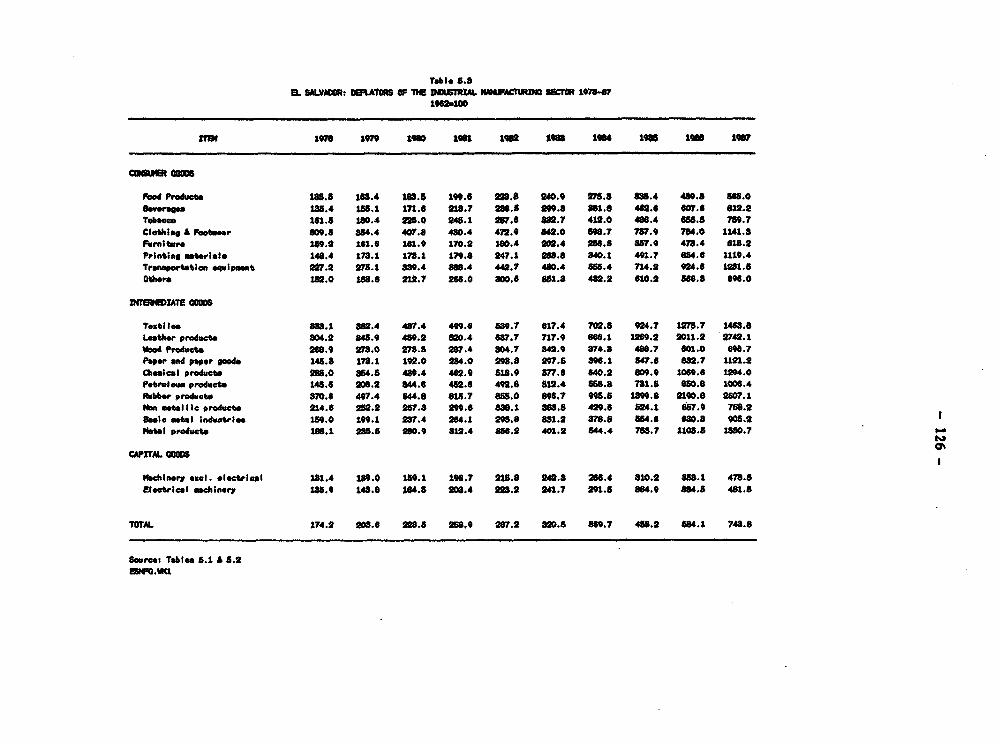
EL SALV4O: WLATORS OF TI DPO6RRA NBAM4TRD4O S67R 1078471962.100
Em 1978 1979 i s two si i11 Ig8 1984 igo two 19S7
Food ProdU 185.8 163.4 18S.5 199.6 MA.8 240.0 27. 8Ss.4 48.8 6 s.oDaveao 185.4 135.1 1n.6 218.7 286.8 299.8 881 462.6 607.6 812.2Tobaco 161.5 1t0.4 228.0 248.1 287.6 882.7 412.0 486.4 686.8 789.7Clothing A FPaour 809.e 854.4 407.8 480.4 472.9 842.0 598.7 787.9 784.0 1141.8Furniture 189.2 181.8 161.9 170.2 180.4 202.4 2s6.8 857.9 478.4 6t8.2Printing material 146.4 178.1 178.1 179.8 247.1 163.8 840.1 491.7 654.6 1119.4TrUaortatlon eqipeut 227.2 275.1 889.4 868.4 442.7 490.4 855.4 714.2 924.6 1281.5otlie 182.0 188. 212.7 2s6.0 800.8 881.8 482.2 610.2 566.8 696.0
_NTa.I1ATE 00
TextIlet 821.1 852.4 487.4 499.s 889.7 617.4 702.8 924.7 127.7 1488.8Leather products 804.2 845.9 489.2 810.4 68.7 717.9 866.1 129.2 2011.2 2742.1vowd Products 268.9 27.0 278.5 2a7.4 804.7 84.9 874.8 488.7 801.0 69s.7Paper and paer eoode 148.3 178.1 192.0 284.0 293.8 297.5 8a".1 847.6 682.7 1121.2Chemical products 268.0 854.5 430.4 462.9 818. 57.S 840.2 809.9 109. 1294.0Petoleumw product. 145.e 206.2 S.6 482.6 492.6 812.4 558.a 731.6 e80.s 1006.4Rubber producte 870.6 497.4 S44.8 815.7 858.0 896.7 5.6 19.8 2190.6 2507.1Nan setallic produet 214.8 252.2 287.8 299.6 88.1 883.8 429.6 524.1 57.9 756.2Saag etal Industriee 1i.0 1m.1 2w7.4 264.1 2985.8 81.2 876.8 84.6 680.8 905.2"etSl products 186.1 2s5.8 260.9 812.4 856.2 401.2 844.4 788.7 11.8 1850.7 -
0'CAPITAL C0 I0
lachineory *xel. electrical 311.4 189.0 189.1 196.7 218.8 242.8 266.4 810.2 S58.1 478.5Electrical xmcinery 1s.9 148.6 1U4.8 206.4 223.2 241.7 291.8 8s4.9 864.5 4"8.
TOTAL 274.2 206.6 S26.5 256.9 287.2 820.s 869.7 458.2 564.1 748.8
Soce: Tables .,1 A 8.2a.r.i

Table 5.4EL SALVACR: M If VILI Of O cROMJiN, 1978-196
C1M II Ion* o current colon..)
1EM 1978 1979 180 1961 1962 1968 1964 1965 1966 1"7
CWeER mm 1,64e6.1 1,s7.8 1,912.9 1,955.5 2,087.6 2,261.0 2,847.9 8,718.2 4,661.0 6,773.2
Food Proet.s 9s6.2 1,117.6 1,26.8 1,242.0 1,818.6 1,408.5 1,99.9 2,517.5 S,184.2 s,916.4ievera. 175.7 196.7 217.7 247.4 268.9 297.1 871.8 466.7 590.5 714.9
Tobacco 58.4 7.1 86.4 67.9 91.2 100.9 20.8 3a2.8 176.3 218.0Clothing & Foower 257.8 277.6 210.4 20.5 208.8 191.2 226.9 285.9 801.1 420.5Furniture 88.4 42.2 86.6 48.6 40.6 82.4 60.8 87.8 115.0 18.0Printing tetrinle 57.5 68.7 57.8 58.0 44.0 50.7 80.8 64.8 117.8 1*7.2Transportatlon equipwant 7.7 28.7 18.1 18.1 15.1 15.6 38.0 23.1 29.0 S5.7
Others 94.4 91.2 62.6 56.0 55.5 64.7 90.7 117.7 147.0 197.4
rDIWIATE CWDS 1,246.7 1,882.5 1,879.4 1,879.9 1,848.7 1,570.3 1,781.8 2,064.4 2,725.0 3,149.8
Textiles a88.9 899.2 309.6 23.7 207.5 251.2 264.3 381.5 475.8 '8.8Leather product. 46.6 49.6 56.7 68.7 68.0 6e9.5 1.8 101.5 W27.7 1rf.IWood Product. 15.6 21.2 19.1 18.1 19.1 41.8 48.2 62.5 79.2 89.2Papr end paper goode 51.8 58.2 61.9 60.7 57.5 71.0 65.4 106.5 198.6 57.5Cheaicai producte 810.8 811.7 197.6 189.1 216.7 274.0 828.2 863.1 497.4 602.5Petrolea product 268.2 866.1 482.5 56.1 548,8 586.0 609.1 6t.5 S.0 878.6Rubber product. 20.8 22.2 24.7 29.0 98.1 21.1 21.5 25.9 38.1 41.8Non avl llic product 9.8s 9.7 15.7? 116.8 127.8 1.8 161.2 206.4 272.6 388.38Molc mea lindustries 57.9 78.4 73.8 s9s5 52.4 67.8 1 '.2 19.9 290.1 289.0iatl products 47.8 51.2 0.9 299.6 81.8 65.6 86.4 54.5 61.0 77.9
CAPITAL 0 119.8 129.5 112.2 9e.4 84.8 100.1 118.0 150.5 200.9 2?7.2
Machinery *xcl. *lctrical 82.7 24.1 15.5 1S.5 18.1 19.7 28.6 82.4 40.8 s0.8Electrical mchinery 96.6 .4 96.7 7s.9 68.2 80.4 94.8 117.9 1O0.1 206.4
TOTAL 8,011.0 3s,66.8 8,897.5 8,480.8 8.465.6 8,981.8 4,727U 5,s49.9 7,587.0 9,10.1
Sourc: Centerl Rhrve r Ba nf i SalvadorEllm."a
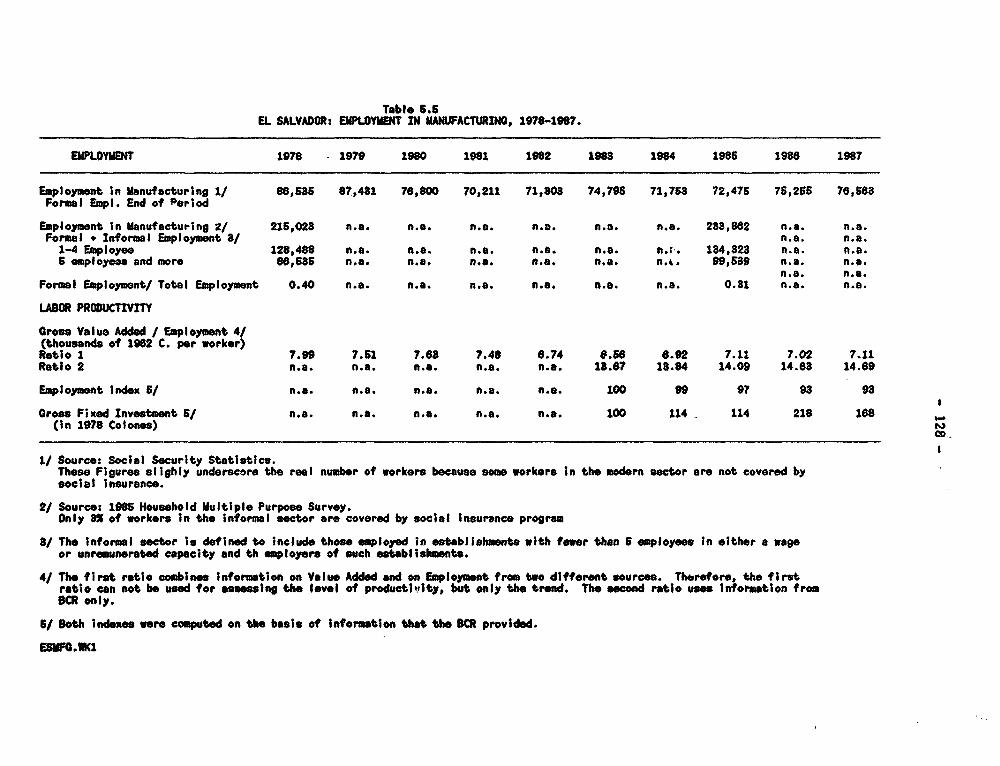
Table 5.5EL SALVADOR: EMPLOYMENT IN MANUFACURDNO, 1978-1987.
EMPLOYMENT 1978 1979 1980 1981 1982 1988 1984 1986 1988 1987
Employment in Manufacturing 1/ 88,685 87,481 78,800 70,211 71,803 74,795 71,765 72,476 7S,2S6 78,683Formal Empl. End of Period
Employment In Manufacturing z/ 216,023 n.a. n.s. n.a. n.a. n.a. n.a. 233,862 n.a. n.a.Formal + Informal Employment 3/ n.a. n.a.1-4 Employee 128,488 n.a. n.m. n.a. n.m. n.a. n.r. 184,828 n.a. n.a.S employees and more 88,658 n.a. n.a. n.a. n.a. n.a. n.h. 99,589 n.a. n.a.n.a. n.a.Formal Employment/ Total Employment 0.40 n.a. n.a. n.a. n.a. n.a. n.a. 0.81 n.a. n.a.
LABOR PRODUCTIVM
Gross Value Added / Employment 4/(thousands of 1982 C. per worker)Ratio 1 7.99 7.61 7.88 7.48 8.74 0.68 8.92 7.11 7.02 7.11Ratio 2 n.a. n.s. n.a. n.a. n.a. 13.87 18.84 14.09 14.83 14.89Employment Index 6/ n.a. n.a. n.a. n.a. n.a. 100 99 97 98 93Gross Fixed Investment S/ n.e. n.e. n.a. n.a. n.e. 100 114 114 218 188(In 1978 Colones)
1/ Source: Social Security Statistics.These Figures sl7ghly underscore the reel number of workers because some workers In the modern sector are not covered bysocial insurance.
2/ Source: 1985 Household Multiple Purpose Survoy.Only 8X of workers in the Informal sector are covered by social Insurance program
8/ The informal sector is defined to include those employed In establishments with fewer than S employees In either a wageor unremunerated capacity and th employers of such establishments.4/ The first ratio combines informtion on Valve Added end on Employment from two different sources. Therefore the firstratio can not be used for assesing the levol of productitvlty, but only the trend. The second ratio us inormation from9CR only.
6/ Both indoes were computed on the basis of information that the CR provided.ESNFG.1(1
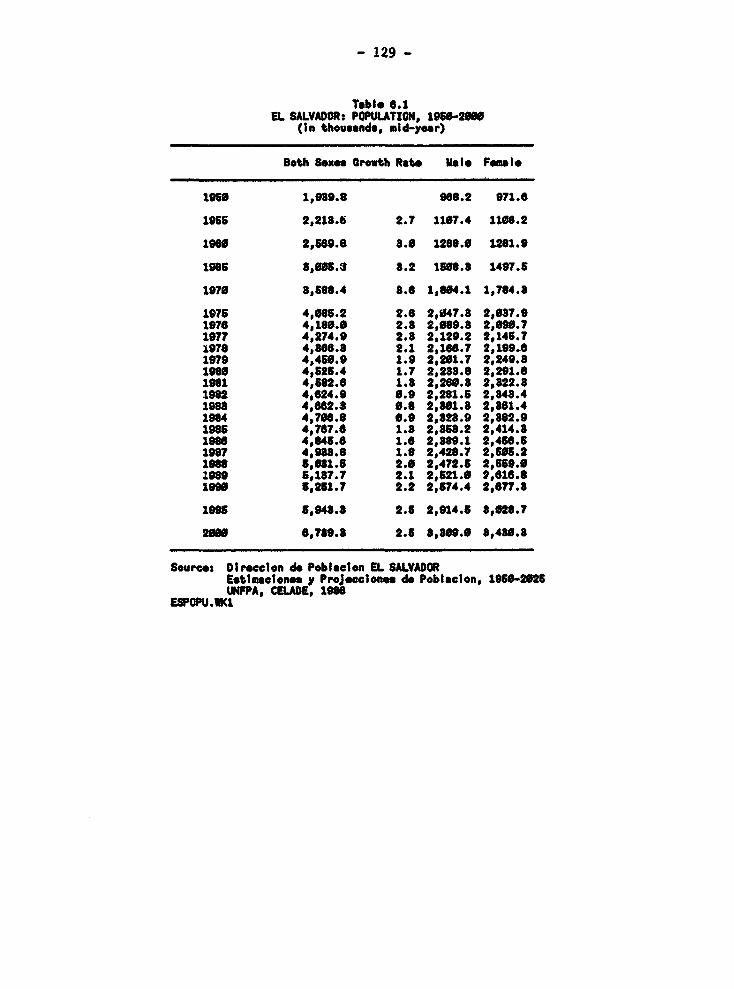
- 129 -
Table 0.1EL SALVADOR: POPULATION, 1960200
(in thousands, mid-year)
Both Sexes Growth Rate Mal- Femle
1950 1,939.8 968.2 971.6
1965 2,218.6 2.7 1107.4 1198.2
1960 2,669.8 8.0 1268.0 1281.9
19616 3,96.3 8.2 15S8.3 1497.6
1970 3,686.4 8.6 1,804.1 1,784.3
1975 4,086.2 2.6 2,047.8 2,037.81978 4,180.0 2.8 2,089.3 2,090.71977 4,274.9 2.8 2,129.2 2,145.71978 4,868.8 2.1 2,186.7 2,199.61970 4,460.9 1.9 2,201.7 2,249.81980 4,526.4 1.7 2,238.8 2,291.61981 4,582.8 1.8 2,260.8 2,322.81982 4,624.9 0.9 2,281.6 2,343.41988 4,662.8 0.8 2,301.8 2,801.41904 4,706.8 0.9 2,328.9 2,882.91986 4,767.0 1.8 2,868.2 2,414.31988 4,845.6 1.6 2,809.1 2,456.619S7 4,988.8 1.8 2,428.7 2,605.21988 5,031.6 2.0 2,472.6 2,659.01989 5,187.7 2.1 2,621.0 2,616.81990 5,261.7 2.2 2,674.4 2,677.8
1005 6,943.3 2.5 2,914.6 8,028.7
2800 6,70.8 2.6 8,309.0 8,4a0.8
Source: Dirocoon de Poblaclon EL SALVADORLetloaclone, y Projecclones de Poblacion, 1050-2925UNFPA, CEADE, 1988
ESPOPU.1K1
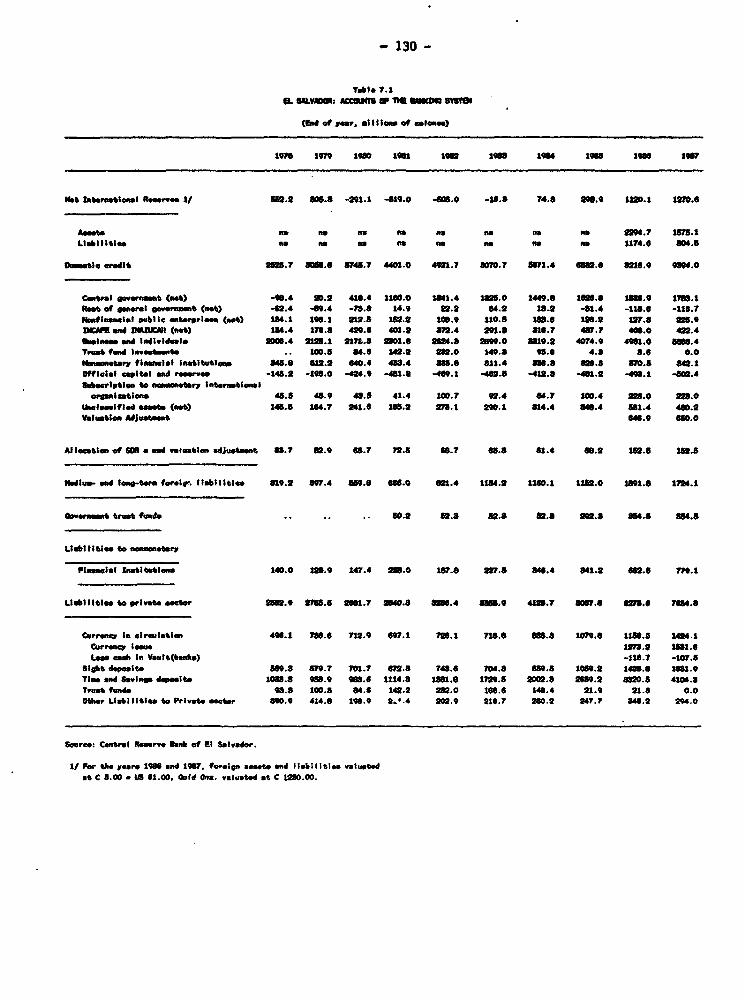
- 130 -
'Fable 7.1IL SDLAAs m815T W TM 1665M
(d of ruw. ml *I . oF colenee)
1978 1979 108 1961 108 1ees 10"4 wO 1s6 1067
#e lniernaioel _eee.. 1/ WO.2 86.8 -29.-1 410.0 -06.0 -18.5 74.8 26.9 1M.1 10.6
Adest no _a no ma na as so 4.r 7 15.1Liabil ill. mae as no as as ma an as 1174.0 804.6
O_lmti eredit 280.7 SMA8.3 874s.7 4401.0 402.7 807.? 871.4 e11.8 801.9 984.0
Cenral e go.met (mt) -0.4 90.2 418.4 1160.0 141.4 82.0 1449.8 lo6.6 16.9 1786.1Ret of eneal government (set) -82.4 49.4 -78.8 14.9 90.2 84.2 18.2 -81.4 -118.0 -16.7Noniniancial oublic amt 1piae (n*O) 14.1 10.1 912.5 18.2 106.9 110.8 1.6 I.2 127.8 z.eDW en D60Wim ("Wt 18.4 176.8 429.6 401.2 872.4 291.8 1S6.? 477 406.0 490.4Remiam WA individuals 26.4 212.1 21n.8 2601.6 24.8 2199.0 819.2 4074.9 4061.0 8M.4Trt fund lnvetcment .. 10.5 84.6 142.2 26.0 149.8 90.6 4.8 8.8 0.0
,mwtere yliamanciel lnstit ton. 845.6 612.2 640.4 458.4 885.8 811.4 8.8 82.5 s8.5 84.1Official capital a" r_mrv -14.2 -195.0 -424.9 -451.8 -469.1 -480. -412.8 -461.2 -4.1 402.4Suteriptioe to eassaw laterntlena
oerniticma 45.0 45.9 48.8 41.4 100.? 9.4 84.7 100.4 908.0 Zl.0Unclassified eels (mat) 145.8 184.7 241.6 165.2 271.1 200.1 814.4 846.4 511.4 480.2Valuatles u t 648.9 6.0
Allec e Ian of * sad vainetlem edJ_twt 85.7 802.9 5.? 72.8 66.7 65.8 81.4 t8.2 1M5.8 185.5
Rbdilu- ed len-tm ferelar Itebilo;11 8109.2 897.4 89.8 66.0 021.4 1154.2 110.1 15.0 1891. 1714.1
vnM trt fun .. .. .. 50.2 52.5 85.8 85.8 22.8 854.5 SW4.$
mb lilt o e n to ntgeI
Pinsacil Imleittlen 140.0 195.9 147.4 250.0 17.8 227.5 840.4 841.2 ts2.6 770.1
Usbilitiae te privae oet 980.9 9765.5 2631.7 240.8 52.4 SW.9 4U111..7 07.0 627s8 7854.8
Cu"erro In cireulati 4108.1 780.6 712.9 697.1 726.1 718.6 toa 1079.6 211.8 14241Car Ono lmue 17.2 1811.6Liam cmb In Yea Yt(boke) -116.? -107.5
Sigh daIpIts 569.8 579.7 701.? 6F.5 748.6 704.8 M'.5 1069.2 1426.6 S61.9Time ed Saving dpelte 108.8 958.9 08.6 1114.8 86.9 1729.5 2002.8 2659.2 82D0.5 4104.8Trust fen" 08.8 100.5 84.6 142.2 2a2.0 166.6 145.4 21.0 21.6 0.0Oteor Llabilitl.m to Private mecter 890.9 414.8 6 10.9 JL.4 202.9 916.7 260.2 247.7 84.2 294.0
Source: Cetal Rearve Bank of El Salvdwor.
1 /r li the ers I end 1067. foreig, lset end liobi ities valuatedat C 5.00 * to *1.00. *old One, valuated at C 1260.00.
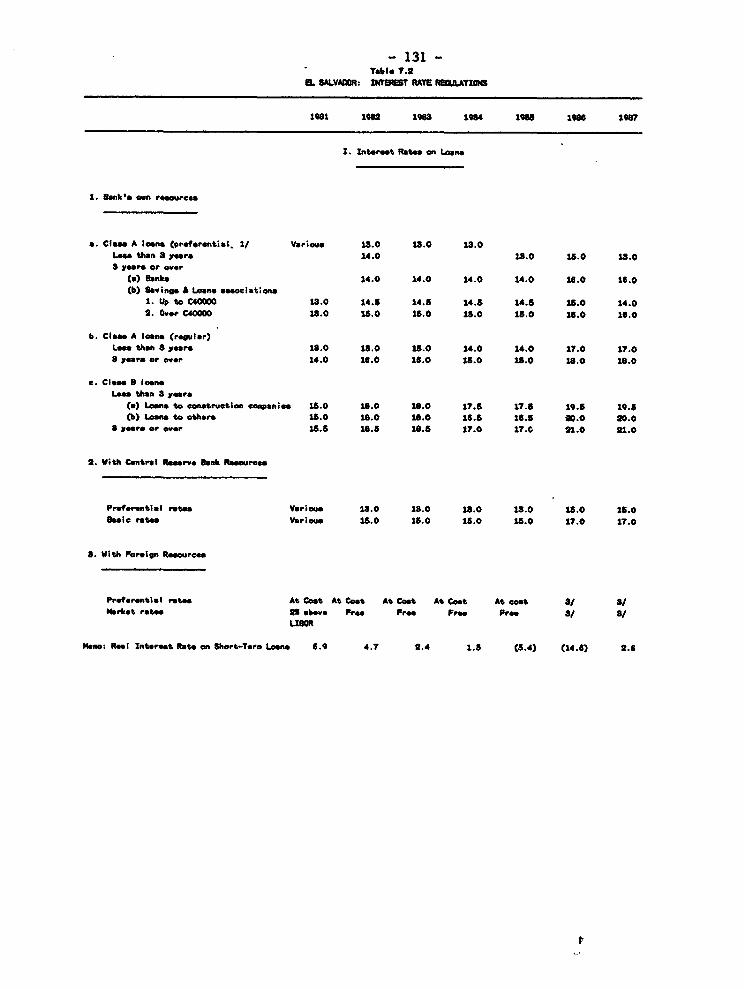
- 131 -Table 7.2
IL SALVADlOR: PaW RAM REI ATIIINS
1981 1082 1908 19184 1WiS 19" 2987
1. Interest Rates on Lonsn
1I Sank's ocn resourc*e
a. Class A loans Cpoferential. 1/ Verisog 13.0 13.0 13.0Lee then 3 years 14.0 13.0 13S0 13.03 yeare or over
(C) Sanit 14.0 14.0 14.0 14.0 16.0 16.0(b) Saving. & Loans reaociatons
1. Up to C40000 13.0 14.5 14.5 14.5 1405 18.0 14.02. Over C4000 13.0 1l.0 15.0 13.0 lS0 16.0 16.0
b. Cil A lo an (regular)Lea. thah a years 15.0 15.0 15.0 14.0 14.0 17.0 17.08 years or over 14.0 16.0 16.0 18.0 15.0 18.0 16.0
a. Clas B coansLa than a y.ts,
Ce) Loans tD con truetion companies 11.0 18.0 18.0 17.5 17.8 19.5 19.5(b) Lanas to others 1.0 18.0 18.0 16.5 16.5 20.0 20.0
3 years or over 15.5 18.5 18.5 17.0 17.C 21.0 21.0
2. With Central Resrve Bank Reources
Preterenttal ratec Various 1.0 18.0 13.0 15.0 15.0 15.0Basic rates Various 15.0 13.0 15.0 15.0 17.0 17.0
3. With Foreign Rouorces
Prr rent;el rates At Cost At Cost At Cost At Coat At cost ar a/Market rates 20 above Pre, Pree Free Fr" - a
LIUR
Mas: Real Interet Rate on Short-Tars Leen 6.9 4.7 2.4 1.5 (5.4) (14.6) 2.8
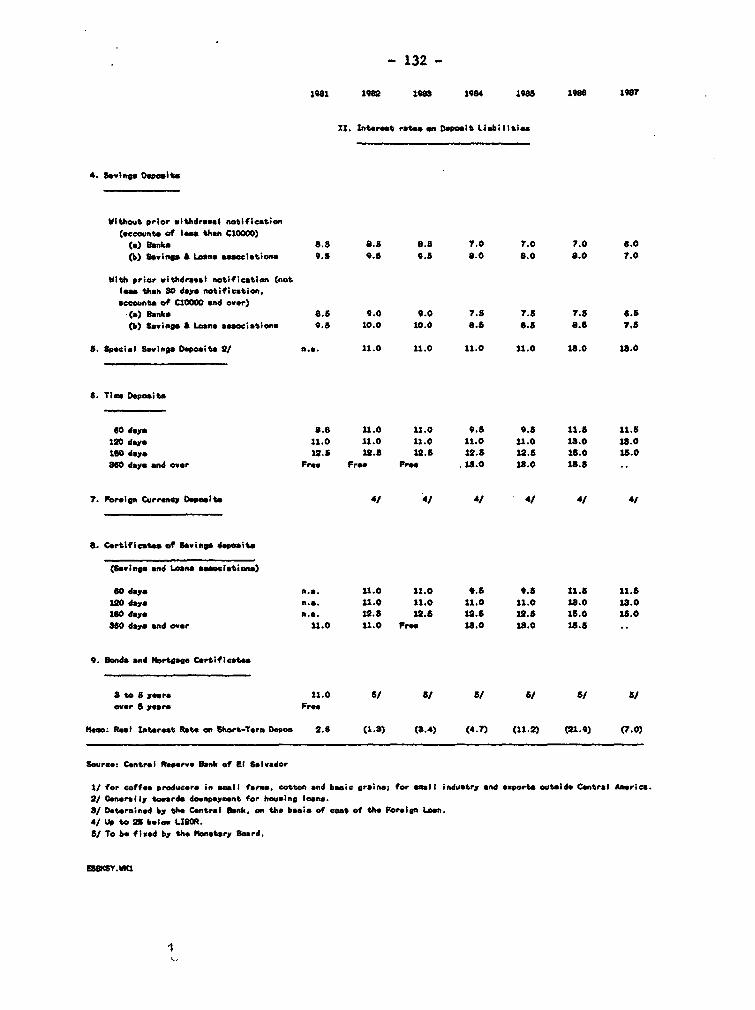
- 132 -
18i1 1982 193S 1984 1985 198i 1087
Xl. Interest rate. on Depoait i.bi ltite
4. SaVng. Deoelto
V;thout prior withdarwal notification(nccount. of les than CIO0)
(a) Bnk 8.8 8. 8.5 7.0 7.0 7.0 6.0b) Saving J Loom i enltion 9.5 9.8 9.5 8.0 0.0 8.0 7.0
Wlith prior withdreall notification (notle_ th SO d ye notification,atcounts of CIOOCO and over)
(a) Bank 8.5 e.0 9.0 .5 7.5 . 6.5(b) Savings S Loana escocietion 1 9.5 10.0 10.0 0.5 8.5 8.5 7.5
B. Specitl Savings Depoaits 2/ n.e. 11.0 11.0 11.0 11.0 18.0 18.0
8. Time Do;sita
60 days 8.8 11.0 11.0 9.5 9.5 11.5 11.5120 day. 11.0 11.0 11.0 11.0 11.0 1l.0 18.0
130 davy 12.5 12.S 12.5 12.5 12.5 18.0 15.0860 days ond over Free Free Fre 19.0 19.0 13.5
7. Foreign Currency Deositt 4/ 41 4/ 4/ 4/ 41
8 Catificae of Sa;vins dapo;Its
(Sewing; and Loan& essecistionn)
sO deya n.a. 11.0 11.0 9.8 9.8 11.5 11.S
12 dayo nn.. 11.0 11.0 11.0 11.0 18.0 18.0iO days no.. 12.S 12.5 12.5 12.5 15.0 15.0880 dy" and over 11.0 11.0 Free 18.0 1.0 1O.5.
9. wtnda and Mortgage Certificates
to 5 year 11.0 S/ / S/ 5/ S/over 5 years Fre*
ewo: Real Intereat Rate on Short-Tern DenOa 2.6 (1.3) (3.4) (4.7) (11.2) (219) (7.0)
Soure: Central Reorve Bank of El Salvador
1/ for coffee producara in WWII fares. cotten and basic grains; for emall industry and exports outaide Central America.2/ Generally towards doenpoyment for housing loana.8/ Determined by the Central Bank, on the basis of coat of the Foreign Loan.4/ Up to 2i below LIBOR.S/ To be fixed by the Monetary Board,
ES30SYV.W
1
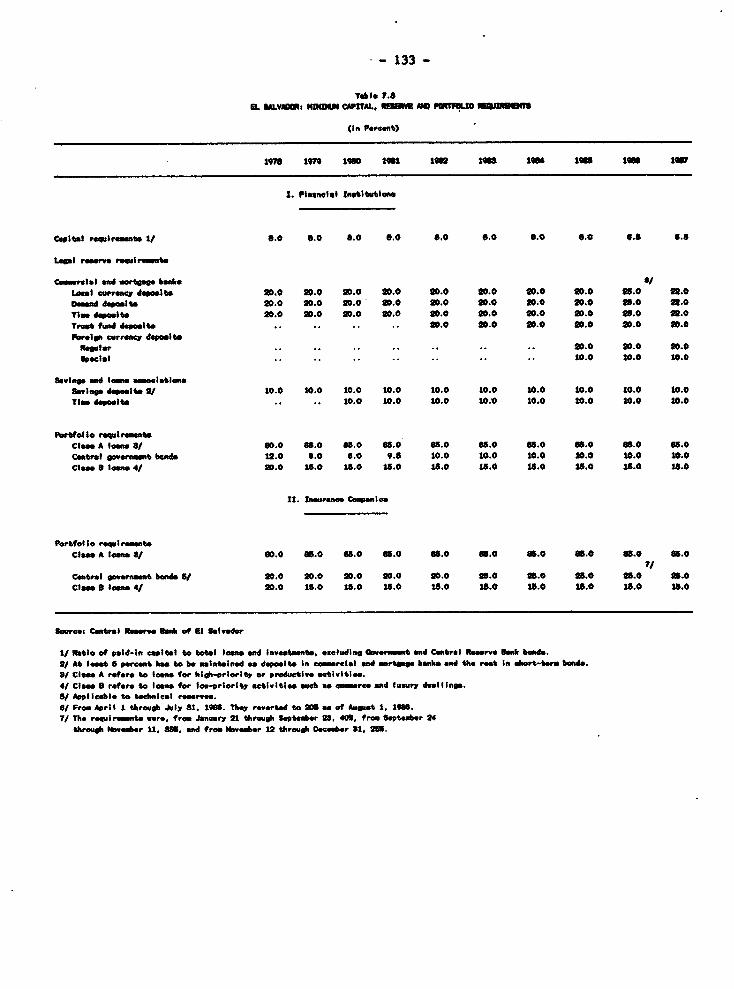
- 133 -
IL. OVAMS WD4Dh CWITAL. 1O M e NO u o i13u78
(in Percet)
1- 1979 100 ion 1ow 1018 1o" 101 I 1i07
1. PIroacit Rwtltlef
Cepifal requiremonts 1/ 0.0 0.0 *.0 6.0 6.0 0.0 0.0 0 .0 6.8 0.6
Leal r _on reeirremlt
Csvcmiai and mtgase bank.SLoal OWurwYs deosmite 20.0 01.0 20.0 01.0 01.0 20.0 20.0 90.0 01.0 01.0Dtlcd deposits 0D.0 80.0 20.0 20.0 80.0 80.0 80.0 01.0 01.0 01.0T_se d_1poe 20.0 80.0 20.0 20.0 20.0 90.0 80.0 01.0 90.0 11.0Trt fund doit .. .. .. .. 0.0 0.0 01.0 20.0 20.0 20.0Foreign currency depoltt
Reular .. .. .. .. .. .. .. 80.0 20.0 . 10.0Speclal .. .. .. .. .. .. .. 10.0 10.0 10.0
Saving aNd le.afs.onocistionsSavings depoit. at 10.0 10.0 10.0 10.0 10.0 10.0 10.0 10.0 10.0 10.0T dolte .. .. 10.0 10.0 10.0 10.0 10.0 10.0 1. 10.0
iortfol i rewiClm A lan. S/ 90.0 o 5.0 88.0 68.0 05.0 05.0 65.0 65.0 68.0 65.0Central governmet bns 12.0 6.0 6.0 9.8 10.0 10.0 10.0 10.0 10.0 10.0Clae 6 lbae 4/ S0.0 15.0 18.0 15.0 18.0 15.0 18.0 15.0 15.0 18.0
it. isuranc Coeai-
Portteo requtir_esntClw A lowa 5J 60.0 65.0 05.0 65.0 65.0 Il.0 65.0 i.0 651.0 65 0
*/Caatrsl governent s 20.0 01.0 01.0 0.0 0.0 15.0 015.0 8.0 01.0 11.0Clan S loan 4/ 01.0 15.0 15.0 15.0 1.0 18.0 18.0 tO.0 18.0 1 8.0
Sore: Central b_"e sank of El Salvar
1/ Ratio of paid-in cepittI to toita tban a Investmente, excluding Gorn_nt and Cetral Rtserv Be" bonds.2/ At lems 5 percent has to be ainteined ts dapoelte In cossatctl Vn mortgage bank ad the ret In short-tars bends.S/ Clean A refdr to loans for hih-priority or productive activities.4/ Class S refers to loans for lfo-priority ctivitleeu wch as coanrce and luxury dwallings.S/ Applicable to tacmnical reerva.6/ ro April I1 through JMly S1. lOSS. They reverted to 20 _s of August 1. 106.7/ The rwquirente were, from January 21 through September 2S, 40C, from September 24
through Noveber 11, 53. and from Moveber 12 through Dacotbar 81, 253.

- 134 -
Tr51b 6.1 IU ULVAUX - aternal 0Abt
1967 188 19tl9 1910 1991 1992 1 1994
"71AL SEltL OmNT (WT) 1761.7 89.o 11i2.8 1484.7 1898.6 SW.7 129.1 1164.2
ln-Term .bt 16t7.2 189.6 1i .8 $484.7 186.8 187.7 249.1 1U1.2Public a Publicly Guaranteed U97.4 1886.4 1462.2 1427.0 1862.2 1822.4 124.1 114.2Privat l ranteed 69.6 W8.2 40.0 27.1 14.6 8.2 1 0
use of l Credit 8.b 0 0 0 0 0 0 0sorS TOM eDt 89 0 0 0 0 0 0 0
FULC A PUBUCLY @MRANTEND LONOT-7 DOT
Det Oatatadinn A U£disburaed 1948.1 1700.8 1668.4 149 1450.4 18i8.1 127.8 1177.4Officitl Craditore 1887.8 11.8 l108.6 1 18.9 1428.9 187.2 1249.8 1188.2
ulXtinlteral 90.9 917.8 886.4 792.8 79.1 6.8 60.2 84.93ID 288.2 22S.9 218.1 199.7 186.8 178.8 16.8 188M6IDA 24.8 24.8 28.9 23.8 28 22.5 92 21.8
eilateral 686.6 704.2 782.4 728.7 64f.6 670.4 648.1 618.4Private Creditors 110.6 t ".8 8. 8S.1 29.8 28.9 22.6 12.2
SuppIIore 0 0 0 0 0 0 0 0Pinmaial fbrkt 110.6 79.8 Wt.6 88.1 29.8 28.9 22.6 19.2
Debt Outetending A Disburaad 197.4 188.4 1462.2 1427.6 1862.2 12.4 1246.1 1184.2Official Crditor 1s1.9 1478.7 1486.8 1401. 18A7.1 .97.4 8.6 1148multilateral 788.8 742.2 722.2 697.1 86e 680.8 864.2 S82.8
we 166.8 161 161.6 162.8 162.2 1.8 148.9 180.6IDA 24.8 94.8 28.9 28.8 28 22.8 22 21.5
I8laera 768. 7sa.8 714.8 704.8 689. 1 6S6.S 641.8 812.0Private Credito 60.5 62.7 45.7 28.9 28.1 24.6 22.6 19.2supplier. 0 0 0 0 0 0 0 0Financial Market 80.8 62.7 45.7 28.9 28.1 24.8 22.6 19.2
Di.buraarsspate 119.9 68.8 69.2 61.8 48.2 82.6 10.9 10.0Official Creditor. 19.9 87.8 68.8 as 48.8 29.8 18.8 10.8Multilateral 84.8 81.8 40.9 89.1 84 28.1 14 9.4
1m8 8.4 6.6 18.8 14.5 12.8 9.8 4.8 2.6IDA 0 0 0 0 0 0 0 0
Bisteral 68.6 28.8 22.6 18.9 11.8 4.1 1.8 1.1Private Creditors 0 11.2 8.7 8.6 2.7 8.8 1.1 0Suppliers 0 0 0 0 0 0 0 0Financil Markets 0 11.2 8.7 8.8 2.7 8.8 1.1 0
Principal Repaywnts 108.7 118.1 12.4 116.4 98.6 92.8 91.8 94.4Official Creditors 76.8 P.1 102.7 92.6 90.1 88.7 87.9 91Multilateral 85.8 42.4 60.9 64.1 68.2 62.4 60.6 ".6
IO 8.1 12.8 12.8 18.4 18.2 18 17.1 17.7IDA 0.8 0.4 0.4 0.4 0.8 0.8 0.8 0.8
Bilteral 40.7 48.6 41.8 28.7 28.9 28.4 27.8 29.7Private Crditor. 29.2 29 22.7 28.6 8.6 8.6 8.4 8.4Suppliers 0 0 0 0 0 0 0 0Financial Market 29.2 29 22.7 28.6 8.6 8.6 8.4 8.4
Ma Flca 14.2 -48.6 -6.2 -84.6 -4.4 -9.7 -74.8 -6.9Officatl Creditors 48.4 -2.8 -8.2 -84.9 -44.6 -89. -72.1 -so.Multilateral -1.8 -10.6 -20.1 -28.1 -29.1 -87.2 -4.s -81.9
38W -4.7 -8.6 0.6 1.2 -0.6 -8.7 -12.6 -18.1IDA -0.8 -0.4 -0.4 -0.4 -0.8 -0.8 -0.8 -0.8
ei lateral 44.9 -18.2 -19.2 -9.8 -18.4 -22.2 -28.5 -8.6Private _reditoa -29.2 -17.8 -1l.9 -19.8 -0.8 -0.8 -2.8 -8.4
Suppier 0 0 0 0 0 0 0 aFinancial markets -29.2 -17.8 -1S.9 -19.0 -0.8 -0.8 -2.8 -8.4
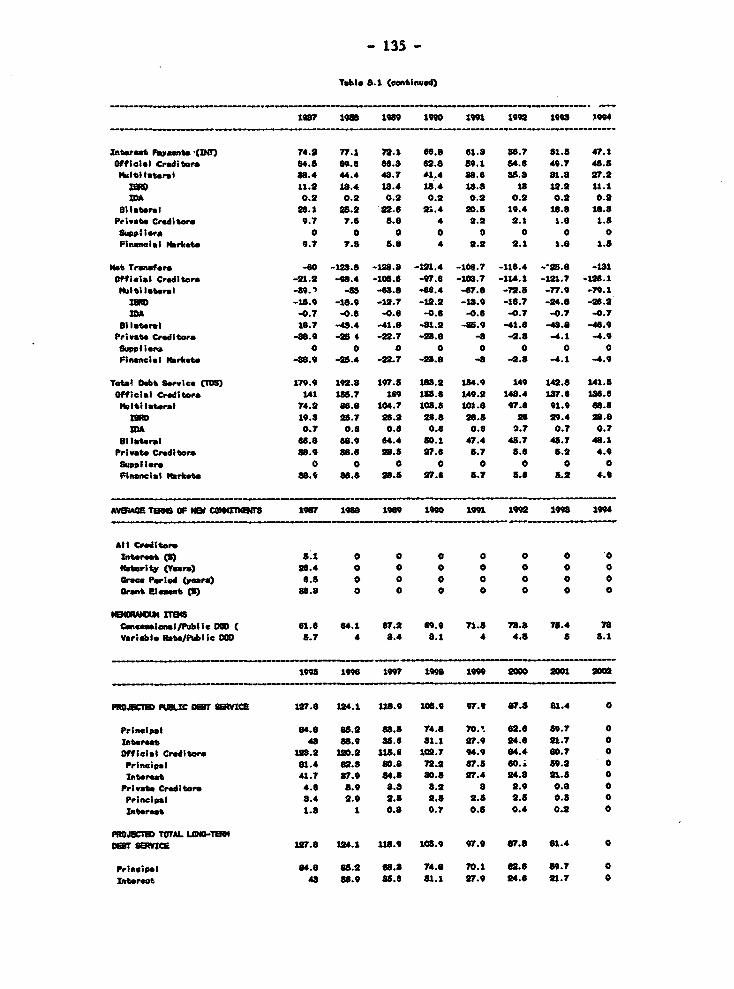
- 135 -
Table 8.1 (coniwued
198 1 198 19O9 199 1992 1998 p904
Iatere0t Puyinnte (M) 74.2 77.1 72.1 64.6 61.8 88.7 81.8 47.1Officlel Creditor. 84.8 69.6 618.8 62.8 89.1 s4.6 48.7 48.8
WC ltarel 88.4 44.4 48.7 61.4 88.6 88.8 81.8 27.2we 11.2 18.4 8.4 1.4 18s.8 18 22.2 1.1
MA 0.2 0.2 0.2 0.2 0.2 0.2 0.2 0.2ilaterel 28.1 28.2 X!.8 21.4 20.8 10.4 18.8 18.8
Private C"dtoe 9.7 7.8 8.8 4 2.2 2.1 1.8 1.5SupeI i "a 0 0 0 0 0 0 0 0Fi*mis; fl.kets 9.7 7.5 a.8 4 2.2 2.1 1.0 1.8
Ne Tranaf.u. .60 -128.8 -128.8 -121.4 -106.7 -116.4 -'25.B -131
Offcial Cr.dltor. -21.2 -96.4 -108.6 -97.8 -106.7 -114.1 -121.7 -12.114lsi1atero1 -8. I -5 -63.s .68.4 -67.8 -72.8 -77.9 -79.1
Dm -15.9 -13.9 -12.7 -12.2 -13.0 -18.7 -24.6 -2.2IDA -0.7 -0.6 -0.0 -0.8 -0.8 -0.7 -0.7 -0.7
Si laurel 18.7 -48.4 -41.8 -31.2 -1.9 -41.8 -4.8 -418.9Private Creditw. l -s8.9 -2 4 2.7 -A8.8 -8 -2.3 -4,1 -4.9Suppliers 0 0 0 a 0 a 0 0Financlal ftrkUt. -88.9 -2.4 -M2.7 -2a.6 -8 -2.8 -4.1 -4.9
talu Cbt Service CMS) 179.9 192.8 197.5 1*.2 1*4.0 149 142.6 141.8Officlal Creditor 141 15.7 189 1.. 140.2 14.4 17.6 1*6.6
tlti lateral 74.2 88.0 104.7 106.8 10.8 97.8 91.9 88.81IIIND 19.3 28.7 28.2 23.8 2S.8 28 29.4 28.8IDA 0.7 0.6 0.6 0.8 o.6 0.7 0.? 0.7
ellaterl 66.8 68.9 64.4 80.1 47.4 48.7 48.7 48.1Private Cditora 88.9 88.6 2.s 27.8 5.7 8.8 5.2 4.9
Spplier 0 0 0 0 0 0 0 0Financial fNrket 88.9 88.6 2a.5 27.8 &. 5.8 5.2 4.0
AVOAE T1 OF NM COMaT8 l97 1o93 1989 190 1991 1992 1998 1994
All CrditworInt4reet 8 .1 0 0 0 0 0 0 0Netorit (Years) 2B.4 0 0 0 0 0 0 0are" Period (Years) G.$ 0 0 0 0 0 0 0
runt Element() 8s.3 0 0 0 0 0 0 0
Cmnce_aaio/Public VWD C 81.8 84.1 67.2 69.9 n.5 73.3 78.4 78Veriabl* Rate/Public DOD 8.7 4 8.4 8.1 4 4.8 B 5.1
1998 1996 1997 198 199 2000 20 2x0
FROJIND PU OM SWC= 127.6 124.1 113.9 10.9 97.9 87.8 1.4 0
Principal 64.8 a8.2 88.8 74.8 70.. 62.6 89.7 0Interest 43 8.9 88.s6 81.1 27.9 24.6 21.7 0Official Crditoer 128.2 120.2 11.6 102.7 94.9 84.4 80.7 0
Principal 81.4 82.8 00.8 72.2 67.5 60.i 89.2 0interest 41.7 87.9 84.8 80.3 27.4 24.8 21.5 a
Private Crditor 4.6 8.9 8.8 8.2 a 2.9 0.6 0Principal 8.4 2.9 2.8 2.8 2.8 2.8 0.5 0Interet 1.8 1 0.8 0.7 0.8 0.4 0.2 0
PROJS0I TOTAL LOM-TER14ODM SaIcw W7.$ 124.1 118.9 108.9 97.9 67.8 81.4 0
Principal 84.8 88.2 88.8 74.0 70.1 62.8 so.7 0Interet 48 88.9 3a.6 81.1 27.9 24.8 21.7 0