El Paso County Births and Deaths 20 · El Paso County Births and Deaths 2015 ... 30+ 3,670 38.9 Low...
16
El Paso County Births and Deaths 2015 Selected birth characteristics: County residents, 2015............................................. 2 Selected birth characteristics by age group of mother: County residents, 2015.... 3 Selected birth characteristics by race/ethnicity of mother: County residents, 2015 ................................................................................................ 4 Live births and fertility rates by age group of mother: County residents, 2015...... 6 Vital statistics summary: County residents, 2005, 2011-2015................................... 7 Deaths from selected causes by race/ethnicity: County residents, 2015 ............... 11 Deaths and age-specific death rates from selected causes: County residents, 2015................................................................................................ 10 Deaths and age-specific death rates: County residents, 2015 ................................ 13 Deaths, crude death rates and age-adjusted death rates from selected causes: County residents, 2015.................................................................................................. 9 Notes Regarding Colorado Revised Certificate of Live Birth ................................... 14 For more information about these tables, please contact the Vital Statistics Program at the Colorado Department of Public Health and Environment by telephone at (303) 692-2160 or by email at cdphe.health[email protected]. Notes Regarding Colorado Area-Based Poverty Estimates ..................................... 15 Selected birth characteristics by area-based poverty status of mother's residence: County residents,2015 ................................................................................................. 5 Deaths from selected causes by area-based poverty status of decedent's residence: County residents, 2015 ............................................................................ 12
Transcript of El Paso County Births and Deaths 20 · El Paso County Births and Deaths 2015 ... 30+ 3,670 38.9 Low...

El Paso County Births and Deaths 2015
Selected birth characteristics: County residents, 2015............................................. 2
Selected birth characteristics by age group of mother: County residents, 2015.... 3
Selected birth characteristics by race/ethnicity of mother: County residents, 2015 ................................................................................................ 4
Live births and fertility rates by age group of mother: County residents, 2015...... 6
Vital statistics summary: County residents, 2005, 2011-2015................................... 7
Deaths from selected causes by race/ethnicity: County residents, 2015 ............... 11
Deaths and age-specific death rates from selected causes: County residents, 2015................................................................................................ 10
Deaths and age-specific death rates: County residents, 2015 ................................ 13
Deaths, crude death rates and age-adjusted death rates from selected causes: County residents, 2015.................................................................................................. 9
Notes Regarding Colorado Revised Certificate of Live Birth ................................... 14
For more information about these tables, please contact the Vital Statistics Program at the Colorado Department of Public Health and Environment by telephone at (303) 692-2160 or by email at [email protected].
Notes Regarding Colorado Area-Based Poverty Estimates ..................................... 15
Selected birth characteristics by area-based poverty status of mother's residence:County residents,2015 ................................................................................................. 5
Deaths from selected causes by area-based poverty status of decedent's residence: County residents, 2015 ............................................................................ 12

Source: Vital Statistics Program, Colorado Department of Public Health and Environment.
Percentages are of total births, excluding cases with specific characteristics unknown.Sums may not add to total due to cases with age of mother unknown.* indicates one or two events in the category.
"Education of Mother," "Births to Unmarried Women," and "Smoking During Pregnancy" are among items collected startingin 2007, using the revised birth certificate, that are not directly comparable to data collected before 2007. See "NotesRegarding Colorado Revised Certificate of Live Birth" at end of report for details.
Selected birth characteristics: El Paso County residents, 2015
Characteristic Number Percent
Total Live Births 9,449 100.0
Age of Mother 9999999 9999999
10-17 97 1.0
18-19 361 3.8
20-29 5,313 56.3
30+ 3,670 38.9
Low Weight Births (<2,500 Grams) 943 10.0
Very Low Weight Births (<1,500 Grams) 124 1.3
Prenatal Care Later than 1st Trimester/No Care 1,613 18.0
No Prenatal Care 71 0.8
Preterm Births (<37 Weeks) 933 9.9
Education of Mother <High School Diploma/GED 794 8.4
Live Births to Unmarried Women 2,134 22.6
Smoking During Pregnancy 565 6.0

Source: Vital Statistics Program, Colorado Department of Public Health and Environment.
Percentage not computed for cells shaded in light gray.Percentages are of total births, excluding cases with specific characteristics unknown.Sums may not add to total due to cases with age of mother unknown.* indicates one or two events in the category.
"Education of Mother," "Births to Unmarried Women," and "Smoking During Pregnancy" are among items collected startingin 2007, using the revised birth certificate, that are not directly comparable to data collected before 2007. See "NotesRegarding Colorado Revised Certificate of Live Birth" at end of report for details.
Selected birth characteristics by age group of mother: El Paso County residents, 2015
CharacteristicAll Ages 10-17 18-19 20-29 30+
Number Percent Number Percent Number Percent Number Percent Number Percent
Total Live Births 9,449 100.0 97 100.0 361 100.0 5,313 100.0 3,670 100.0
Race/Ethnicity of Mother 1E7 9999999 1E7 9999999 1E7 9999999 1E7 9999999 1E7 9999999
White, Non-Hispanic 6,228 66.2 37 38.1 183 51.1 3,364 63.5 2,641 72.2
White, Hispanic 1,473 15.6 31 32.0 88 24.6 919 17.4 431 11.8
Black 848 9.0 18 18.6 45 12.6 542 10.2 243 6.6
Asian American/PacificIslander 414 4.4 * * 10 2.8 200 3.8 202 5.5
American Indian/NativeAlaskan 87 0.9 * * 3 0.8 54 1.0 29 0.8
Other 363 3.9 8 8.2 29 8.1 216 4.1 110 3.0
Unknown 36 8888888 0 0.0 3 8888888 18 8888888 14 8888888
Low Weight Births (<2,500Grams) 943 10.0 13 13.4 52 14.4 502 9.5 376 10.2
Very Low Weight Births(<1,500 Grams) 124 1.3 0 0.0 8 2.2 56 1.1 60 1.6
Prenatal Care Later than 1stTrimester/No Care 1,613 18.0 32 34.8 98 28.2 989 19.7 493 14.2
No Prenatal Care 71 0.8 * * 4 1.2 46 0.9 19 0.5
Preterm Births (<37 Weeks) 933 9.9 6 6.2 44 12.2 500 9.4 383 10.4
Education of Mother <HighSchool Diploma/GED 794 8.4 82 87.2 117 32.4 379 7.2 215 5.9
Live Births to UnmarriedWomen 2,134 22.6 92 94.8 215 59.6 1,327 25.0 499 13.6
Smoking During Pregnancy 565 6.0 7 7.2 27 7.5 357 6.7 174 4.7

Source: Vital Statistics Program, Colorado Department of Public Health and Environment.
Percentages are of total births, excluding cases with specific characteristics unknown.Sums may not add to total due to cases with age or race/ethnicity of mother unknown.* indicates one or two events in the category.
"Education of Mother," "Births to Unmarried Women," and "Smoking During Pregnancy" are among items collected startingin 2007, using the revised birth certificate, that are not directly comparable to data collected before 2007. See "NotesRegarding Colorado Revised Certificate of Live Birth" at end of report for details.
Selected birth characteristics by race/ethnicity of mother: El Paso County residents, 2015
CharacteristicWhite
Non-Hispanic White Hispanic Black
AsianAmerican/Pacific
Islander
AmericanIndian/Native
Alaskan
Number Percent Number Percent Number Percent Number Percent Number Percent
Total Live Births 6,228 100.0 1,473 100.0 848 100.0 414 100.0 87 100.0
Age of Mother 1E7 9999999 1E7 9999999 1E7 9999999 1E7 9999999 1E7 9999999
10-17 37 0.6 31 2.1 18 2.1 * * * *
18-19 183 2.9 88 6.0 45 5.3 10 2.4 3 3.4
20-29 3,364 54.0 919 62.4 542 63.9 200 48.3 54 62.1
30+ 2,641 42.4 431 29.3 243 28.7 202 48.8 29 33.3
Low Weight Births (<2,500Grams) 584 9.4 141 9.6 127 15.0 47 11.4 4 4.6
Very Low Weight Births(<1,500 Grams) 66 1.1 25 1.7 22 2.6 5 1.2 0 0.0
Prenatal Care Later than 1stTrimester/No Care 943 16.1 280 19.9 191 23.5 68 17.3 25 29.1
No Prenatal Care 40 0.7 16 1.1 8 1.0 3 0.8 0 0.0
Preterm Births (<37 Weeks) 586 9.4 145 9.8 100 11.8 47 11.4 12 13.8
Education of Mother <HighSchool Diploma/GED 292 4.7 252 17.2 84 9.9 20 4.9 6 6.9
Live Births to UnmarriedWomen 1,077 17.3 469 31.8 366 43.2 62 15.0 25 28.7
Smoking During Pregnancy 389 6.2 73 5.0 73 8.6 15 3.6 5 5.7

Source: Vital Statistics Program, Colorado Department of Public Health and Environment.
Percentage not computed for cells shaded in light gray.Percentages are of total births, excluding cases with specific characteristics unknown.Sums may not add to total due to cases with age of mother unknown.* indicates one or two events in the category.
"Education of Mother," "Births to Unmarried Women," and "Smoking During Pregnancy" are among items collected startingin 2007, using the revised birth certificate, that are not directly comparable to data collected before 2007. See "NotesRegarding Colorado Revised Certificate of Live Birth" at end of report for details.
Census tracts of maternal residence were determined by linking the maternal residence address at the time of infant birth toits respective census tract as defined by the 2010 U.S. census-designated boundaries. See "Notes Regarding ColoradoArea-Based Poverty Estimates" at end of report for details.
Area-based poverty status represents the percentage of population in the census tract of maternal residence living at orbelow the federal poverty level, based on the 2014 5-Year American Community Survey.
Selected birth characteristics by area-based poverty status of mother's residence: El PasoCounty residents, 2015
Characteristic<10% 10-19.9% 20-29.9% 30%+ Unknown
Number Percent Number Percent Number Percent Number Percent Number Percent
Total Live Births 4,033 100.0 3,100 100.0 1,263 100.0 703 100.0 350 100.0
Race/Ethnicity of Mother 1E7 9999999 1E7 9999999 1E7 9999999 1E7 9999999 1E7 9999999
White, Non-Hispanic 2,989 74.3 2,059 66.7 642 51.1 302 43.1 236 67.8
White, Hispanic 486 12.1 481 15.6 279 22.2 182 26.0 45 12.9
Black 249 6.2 263 8.5 185 14.7 113 16.1 38 10.9
Asian American/PacificIslander 202 5.0 117 3.8 48 3.8 29 4.1 18 5.2
American Indian/NativeAlaskan 25 0.6 36 1.2 18 1.4 5 0.7 3 0.9
Other 71 1.8 129 4.2 85 6.8 70 10.0 8 2.3
Unknown 11 8888888 15 8888888 6 8888888 * * * *
Low Weight Births (<2,500Grams) 359 8.9 303 9.8 160 12.7 81 11.5 40 11.4
Very Low Weight Births(<1,500 Grams) 44 1.1 48 1.5 16 1.3 10 1.4 6 1.7
Prenatal Care Later than 1stTrimester/No Care 543 14.3 578 19.7 264 21.9 172 25.4 56 16.6
No Prenatal Care 10 0.3 28 1.0 13 1.1 17 2.5 3 0.9
Preterm Births (<37 Weeks) 364 9.0 317 10.2 141 11.2 67 9.5 44 12.6
Education of Mother <HighSchool Diploma/GED 148 3.7 273 8.8 218 17.3 143 20.4 12 3.4
Live Births to UnmarriedWomen 673 16.7 693 22.4 465 36.8 265 37.7 38 10.9
Smoking During Pregnancy 128 3.2 211 6.8 135 10.7 78 11.1 13 3.7
Source: Vital Statistics Program, Colorado Department of Public Health and Environment.
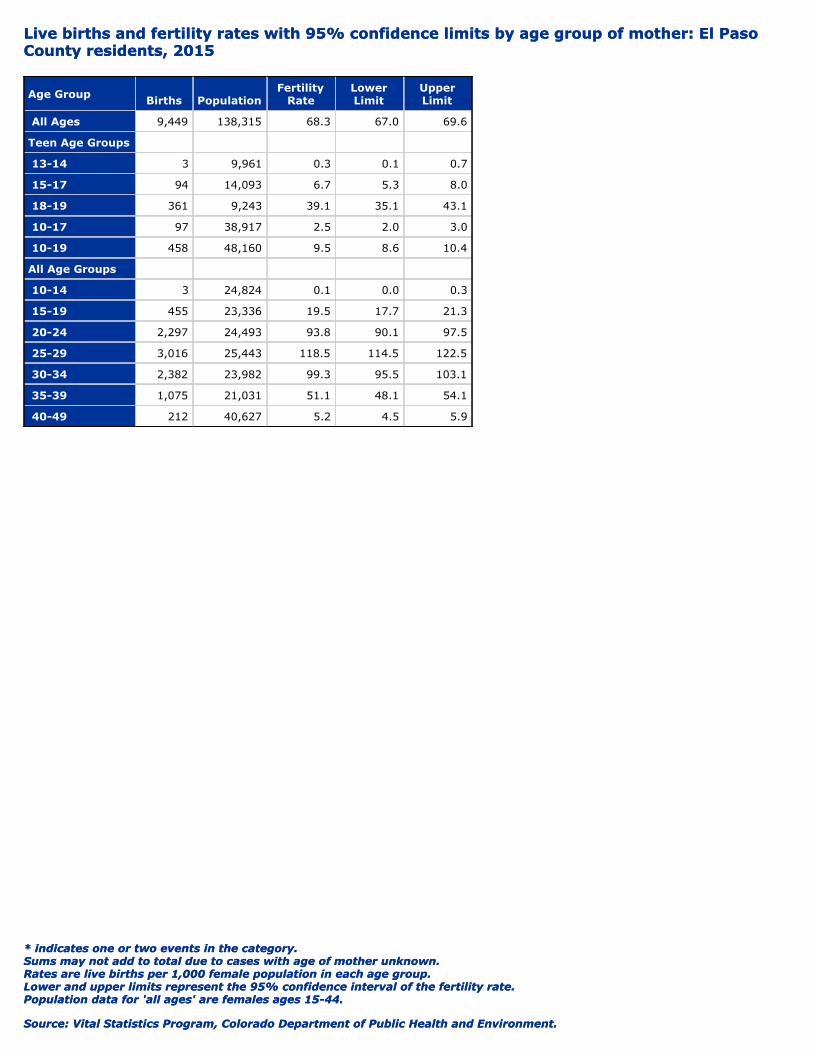
Population data for 'all ages' are females ages 15-44.Lower and upper limits represent the 95% confidence interval of the fertility rate.Rates are live births per 1,000 female population in each age group.Sums may not add to total due to cases with age of mother unknown.* indicates one or two events in the category.
Live births and fertility rates with 95% confidence limits by age group of mother: El PasoCounty residents, 2015
Source: Vital Statistics Program, Colorado Department of Public Health and Environment.
Population data for 'all ages' are females ages 15-44.Lower and upper limits represent the 95% confidence interval of the fertility rate.Rates are live births per 1,000 female population in each age group.Sums may not add to total due to cases with age of mother unknown.* indicates one or two events in the category.
Live births and fertility rates with 95% confidence limits by age group of mother: El PasoCounty residents, 2015
Age Group Births PopulationFertility
RateLowerLimit
UpperLimit
All Ages 9,449 138,315 68.3 67.0 69.6
Teen Age Groups 9999999 9,999,999 9999999.0 9999999.0 9999999.0
13-14 3 9,961 0.3 0.1 0.7
15-17 94 14,093 6.7 5.3 8.0
18-19 361 9,243 39.1 35.1 43.1
10-17 97 38,917 2.5 2.0 3.0
10-19 458 48,160 9.5 8.6 10.4
All Age Groups 9999999 9,999,999 9999999.0 9999999.0 9999999.0
10-14 3 24,824 0.1 0.0 0.3
15-19 455 23,336 19.5 17.7 21.3
20-24 2,297 24,493 93.8 90.1 97.5
25-29 3,016 25,443 118.5 114.5 122.5
30-34 2,382 23,982 99.3 95.5 103.1
35-39 1,075 21,031 51.1 48.1 54.1
40-49 212 40,627 5.2 4.5 5.9

Source: Vital Statistics Program, Colorado Department of Public Health and Environment.
Age-adjusted rates are adjusted to the 2000 U.S. population using the direct method applied to 10-year age groups.Infant and neonatal mortality rates are per 1,000 live births. Other death rates are per 100,000 population.Fertility rates for mothers ages 10-17 are births per 1,000 females of this age group.Birth rates are per 1,000 total population. General fertility rates are births per 1,000 females ages 15-44.* indicates one or two events in the category.
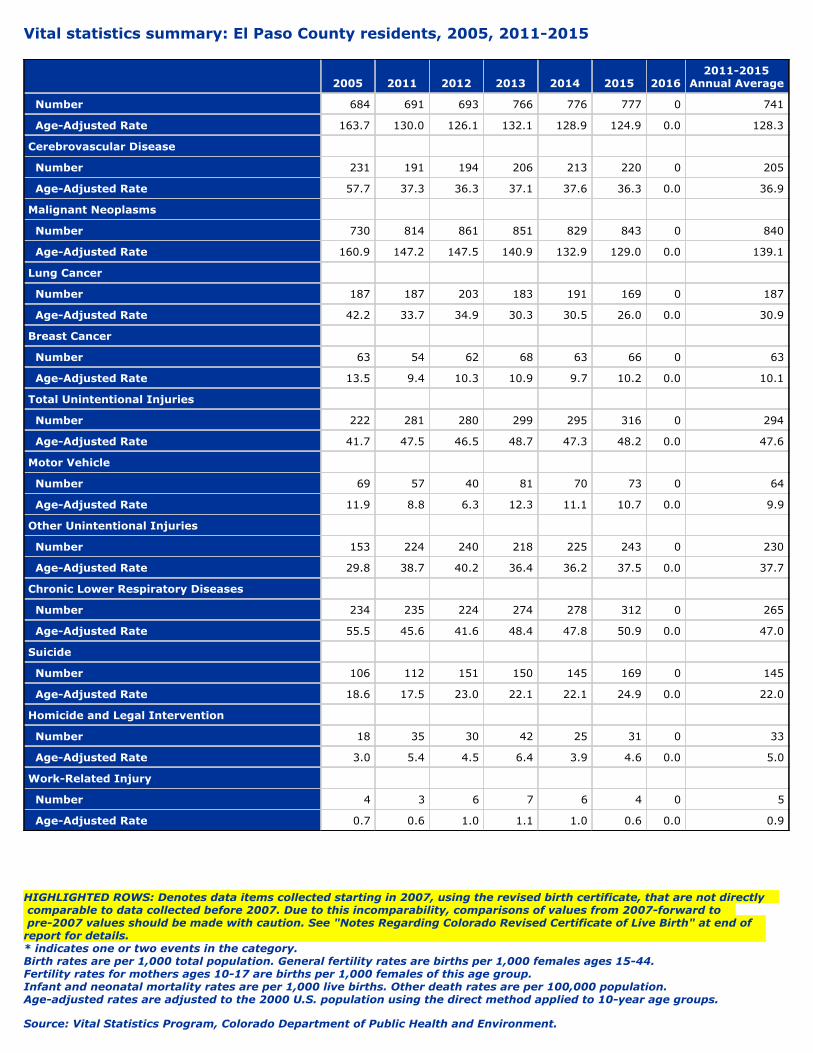
pre-2007 values should be made with caution. See "Notes Regarding Colorado Revised Certificate of Live Birth" at end ofreport for details.
comparable to data collected before 2007. Due to this incomparability, comparisons of values from 2007-forward toHIGHLIGHTED ROWS: Denotes data items collected starting in 2007, using the revised birth certificate, that are not directly
Vital statistics summary: El Paso County residents, 2005, 2011-2015
Source: Vital Statistics Program, Colorado Department of Public Health and Environment.
Age-adjusted rates are adjusted to the 2000 U.S. population using the direct method applied to 10-year age groups.Infant and neonatal mortality rates are per 1,000 live births. Other death rates are per 100,000 population.Fertility rates for mothers ages 10-17 are births per 1,000 females of this age group.Birth rates are per 1,000 total population. General fertility rates are births per 1,000 females ages 15-44.* indicates one or two events in the category.
pre-2007 values should be made with caution. See "Notes Regarding Colorado Revised Certificate of Live Birth" at end ofreport for details.
comparable to data collected before 2007. Due to this incomparability, comparisons of values from 2007-forward toHIGHLIGHTED ROWS: Denotes data items collected starting in 2007, using the revised birth certificate, that are not directly
Vital statistics summary: El Paso County residents, 2005, 2011-2015
2005 2011 2012 2013 2014 2015 20162011-2015
Annual Average
Total Population 569,322 638,619 647,758 657,413 665,792 677,022 * 657,321
Total Births * * * * * * * *
Number 8,658 9,148 9,125 9,134 9,375 9,449 0 9,246
Birth Rate 15.2 14.3 14.1 13.9 14.1 14.0 0.0 14.1
General Fertility Rate 70.4 69.8 68.9 68.1 69.1 68.3 0.0 68.8
Age of Mother 10-17 * * * * * * * *
Number 220 160 146 140 123 97 0 133
Percent of Total Births 2.5 1.7 1.6 1.5 1.3 1.0 0.0 1.4
Fertility Rate 6.6 4.4 4.0 3.7 3.2 2.5 0.0 3.6
Low Weight Births (<2,500 Grams) * * * * * * * *
Number 866 883 881 892 846 943 0 889
Percent 10.0 9.7 9.7 9.8 9.0 10.0 0.0 9.6
Prenatal Care Later Than 1st Trimester/NoCare * * * * * * * *
Number 2,239 1,762 1,636 1,669 1,844 1,613 0 1,705
Percent 25.9 19.7 18.4 19.0 20.5 18.0 0.0 19.1
Births to Unmarried Women * * * * * * * *
Number 2,312 2,201 2,119 2,075 2,167 2,134 0 2,139
Percent 26.7 24.1 23.2 22.7 23.1 22.6 0.0 23.1
Mother's Education <12 Years * * * * * * * *
Number 1,217 1,045 924 837 853 794 0 891
Percent 14.2 11.5 10.2 9.2 9.1 8.4 0.0 9.7
Infant Deaths * * * * * * * *
Number 64 61 48 46 42 48 0 49
Rate 7.4 6.7 5.3 5.0 4.5 5.1 0.0 5.3
Neonatal Deaths * * * * * * * *
Number 39 38 29 27 33 33 0 32
Rate 4.5 4.2 3.2 3.0 3.5 3.5 0.0 3.5
Total Deaths * * * * * * * *
Number 3,435 3,770 3,780 4,072 4,057 4,213 0 3,978
Crude Rate 603.3 590.3 583.6 619.4 609.3 622.3 0.0 605.2
Age-Adjusted Rate 787.6 694.1 667.8 694.6 669.7 671.0 0.0 678.9
Cardiovascular Disease * * * * * * * *
Number 990 964 963 1,055 1,055 1,083 0 1,024
Age-Adjusted Rate 240.2 182.8 176.3 184.1 177.3 175.1 0.0 179.0
Heart Disease * * * * * * * *
(Continued)
Source: Vital Statistics Program, Colorado Department of Public Health and Environment.
Age-adjusted rates are adjusted to the 2000 U.S. population using the direct method applied to 10-year age groups.Infant and neonatal mortality rates are per 1,000 live births. Other death rates are per 100,000 population.Fertility rates for mothers ages 10-17 are births per 1,000 females of this age group.Birth rates are per 1,000 total population. General fertility rates are births per 1,000 females ages 15-44.* indicates one or two events in the category.
pre-2007 values should be made with caution. See "Notes Regarding Colorado Revised Certificate of Live Birth" at end ofreport for details.
comparable to data collected before 2007. Due to this incomparability, comparisons of values from 2007-forward toHIGHLIGHTED ROWS: Denotes data items collected starting in 2007, using the revised birth certificate, that are not directly
Vital statistics summary: El Paso County residents, 2005, 2011-2015
2005 2011 2012 2013 2014 2015 20162011-2015
Annual Average
Number 684 691 693 766 776 777 0 741
Age-Adjusted Rate 163.7 130.0 126.1 132.1 128.9 124.9 0.0 128.3
Cerebrovascular Disease * * * * * * * *
Number 231 191 194 206 213 220 0 205
Age-Adjusted Rate 57.7 37.3 36.3 37.1 37.6 36.3 0.0 36.9
Malignant Neoplasms * * * * * * * *
Number 730 814 861 851 829 843 0 840
Age-Adjusted Rate 160.9 147.2 147.5 140.9 132.9 129.0 0.0 139.1
Lung Cancer * * * * * * * *
Number 187 187 203 183 191 169 0 187
Age-Adjusted Rate 42.2 33.7 34.9 30.3 30.5 26.0 0.0 30.9
Breast Cancer * * * * * * * *
Number 63 54 62 68 63 66 0 63
Age-Adjusted Rate 13.5 9.4 10.3 10.9 9.7 10.2 0.0 10.1
Total Unintentional Injuries * * * * * * * *
Number 222 281 280 299 295 316 0 294
Age-Adjusted Rate 41.7 47.5 46.5 48.7 47.3 48.2 0.0 47.6
Motor Vehicle * * * * * * * *
Number 69 57 40 81 70 73 0 64
Age-Adjusted Rate 11.9 8.8 6.3 12.3 11.1 10.7 0.0 9.9
Other Unintentional Injuries * * * * * * * *
Number 153 224 240 218 225 243 0 230
Age-Adjusted Rate 29.8 38.7 40.2 36.4 36.2 37.5 0.0 37.7
Chronic Lower Respiratory Diseases * * * * * * * *
Number 234 235 224 274 278 312 0 265
Age-Adjusted Rate 55.5 45.6 41.6 48.4 47.8 50.9 0.0 47.0
Suicide * * * * * * * *
Number 106 112 151 150 145 169 0 145
Age-Adjusted Rate 18.6 17.5 23.0 22.1 22.1 24.9 0.0 22.0
Homicide and Legal Intervention * * * * * * * *
Number 18 35 30 42 25 31 0 33
Age-Adjusted Rate 3.0 5.4 4.5 6.4 3.9 4.6 0.0 5.0
Work-Related Injury * * * * * * * *
Number 4 3 6 7 6 4 0 5
Age-Adjusted Rate 0.7 0.6 1.0 1.1 1.0 0.6 0.0 0.9

Source: Vital Statistics Program, Colorado Department of Public Health and Environment.
Lower and upper limits represent the 95% confidence interval of the age-adjusted rate.Age-adjusted rates provide a better basis for comparison among different geographical areas or time periods.Age-adjusted rates are adjusted to the 2000 U.S. standard population using the direct method applied to 10-year age groups.Crude death rates are calculated without age-adjustment.Rates are deaths per 100,000 population.* indicates one or two events in the category.
Deaths, crude death rates and age-adjusted death rates with 95% confidence limits fromselected causes:El Paso County residents, 2015
Cause of Death N Crude RateAge-Adjusted
RateLowerLimit
UpperLimit
All Causes 4,213 622.3 671.0 650.9 691.0
Cardiovascular Disease 1,083 160.0 175.1 164.6 185.6
Heart Disease 777 114.8 124.9 116.0 133.7
Cerebrovascular Disease 220 32.5 36.3 31.5 41.2
Atherosclerosis 5 0.7 0.8 0.3 1.6
Malignant Neoplasms 843 124.5 129.0 120.1 137.8
Lung Cancer 169 25.0 26.0 22.0 30.0
Breast Cancer 66 9.7 10.2 7.7 12.7
Chronic Lower Respiratory Diseases 312 46.1 50.9 45.2 56.6
Unintentional Injuries 316 46.7 48.2 42.8 53.6
Motor Vehicle 73 10.8 10.7 8.2 13.1
Other Unintentional Injuries 240 35.4 37.1 32.3 41.8
Pneumonia and Influenza 60 8.9 9.8 7.3 12.3
Suicide 169 25.0 24.9 21.1 28.8
Diabetes Mellitus 125 18.5 20.0 16.4 23.6
HIV Infection 4 0.6 0.6 0.2 1.3
Chronic Liver Disease and Cirrhosis 95 14.0 13.0 10.4 15.7
Alzheimer's Disease 163 24.1 29.0 24.5 33.4
Nephritis, Nephrosis, Nephrotic Syndrome 40 5.9 6.4 4.4 8.4
Homicide and Legal Intervention 31 4.6 4.6 3.0 6.3
Septicemia 42 6.2 6.8 4.7 8.8
Congenital Anomalies 18 2.7 2.5 1.4 3.7
Perinatal Period Conditions 27 4.0 3.9 2.4 5.4
All Other 885 130.7 146.2 136.6 155.9
9999999 9999999.0 9999999.0 9999999.0 9999999.0
Injury by Firearm 106 15.7 15.9 12.8 19.0
Drug-Induced Deaths 146 21.6 21.8 18.2 25.4
Alcohol-Induced Deaths 112 16.5 16.1 13.0 19.1
Work-Related Injury (Y/N Check Death Certificate) 4 0.6 0.6 0.1 1.5

Source: Vital Statistics Program, Colorado Department of Public Health and Environment.
Other rates are deaths per 1,000 population of the age group.Infant (<1 year) mortality rates are per 1,000 live births.* indicates one or two events in the category.
Deaths and age-specific death rates from selected causes: El Paso County residents, 2015
Cause of Death <1 1-14 15-24 25-44 45-64 65+
N Rate N Rate N Rate N Rate N Rate N Rate
All Causes 48 5.1 26 0.2 85 0.8 289 1.6 891 5.3 2,874 35.8
Cardiovascular Disease * * 0 0.0 * * 27 0.2 207 1.2 847 10.6
Heart Disease * * 0 0.0 * * 23 0.1 161 1.0 591 7.4
Cerebrovascular Disease 0 0.0 0 0.0 0 0.0 * * 31 0.2 187 2.3
Atherosclerosis 0 0.0 0 0.0 0 0.0 0 0.0 * * 4 0.0
Malignant Neoplasms 0 0.0 * * * * 27 0.2 245 1.5 567 7.1
Lung Cancer 0 0.0 0 0.0 0 0.0 * * 44 0.3 124 1.5
Breast Cancer 0 0.0 0 0.0 0 0.0 3 0.0 18 0.1 45 0.6
Chronic Lower Respiratory Diseases 0 0.0 0 0.0 * * * * 40 0.2 270 3.4
Unintentional Injuries 4 0.4 4 0.0 36 0.3 85 0.5 84 0.5 103 1.3
Motor Vehicle 0 0.0 * * 16 0.2 27 0.2 15 0.1 13 0.2
Other Unintentional Injuries 4 0.4 * * 20 0.2 58 0.3 69 0.4 90 1.1
Pneumonia and Influenza 0 0.0 0 0.0 * * * * 10 0.1 47 0.6
Suicide 0 0.0 7 0.1 26 0.2 57 0.3 54 0.3 25 0.3
Diabetes Mellitus 0 0.0 0 0.0 * * 6 0.0 30 0.2 88 1.1
HIV Infection 0 0.0 0 0.0 0 0.0 * * * * * *
Chronic Liver Disease and Cirrhosis 0 0.0 0 0.0 0 0.0 13 0.1 57 0.3 25 0.3
Alzheimer's Disease 0 0.0 0 0.0 0 0.0 0 0.0 * * 162 2.0
Nephritis, Nephrosis, NephroticSyndrome 0 0.0 0 0.0 0 0.0 0 0.0 12 0.1 28 0.3
Homicide and Legal Intervention 0 0.0 * * 6 0.1 17 0.1 5 0.0 * *
Septicemia * * 0 0.0 0 0.0 3 0.0 11 0.1 27 0.3
Congenital Anomalies 9 1.0 * * 0 0.0 * * 6 0.0 * *
Perinatal Period Conditions 26 2.8 * * 0 0.0 0 0.0 0 0.0 0 0.0
All Other 7 0.7 9 0.1 11 0.1 49 0.3 127 0.8 682 8.5
9,999 9999.0 9,999 9999.0 9,999 9999.0 9,999 9999.0 9,999 9999.0 9,999 9999.0
Injury by Firearm 0 0.0 5 0.0 18 0.2 38 0.2 29 0.2 16 0.2
Drug-Induced Deaths 0 0.0 0 0.0 21 0.2 57 0.3 54 0.3 14 0.2
Alcohol-Induced Deaths 0 0.0 0 0.0 * * 27 0.2 62 0.4 22 0.3
Work-Related Injury (Y/N CheckDeath Certificate) 0 0.0 0 0.0 0 0.0 * * * * 0 0.0

Source: Vital Statistics Program, Colorado Department of Public Health and Environment.
Percentages are of total deaths of each race/ethnicity category.* indicates one or two events in the category.
Deaths from selected causes by race/ethnicity: El Paso County residents, 2015
Source: Vital Statistics Program, Colorado Department of Public Health and Environment.
Percentages are of total deaths of each race/ethnicity category.* indicates one or two events in the category.
Deaths from selected causes by race/ethnicity: El Paso County residents, 2015
Cause of Death All RacesWhite
Non-HispanicWhite
Hispanic Black
AsianAmerican/Pacific
Islander
AmericanIndian/Native
Alaskan
N % N % N % N % N % N %
Total 4,213 100.0 3,529 100.0 258 100.0 251 100.0 72 100.0 33 100.0
Cardiovascular Disease 1,083 25.7 913 25.9 51 19.8 76 30.3 24 33.3 4 12.1
Heart Disease 777 18.4 645 18.3 39 15.1 61 24.3 17 23.6 3 9.1
Cerebrovascular Disease 220 5.2 192 5.4 10 3.9 10 4.0 5 6.9 * *
Atherosclerosis 5 0.1 5 0.1 0 0.0 0 0.0 0 0.0 0 0.0
Malignant Neoplasms 843 20.0 730 20.7 43 16.7 38 15.1 11 15.3 8 24.2
Lung Cancer 169 4.0 144 4.1 10 3.9 9 3.6 * * * *
Breast Cancer 66 1.6 58 1.6 * * 4 1.6 * * * *
Chronic Lower Respiratory Disease 312 7.4 279 7.9 10 3.9 14 5.6 3 4.2 * *
Unintentional Injuries 316 7.5 248 7.0 34 13.2 19 7.6 8 11.1 * *
Motor Vehicle 73 1.7 52 1.5 13 5.0 3 1.2 5 6.9 0 0.0
Other Unintentional Injuries 243 5.8 196 5.6 21 8.1 16 6.4 3 4.2 * *
Pneumonia and Influenza 60 1.4 52 1.5 4 1.6 0 0.0 * * 0 0.0
Suicide 169 4.0 139 3.9 11 4.3 10 4.0 * * 4 12.1
Diabetes Mellitus 125 3.0 95 2.7 11 4.3 16 6.4 * * * *
HIV Infection 4 0.1 3 0.1 0 0.0 * * 0 0.0 0 0.0
Chronic Liver Disease andCirrhosis 95 2.3 71 2.0 15 5.8 3 1.2 0 0.0 * *
Alzheimer's Disease 163 3.9 145 4.1 7 2.7 4 1.6 * * * *
Nephritis, Nephrosis, NephroticSyndrome 40 0.9 32 0.9 4 1.6 * * * * 0 0.0
Homicide and Legal Intervention 31 0.7 17 0.5 6 2.3 7 2.8 0 0.0 0 0.0
Septicemia 42 1.0 34 1.0 * * 4 1.6 * * 0 0.0
Congenital Anomalies 18 0.4 13 0.4 * * 3 1.2 0 0.0 0 0.0
Perinatal Period Conditions 27 0.6 14 0.4 7 2.7 4 1.6 * * 0 0.0
All Other 885 21.0 744 21.1 52 20.2 50 19.9 17 23.6 9 27.3
1E7 1E7 1E7 1E7 1E7 1E7 1E7 1E7 1E7 1E7 1E7 1E7
Injury by Firearm 106 2.5 85 2.4 8 3.1 10 4.0 0 0.0 0 0.0
Drug-Induced Deaths 146 3.5 113 3.2 13 5.0 9 3.6 3 4.2 * *
Alcohol-Induced Deaths 112 2.7 89 2.5 15 5.8 5 2.0 0 0.0 * *
Work-Related Injury (Y/N CheckDeath Certificate) 4 0.1 4 0.1 0 0.0 0 0.0 0 0.0 0 0.0

Source: Vital Statistics Program, Colorado Department of Public Health and Environment.
Percentages are of total deaths of each race/ethnicity category.* indicates one or two events in the category.
Census tracts of decedent residence were determined by linking the decedent residence address at the time of death to itsrespective census tract as defined by the 2010 U.S. census-designated boundaries. See "Notes Regarding ColoradoArea-Based Poverty Estimates" at end of report for details.
Area-based poverty status represents the percentage of population in the census tract of decedent's residence living at orbelow the federal poverty level, based on the 2014 5-Year American Community Survey.
Deaths from selected causes by area-based poverty status of decedent's residence: El PasoCounty residents, 2015
Cause of Death<10% 10-19.9% 20-29.9% 30%+ Unknown
N % N % N % N % N %
Total 1,587 100.0 1,604 100.0 634 100.0 247 100.0 141 100.0
Cardiovascular Disease 379 23.9 434 27.1 173 27.3 65 26.3 32 22.7
Heart Disease 247 15.6 332 20.7 128 20.2 48 19.4 22 15.6
Cerebrovascular Disease 93 5.9 77 4.8 35 5.5 9 3.6 6 4.3
Atherosclerosis 3 0.2 * * 0 0.0 0 0.0 * *
Malignant Neoplasms 391 24.6 286 17.8 107 16.9 35 14.2 24 17.0
Lung Cancer 68 4.3 56 3.5 30 4.7 10 4.0 5 3.5
Breast Cancer 31 2.0 23 1.4 8 1.3 * * * *
Chronic Lower Respiratory Disease 97 6.1 126 7.9 58 9.1 22 8.9 9 6.4
Unintentional Injuries 118 7.4 111 6.9 47 7.4 18 7.3 22 15.6
Motor Vehicle 28 1.8 25 1.6 6 0.9 3 1.2 11 7.8
Other Unintentional Injuries 90 5.7 86 5.4 41 6.5 15 6.1 11 7.8
Pneumonia and Influenza 23 1.4 20 1.2 10 1.6 5 2.0 * *
Suicide 73 4.6 58 3.6 16 2.5 12 4.9 10 7.1
Diabetes Mellitus 38 2.4 55 3.4 16 2.5 12 4.9 4 2.8
HIV Infection 0 0.0 3 0.2 * * 0 0.0 0 0.0
Chronic Liver Disease and Cirrhosis 29 1.8 48 3.0 12 1.9 5 2.0 * *
Alzheimer's Disease 67 4.2 64 4.0 20 3.2 5 2.0 7 5.0
Nephritis, Nephrosis, Nephrotic Syndrome 8 0.5 20 1.2 6 0.9 4 1.6 * *
Homicide and Legal Intervention 9 0.6 11 0.7 3 0.5 5 2.0 3 2.1
Septicemia 17 1.1 12 0.7 9 1.4 * * * *
Congenital Anomalies 11 0.7 5 0.3 * * 0 0.0 0 0.0
Perinatal Period Conditions 7 0.4 12 0.7 5 0.8 3 1.2 0 0.0
All Other 320 20.2 339 21.1 149 23.5 54 21.9 23 16.3
1E7 1E7 1E7 1E7 1E7 1E7 1E7 1E7 1E7 1E7
Injury by Firearm 46 2.9 39 2.4 7 1.1 9 3.6 5 3.5
Drug-Induced Deaths 53 3.3 55 3.4 21 3.3 8 3.2 9 6.4
Alcohol-Induced Deaths 40 2.5 48 3.0 10 1.6 11 4.5 3 2.1
Work-Related Injury (Y/N Check Death Certificate) * * * * 0 0.0 * * * *

Source: Vital Statistics Program, Colorado Department of Public Health and Environment.
Population figures for infant and neonatal groups are live births.Infant and neonatal mortality rates are per 1,000 live births. Other death rates are per 1,000 population of the age group.Infant death is death in the first year of life. Neonatal death is death occurring prior to the 28th day of life.* indicates one or two events in the category.
Deaths and age-specific death rates: El Paso County residents, 2015
AgeGroup Deaths Population
Age-SpecificDeath Rate
All Ages 4,213 677,022 6.2
9,999,999 9,999,999 9999999.0
Infant 48 9,449 5.1
Neonatal 33 9,449 3.5
1-4 10 37,813 0.3
5-9 * 47,835 *
10-14 14 48,990 0.3
15-19 30 49,080 0.6
20-24 55 55,773 1.0
25-29 68 49,698 1.4
30-34 70 46,722 1.5
35-39 63 42,358 1.5
40-44 88 40,187 2.2
45-49 102 40,742 2.5
50-54 192 47,212 4.1
55-59 267 44,802 6.0
60-64 330 36,041 9.2
65-69 325 29,104 11.2
70-74 396 19,278 20.5
75-79 440 13,118 33.5
80-84 537 9,528 56.4
85+ 1,176 9,193 127.9
9,999,999 9,999,999 9999999.0
1-14 26 134,638 0.2
15-24 85 104,853 0.8
25-64 1,180 347,762 3.4
65+ 2,874 80,222 35.8

Notes Regarding Colorado’s Revised Certificate of Live Birth These tables contain Colorado birth data that were collected using the 1989 Revision of the U.S. Standard Certificate of Live Birth (unrevised) and the 2003 Revision of the U.S. Standard Certificate of Live Birth (revised)1,2,3. Colorado’s birth registration system used the unrevised certificate for births through calendar year 2006; while births in 2007 through the present were registered using the revised certificate. Among the differences in the revised birth certificate are changes to the following data items:
– Mother’s and father’s race, captures multiple race identification instead of single race identification
– Mother’s and father’s education, captures highest degree attained instead of total years of education
– Mother’s marital status at time of birth, captures never married, married, widowed, separated, and divorced instead of just married or unmarried
– Cigarette smoking before and during pregnancy, captures levels of smoking in each trimester instead of just smoking any time during pregnancy
And the addition of the following data items:
– Method of delivery includes fetal presentation and trial of labor prior to cesarean delivery – Pre-pregnancy weight, weight at delivery and height, used to calculate Body Mass Index – Congenital anomalies, certain conditions have been added or removed – Fertility therapy – Did mother get WIC food for herself during this pregnancy – Infections during pregnancy – Maternal morbidity – Breast feeding – Principal source of payment for the delivery
Data items noted above that were collected using both the unrevised certificate and the revised certificate are not directly comparable. Analyses of birth data for time periods that include both revised and unrevised data should be performed with caution. To facilitate analyses of births by race, the multiple race identification in revised certificates has been bridged back to a single race using a system developed by the National Center for Health Statistics at the Centers for Disease Control and Prevention4. Please note, however, that there has been an increase in the number of births reported with “other” or “unknown” maternal and paternal race and/or Hispanic ethnicity beginning in 2007 compared to previous years. This is likely attributable to the change to the revised certificate. The Health Statistics and Evaluation Branch at the Colorado Department of Public Health and Environment is available to assist with further analyses of these data, as well as to answer questions one might have regarding the revised certificate and the affected data items. For further information or assistance, please contact the Health Statistics and Evaluation Branch at (303) 692-2160 or by e-mail at [email protected]. References: 1 National Center for Health Statistics. 2003 revision of the U.S. Standard Certificate of Live Birth. 2003. Available
from: http://www.cdc. gov/nchs/vital_certs_rev.htm. 2 National Center for Health Statistics. Report of the Panel to Evaluate the U.S. Standard Certificates and Reports.
National Center for Health Statistics. 2000. Available from: http://www.cdc.gov/nchs/data/dvs/ panelreport_acc.pdf.
3 Martin JA, Hamilton BE, Sutton PD, et al. Births: Final data for 2004. National vital statistics reports; vol 55 no 1. Hyattsville, MD: National Center for Health Statistics. 2006.
4 NCHS Procedures for Multiple-Race and Hispanic Origin Data: Collection, Coding, Editing, and Transmitting. Division of Vital Statistics, National Center for Health Statistics, Centers for Disease Control and Prevention, May 7, 2004. Available from: http://www.cdc.gov/nchs/data/dvs/Multiple_race_docu_5-10-04.pdf.

Notes Regarding Colorado’s Area-Based Poverty Estimates Poverty continues to be an important factor that increases the risk of adverse birth outcomes, disease, and mortality across all ages. The relationships between poverty and such outcomes are unsurprising given the socioeconomic differences in health behaviors, familial and other risk factors, access to appropriate prenatal and preventive health care and treatment for illness and disease. Consequently, considering poverty when exploring changes in the health status of Colorado’s communities and the persistence of health disparities by poverty status are increasingly important1,2,3. These summary tables now contain counts and proportions of births and deaths by area-based poverty status of place of residence. Area-based poverty status represents the percentage of the population in the census tract of residence living at or below the federal poverty level. Place of residence is based on the maternal self-reported residence address at the time of an infant’s birth for birth statistics, and the residence address of decedent at the time of death, collected from next of kin, for death statistics. Census tracts of residence are determined by linking these addresses to their respective census tracts as defined by the 2010 U.S. Census-designated boundaries. The percentage of the population in a census tract living at or below the federal poverty level of census tracts is ascertained from the most current 5-Year American Community Survey estimates made available by the U.S. Census Bureau. Colorado consists of 1,249 unique census tracts, which are formal sub-county geographic areas defined by the U.S. Census Bureau, confined by county boundaries, and typically represent between 1,200 and 8,000 people. Counties with large populations, such as in the state’s large metropolitan areas, contain many census tracts; while counties with smaller populations, such as in the state’s rural and mountain regions, may have only a couple of census tracts4. Area-based poverty status is measured by calculating the percent of the population in each census tract that is living at or below the federal poverty level. Whether one is living at or below the federal poverty level is determined using a set of money income thresholds that vary by family size, age and composition5. Categories used for these reports include 0-9.9%, 10-19.9%, 20-29.9% and 30% of the population or greater living at or below the federal poverty level. The map on the following page depicts census tract boundaries for Colorado and its largest metropolitan areas and each census tract’s poverty status. Note that for some less populous counties with few census tracts, a single area-based poverty status category may represent most or all of the county. The Health Statistics and Evaluation Branch at the Colorado Department of Public Health and Environment is available to assist with further analyses of these data, as well as to answer questions one might have regarding these novel vital statistics measures. For further information or assistance, please contact the Health Statistics and Evaluation Branch at (303) 692-2160 or by e-mail at [email protected]. References: 1 Krieger N, Chen JT, Ebel G. Can we monitor socioeconomic inequalities in health? A survey of U.S.
health departments’ data collection and reporting practices. Public Health Reports. 1997 Nov-Dec; 112(6):481-91.
2 Subramanian SV, Chen JT, Rehkopf DH, Waterman PD, Krieger N. Comparing individual- and area-based socioeconomic measures for the surveillance of health disparities: A multilevel analysis of Massachusetts births, 1989-1991. American Journal of Epidemiology. 2006 Nov 1; 164(9): 823-834.
3 Colorado Comprehensive Cancer Program. Cancer & Poverty in Colorado: 1995-2006. Denver, CO: Colorado Department of Public Health and Environment. Available from: http://www.colorado.gov/cs/Satellite/CDPHE-PSD/CBON/1251635536890#
4 Geographic Terms and Concepts – Census Tract. United States Census Bureau. Available from: www.census.gov/geo/reference/gtc/gtc_ct.html
5 How the Census Bureau Measures Poverty. United States Census Bureau. Available from: https://www.census.gov/hhes/www/poverty/about/overview/measure.html