El Camino Hospital & Affiliates · established patient centered medical homes to retain a balanced...
35
El Camino Hospital & Affiliates FY 2014 Budget Hospital Board Meeting June 12, 2013
Transcript of El Camino Hospital & Affiliates · established patient centered medical homes to retain a balanced...

El Camino Hospital & Affiliates
FY 2014 BudgetHospital Board Meeting
June 12, 2013
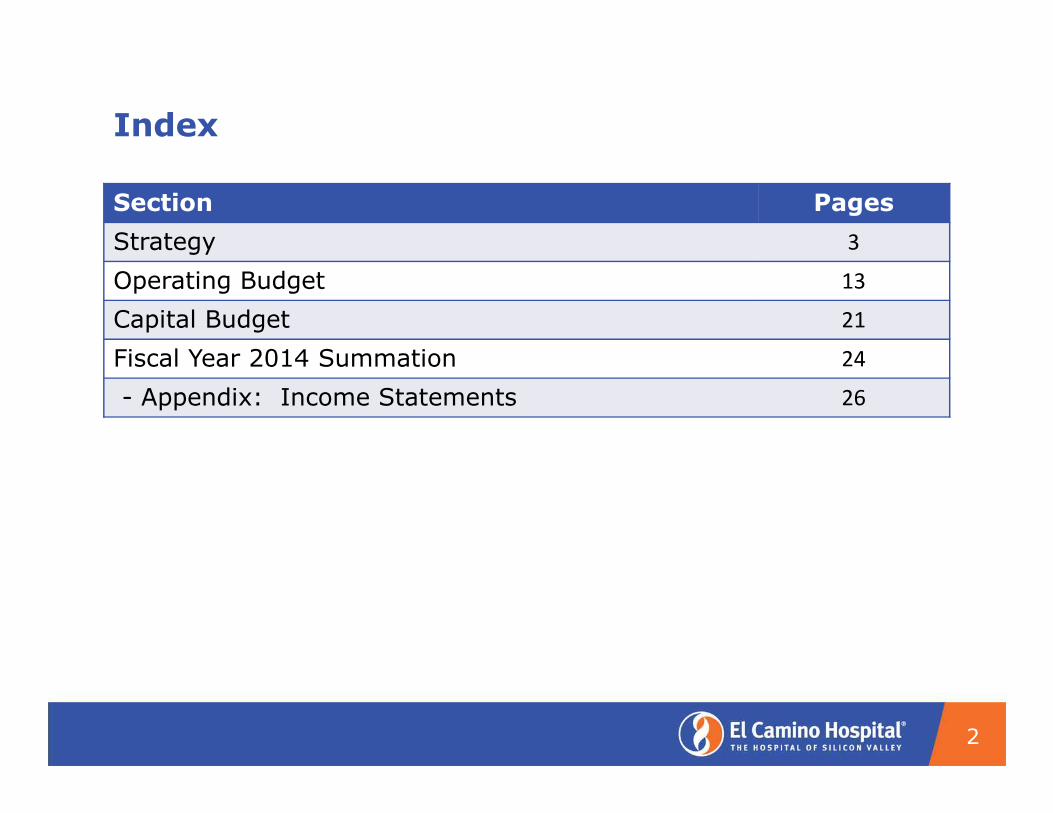
Index
2
Section Pages
Strategy 3
Operating Budget 13
Capital Budget 21
Fiscal Year 2014 Summation 24
- Appendix: Income Statements 26

Strategy
3

El Camino Hospital’s Strategy Embraces Wellness
Strategy
El Camino Hospital will be a locally controlled leader in optimizing
the health and wellness of our communities in Silicon Valley,
differentiated by innovative continuum of care developed in
partnership with physicians, businesses, and payers.
Positioning Statement
El Camino Hospital will first be a value-based health care provider
offering top decile, acute care quality at mid-level pricing, moving
toward continuum partnerships that integrate care coordination and
delivery strategies focused on the Triple Aim of quality, service,
and affordability.
4
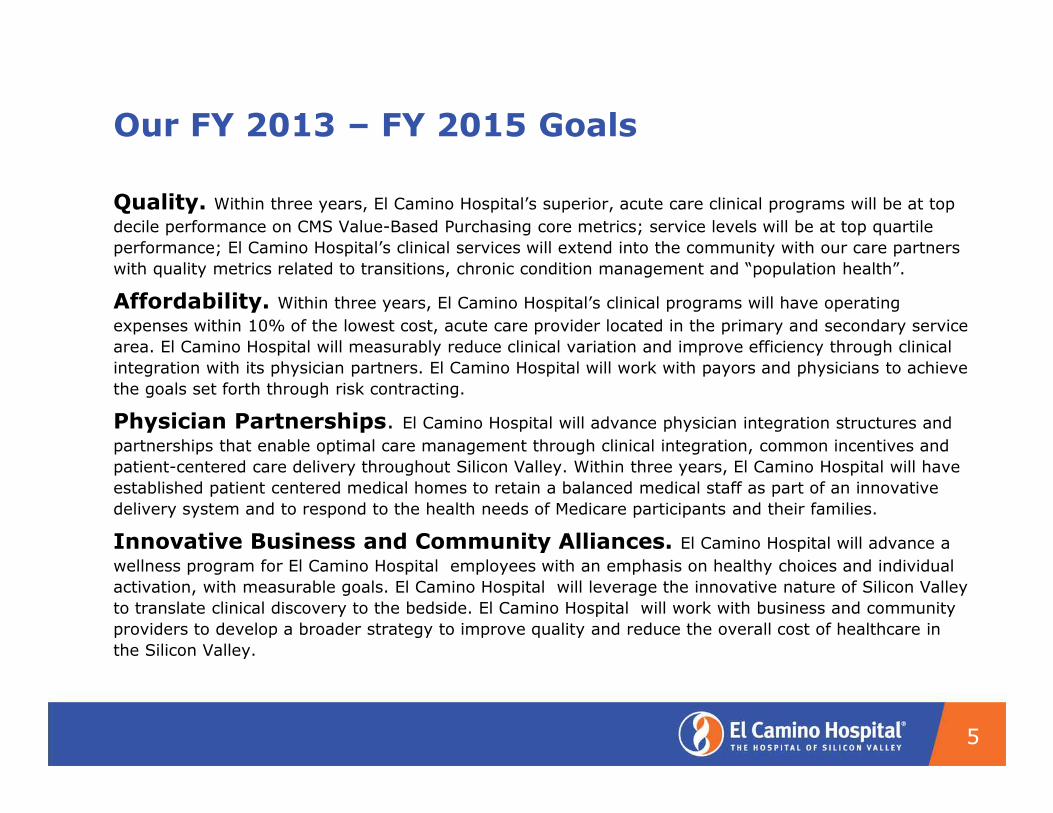
Our FY 2013 – FY 2015 Goals
Quality. Within three years, El Camino Hospital’s superior, acute care clinical programs will be at top decile performance on CMS Value-Based Purchasing core metrics; service levels will be at top quartile
performance; El Camino Hospital’s clinical services will extend into the community with our care partners
with quality metrics related to transitions, chronic condition management and “population health”.
Affordability. Within three years, El Camino Hospital’s clinical programs will have operating expenses within 10% of the lowest cost, acute care provider located in the primary and secondary service
area. El Camino Hospital will measurably reduce clinical variation and improve efficiency through clinical
integration with its physician partners. El Camino Hospital will work with payors and physicians to achieve
the goals set forth through risk contracting.
Physician Partnerships. El Camino Hospital will advance physician integration structures and partnerships that enable optimal care management through clinical integration, common incentives and
patient-centered care delivery throughout Silicon Valley. Within three years, El Camino Hospital will have
established patient centered medical homes to retain a balanced medical staff as part of an innovative
delivery system and to respond to the health needs of Medicare participants and their families.
Innovative Business and Community Alliances. El Camino Hospital will advance a wellness program for El Camino Hospital employees with an emphasis on healthy choices and individual
activation, with measurable goals. El Camino Hospital will leverage the innovative nature of Silicon Valley
to translate clinical discovery to the bedside. El Camino Hospital will work with business and community
providers to develop a broader strategy to improve quality and reduce the overall cost of healthcare in
the Silicon Valley.
5

Our Approach is Phased
•
6
Optimize Health & Wellness
Quality & Service
Affordability
Continuum of Care
Innovation in Wellness
Achieve the Triple Aim: Quality, Service & Affordability
Moving Toward
Continuum of Care
Top Decile Quality • Top Decile Core Measures• Reduce Complications & Mortality
Top Quartile Service• Value Based Purchasing
Efficient Operations• Reduce Variation in Practice
• Lean Process Improvement
Competitive Pricing • Pricing within Market• Costs Aligned with Pricing
• Patient access to primary care & chronic disease management
• Coordinated Care Transitions
• Employee Well-Being
• Business & Provider Alliances for Innovative Continuum of Care
7
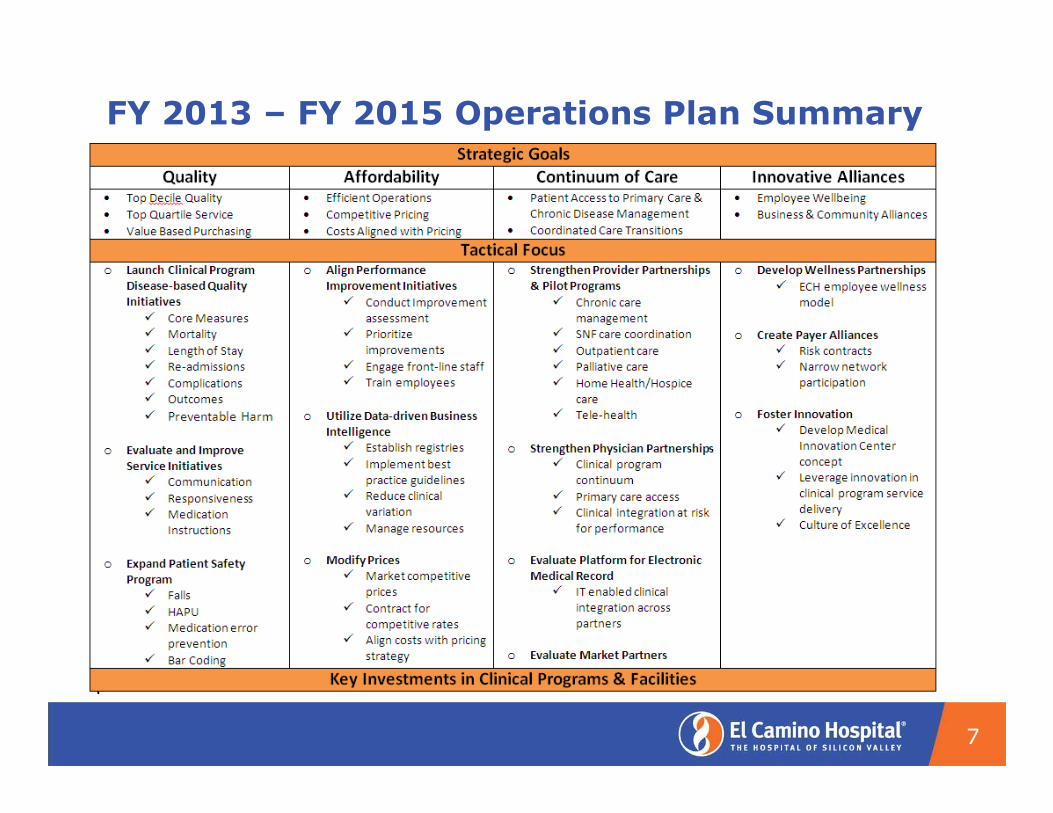
FY 2013 – FY 2015 Operations Plan Summary

Key Accomplishments for FY 2013
� HealthGrades® “Top Hospital”
� TJC Accreditation
� American College of Surgeons
Commission on Cancer National
Accreditation with
Commendation
� “Gold Seal” Stroke Accreditation
� Los Gatos Stroke Accreditation
� Chest Pain Accreditation
� Magnet Status for Nursing
� Hip Fracture & Joint Care
Accreditation
� Women Certified Top 100
Hospitals for OB, Heart Care
� Intensivist Program
� Preventable Harm Index
� Telemedicine launch
� Wellness launch
� Initiation of PaCT and LEAN
methodology
� Culture-based service initiative
� PAMF affiliation
� Bond rating upgrade to A1
by Moody’s
� Medication barcoding (KBMA)
� Expanded clinical research with
Fogarty Institute
� Nurses Improving Care for
Healthsystem Elders “NICHE”
8

FY 2014 Priority Goals
9
Triple Aim: Quality, Service & Affordability
•PaCT: Triple Aim
•People
Continuum of Care
•Clinical Integration through IT Case for Change
•Market Development Plans
Innovative Partnerships
•Physician Partnerships
•Community Health & Wellness
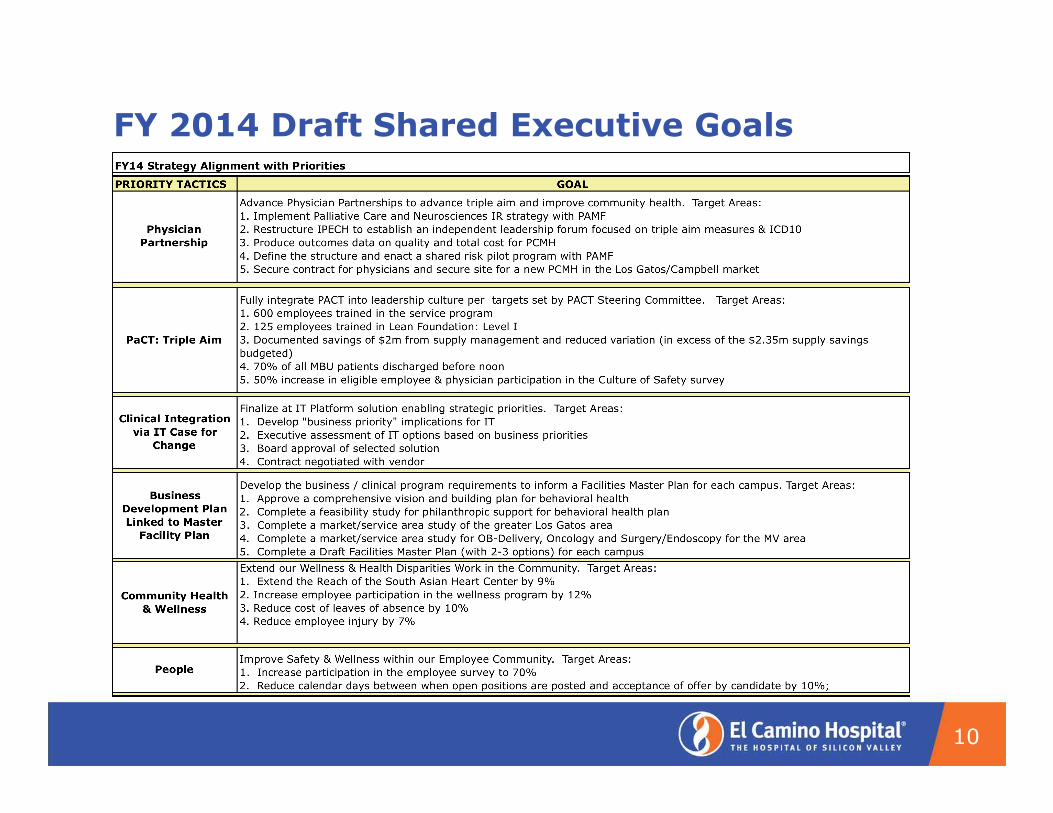
FY 2014 Draft Shared Executive Goals
10

FY 2014 Draft Corporate Scorecard
11
Quality Affordability
Core Measures Efficiency
DVT Medical-Surgical Length of Stay Improvement Opportunity
foley catheter management Observation ALOS (hours)
Core Measures % of Possible Performance Points 30 day post acute Total Cost of Care
Service Minutes from ED Arrival to Admit to Unit
Communication with Nurses OR Room Turnaround within 35 min
Responsiveness of Hospital Staff Worked Hours per CMI Adjusted Discharge
Communication About Medicines Total Operating Expense per CMI Adjusted Discharge
HCAHPS % of Possible Performance Points Financial Viability
Outcomes Total Operating Margin
Hospital Onset C diff Infection rate Inpatient Operating Margin
Risk Adjusted Inpatient Mortality from MI Outpatient Operating Margin
Risk Adjusted Inpatient Mortality from CHF Adjusted Discharges
Risk Adjusted Inpatient Mortality from Pneumonia Total Days Cash on Hand
Risk Adjusted comlications after percutaneous procedures (NCDR) Days of Accounts Receivable
(NSQIP) Continuum of Care
Patient Safety 30 Day All Cause Readmission
Stage 3-4 Hospital Acquired Pressure Ulcer Rate 7 Day Unplanned Readmission after Discharge
Rate of Patient Falls 30 Day Readmission: Medicare Only
5 Rights Medication Errors / 1000 Adj Pt Days Employee Wellbeing
Mislabeled Specimens per Month Employee Lift/Transfer Injury Rate
Counts of Preventable Harm (0 is Goal) Biometrics Screening Employee Participation Rate

FY 2014 Draft Organizational Goals
12
Performance Measurement
Organizational Goal FY14 Minimum Target Maximum WeightEvaluation
Timeframe
Regulatory Compliance
Joint Commission Accreditation Threshold FY
Financial Viability
Budgeted Operating Margin Threshold FY
Operating Margin re Budget meet 0.5% 1.0% FY
Quality and Patient Safety
Core Measures % of 100 Possible Performance Points 84% 86% 90%
Rate of Patient Falls TBD TBD TBD
Service
Meet the averaged performance for the 3 Service
metrics on the Corporate Scorecard:
- Improve Staff Communication to 75%
- Improve Medication Communication to 60%
- Improve Staff Responsiveness to 64%
TBD TBD TBD
Efficiency
Minutes from ED Arrival to Admit to Unit TBD TBD TBD
Continuum of Care
30 day all cause Readmission (Medicare) TBD TBD TBD
People
Biometrics Screening Employee Participation Rate TBD TBD TBD
Full Accreditation
90% of Budgeted

Finance Committee Discussion Items
13
1) Add Outcomes and Preventable Harm to the list of priorities {Done}
2) Review pricing philosophy and strategy with Fina nce Committee for Board . consideration {FY14 M. King}
3) Include home monitoring capabilities in continuu m of care {FY14 E. Pifer}
4) Further develop concierge program {FY14-FY15 T. Ryba & Foundation}
5) Develop a process to identify new revenue streams , consider innovation,and pursue business development opportunities {FY14 T. Ryba}
6) Develop an employee suggestion program to foster innovation {FY15 M. Zdeblick}

Finance Committee Discussion Items (Cont.)
14
7) Define the role of the physician in reducing vari ation and cost . reduction {FY14 E. Pifer & M. Zdeblick}
8) Brief Board on the hospital’s inventory managemen t processes{FY14 M. King}
9) In partnership with the physicians on the Capita l Planning Committee, . develop a multi-year capital planning process
{FY14 M. King & M. Zdeblick}
10) Identify catastrophic risks, two or three immin ent dangers that may be . totally unexpected that could severely devastate th e hospital (e.g., .hyperinflation, competition). {FY14 M. King}
11) Reserve cash for investment purposes. {Board}

FY14 Operating Budget
15

Assumptions - Revenue
16
Category Assumption
Volumes • Dialysis service volumes will decrease significantly due to the initiation of services at competing facilities and due to Kaiser’s consolidation of its dialysis offerings to fewer sites of service.
• Surgical volume growth expected to continue in Mountain View from Orthopedic & Spine service lines and the initiation of neuro-interventional services.
• With only minor variations, other services are expected to maintain the activity levels being experienced in fiscal year 2013.
Prices • While the price of individual items will be adjusted in response to market changes and in response to their acquisition cost, prices overall are expected to remain at their current levels (i.e., an overall 0% price increase).
Reimbursement • Rates for contracted payers have been projected based on the terms of their individual contracts and based on assessment of the marketplace.
• Medicare sequestration was budgeted to reduce revenues by $5.3 million.• Additional reimbursement of $6.3 million was budgeted for various governmental supplemental payment, including the Hi-tech act, Medicare Disproportionate Share, and Medi-Cal supplemental payments.
• Case Mix Index adjusted upward slightly due to higher expected surgical volumes in spine, orthopedics and neuro-interventional.
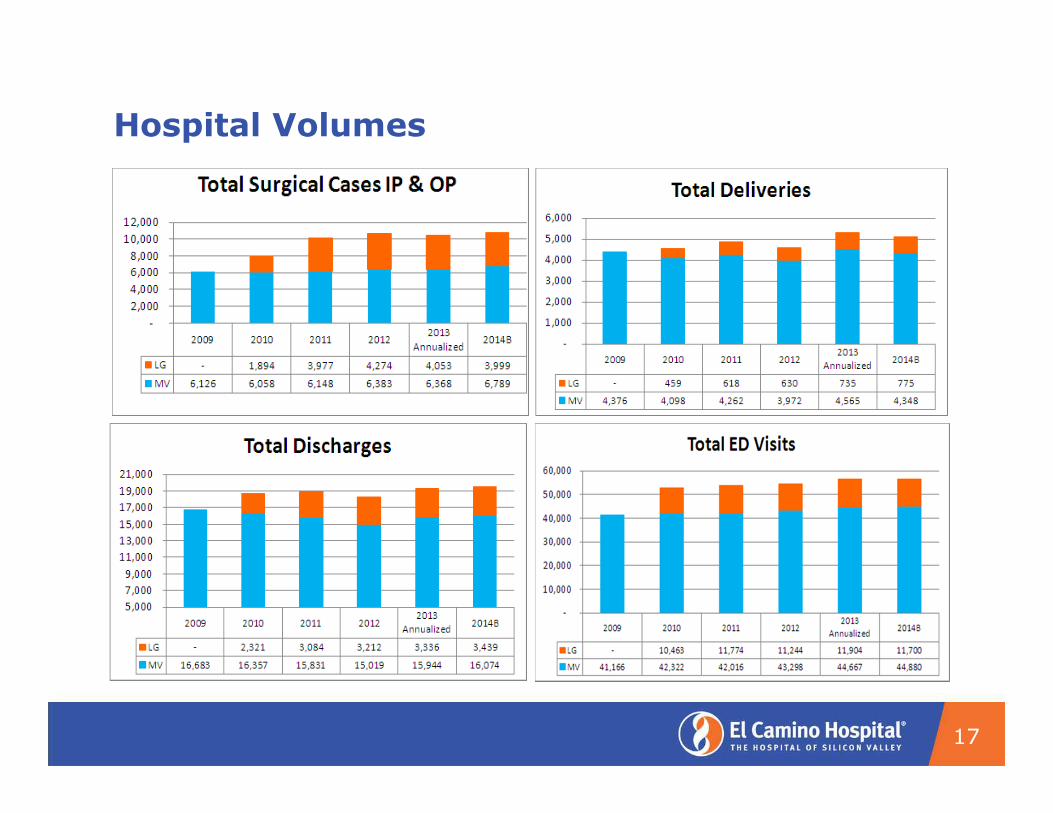
Hospital Volumes
17
1.3%
Above
2012

Assumptions – Operating Expenses
18
Category Assumption
Salaries • Staffing was increased to re-assimilate services previously outsourced – Information Services and Health Information Management.
• Staffing was increased for strategic initiatives and in support of expected volume increases, and was decreased due to the expected loss of dialysis volume.
• Wage increases were projected for market adjustments, step increases and contractual agreements.
Benefits • Health Benefits are expected to increase 11%. Updated actuarial projections provided the budgeted pension expense.
Supplies & Other • Supply and drug expenses were adjusted for expected volume changes and by a 4% inflation factor.
• G&A expenses were projected based on current year expenditures, adjusted for non-recurring events.
• The budget includes a $4.4 million targeted reduction in supply expense from management initiatives in this area.
Interest • Interest expense was based on existing indebtedness.
Depreciation • Depreciation was projected from current assets and anticipated capital spending.

Budgeted 2014 Operating Margin Equals FYTD 2013 Run Rate
19
(1) Run rate is operating margin after adjusting for the effect of one-time events.Value shown for FYTD 2013 is as of March.
FYTD 2013 Run Rate FY 2014 Oper Marg
(1)
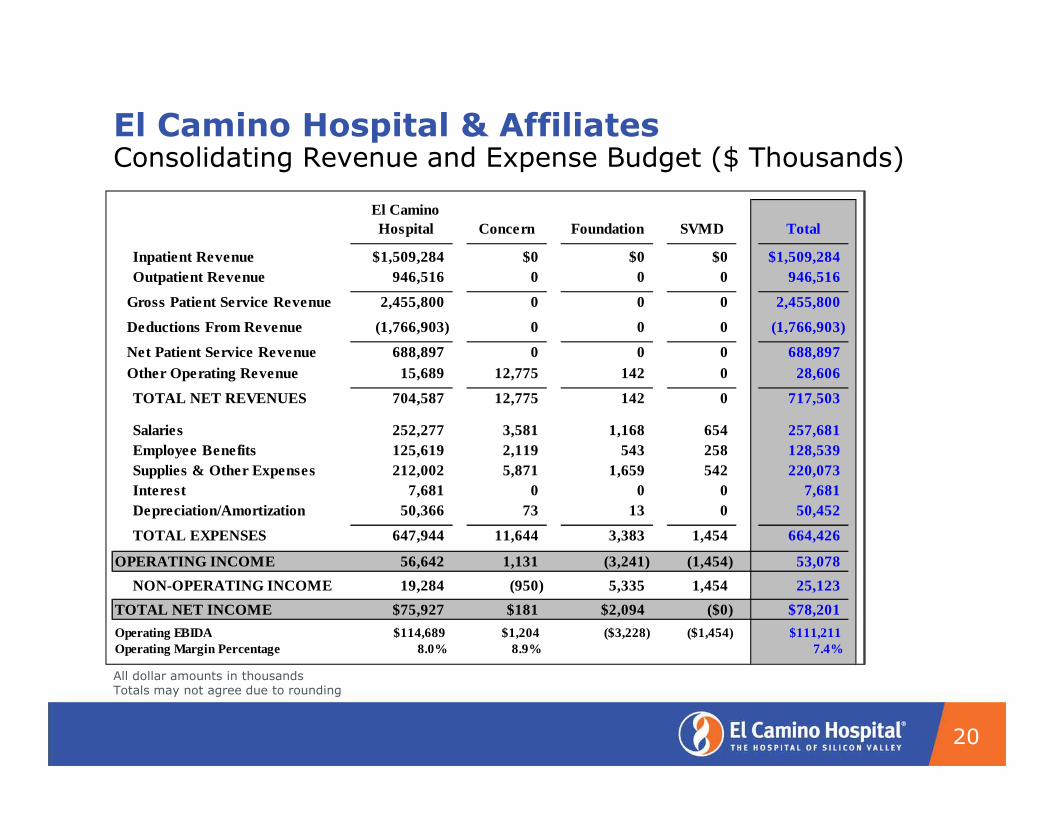
20
El Camino Hospital Concern Foundation SVMD Total
Inpatient Revenue $1,509,284 $0 $0 $0 $1,509,284Outpatient Revenue 946,516 0 0 0 946,516
Gross Patient Service Revenue 2,455,800 0 0 0 2,455,800
Deductions From Revenue (1,766,903) 0 0 0 (1,766,903)
Net Patient Service Revenue 688,897 0 0 0 688,897 Other Operating Revenue 15,689 12,775 142 0 28,606
TOTAL NET REVENUES 704,587 12,775 142 0 717,503
Salaries 252,277 3,581 1,168 654 257,681Employee Benefits 125,619 2,119 543 258 128,539Supplies & Other Expenses 212,002 5,871 1,659 542 220,073Interest 7,681 0 0 0 7,681Depreciation/Amortization 50,366 73 13 0 50,452
TOTAL EXPENSES 647,944 11,644 3,383 1,454 664,426
OPERATING INCOME 56,642 1,131 (3,241) (1,454) 53,078
NON-OPERATING INCOME 19,284 (950) 5,335 1,454 25,123
TOTAL NET INCOME $75,927 $181 $2,094 ($0) $78,201
Operating EBIDA $114,689 $1,204 ($3,228) ($1,454) $111,211Operating Margin Percentage 8.0% 8.9% 7.4%
All dollar amounts in thousandsTotals may not agree due to rounding
El Camino Hospital & AffiliatesConsolidating Revenue and Expense Budget ($ Thousands)

Hospital Operating Margin will be Impacted by Inflation, Investments in Strategy and Pressure on Reimbursement
21
Category Change % of RevenueDollars
(Millions)
Net Operating Income Fiscal Year 2013 Net Operating Margin 11.0% $ 76.4 M
Operating RevenuesCommercial & Gov't Payor increases, net of
decreases0.2% $ 1.7 M
Operating Revenues Service, Volume & Misc. 0.7% $ 5.4 M
Operating Expense Expense Inflation (Salaries, Supplies, Benefits) -2.4% $ (17.3) M
Operating Expense Capital Spending -0.4% $ (2.6) M
Operating Expense Strategic - Supply Chain/Savings Initiative 0.6% $ 4.4 M
Operating Expense Strategic - Wellness Initiative; Marketing -0.1% $ (.8) M
Operating Expense Strategic - PaCT -0.4% $ (2.5) M
Operating Expense Strategic - Continuum of Care -0.1% $ (.8) M
Operating Expense Strategic - Ortho/Neuro Service Line -0.3% $ (2.0) M
Operating Expense All Other -0.7% $ (5.3) M
Net Operating Income Fiscal Year 2014 Net Operating Margin 8.0% $ 56.6 M
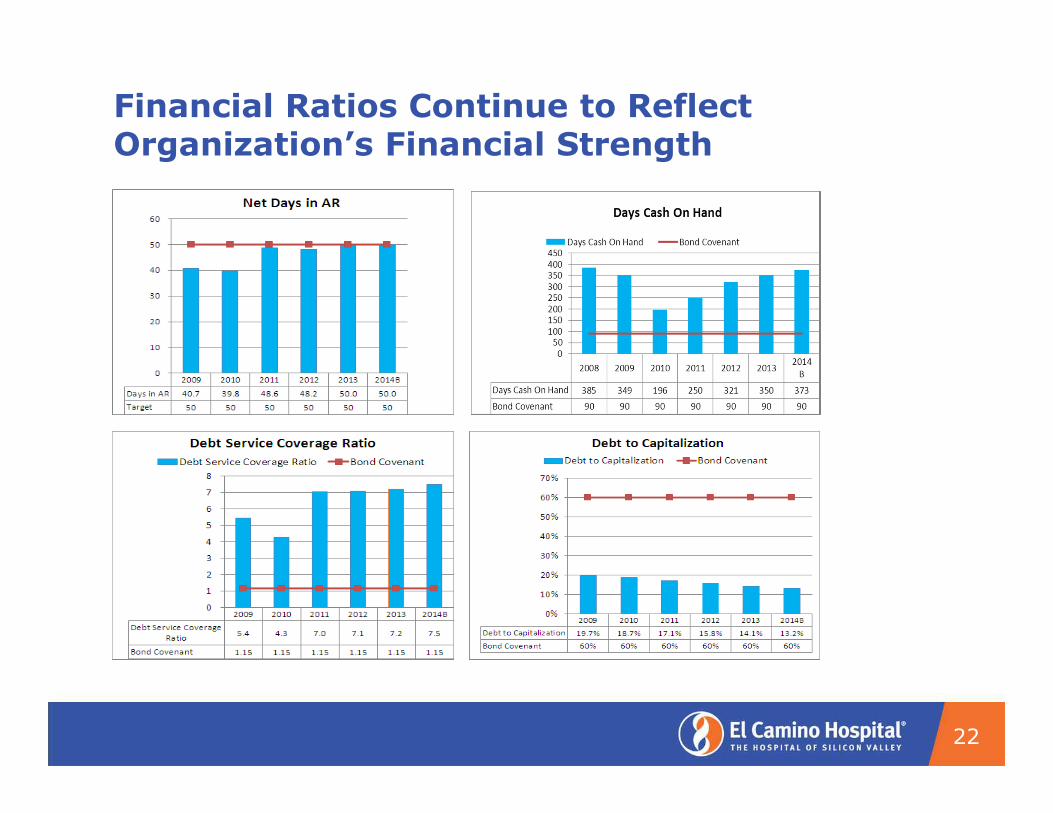
Financial Ratios Continue to Reflect Organization’s Financial Strength
22

Capital Budget
23
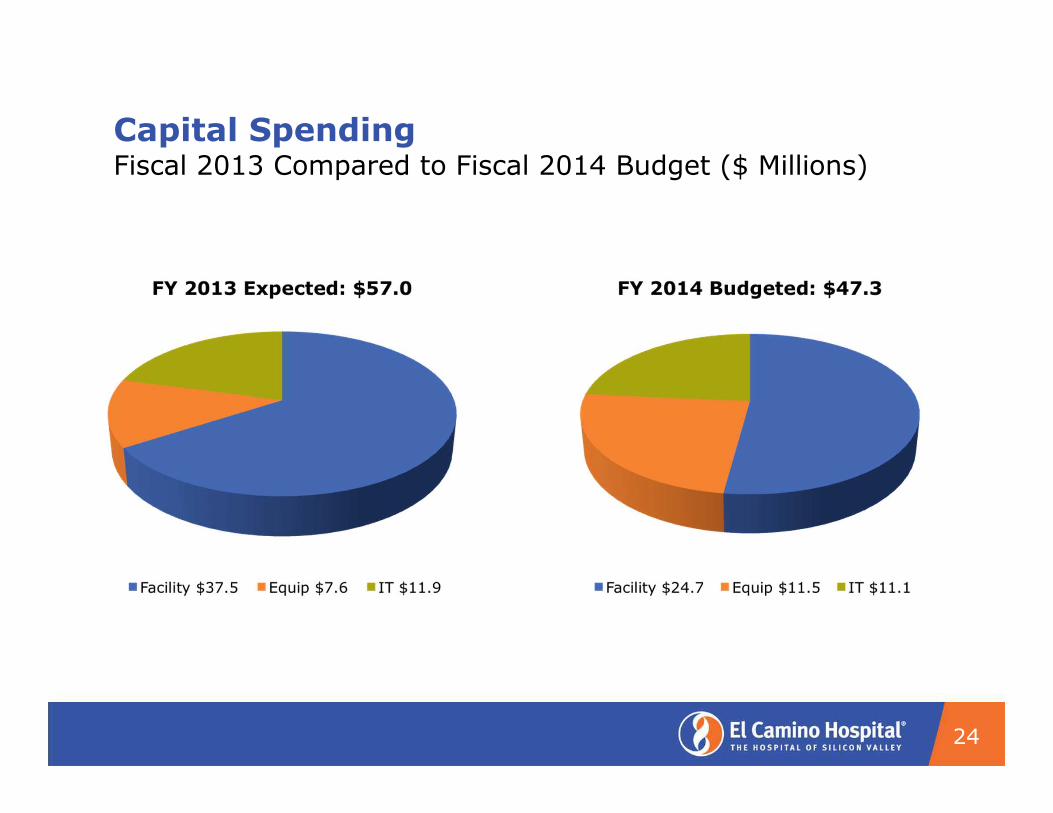
Capital Spending
24
Fiscal 2013 Compared to Fiscal 2014 Budget ($ Millions)

Capital Spending
25
Fiscal 2014 Budget
Spending on items over $250k
by Category

26
Excludes land improvements and building additions

Fiscal Year 2014 Summation
27
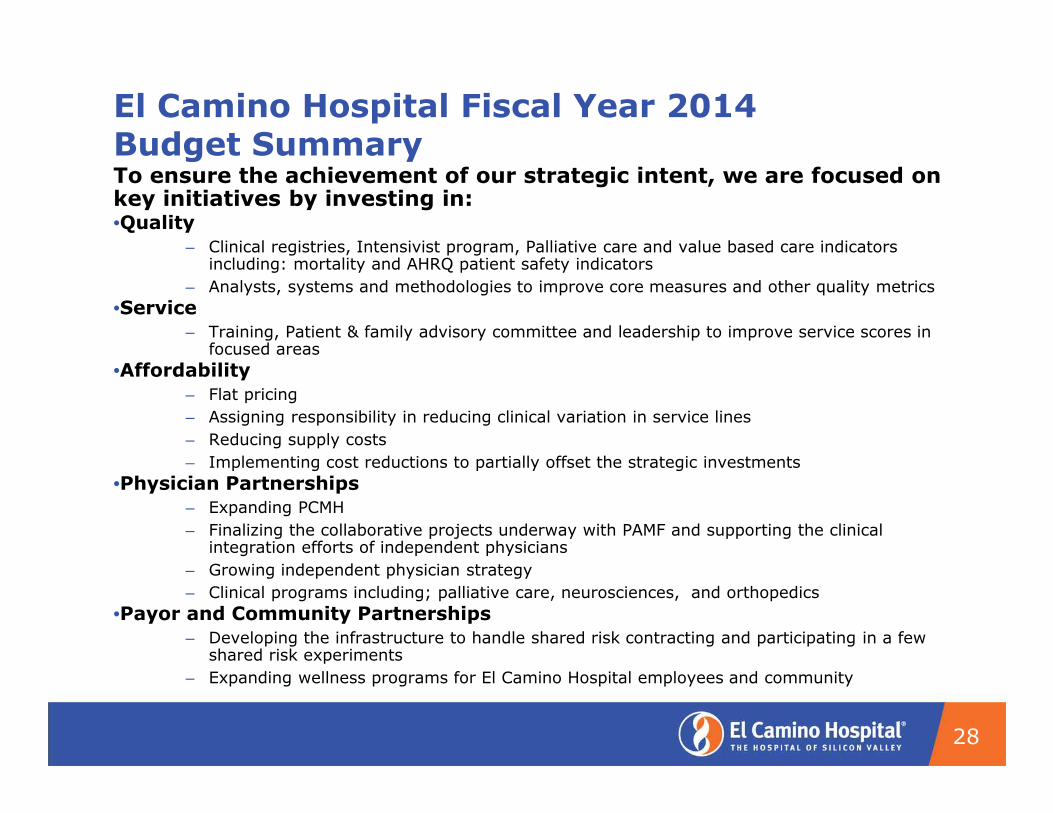
El Camino Hospital Fiscal Year 2014 Budget SummaryTo ensure the achievement of our strategic intent, we are focused on key initiatives by investing in:•Quality
– Clinical registries, Intensivist program, Palliative care and value based care indicators including: mortality and AHRQ patient safety indicators
– Analysts, systems and methodologies to improve core measures and other quality metrics
•Service– Training, Patient & family advisory committee and leadership to improve service scores in focused areas
•Affordability– Flat pricing
– Assigning responsibility in reducing clinical variation in service lines
– Reducing supply costs
– Implementing cost reductions to partially offset the strategic investments
•Physician Partnerships– Expanding PCMH
– Finalizing the collaborative projects underway with PAMF and supporting the clinical integration efforts of independent physicians
– Growing independent physician strategy
– Clinical programs including; palliative care, neurosciences, and orthopedics
•Payor and Community Partnerships– Developing the infrastructure to handle shared risk contracting and participating in a few shared risk experiments
– Expanding wellness programs for El Camino Hospital employees and community
28

Appendix
Income Statements
29

CONCERN: EAPComparative Statement of Revenue and Expense ($ Thousands)
30
Estimated Budget Fav (Unfav) Change2012 2013 2014 Amount Percent
REVENUESInpatient Revenue $0 $0 $0 $0 N/A Outpatient Revenue 0 0 0 0 N/A
Gross Patient Service Revenue 0 0 0 0 N/A
Deductions From Revenue 0 0 0 0 N/A
Net Patient Service Revenue 0 0 0 0 N/A
Other Operating Revenue 12,361 12,943 12,775 (168) (1.3%)
TOTAL NET REVENUES 12,361 12,943 12,775 (168) (1.3%)
EXPENSESSalaries 3,452 3,470 3,581 (111) (3.2%)Employee Benefits 1,558 1,839 2,119 (280) (15.2%)Supplies & Other Expenses 5,290 5,553 5,871 (318) (5.7%)Interest 0 0 0 0 N/A Depreciation/Amortization 94 76 73 3 3.4%
TOTAL EXPENSES 10,394 10,937 11,644 (707) (6.5%)
OPERATING INCOME 1,967 2,006 1,131 (875) (43.6%)
NON-OPERATING INCOME (495) (1,227) (950) 277 22.6%
TOTAL NET INCOME $1,472 $779 $181 ($598) (76.8%)
Operating EBIDA $2,061 $2,081 $1,204 ($877) (42.2%)Operating Margin Percentage 15.9% 15.5% 8.9%
All dollar amounts in thousands
Totals may not agree due to rounding
31
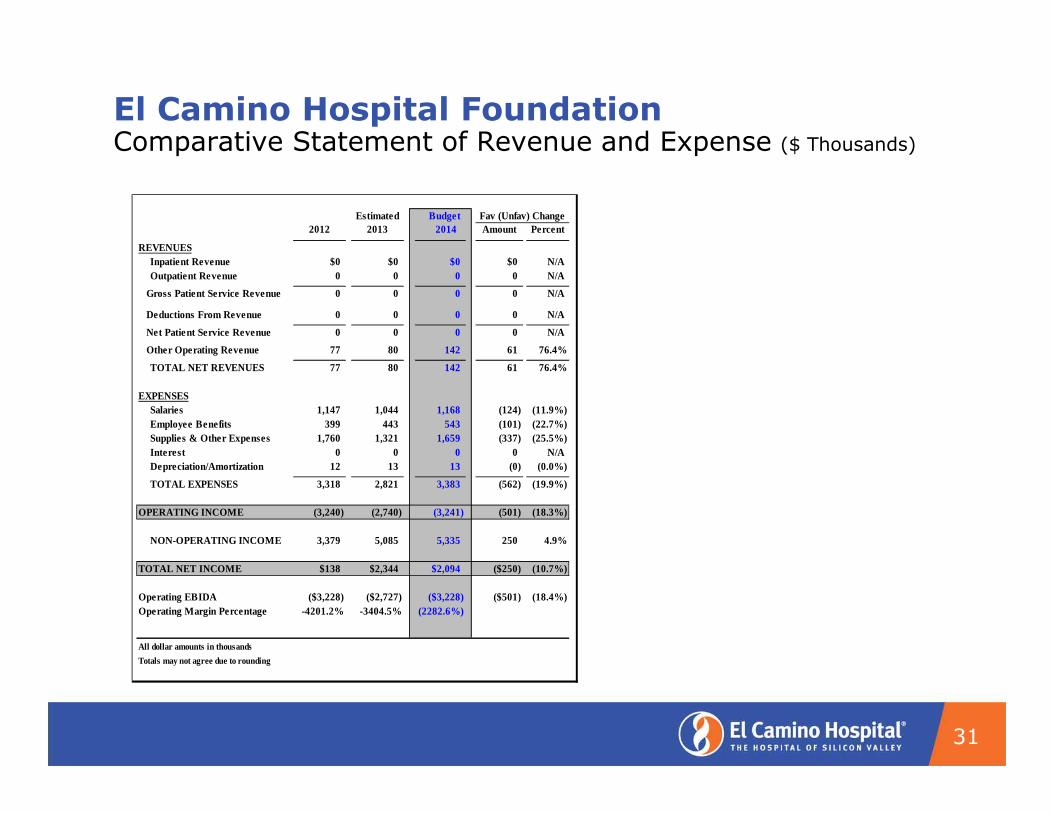
El Camino Hospital FoundationComparative Statement of Revenue and Expense ($ Thousands)
Estimated Budget Fav (Unfav) Change2012 2013 2014 Amount Percent
REVENUESInpatient Revenue $0 $0 $0 $0 N/A Outpatient Revenue 0 0 0 0 N/A
Gross Patient Service Revenue 0 0 0 0 N/A
Deductions From Revenue 0 0 0 0 N/A
Net Patient Service Revenue 0 0 0 0 N/A
Other Operating Revenue 77 80 142 61 76.4%
TOTAL NET REVENUES 77 80 142 61 76.4%
EXPENSESSalaries 1,147 1,044 1,168 (124) (11.9%)Employee Benefits 399 443 543 (101) (22.7%)Supplies & Other Expenses 1,760 1,321 1,659 (337) (25.5%)Interest 0 0 0 0 N/A Depreciation/Amortization 12 13 13 (0) (0.0%)
TOTAL EXPENSES 3,318 2,821 3,383 (562) (19.9%)
OPERATING INCOME (3,240) (2,740) (3,241) (501) (18.3%)
NON-OPERATING INCOME 3,379 5,085 5,335 250 4.9%
TOTAL NET INCOME $138 $2,344 $2,094 ($250) (10.7%)
Operating EBIDA ($3,228) ($2,727) ($3,228) ($501) (18.4%)Operating Margin Percentage -4201.2% -3404.5% (2282.6%)
All dollar amounts in thousands
Totals may not agree due to rounding

32
Estimated Budget Fav (Unfav) Change2012 2013 2014 Amount Percent________ _________ ________ _______ _______
REVENUESInpatient Revenue $0 $0 $0 $0 N/A Outpatient Revenue 0 0 0 0 N/A
________ _________ ________ _______ _______ Gross Patient Service Revenue 0 0 0 0 N/A
Deductions From Revenue 0 0 0 0 N/A ________ _________ ________ _______ _______
Net Patient Service Revenue 0 0 0 0 N/A
Other Operating Revenue 0 0 0 0 N/A ________ _________ ________ _______ _______
TOTAL NET REVENUES 0 0 0 0 N/A
EXPENSESSalaries 349 490 654 (165) (33.6%)Employee Benefits 160 309 258 51 16.6%Supplies & Other Expenses 557 126 542 (415) #######Interest 0 0 0 0 N/A Depreciation/Amortization 0 0 0 0 N/A
________ ________ ________ _______ _______TOTAL EXPENSES 1,067 926 1,454 (529) (57.1%)
OPERATING INCOME (1,067) (926) (1,454) (529) (57.1%)
NON-OPERATING INCOME 1,037 872 1,454 582 66.8%
TOTAL NET INCOME ($30) ($54) ($0) $54 99.4%
Operating EBIDA ($1,067) ($926) ($1,454) ($529) (57.1%)Operating Margin Percentage N/A N/A N/A
All dollar amounts in thousands
Totals may not agree due to rounding
Silicon Valley Medical DevelopmentComparative Statement of Revenue and Expense ($ Thousands)

33
Estimated Budget Fav (Unfav) Change2012 2013 2014 Amount Percent________ _________ ________ _______ _______
REVENUESInpatient Revenue $1,408 $1,466 $1,509 $43 3.0%Outpatient Revenue 952 971 947 (24) (2.5%)
________ _________ ________ _______ _______ Gross Patient Service Revenue 2,360 2,437 2,456 19 0.8%
Deductions From Revenue (1,730) (1,755) (1,767) (12) (0.7%)________ _________ ________ _______ _______
Net Patient Service Revenue 630 682 689 7 1.0%
Other Operating Revenue 14 16 16 0 1.0%________ _________ ________ _______ _______
TOTAL NET REVENUES 644 697 705 7 1.0%
EXPENSESSalaries 214 235 252 (17) (7.4%)Employee Benefits 105 119 126 (7) (5.8%)Supplies & Other Expenses 200 212 212 (0) (0.1%)Interest 8 8 8 0 1.9%Depreciation/Amortization 49 48 50 (3) (5.4%)
________ ________ ________ _______ _______TOTAL EXPENSES 576 621 648 (27) (4.3%)
OPERATING INCOME 68 76 57 (20) (25.9%)
NON-OPERATING INCOME 4 24 19 (4) (18.9%)
TOTAL NET INCOME $72 $100 $76 ($24) (24.2%)
Operating EBIDA $125 $132 $115 ($17) (13.1%)Operating Margin Percentage 10.5% 11.0% 8.0%
KEY HOSPITAL INDICATORS:Total Hospital Discharges 22,593 24,276 24,291 15 0.1%Total Hospital Patient Days 90,800 97,273 97,434 161 0.2%Acute Length of Stay (LOS) 4.0 4.0 4.0 0.0 0.0%Hospital Average Daily Census 248 267 267 0 0.2%
All dollar amounts in millions
Totals may not agree due to rounding
El Camino Hospital – Without AffiliatesComparative Statement of Revenue and Expense ($ Millions)

34
Estimated Budget Fav (Unfav) Change2012 2013 2014 Amount Percent________ _________ ________ _______ _______
REVENUESInpatient Revenue $1,408 $1,466 $1,509 $43 3.0%Outpatient Revenue 987 1,004 947 (57) (5.7%)
________ _________ ________ _______ _______ Gross Patient Service Revenue 2,395 2,469 2,456 (14) (0.6%)
Deductions From Revenue (1,759) (1,781) (1,767) 14 0.8%________ _________ ________ _______ _______
Net Patient Service Revenue 637 688 689 1 0.1%
Other Operating Revenue 26 29 29 0 0.2%________ _________ ________ _______ _______
TOTAL NET REVENUES 663 717 718 1 0.1%
EXPENSESSalaries 221 242 258 (16) (6.4%)Employee Benefits 107 122 129 (6) (5.2%)Supplies & Other Expenses 211 222 220 2 0.8%Interest 8 8 8 0 1.9%Depreciation/Amortization 49 48 50 (2) (4.8%)
________ ________ ________ _______ _______TOTAL EXPENSES 598 642 664 (22) (3.5%)
OPERATING INCOME 66 75 53 (22) (28.9%)
NON-OPERATING INCOME 8 28 25 (3) (11.8%)
TOTAL NET INCOME $74 $103 $78 ($25) (24.2%)
Operating EBIDA $123 $131 $111 ($19) (14.8%)Operating Margin Percentage 9.9% 10.4% 7.4%
KEY HOSPITAL INDICATORS:Total Hospital Discharges 22,593 24,276 24,291 15 0.1%Total Hospital Patient Days 90,800 97,273 97,434 161 0.2%Acute Length of Stay (LOS) 4.0 4.0 4.0 0.0 0.0%Hospital Average Daily Census 248 267 267 0 0.2%
All dollar amounts in millions
Totals may not agree due to rounding
El Camino Hospital & AffiliatesComparative Statement of Revenue and Expense ($ Millions)

35
El Camino Hospital & AffiliatesConsolidating Statement of Revenue and Expense ($ Thousands)
El Camino Hospital Concern Foundation SVMD Total
REVENUESInpatient Revenue $1,509,284 $0 $0 $0 $1,509,284Outpatient Revenue 946,516 0 0 0 946,516
Gross Patient Service Revenue 2,455,800 0 0 0 2,455,800
Deductions From Revenue (1,766,903) 0 0 0 (1,766,903)
Net Patient Service Revenue 688,897 0 0 0 688,897
Other Operating Revenue 15,689 12,775 142 0 28,606
TOTAL NET REVENUES 704,587 12,775 142 0 717,503
EXPENSESSalaries 252,277 3,581 1,168 654 257,681Employee Benefits 125,619 2,119 543 258 128,539Supplies & Other Expenses 212,002 5,871 1,659 542 220,073Interest 7,681 0 0 0 7,681Depreciation/Amortization 50,366 73 13 0 50,452
TOTAL EXPENSES 647,944 11,644 3,383 1,454 664,426
OPERATING INCOME 56,642 1,131 (3,241) (1,454) 53,078
NON-OPERATING INCOME 19,284 (950) 5,335 1,454 25,123
TOTAL NET INCOME $75,927 $181 $2,094 ($0) $78,201
Operating EBIDA $114,689 $1,204 ($3,228) ($1,454) $111,211Operating Margin Percentage 8.0% 8.9% 7.4%
KEY HOSPITAL INDICATORS:Total Hospital Discharges 24,291 24,291Total Hospital Patient Days 97,434 97,434Acute Length of Stay (LOS) 4.0 4.0Hospital Average Daily Census 266 267
All dollar amounts in thousands
Totals may not agree due to rounding