Using Graph Theory to Study Neural Networks (Watrous, Tandon, Conner, Pieters & Ekstrom, 2012)
date post
19-Dec-2015Category
view
218download
0
Ekstrom Math 115b
Mathematics for Business Decisions, part II
Integration
Math 115b

Ekstrom Math 115b
Integration
Motivation
Revenue as an area under Demand function
.
-1.2
-10 q
D(q)
Demand Function
Revenue
qD(q)
qDqqR

Ekstrom Math 115b
Integration
Total Revenue
Total possible revenue is the revenue gained by charging the max price per customer
-1.2
-8
Demand Function
Total PossibleRevenue

Ekstrom Math 115b
Integration
Revenue
Consumer surplus – revenue lost by charging less Producer surplus – revenue lost by charging more
(i.e. “not sold” revenue)
-1.2
-8q
D(q)
Revenue
ConsumerSurplus
NotSold
Demand Function

Ekstrom Math 115b
Integration
Approx. area under curve
Counting rectangles (by hand) Using midpoint sums (by hand) Using Midpoint Sums.xlsm (using Excel) Using Integrating.xlsm (using Excel)
Ekstrom Math 115b
Integration
Counting Rectangles
Ex.
Approx. 9 rectangles
Each rectangle is 0.25 square units
Total area is approx. 2.25 square units0
0.5
1
1.5
2
2.5
0 0.5 1 1.5 2

Ekstrom Math 115b
Integration
Midpoint Sums
given interval :,
givenfunction :
rectangles with sum :
ba
f
nSn
Notation
Meaning
bafSn ,,

Ekstrom Math 115b
Integration
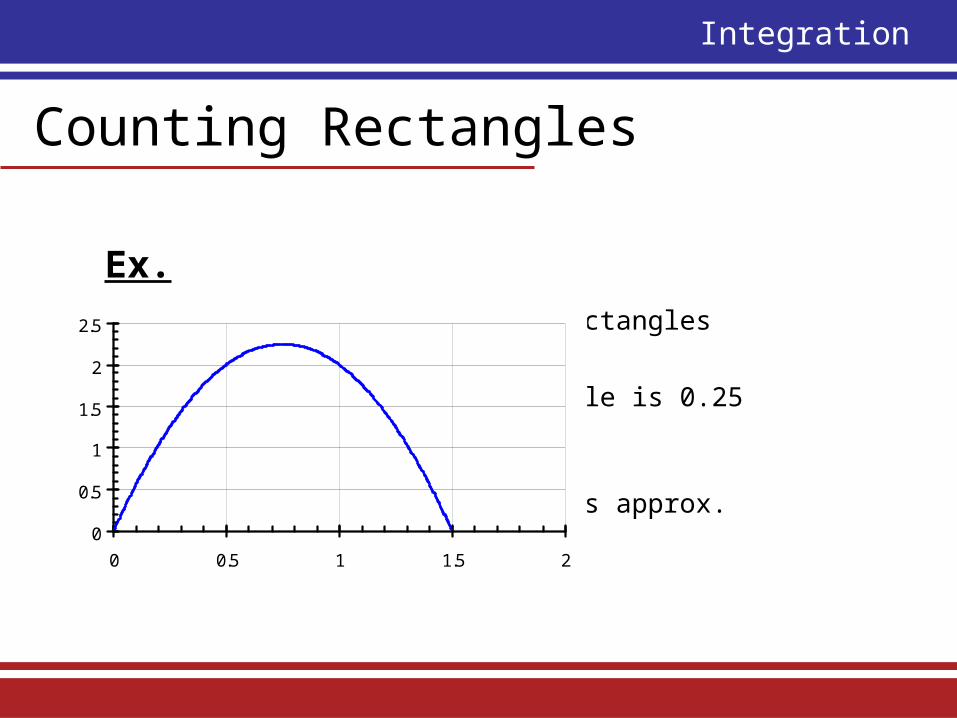
Midpoint Sums
Process
Find endpoints of each subinterval
Find midpoint of each subinterval
nxxxxx ...,,,,, 3210
nmmmm ...,,,, 321
Ekstrom Math 115b
Integration
Midpoint Sums
Process (continued)Find function value at each midpoint
Multiply each by and add them all
This sum is equal to
nmfmfmfmf ...,,,, 321
imf x xmfxmfxmfxmf n ...321
bafSn ,,

Ekstrom Math 115b
Integration
Midpoint Sums
5.1
0.1
5.0
0
3
2
1
0
x
x
x
x
25.1
75.0
25.0
3
2
1
m
m
m
Ex. Determine where .
5.1,0,3 fS 246 xxxf

Ekstrom Math 115b
Integration
Midpoint Sums
Ex. (Continued)
375.2
5.025.15.025.25.025.1
5.025.15.075.05.025.0
5.1,0, 3213
fff
xmfxmfxmffS

Ekstrom Math 115b
Integration
Consumer Surplus
Ex. (Continued)
0
0.5
1
1.5
2
2.5
0 0.5 1 1.5 2

Ekstrom Math 115b
Integration
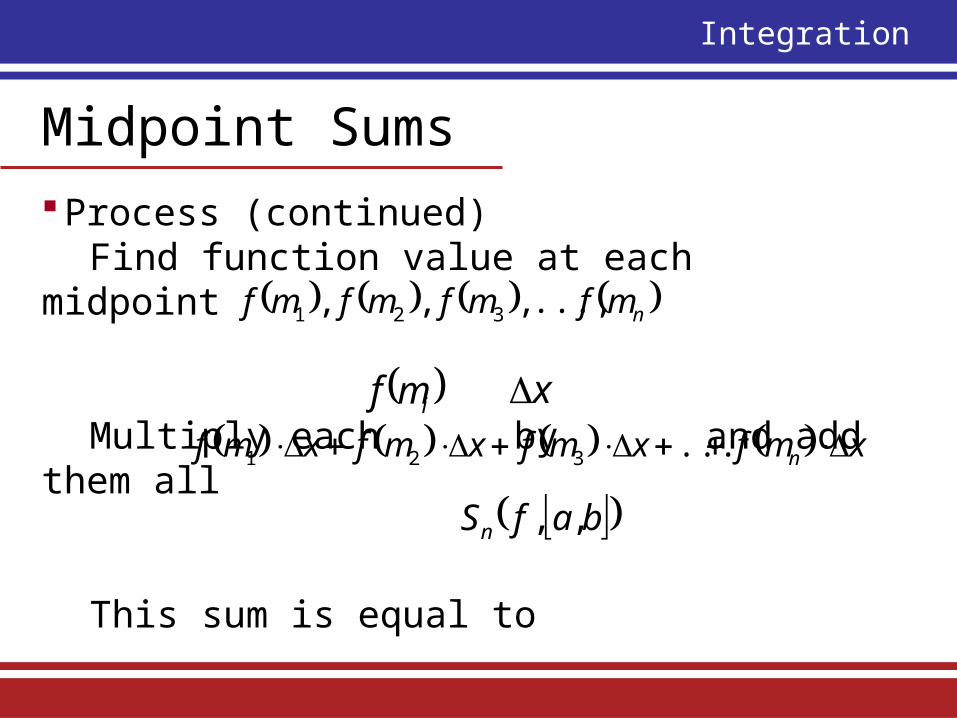
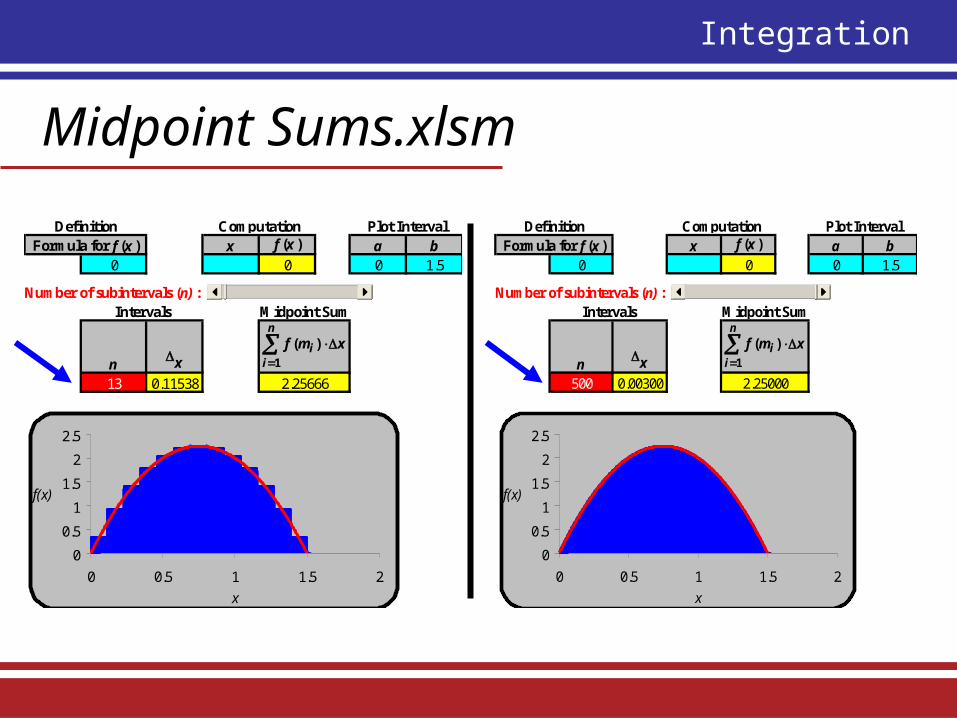
Midpoint Sums.xlsm
x f (x ) a b= =
n x
6 0.00000
stuvw
31
Constants
Plot IntervalFormula for f (x )
0.00000
Intervals Midpoint Sum
Definition Computation
Number of subintervals (n) :
0
0.2
0.4
0.6
0.8
1
0 0.2 0.4 0.6 0.8 1
x
f(x)
n
ii xmf
1
)(
Ekstrom Math 115b
Integration
Midpoint Sums.xlsm
x f (x ) a b0 0 0 1.5
n x
3 0.50000
31
Plot IntervalFormula for f (x )
2.37500
Intervals Midpoint Sum
Definition Computation
Number of subintervals (n) :
0
0.5
1
1.5
2
2.5
0 0.5 1 1.5 2
x
f(x)
n
ii xmf
1
)(
246 xxxf
Ekstrom Math 115b
Integration
Midpoint Sums.xlsm
x f (x ) a b0 0 0 1.5
n x
13 0.11538
31
Plot IntervalFormula for f (x )
2.25666
Intervals Midpoint Sum
Definition Computation
Number of subintervals (n) :
0
0.5
1
1.5
2
2.5
0 0.5 1 1.5 2
x
f(x)
n
ii xmf
1
)(
x f (x ) a b0 0 0 1.5
n x
500 0.00300
31
Plot IntervalFormula for f (x )
2.25000
Intervals Midpoint Sum
Definition Computation
Number of subintervals (n) :
0
0.5
1
1.5
2
2.5
0 0.5 1 1.5 2
x
f(x)
n
ii xmf
1
)(

Ekstrom Math 115b
Integration
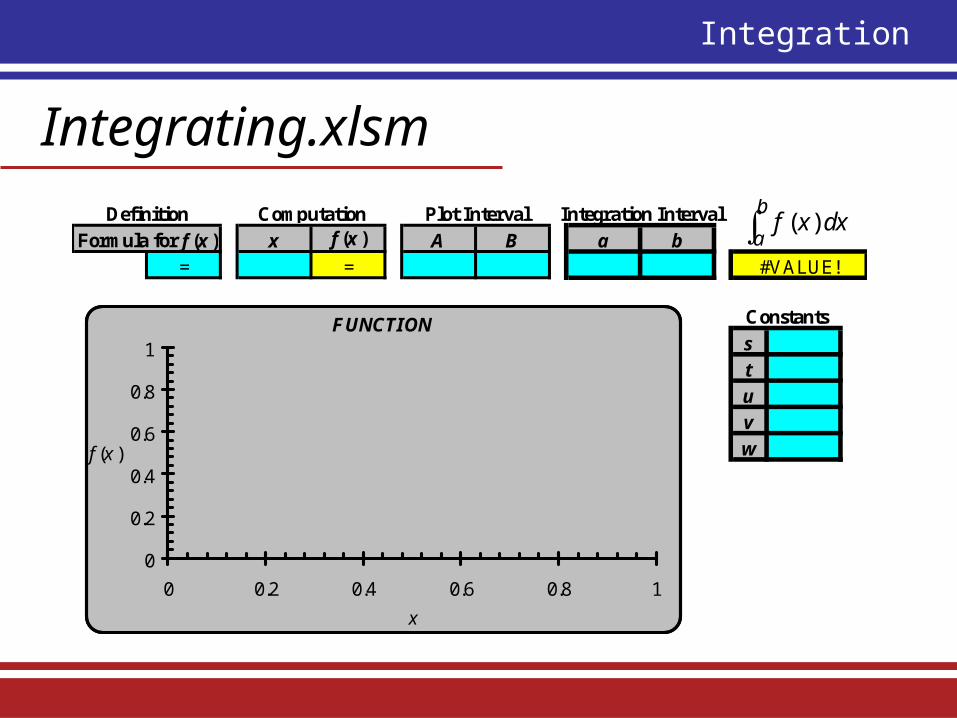
Integrating.xlsm
File is similar to Midpoint Sums.xlsm
Notation: or or…. b
adxxf
b
adttf
Ekstrom Math 115b
Integration
Integrating.xlsm
x f (x ) A B a b= =
stu
vw
3132
#VALUE!
Constants
Formula for f (x )
Integration IntervalDefinition Computation Plot Interval
FUNCTION
0
0.2
0.4
0.6
0.8
1
0 0.2 0.4 0.6 0.8 1
x
f (x )
dxxfb
a )(
Ekstrom Math 115b
Integration
Integrating.xlsm
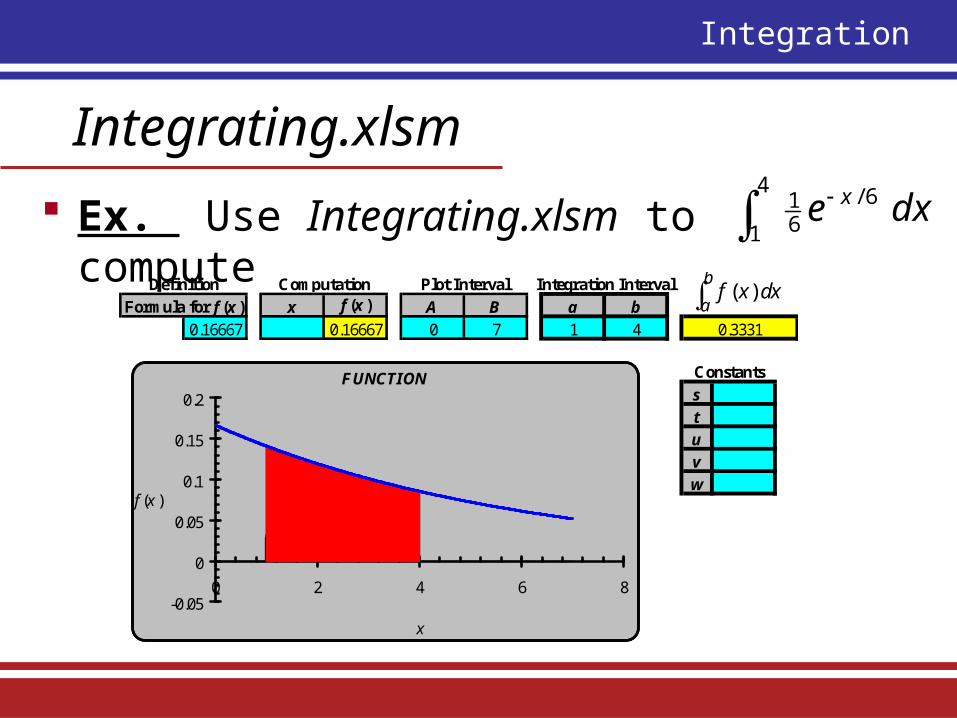
Ex. Use Integrating.xlsm to compute 4
1
6/61 dxe x
x f (x ) A B a b0.16667 0.16667 0 7 1 4
stuvw
3132
0.3331
Constants
Formula for f (x )Integration IntervalDefinition Computation Plot Interval
FUNCTION
-0.05
0
0.05
0.1
0.15
0.2
0 2 4 6 8
x
f (x )
dxxfb
a )(

Ekstrom Math 115b
Integration
Integrating.xlsm
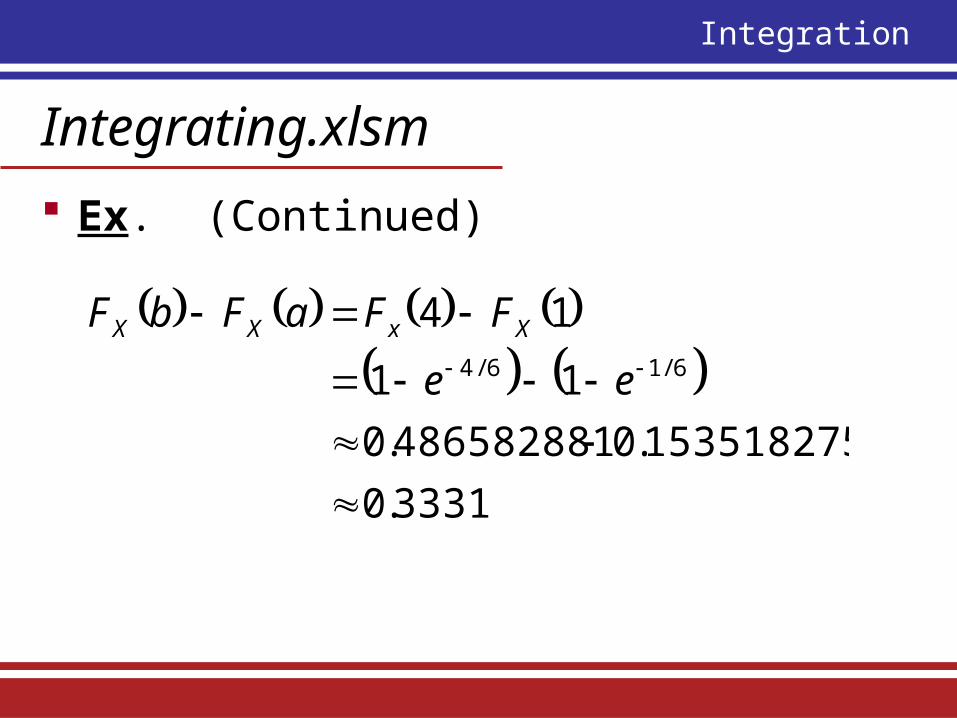
Ex. (Continued) So . Note that
is the p.d.f. of an exponential random variable with parameter . This area could be calculated using the c.d.f. function
3331.04
1
6/61 dxe x 6/
61 xe
6 aFbF XX
Ekstrom Math 115b
Integration
Integrating.xlsm
Ex. (Continued)
3331.0
1535182751.0486582881.0
11
146/16/4
ee
FFaFbF XxXX
Ekstrom Math 115b
Integration
Signed Area
Values from Midpoint Sums.xlsm can be positive, negative, or zero.
Values from Integrating.xlsm can be positive, negative, or zero.

Ekstrom Math 115b
Integration
Consumer Surplus
Ex. Suppose a demand function was found to be:
Determine the consumer surplus at a quantity of 400 units produced and sold.
196.321225.00001392. 2 qqqD

Ekstrom Math 115b
Integration
Consumer Surplus
Ex. (Continued)
x f (x ) A B a b321.196 321.196 0 910 0 400
stuvw
3132
107508.8000
Constants
Formula for f (x )Integration IntervalDefinition Computation Plot Interval
FUNCTION
-50
0
50
100
150
200
250
300
350
0 200 400 600 800 1000
x
f (x )
dxxfb
a )(
Total Revenue at 400 units produced and sold

Ekstrom Math 115b
Integration
Consumer Surplus
Ex. (Continued)
313233
FUNCTION
-50
0
50
100
150
200
250
300
350
0 200 400 600 800 1000
x
f (x )

Ekstrom Math 115b
Integration
Consumer Surplus
Ex. (Continued)
Calculate Revenue at 400 units:
60.83569$
924.208400
400400
D
qDqqR

Ekstrom Math 115b
Integration
Consumer Surplus
Ex. (Continued) Take total revenue possible and subtract
revenue at 400 units
$107,508.80 - $83,569.60 = $23,939.20
So the consumer surplus is $23,939.20

Ekstrom Math 115b
Integration
Consumer Surplus
Formula for consumer surplus:
0
0 0
qqRdqqD

Ekstrom Math 115b
Integration
Integration Application
Income Stream revenue enters as a stream take integral of income stream to get total
revenue/income

Ekstrom Math 115b
Integration
Fundamental Theorem of Calculus
The derivative of with respect to x is
applies to p.d.f.’s and c.d.f.’s
aFbFdxxf XX
b
a X
x
duuf0 xf

Ekstrom Math 115b
Integration
Project (What to do)
Calculate the consumer surplus to answer Question #5
Use Integrating.xlsm (watch units)
= 459.99 - 360.86 = $99.13 million
1262.27391414.5344440.034403020.000053491262.273
0
2 Rdqqq