eJournal of Tax Research - UNSW Business School · 319 Reforming the dark art of GST forecasting...
28
eJournal of Tax Research Volume 12, Number 2 November 2014 CONTENTS 285 Comparing the Swiss and United Kingdom cooperation agreements with their respective agreements under the Foreign Account Tax Compliance Act Adrian Sawyer 319 Reforming the dark art of GST forecasting Richard Eccleston and Timothy Woolley 335 Regulation of tax agents in Australia Michael Walpole and David Salter 359 Corporate profiling of tax-malfeasance: A theoretical and empirical assessment of tax-audited Australian firms Grant Richardson, Grantley Taylor and Christopher Wright 383 Determinants of tax compliance behavior of corporate taxpayers in Malaysia Noor Sharoja Sapiei, Jeyapalan Kasipillai and Uchenna Cyril Eze 410 Paying a fair share of tax and aggressive tax planning — A tale of two myths Kalmen Hyman Datt 433 Factors influencing taxpayers’ compliance with the tax system: An empirical study in Mekelle City, Ethiopia Tadesse Getacher Engida and Goitom Abera Baisa 453 Small business and tax compliance costs: A cross-country study of managerial benefits and tax concessions Chris Evans, Ann Hansford, John Hasseldine, Philip Lignier, Sharon Smulders and Francois Vaillancourt 483 Ethics codes and taxpayer charters: Increasing tax morale to increase tax compliance Kirsty Unger 499 The compliance costs of Value Added Tax (VAT): The case of the Republic of Mauritius Kumari Juddoo © School of Taxation and Business Law (Atax), UNSW Business School The University of New South Wales Australia ISSN 1448-2398
Transcript of eJournal of Tax Research - UNSW Business School · 319 Reforming the dark art of GST forecasting...

eJournal of Tax Research
Volume 12, Number 2 November 2014
CONTENTS
285 Comparing the Swiss and United Kingdom cooperation agreements with their respective agreements under the Foreign Account Tax Compliance Act Adrian Sawyer
319 Reforming the dark art of GST forecasting Richard Eccleston and Timothy Woolley
335 Regulation of tax agents in Australia Michael Walpole and David Salter
359 Corporate profiling of tax-malfeasance: A theoretical and empirical assessment of tax-audited Australian firms Grant Richardson, Grantley Taylor and Christopher Wright
383 Determinants of tax compliance behavior of corporate taxpayers in Malaysia Noor Sharoja Sapiei, Jeyapalan Kasipillai and
Uchenna Cyril Eze
410 Paying a fair share of tax and aggressive tax planning — A tale of two myths Kalmen Hyman Datt
433 Factors influencing taxpayers’ compliance with the tax system: An empirical study in Mekelle City, Ethiopia Tadesse Getacher Engida and Goitom Abera Baisa
453 Small business and tax compliance costs: A cross-country study of managerial benefits and tax concessions Chris Evans, Ann Hansford, John Hasseldine, Philip
Lignier, Sharon Smulders and Francois Vaillancourt
483 Ethics codes and taxpayer charters: Increasing tax morale to increase tax compliance Kirsty Unger
499 The compliance costs of Value Added Tax (VAT): The case of the Republic of Mauritius Kumari Juddoo
© School of Taxation and Business Law (Atax), UNSW Business School The University of New South Wales Australia
ISSN 1448-2398

eJournal of Tax Research (2014) vol 12, no. 2, pp. 383409
383
Determinants of tax compliance behaviour of corporate taxpayers in Malaysia
Noor Sharoja Sapiei1, Jeyapalan Kasipillai2 and Uchenna Cyril Eze3
Abstract This study focuses on the determinants of taxpayer compliance behaviour with respect to corporate income tax reporting requirements in Malaysia. A researcher-administered questionnaire survey method for data collection was utilised. The findings of this study reveal that business age, tax liability and tax complexity consistently influence the likelihood of tax non-compliance behaviour in the areas of under-reporting income, over-claiming expenses and overall non-compliance. Nonetheless, the tax compliance costs have an insignificant relationship with the non-compliance behaviour of corporate taxpayers. The remaining factors examined are significant determinants in at least one type of non-compliance behaviour.
1 Dr Noor Sharoja Sapiei is a senior lecturer in the Department of Accounting, Faculty of Business and
Accountancy, University of Malaya, Malaysia. 2 Professor Jeyapalan Kasipillai is a professor at Monash University Malaysia, an adjunct senior research
fellow at Monash University Australia, and serves as a council member of the Chartered Tax Institute of Malaysia.
3 Dr Uchenna Cyril Eze is an assistant professor at BNU-HKBU United International College, China.

eJournal of Tax Research Determinants of Tax Compliance Behaviour of Corporate Taxpayers in Malaysia
384
1. INTRODUCTION
The introduction of the self-assessment system (SAS), which replaced the official assessment system (OAS) from 2001, is a major reform of the Malaysian tax system since the inception of the Income Tax Act (ITA) in 1967.4 The SAS imposes greater accountability upon taxpayers in terms of computational, recordkeeping and filing requirements. Moreover, as tax officials are no longer reviewing all returns filed under the SAS, more resources are available for enforcement activities to ensure greater tax compliance. Tax compliance behaviour has always been an area of concern to tax policy makers, as non-compliance with reporting requirements affects revenue collection and the ability of the government to achieve its fiscal and social goals.5
Under self-assessment, various factors may have an impact on the level of tax compliance. To date, however, very few empirical studies to identify the determinants of corporate taxpayer compliance behaviour have been conducted, especially studies involving large corporations. Corporate Income Tax (CIT) is an important source of revenue for Malaysia’s federal government, accounting for about 50% of the Inland Revenue Board of Malaysia’s (IRBM) tax collection in 2009. This warrants research that can provide insight into the reasons for non-compliance among corporate taxpayers, hence contributing to the tax literature on CIT compliance behaviour in public companies. The relationships between corporate characteristics, tax compliance costs, attitudinal aspects and the compliance behaviour of Malaysian public listed companies (PLCs) are examined in this study.
2. LITERATURE REVIEW AND HYPOTHESES DEVELOPMENT
Tax compliance is defined as the accurate reporting of income and claiming of expenses in accordance with stipulated tax laws.6 Thus, the failure of corporations to accurately report or pay CIT is considered corporate tax non-compliance.7 There are two main approaches to understand tax compliance issues: the economic approach and behavioural approach. 8 The economic approach is premised on the concept of economic rationality, while the behavioural approach applies concepts from disciplines such as psychology and sociology.
The basic theoretical model applied in the economic approach is built on the work of Becker (1968) who analysed criminal behaviour using an economic framework known as the economics-of-crime model.9 Allingham and Sandmo first employed this model in the context of tax compliance study in 1972.10 The model is based on an expected 4 Kasipillai J, A comprehensive guide to Malaysian taxation under self-assessment system (2nd ed,
McGraw Hill, Selangor, 2005) pp 3133. 5 Tan LM and Sawyer AJ, “A synopsis of taxpayer compliance studies ― overseas vis-à-vis New Zealand”
(2003) 9(4) New Zealand Journal of Taxation Law and Policy 431. 6 Alm J, “A perspective on the experimental analysis of taxpayer reporting” (1991) 66(3) Accounting
Review 577. 7 Slemrod J, “The economics of corporate tax selfishness” (2004) 62(4) National Tax Journal 878. 8 James S, Hasseldine J, Hite P and Toumi M, “Developing a tax compliance strategy for revenue services”
(2001) 55(4) Bulletin for International Fiscal Documentation 158. 9 Becker GS, “Crime and punishment: An economic approach” (1968) 76(2) Journal of Political
Economy 169217. 10 Allingham MG and Sandmo A, “Income tax evasion: A theoretical analysis” (1972) 1(34) Journal of
Public Economics 323-338.

eJournal of Tax Research Determinants of Tax Compliance Behaviour of Corporate Taxpayers in Malaysia
385
utility theory and a deterrence theory. The expected utility theory views taxpayers as perfectly amoral utility maximisers, who choose to evade taxes whenever the expected gain exceeds the cost of evasion (Allingham & Sandmo, 1972). 11 The deterrence theory is concerned with the effects of sanctions and sanction threats (Cuccia, 1994),12 where an increase in the severity of penalties and the certainty of their imposition will discourage undesirable behaviour (Pate & Hamilton, 1992). 13 Their theoretical analysis suggested that punishment and/or sanctions determined taxpayer compliance behaviour and that an increase in the penalty rate and a greater probability of detection would result in lower non-compliance.
Almost all economic approaches to tax compliance continued with this framework.14 Within the framework, the tax rate, the probability of detection and the penalty structure determine the monetary cost of compliance, which in turn determines taxpayer compliance behaviour.15 This framework was configured as the financial self-interest model (Figure 1). It has become a prominent approach in investigating taxpayer compliance behaviour. Based on this model, compliance behaviour was determined by the rational economic consideration of perceived costs and benefits derived from the specific action of taxpayers.
Figure 1: Financial Self-Interest Model
Source: Fischer, Wartick and Mark (1992, p.3)
In contrast, the behavioural approach assumes that individuals are not simply independent, selfish, utility maximizes but that they interact according to differing attitudes, beliefs, norms and roles (Elffers, 1991). 16 The behavioural perspective incorporates sociological and psychological factors, such as age, gender, ethnicity, education, culture, institutional influence, peer influence, ethics and tax morale, as factors that may affect taxpayer compliance behaviour (Figure 2).17 This model is 11 Allingham and Sandmo, n 7 at 331-332. 12 Cuccia AD, “The effects of increased sanctions on paid tax preparers: Integrating economic and
psychological factors” (1994) 16(1) The Journal of the American Tax Association 41-66. 13 Pate AM and Hamilton EE, “Formal and Informal Deterrents to Domestic Violence: The Dade County
Spouse Assault Experiment” (1992) 57(5) American Sociological Review 692. 14 See for example, Hanlon M, Mills L and Slemrod J, An empirical examination of corporate tax non-
compliance (Working Paper No.1025, University of Michigan, 2005). See also Joulfaian D, “Corporate income tax evasion and managerial preferences” (2000) 82(4) The Review of Economic Statistics 698-701.
15 Fischer C, Wartick M and Mark M, “Detection Probability and Taxpayer Compliance: A Review of the Literature” (1992) 11(1) Journal of Accounting Literature 3.
16 Elffers H, Weigel RH and Hessing DJ, “The Consequences of Different Strategies for Measuring Tax Evasion Behaviour” (1992) 8(3) Journal of Economic Psychology 318– 319.
17 Fischer, Wartick and Mark, n 12 at 3. The authors expanded the financial self-interest model by incorporating economic, sociological and psychological variables.

eJournal of Tax Research Determinants of Tax Compliance Behaviour of Corporate Taxpayers in Malaysia
386
significant as it predicts that demographic variables indirectly influence tax compliance behaviour through their effects on non-compliance opportunities and attitudes.
Figure 2: Expanded Model of Taxpayer Compliance
Source: Fischer et al. (1992, p.4)
Both the economic and behavioural approaches have contributed to the understanding of tax compliance behaviour. A study designed on a blend of both approaches seems most appropriate as a single approach is not likely to be totally effective in explaining the compliance behaviour of taxpayers.18 In addition, examining taxpayer behaviour is complex and challenging as the relevant literature emanates from a variety of disciplines including economics, psychology, and sociology.19
Empirical literature on tax compliance has been concerned mainly with individual taxpayers while the analysis of corporate tax compliance has been rather neglected. Despite evidence that corporations have accounted for an increasingly larger portion of total tax evasion as compared to individual taxpayers, the finding has not attracted scholarly analysis.20 Rice21 suggested that the difficulty in capturing analytically the non-compliance decisions of corporate taxpayers was a possible explanation for the lack of research on corporate tax evasion. Nonetheless, tax compliance studies on individual taxpayers have provided a formal framework to analyse the compliance decisions of corporate taxpayers.22 A review of the extensive literature on factors affecting individual tax compliance behaviour uncovered three main categories of determinants of such behaviour. These categories include demographic, economic and
18 Hasseldine J and Bebbington KJ, “Blending economic deterrence and fiscal psychology models in the
design of responses to tax evasion: the New Zealand experience” 1991 12(2) Journal of Economic
Psychology 320. 19 McKerchar M, Hodgson H and Datt K, “Is there a perception of revenue bias on the part of the ATO in
private binding rulings on large, complex issues?” 2008 23(3) Australian Tax Forum 312. 20 Rice E, “The corporate tax gap: Evidence on tax compliance by small corporations” in Slemrod J (ed),
Why people pay taxes: Tax compliance and enforcement (University of Michigan Press, Ann Arbor, 1992) p 126.
21 Rice, n 17. 22 See for example, Rice, n 17 at 127. See also Kamdar N, “Corporate income tax compliance: A time
series analysis” (1997) 25(1) Atlantic Economic Journal 38.

eJournal of Tax Research Determinants of Tax Compliance Behaviour of Corporate Taxpayers in Malaysia
387
behavioural determinants.23 Demographic determinants include age, gender, education and occupation, while economic determinants include income level, income source, tax rates and sanctions. Behavioural determinants include complexity, fairness, revenue authority contact, peer influence and ethics.
Rice24 examined the nature of medium-sized corporations that evade income tax in the US, measured in terms of unreported income. Micro-data from the 1980 Taxpayer Compliance Measurement Program (TCMP) database, accessible from the Internal Revenue Service (IRS), were utilised for the study. 25 Employing a similar measurement, Joulfaian26 used managers’ understatements of their personal income tax as proxies for corporate tax non-compliance. The study investigated the relationship between managerial preferences, corporate characteristics and undeclared income.
Studies reviewed in this paper on the tax compliance of corporate taxpayers, except for Abdul-Jabbar,27 utilised government reported data and were conducted in the US.28 Rice29 and Joulfaian30 utilised the TCMP data, while Kamdar31 and Hanlon, Mills and Slemrod32 were based on the annual report of IRS reported data. Tax non-compliance in these US studies was measured by either determining the undeclared amount of corporate net income,33 or by using the tax deficiencies found by the IRS during audits.34
These approaches, however, were subject to data limitations due to confidentiality requirements surrounding taxpayer returns 35 and restricted access to IRS audit selection criteria.36 Other issues surrounding the use of these data included ambiguity of what is considered actual non-compliance, the possibility of mistakes in characterising legitimate tax planning as non-compliance, and some under-reporting of income that may not be detected through tax audits. 37 The question is whether government-reported data obtained through financial audits would be able to accurately measure the tax compliance decisions of corporate taxpayers.
23 Richardson G, “Determinants of tax evasion: A cross-country investigation” (2006) 15(2) Journal of
International Accounting, Auditing and Taxation 151. 24 Rice, n 17. 25 TCMP data were based on studies conducted by the IRS to estimate revenue loss because of tax
evasion through line-by-line audits of tax returns. 26 Joulfaian, n 11 at 699. 27 Abdul-Jabbar H, Income tax non-compliance of small and medium enterprises in Malaysia:
Determinants and tax compliance costs (Unpublished thesis, Curtin University of Technology, Perth, Australia, 2009).
28 Government-reported data, also known as tax audits, rely on data within and/or compiled through audit activities conducted by the tax authorities.
29 Rice, n 17. 30 Joulfaian, n 11. 31 Kamdar, n 18. 32 Hanlon, Mills and Slemrod, n 11. 33 See Rice, n 17 and Joulfaian, n 11. 34 See Kamdar, n 18 and Hanlon, Mills and Slemrod, n 11. 35 Hite PA, “An examination of the impact of subject selection on hypothetical and self-reported taxpayer
non-compliance” (1988) 9 Journal of Economic Psychology 446. 36 Kamdar, n 18. 37 Slemrod J, “Cheating ourselves: The economics of tax evasion” 2007 21(1) Journal of Economic
Perspectives 3132.

eJournal of Tax Research Determinants of Tax Compliance Behaviour of Corporate Taxpayers in Malaysia
388
Despite any shortcomings, findings from prior studies have provided evidence of the factors affecting the reporting decisions of corporations. Rice 38 found that profit performance influenced tax compliance but did not observe a relationship between firm size and tax compliance. Tax compliance was positively associated with public disclosure and negatively associated with the marginal tax rate. A study by Kamdar39 discovered that audit rates and profit performance had a positive and significant impact on tax compliance. No significant relationships were found between tax compliance and true income, marginal tax rates, probability of detection, penalties and other socio-economic factors. The author suggested that greater audit coverage could act as an effective deterrent to corporate non-compliance, resulting in a substantial rise in tax revenues.
Joulfaian40 ascertained that non-compliant corporations are more likely to be managed by executives who have failed to comply with their individual income tax obligations, and vice-versa. The author proposed future studies to include managerial preferences as one of the tax compliance determinants. Moreover, marginal tax rates, audit rate, firm size and income level were all found to influence non-compliance behaviour; foreign ownership was not. Another US study by Hanlon, Mills and Slemrod, 41 estimated corporate non-compliance to be 13% of the tax liability, as measured by deficiencies proposed upon audit investigation. The non-compliance rate for corporations, relative to their size, was U-shaped: larger companies were observed to be more non-compliant than their smaller counterparts, but medium-sized companies had the lowest non-compliance rate. According to the authors, the unexpected finding was connected with the opportunity for non-compliance. Concerning corporate characteristics, size, industry, multi-nationality, being publicly traded, the presence of intangible assets and executive compensation determined corporate compliance behaviour. Two other corporate characteristics, effective tax rates and the quality of governance, had no effect on the compliance behaviour of corporate taxpayers.
Given the limitations and confidentiality issues associated with using government data in Malaysia, Abdul-Jabbar42 examined the corporate tax non-compliance of SMEs using a survey approach. He adopted hypothetical tax scenarios in measuring tax compliance behaviour. Abdul-Jabbar 43 concluded that tax complexity and the probability of a tax audit significantly influenced non-compliant behaviour, while the reverse was true for business size, tax level, compliance costs and perceived tax fairness. His findings on the impact of business age, industry sector, tax rate and incentives on the compliance behaviour of corporate SMEs were inconclusive.
A review of the literature found that limited empirical research was utilised to evaluate the compliance behaviour of corporate taxpayers. The majority of tax compliance literature focused on the determinants of tax compliance behaviour of individual taxpayers. Findings from limited studies using the compliance data of large corporate taxpayers have provided some evidence of the determinants of the compliance behaviour of corporate taxpayers. Some of the main determinants are corporate characteristics (such as firm size, industry sector, multi-nationality, and whether the
38 Rice, n 17 at 151-152. 39 Kamdar, n 18 at 46. 40 Joulfaian, n 11 at 701. 41 Hanlon, Mills and Slemrod, n 11 at 29. 42 Abdul-Jabbar, n 23. 43 Abdul-Jabbar, n 23 at 189180
eJournal of Tax Research Determinants of Tax Compliance Behaviour of Corporate Taxpayers in Malaysia
389
firm is publicly traded), and economic characteristics (such as marginal tax rates, audit rates and penalty rates).
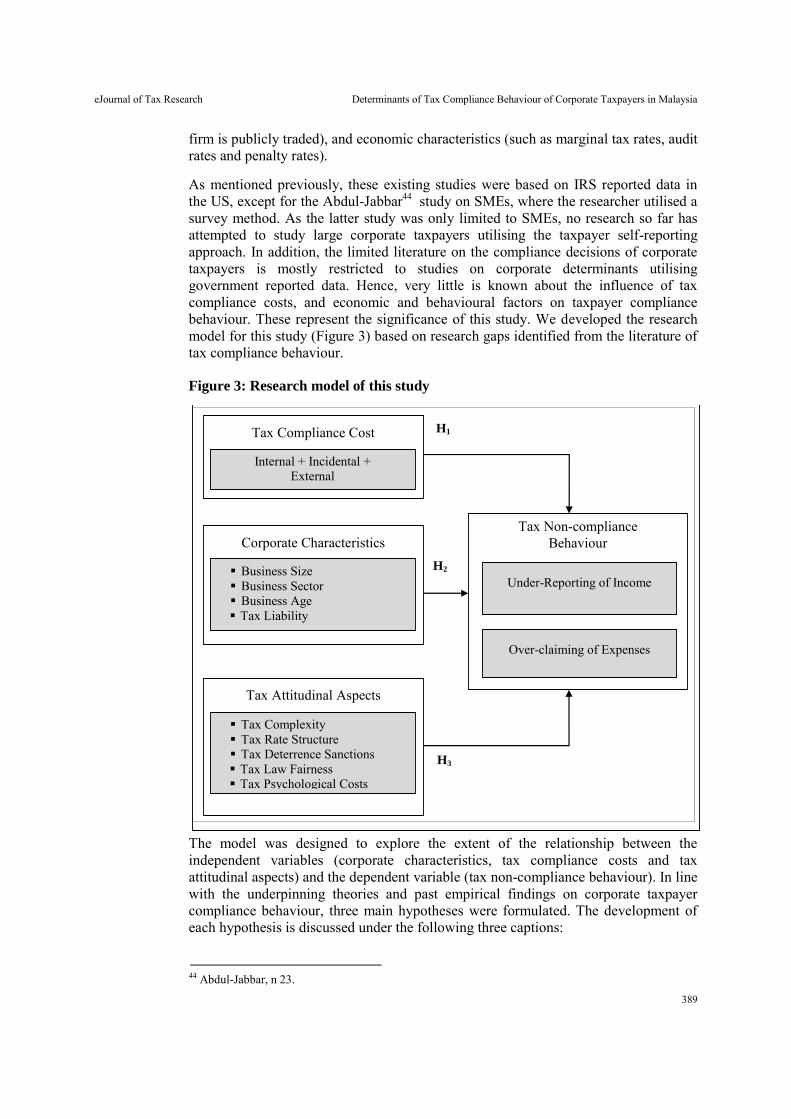
As mentioned previously, these existing studies were based on IRS reported data in the US, except for the Abdul-Jabbar44 study on SMEs, where the researcher utilised a survey method. As the latter study was only limited to SMEs, no research so far has attempted to study large corporate taxpayers utilising the taxpayer self-reporting approach. In addition, the limited literature on the compliance decisions of corporate taxpayers is mostly restricted to studies on corporate determinants utilising government reported data. Hence, very little is known about the influence of tax compliance costs, and economic and behavioural factors on taxpayer compliance behaviour. These represent the significance of this study. We developed the research model for this study (Figure 3) based on research gaps identified from the literature of tax compliance behaviour.
Figure 3: Research model of this study
The model was designed to explore the extent of the relationship between the independent variables (corporate characteristics, tax compliance costs and tax attitudinal aspects) and the dependent variable (tax non-compliance behaviour). In line with the underpinning theories and past empirical findings on corporate taxpayer compliance behaviour, three main hypotheses were formulated. The development of each hypothesis is discussed under the following three captions:
44 Abdul-Jabbar, n 23.
Tax Non-compliance Behaviour
Tax Compliance Cost
Internal + Incidental + External
Corporate Characteristics
Business Size Business Sector Business Age Tax Liability
Tax Attitudinal Aspects
Tax Complexity Tax Rate Structure Tax Deterrence Sanctions Tax Law Fairness Tax Psychological Costs
Under-Reporting of Income
Over-claiming of Expenses
H1
H2
H3

eJournal of Tax Research Determinants of Tax Compliance Behaviour of Corporate Taxpayers in Malaysia
390
2.1 Tax compliance costs and non-compliance behaviour
Tax compliance costs are those incurred by taxpayers due to their obligations to comply with a country’s relevant tax laws. The term ‘corporate tax compliance costs’ refers to the value of resources expended by corporate taxpayers in complying with tax regulations.45 Tax compliance costs consist of internal costs (value of time spent by company staff on tax matters), external costs (fees paid to external tax professionals) and incidental costs (stationery items, computer, telephone and litigation costs). Some of the theoretical literature has suggested tax compliance costs as a possible determinant of tax compliance behaviour.46 These authors have proposed that the level of compliance costs could potentially be one of the factors affecting the compliance decisions of corporate taxpayers. As such, Hypothesis 1 (H1) was formulated as follows:
H1 : A reduction in tax compliance costs reduces the level of non-compliance
among corporate taxpayers.
2.2 Corporate characteristics and non-compliance behaviour
A review of past literature identified some corporate characteristics as determinants of corporate taxpayer compliance decisions. Even though there are mixed results from the limited study of corporate taxpayer compliance behaviour, the empirical findings identified some characteristics that influence taxpayer compliance levels.47 The results also highlighted that the significance of the relationship between the determinants and tax compliance behaviour should be confirmed through empirical work in other tax jurisdictions and/or the study of other types of taxpayers. As such, Hypothesis 2 (H2) and the sub-hypotheses were formulated as follows:
H2 : There is a relationship between corporate characteristics and non-
compliance of corporate taxpayers.
H2a : There is a relationship between business size and non-compliance of
corporate taxpayers.
H2b : There is a relationship between business sectors and non-compliance of
corporate taxpayers.
H2c : There is a relationship between business length and non-compliance of
corporate taxpayers.
H2d : There is a relationship between business tax liability and non-
compliance of corporate taxpayers.
45 Tran-Nam B and Glover J, “Tax reform in Australia: Impacts of tax compliance costs on small business”
2002 5(3) Journal of Australian Taxation 342. 46 See for example, Slemrod, n 4. See also, Tran-Nam B, “Tax compliance research: An economic
perspective” 2003 9(4) New Zealand Journal of Taxation Law and Policy 455468. 47 See Abdul-Jabbar, n 23, Hanlon, Mills and Slemrod, n 11, Joulfaian, n 11 and Rice, n 17.

eJournal of Tax Research Determinants of Tax Compliance Behaviour of Corporate Taxpayers in Malaysia
391
2.3 Tax attitudinal aspects and non-compliance behaviour
There are propositions in the literature suggesting that the compliance behaviour of taxpayers is also influenced by their attitudes and perceptions.48 In order to address the research problem comprehensively, this study attempted to validate a number of propositions that were tested in earlier tax compliance behaviour studies. The propositions are grouped into tax attitudinal aspect variables consisting of perceptions on tax law complexity, fairness in the tax rate structure, tax deterrence sanctions, tax law fairness and tax psychological costs. As such, Hypothesis 3 (H3) and the sub-hypotheses were formulated as follows:
H3 : There is a relationship between tax attitudinal aspects and non-
compliance of corporate taxpayers.
H3a : There is a relationship between perceived tax complexity and non-
compliance of corporate taxpayers.
H3b : There is a relationship between perceived tax deterrence sanctions and
non-compliance of corporate taxpayers.
H3c : There is a relationship between perceived fairness in the tax rate
structure and non-compliance of corporate taxpayers.
H3d : There is a relationship between perceived fairness of the tax system and
non-compliance of corporate taxpayers.
H3e : There is a relationship between perceived level of psychological costs
and non-compliance of corporate taxpayers.
3. RESEARCH METHOD
Three main approaches have been employed in tax compliance research: experimental, survey and tax audit approaches.49 Each of these approaches has been employed in tax research with its own merits and limitations. An experimental approach was unsuitable for this study because students were normally used as experimental subjects, which is only appropriate for studies related to individual taxpayers. A tax audit approach was not possible, given the confidentiality requirements surrounding corporate tax returns and the limitation in utilising IRBM data. Therefore, a survey approach which has been used in prior studies to measure tax compliance behaviour of corporate taxpayers was deemed most appropriate for this study.50
48 Ajzen I and Fishbein M “Attitude-behaviour relations: A theoretical analysis and review of empirical
research” (1977) 84(5) Psychological Bulletin 899-900. 49 See Elffers H, Robben HJ and Hessing DJ, “On measuring tax evasion” (1992) 13 Journal of Economic
Psychology 545. 50 Richardson M and Sawyer AJ, “A taxonomy of the tax compliance literature: further findings,
problems and prospects” 2001 16(2) Australian Tax Forum 150151.

eJournal of Tax Research Determinants of Tax Compliance Behaviour of Corporate Taxpayers in Malaysia
392
3.1 Research sampling design
The target population for this study was large corporate taxpayers registered with the IRBM. The population of corporate taxpayers registered with the IRBM as at 31 December 2009 totalled 451,488 companies,51 while there were 4,582 large companies in Malaysia.52 The sample of corporate taxpayers was drawn from the ‘Malaysian Top 500 Largest Listed Corporations 20082009’ published directory.53 Companies in East Malaysia (Sabah and Sarawak) were excluded from the main sample due to budgetary and time constraints. Sectors with fewer companies were excluded due to the low level of representation. These sectors included infrastructure project companies, hotels, closed-end funds and mining companies. After excluding these companies and sectors, the final sample numbered 473 companies.
3.2 Research instruments
In designing the research instruments, the available questionnaires on tax compliance behaviour were considered first. 54 The questions, with some innovations and modifications made to them to account for the specific characteristics of the Malaysian corporate tax system, focused on factors that were considered relevant to this study of large corporate taxpayers. The questionnaire comprised four parts, referred to as Parts A to D. Part A consisted of questions about the costs of complying with corporate income tax law. Part B elicited information on respondents’ perceptions and opinions on a number of tax attitudinal aspects and Part C sought information on compliance behaviours of corporate taxpayers. Part D consisted of questions regarding the economic and demographic characteristics of companies.
3.3 Measurement of variables
The measurement of variables was based on the established sources of reference (Table 1).
Table 1: Variables and sources of reference
Variables Main Sources of Reference
Tax Compliance Costs Evans, Ritchie, Tran-Nam and Walpole (1997); Pope (1993)
Tax Attitudinal Aspects Christensen et al. (1994);Christensen and Hite (1997); Roberts (1994); Yesegat (2009)
Tax Compliance Behaviours Chan, Troutman and O’Bryan (2000); Kaplan, Newberry and Reckers (1997)
3.3.1 Tax compliance costs
In this study, the measurement of estimated tax compliance costs applied most of the techniques employed by established researchers who have carried out studies in this 51 Inland Revenue Board Malaysia (IRB), Annual Report 2009. (Inland Revenue Board Malaysia) at
http://www.hasil.gov.my/ 52 Department of Statistics Malaysia, 2011. Census of establishment and enterprises. Kuala Lumpur. 53 The sampling frame from the IRBM’s database of registered corporate taxpayers would provide a
better sample but the researcher was not able to obtain the information due to confidentiality reasons. 54 See for example, Abdul-Jabbar, n 23.

eJournal of Tax Research Determinants of Tax Compliance Behaviour of Corporate Taxpayers in Malaysia
393
field.55 Consistent with these studies, computations of compliance costs for corporate taxpayers included all measurable components, namely, the internal, external and incidental costs of tax compliance activities (Table 2).
Table 2: Cost components and cost computations
Cost Components Cost Computations
Internal Computed by multiplying annual time spent on tax activities to their respective hourly wage rate.
Incidental Computed by adding costs incurred within companies and by external tax professionals.
External Money cost charged by external tax professionals solely on tax activities
3.3.2 Tax attitudinal aspects
Measurement of tax attitudinal aspects refers to the measurement of the managerial attitudes of respondents towards some features of taxation. The description of each aspect and the sources referred to in the development of questions regarding attitudinal aspects were based on a number of earlier tax compliance studies (Table 3). 56 Respondents were requested to indicate their agreement or disagreement with each statement using a six-point Likert scale.
3.3.3 Tax compliance behaviour
In this study, tax compliance behaviour was measured by gathering responses from hypothetical tax scenarios. These scenarios were introduced to mitigate the sensitive nature of the questions involved so that respondents would be more likely to provide truthful responses. 57 As most corporations would have strong incentives to avoid revealing their non-compliance decisions, any direct measures would invariably suffer from substantial measurement errors.58 In this study, a modified version of the non-compliance scenarios developed by Chan, Troutman and O’Bryan59 for individuals was utilised to gather data on the hypothetical non-compliance behaviour of corporate taxpayers. The respondents were requested to read two tax non-compliance scenarios
55 See Evans C, Ritchie K, Tran-Nam B and Walpole M, A report into taxpayer costs of compliance
(Australian Government Publishing Service, Canberra, 1997). See also, Pope J, The compliance costs of major Commonwealth taxes in Australia. (Unpublished thesis, Curtin University of Technology, Perth, Australia, 1993).
56 See Christensen AL, Weihrich SG and Gerbing MD, “The impact of education on perceptions of tax fairness” (1994) 6(3) Advances in Taxation 63-94; Christensen AL and Hite P, “A study of the effect of taxpayer risk perceptions on the ambiguous compliance decisions” (1997) 19(1) Journal of the
American Taxation Association 1-18; Roberts ML, “An experimental approach to changing taxpayers’ attitudes towards fairness and compliance via television” (1994) 16(1) The Journal of the American
Taxation Association 67-86; and Yesegat WA, Value added tax in Ethiopia: A study of operating costs and compliance (Unpublished thesis. ATAX, University of New South Wales, Sydney, Australia, 2009).
57 Kaplan SE, Reckers PMJ and Roark SJ, “An attribution theory analysis of tax evasion related judgments” (1988) 13(4) Accounting, Organizations and Society 372.
58 Rice, n 17 at 126. 59 Chan CW, Troutman CS and O’Bryan D, “An expanded model of taxpayer compliance: Empirical
evidence from the United States and Hong Kong” (2000) 9(2) Journal of International Accounting,
Auditing and Taxation 83103.

eJournal of Tax Research Determinants of Tax Compliance Behaviour of Corporate Taxpayers in Malaysia
394
about the under-reporting of income and the over-claiming of expenses.60 61 The extent of agreement with the under-reporting of income and the over-claiming of expenses was measured via a six-point Likert scale. Higher scores would indicate likely non-compliance behaviour and vice-versa.
Table 3: Sources of reference for tax attitudinal variables
Variables Description Item Source
Tax Complexity
Perception on the presence of complexity in the Malaysian tax system amongst corporate taxpayers and it was measured in relation to three dimensions comprising the complexity in income tax returns, income tax law and varying groups of taxpayers.
Christensen et al. (1994)
Tax Rate Structure
Perception on the fairness in the Malaysian corporate tax structure amongst corporate taxpayers and it was measured in relation to three rate structures: flat (Rate 1), proportional (Rate 2) and progressive (Rate 3).
Christensen et al. (1994)
Tax Deterrence Sanctions
It refers to three sanction variables, namely audit likelihood, detection likelihood and penalty severity. It was measured in relation to three dimensions, comprising respondents’ perceptions on the chances of their company being audited; discrepancy being identified during compulsory tax audit and severity of penalty.
Christensen and Hite (1997)
Tax Law Fairness
Perceptions on fairness of the corporate tax system in Malaysia was measured in relation to three dimensions, which comprises respondents’ perception on company officers’ moral obligations, fairness under the SAS environment, and amount of taxes paid over the years.
Roberts (1994)
Tax Psychological Costs
Perceptions on the level of stress and anxiety caused by the income tax system.
Yesegat (2009)
3.4 Data collection
The questionnaires used in this study were validity-tested in previous studies. 62 Nonetheless, pre-testing using expert judges, as suggested by Hair, Black, Babin and Anderson,63 was conducted in this study. This was to ensure their suitability for use in the context of Malaysian PLCs. Based on the feedback obtained from each pre-test 60 The tax non-compliance scenario about the under-reporting of income (Scenario 1): ‘Mr. A, a self-
employed businessman is considering not disclosing a cash sale of RM100,000 as his business income in his 2009 tax return. Legally, the cash receipt of RM100,000 should be included as business income. However, he is almost certain that the tax authority will not audit him and would not know if the amount is not disclosed.’
61 The tax non-compliance scenario about over-claiming of expenses (Scenario 2): ‘Mr. B, a self-employed businessman, had incurred RM10,000 to repair his personal van. In preparing his 2009 tax return, he is thinking about claiming the cost of the repair as if the van was used in his business. Legally, such a claim is not allowable, but he is almost certain that he will not be audited and that the tax authority would not be able to detect the deduction.’
62 See for example, Abdul-Jabbar, n 23. 63 Hair JF, Black WC, Babin BJ and Anderson RE, Multivariate data analysis: a global perspective (7th
ed, Prentice Hall, 2010).

eJournal of Tax Research Determinants of Tax Compliance Behaviour of Corporate Taxpayers in Malaysia
395
conducted, several minor amendments (such as changing the order of questions, highlighting key terms and rewording questions) was made to improve the ease of response.
Data collection for this study utilised the researcher-administered questionnaire survey method. This method of data collection was employed as a measure to obtain more reliable survey responses with a possibility of achieving a higher response rate, thus improving the validity of this study.64 In most cases, questionnaires were personally distributed to ascertain the person’s willingness to participate in this study.65 This arrangement also provided the opportunity for researchers to explain verbally on the importance of the study. Researchers might cautiously provide some clarifications and/or examples, when required, with respect to certain difficult, sensitive or important questions. To avoid bias in this study, however, the researchers only got involved when respondents asked for clarification. The respondents themselves inserted the completed questionnaires into sealed envelopes, in order to protect their anonymity.
4. RESULTS AND FINDINGS
A total number of 101 responses were obtained, representing an overall response rate of 21.4%. However, after removing three incomplete responses, the usable response rate was 20.7%. Based on the response rate achieved in similar existing studies, and due to the small population size of listed companies, the response rate achieved by this study was considered acceptable.66 Prior to data entry, all completed questionnaires were examined for missing values and the accuracy of data. Follow-up telephone calls and electronic messages were made to address missing items and to clarify matters of perceived incorrect responses. Normal probability plots and box-plots were utilised to identify outliers in the data set. The respective respondents with outlier response(s) were contacted for clarification.
4.1 Respondents’ profile
Based on data from 98 usable surveys, descriptive statistics of the sample were obtained in order to understand the demographic background of the respondents in this study (Table 4).
The majority of respondents involved in this study were finance and tax managers (53.1%), followed by accountants (33.7%) and chief financial officers (13.3%). The survey data acquired were considered acceptable, as the responses were obtained from persons with knowledge and experience in handling the tax matters of their respective companies. The highest response rate was gathered from respondents in the services sector (33.7%), followed by the manufacturing sector (31.6%) and the property and construction sectors (21.4%). The services and manufacturing sectors accounted for
64 Oppenheim AN, Questionnaire design, interviewing, and attitude measurement (St. Martin’s Press,
New York City, 1992). 65 Data collection from 98 respondents was conducted primarily through self-administered survey. Due
to time constraint, some of the questionnaires were administered via ordinary mail or e-mail. 66 The usual response rates for business studies, and for international and Asian tax studies is around 10%
to 20%, 25% to 35% and 14% to 26%, respectively (Abdul-Jabbar, n 23).

eJournal of Tax Research Determinants of Tax Compliance Behaviour of Corporate Taxpayers in Malaysia
396
more than 65% of the sample population, while only one response was received from the technology sector.
Table 4: Descriptive statistics of the sample
Items Categories Frequency Percentage
Respondents’ Designation
Chief Financial Officer Finance/Tax Manager Accountant
13 52 33
13.3 53.1 33.6
Sector
Manufacturing Services Property and Construction Finance and Banking Plantation and Agriculture Technology
31 33 21 6 6 1
31.6 33.7 21.4
6.1 6.1 1.1
Sales Turnover (Million)
Less than MYR100 MYR100 to MYR500 MYR500 to MYR1,000 More than MYR1,000
31 36 15 16
31.6 36.7 15.3 16.3
Business Length
Less than 15 years 15 to 30 years More than 30 years
21 54 23
21.4 55.1 23.5
Tax Liability (Million)
Nil Less than MYR5 MYR5 to MYR10
More than MYR10
9 47 24 18
9.2 48.0 24.5 18.4
Sources of Income Tax Work
Internal only External only Internal and External
5 24 69
5.1 24.5 70.4
Total 98 100.0
As for the size of business, the highest response rate was from respondents in companies with an annual sales turnover level of between MYR100 million and MYR500 million (36.7%), followed by those from companies with an annual sales turnover level of less than MYR100 million (31.6%). The remaining respondents were from companies in the top two levels of annual sales turnover, with almost equal representation in each category (15.3% and 16.3%, respectively). Respondents were requested to indicate the length of time their company had been in operation. The majority of companies (55.1%) had been in operation for at least 15 years, while 23.5% had been in operation for more than 30 years. Only 21.4% of companies were in the ‘Less than 15 years’ category. This signifies that the sample companies had adequate experience in dealing with tax related issues. As for tax liability, 9.2% of companies had a nil tax liability for the year of assessment 2009. Nearly one-half of companies (48%) indicated their tax liability to be less than MYR5 million.
With respect to sources of income tax work, some companies handled their tax affairs internally, some completely outsourced their tax-related activities and a large proportion of corporate taxpayers made use of both sources. Almost 95% of the respondent companies employed external tax professionals, while more than 70%

eJournal of Tax Research Determinants of Tax Compliance Behaviour of Corporate Taxpayers in Malaysia
397
utilised both internal resources and external tax professionals to deal with their income tax matters. Twenty-four companies completely outsourced their tax-related activities, while only five companies were very dependent on their internal tax expertise.
Overall, reasonable variations were seen in corporate characteristics such as industry classification, annual sales turnover, length of time in business, tax liability and sources of income tax work.
4.2 Descriptive analysis of the variables
This section provides descriptive analysis of the variables of this study, namely tax compliance costs, tax attitudinal aspects and tax compliance behaviour.
4.3 Tax compliance costs
The estimation of tax compliance costs for each company was the summation of its measurable internal, external and incidental cost components. The estimates of tax compliance costs at the company level ranged widely, from a low of MYR10,506 (AUD3,420)67 to a high of MYR155,790 (AUD50,713), with a mean of MYR47,126 (AUD15,340). The largest share of estimated mean compliance costs by cost component was related to external costs (57.1%), followed by internal costs (38.2%). Only a small portion (4.7%) was related to incidental costs in complying with tax laws. The overall mean compliance cost for each company by cost component was MYR55,886 (AUD18,192).
4.4 Tax attitudinal aspects
Concerning the tax attitudinal variable, each aspect was analysed using the mean, median and standard deviation scores (Table 5). Perceptions of tax psychological costs yielded the highest mean (3.96), followed by tax law fairness (3.87), tax complexity (3.53), tax rate structure (3.15) and lastly, tax deterrence sanctions (2.98). Fairness in the tax rate structure was perceived to be marginally fair, while tax deterrence sanctions (audit likelihood, deterrence likelihood and penalty severity) were perceived to be marginally low. A Cronbach’s alpha value of between 0.699 and 0.899 (Table 5) indicates that the measurements employed in this study are reliable and consistent. The Alpha Coefficient values of 0.60 to 0.70 are deemed to be at the lower limit of acceptability.68
In assessing construct validity, a factor analysis conducted using a rotated component matrix supported the four subscales of tax attitudinal aspects: tax complexity, tax rate structure, tax deterrence sanctions and tax law fairness (Table 6). The Kaiser-Meyer-Olkin (KMO) Statistic was 0.648, suggesting that sampling in the current study was adequate. Bartlett’s Test of Sphericity was highly significant (p=0.00), indicating that factor analysis was appropriate for these survey data. A KMO value of greater than 0.5 and the significant result indicated that the construct validity of each statement and the
67 AUD1 = MYR3.072 (2 January 2010, Central Bank of Malaysia) http://www.bnm.gov.my/index.php?tpl=exchangerates 68 Hair, Black, Babin and Anderson, n 63.

eJournal of Tax Research Determinants of Tax Compliance Behaviour of Corporate Taxpayers in Malaysia
398
related components within each construct were significantly correlated. This is required for results of factor analysis to be acceptable.69
Table 5: Perceptions towards tax attitudinal aspects
Attitudinal Aspect Mean Median Standard
Deviation
Number
of items
Cronbach’s
alpha
Tax Complexity 3.53 3.67 1.25 3 0.899
Tax Rate Structure 3.15 3.00 1.24 3 0.760
Tax Deterrence Sanctions a 2.98 3.00 0.96 3 0.699
Tax Law Fairness a 3.87 4.00 0.88 3 0.786
Tax Psychological Costs 3.96 4.00 1.16 1 - aOne item of each aspect was taken out to get an acceptable alpha coefficient.
Table 6: Rotated component matrix for factor analysis
Variable Name Tax Attitudinal Aspect
Complexity Rate Structure Sanctions Fairness
Complex 1 0.834 Complex 2 0.847 Complex 3 0.801 Rate 1 0.852 Rate 2 0.423 Rate 3 0.890 Sanction 2 0.703 Sanction 3 0.569 Sanction 4 0.660 Fair 2 0.889 Fair 3 0.904 Fair 4 0.638
Extraction Method: Principal Component Analysis; Rotation method: Varimax with Kaiser Normalization
4.5 Tax non-compliance behaviour
The views of respondents on the full and partial non-compliance behaviour of corporate taxpayers are provided in Table 7. The extent of agreement on full and partial under-reporting of income and over-claiming of expenses was measured via a six-point Likert scale.70 Regarding the under-reporting of income, a mean score of 69 Field A, Discovering statistics using SPSS (2nd ed, SAGE Publications, London Thousand Oaks New
Delhi, 2005). 70 An analysis was also undertaken to measure partial non-compliance behaviour. Respondents’ partial
non-compliance behaviours were investigated by eliciting responses on the likelihood of them not complying with only part of the amount stated for both scenarios. Scenario 1: ‘Taking into account all
known and likely business circumstances, to what extent do you agree with Mr. A’s possible action of
not reporting that cash sale of RM100,000 as his business income?’. Scenario 2: ‘Taking into account

eJournal of Tax Research Determinants of Tax Compliance Behaviour of Corporate Taxpayers in Malaysia
399
1.98 indicated the strong disagreement of respondents with this non-compliance behaviour. Comparatively, for the over-claiming of expenses, the mean score was slightly higher (2.61). Nevertheless, an overall mean of 2.30 for the under-reporting of income and over-claiming of expenses is an indication of marginally compliant behaviour among corporate taxpayers. The mean score of the respondents’ views towards partial non-compliance behaviour for both scenarios was higher, compared to the findings of full compliance behaviour. An overall mean score of 3.28 provided some indication of marginally non-compliant behaviour.
Table 7: Respondents’ views towards non-compliance behavior
Tax Compliance Behaviour Full Partial
Mean Median SD Mean Median SD
Under-reporting of income 1.98 1.00 1.33 3.38 4.00 1.63
Over-claiming of expenses 2.61 2.00 1.56 3.18 3.00 1.67
Overall non-compliance 2.30 2.00 1.34 3.28 3.50 1.40
4.6 Determinants of tax compliance behaviour
The objective of this study is to gain insight into the influence of some possible causes that affect the compliance behaviour of taxpayers. It is stated as follows: “To examine the relationship between corporate characteristics, tax compliance costs, tax attitudinal aspects and compliance behaviour of taxpayers.” Multiple regression analysis was utilised to identify the determinants of the tax non-compliance behaviour of PLCs. The predictor variables for the regression analyses were corporate characteristics (size, sector, year, and tax), tax compliance costs, and tax attitudinal aspects (complexity, rate, sanctions, fairness and psychological costs). Assessments of the four assumptions underlying the regression analysis, namely, normality, linearity, homoscedasticity and multicollinearity, revealed that no assumptions for multiple regressions were violated.
Three regression analyses were carried out separately to identify the likely tax non-compliance behaviour of corporate taxpayers (Table 8). All regressions were found to be statistically significant at the one per cent level: (1) under-reporting of income, (2) over-claiming of expenses and (3) overall non-compliance behaviour.
4.6.1 Under-reporting of income
The predictor variables explained 38% of the variability in the non-compliance behaviour of corporate taxpayers (F=5.804, p<0.01). Eight variables were found to be significant determinants of tax non-compliance behaviour in terms of the under-reporting of income. The predictors include business size [medium-sized PLCs (t=2.386, p<0.05), large-sized PLCs (t=1.938, p<0.10)], tax liability (t=-3.420, p<0.01), business age (t=-3.612, p<0.01), tax complexity (t=2.697, p<0.01), tax rate structure (t=1.882, p<0.10), tax deterrence sanctions (t=-2.370, p<0.05) and tax psychological costs (t=4.847, p<0.01). Companies with a higher annual sales turnover, shorter business age and those with a lower tax liability were more non-compliant.
all known and likely business circumstances, to what extent do you agree with Mr. B’s possible action
of claiming RM10,000 as his business deduction?’

eJournal of Tax Research (2014) vol 12, no. 2, pp. 383409
400
Table 8: Estimates of coefficient results summary of multiple regressions
Regression a Under-reporting of Income Over-claiming of Expenses Overall Non-compliance β
b t-value β b t-value β
b t-value Constant 4.454 2.780 5.166 2.317 4.810 2.787 Size (Medium-sized PLC)c 0.685 2.386** 0.639 1.598 0.662 2.140**
Size (Large-sized PLC)c 0.691 1.938* 0.393 0.793 0.542 1.412
Sector (Manufacturing)d -0.431 -1.514 -0.640 -1.613 -0.535 -1.744*
Sector (Other)d 0.185 0.617 0.463 1.107 0.324 1.001
Tax (Tax Liability) -0.901 -3.420*** -0.699 -1.908* -0.800 -2.820*** Year (Business Length) -0.035 -3.612*** -0.045 -3.384*** -0.040 -3.862*** Cost (Tax Compliance Costs) -0.339 -0.873 -0.844 -1.561 -0.592 -1.414 Complex (Tax Complexity) 0.288 2.697*** 0.322 2.168** 0.305 2.652** Rate (Tax Rate Structure) 0.199 1.882* -0.168 -1.141 0.016 0.137 Sanction (Tax Deterrence Sanctions) -0.322 -2.370** -0.257 -1.362 -0.290 -1.980* Fair (Tax Law Fairness) -0.109 -0.753 0.447 2.220** 0.169 1.084 Psycho (Tax Psychological Costs) 0.571 4.847*** 0.178 1.086 0.375 2.952*** R2 0.459 0.296 0.385 Adjusted R2 0.380 0.193 0.295 Standard Error 1.053 1.465 1.134 F-value 5.804 2.873 4.284 P-value 0.000*** 0.002*** 0.000***
Notes: aRegression: Under-reporting of Income Over-claiming of Expenses Overall Non-compliance bUnstandardized Coefficient cThe four levels of annual sales turnover were reclassified into three levels (small, medium and large) due to low number of responses in the last two categories. For regression
purposes, two dummy variables were created with a sales turnover level of less than MYR100 million (small-sized PLC) as the reference level. dThe six industry sectors were reduced to three sectors namely, manufacturing, services and ‘others’, due to low number of responses in certain sectors. ‘Others’ include the remaining sectors namely ‘property & construction’, ‘finance & banking’, ‘plantation & agriculture’ and ‘technology’. Two dummy variables were created with ‘services’ as the reference sector. *** p-Value< 1% with two-tailed tests; ** p-Value < 5% with two-tailed tests; * p-Value < 10% with two-tailed tests.

eJournal of Tax Research (2014) vol 12, no. 2, pp. 383409
401
With other variables held constant, non-compliance behaviours were positively related to company size while negatively related to business age and tax liability. The results further indicated that non-compliance with respect to the under-reporting of income was greater for companies with a higher perceived tax complexity level, and higher perceived level of fairness in the tax rate structure.71 Non-compliance was lower, however, for companies with higher perceived tax deterrence sanctions. The findings also suggested that companies with higher psychological costs tended to be more non-compliant.
4.6.2 Over-claiming of expenses
When it came to the over-claiming of expenses, the regression was a rather poor fit. The adjusted R2 was merely 19.3%, but the overall relationship was significant (F=2.873, p<0.01). Only four variables were found to be significant determinants of the non-compliance behaviour of corporate taxpayers. The predictors were tax liability (t=-1.908, p<0.10), business age (t=-3.384, p<0.01), tax complexity (t=2.168, p<0.05) and tax fairness (t=2.220, p<0.05). With other variables held constant, non-compliance behaviour was negatively related to tax liability and business age. Companies with a lower tax liability and those with shorter business age were more non-compliant. The result also signified that non-compliance was greater for companies with a high perceived tax complexity level and perception of fairness in the tax rate structure.
4.6.3 Overall non-compliance
The predictor variables explained almost 30% of the variability in the overall non-compliance behaviour of corporate taxpayers. 72 Business size (t=2.140, p<0.05), business sector (t=-1.744, p<0.10), tax liability t=-2.820, p<0.01), business age (t=-3.862, p<0.01), tax complexity (t=2.652, p<0.05), tax deterrence sanctions (t=-1.980, p<0.10) and tax psychological costs (t=2.952, p<0.01) were found to be significant determinants of corporate non-compliance behaviour. Medium-sized PLCs with annual sales turnover of between MYR100 million and MYR500 million were found to be more likely to demonstrate non-compliance behaviour. Companies in the manufacturing sector were identified as being more compliant compared to those in the other sectors. The finding also indicated that non-compliance behaviour was greater for companies with a lower tax liability, shorter business age, a high-perceived tax complexity level and low perceived tax deterrence sanctions. Companies with higher psychological costs tended to be more non-compliant with respect to overall non-compliance behaviour.
The evaluation of research hypotheses formulated to identify the determinants of tax compliance behaviour for this study has been summarised (Table 9).
Hypothesis 1 (H1) posited that there is a relationship between the tax compliance costs incurred by corporate taxpayers and their non-compliance behaviour. However, the results of the regression analyses undertaken indicate insignificant relationships between tax compliance costs and all three types of tax non-compliance behaviour. Thus, H1 is not supported. This lack of relationship may be explained by the fact that
71 The respondents to this study are PLCs hence their perception on fairness of the corporate tax system
might differ from earlier studies that focus on individual taxpayers and SMEs. 72 Overall non-compliance is a combination of two types of tax non-compliance behaviour: the under-
reporting of income and the over-claiming of expenses.

eJournal of Tax Research (2014) vol 12, no. 2, pp. 383409
402
Table 9: Summary of Hypotheses Evaluation
Construct Hypotheses Statement Outcome Regression Tax Compliance
Costs H1: A reduction in tax compliance costs reduces the level of non-
compliance among corporate income taxpayers. Not
Supported -
Corporate Characteristics
H2a: There is a relationship between business size and non-compliance of corporate taxpayers.
Supported Under-Reporting of Income Overall Non-Compliance
H2b: There is a relationship between business sectors and non-compliance of corporate taxpayers.
Supported Overall Non-Compliance
H2c: There is a relationship between business length and non-compliance of corporate taxpayers.
Supported Under-Reporting of Income, Over-Claiming of Expenses Overall Non-Compliance
H2d: There is a relationship between business tax liability and non-compliance of corporate taxpayers.
Supported Under-Reporting of Income
Tax Attitudinal Aspects
H3a: There is a relationship between perceived tax complexity and non-compliance of corporate taxpayers.
Supported Under-Reporting of Income Over-Claiming of Expenses Overall Non-Compliance
H3b: There is a relationship between perceived tax deterrence sanctions and non-compliance of corporate taxpayers.
Supported Under-Reporting of Income Overall Non-Compliance
H3c: There is a relationship between perceived fairness in the tax rate structure and non-compliance of corporate taxpayers.
Supported Under-Reporting of Income
H3d: There is a relationship between perceived fairness of the tax system and non-compliance of corporate taxpayers.
Supported Over-Claiming of Expenses
H3e: There is a relationship between perceived level of psychological costs and non-compliance of corporate taxpayers.
Supported Under-Reporting of Income Overall Non-Compliance

eJournal of Tax Research (2014) vol 12, no. 2, pp. 383409
403
this study focused only on PLCs. Based on the findings of existing studies, business size was found to be a significant determinant of tax non-compliance behaviour in studies covering small, medium and large-sized corporations, but not in studies targeting a homogenous group of corporate taxpayers.73
Hypothesis 2 (H2) predicted that there is a relationship between corporate characteristics and tax non-compliance behaviour. The results indicate full support for tax liability and business age, but partial support for business sector and size across the non-compliance categories. Business size (H2a) is a significant determinant of the under-reporting of income and overall non-compliance. Medium-sized PLCs with annual sales turnover of between MYR100 and MYR500 million were observed to be more non-compliant than small-sized PLCs.74 To a lesser extent, larger PLCs were more non-compliant than the smaller PLCs. The business sector (H2b) characteristic was only a significant determinant of overall non-compliance, while PLCs in the manufacturing sector were more compliant than those in the services sector. This study provides evidence of the significant influence of business age (H2c) and tax liability (H2d) on all the three types of taxpayer non-compliance behaviour. In terms of business age, the possibility of non-compliance decreased the longer a PLC had been in operation. It is inferred that companies that have been in operation longer are more compliant than their younger counter-parts. With respect to corporate tax liability, the possibility of non-compliance decreased with the increase in the tax liability.75 This finding implies that PLCs with a lower tax liability tend to be more non-compliant. This could be interpreted as PLCs are either not disclosing all income or are over claiming expenses.
Hypothesis 3 (H3) is well supported, as the findings indicated that tax complexity, tax rate structure, tax deterrence sanctions, tax law fairness and tax psychological costs had a significant relationship with at least one type of non-compliance behaviour. Tax complexity (H3a) was found to have a significant relationship with tax non-compliance behaviour for all types of non-compliance. Findings showed that higher perceptions of complexity surrounding the CIT system resulted in greater non-compliance among corporate taxpayers. The perception of tax deterrence sanctions (H3b) was a significant determinant of the under-reporting of income and overall non-compliance. Increases in tax deterrence sanctions pertaining to audit likelihood, detection likelihood and the severity of penalties resulted in lower non-compliance among PLCs. There is a significant relationship between perceived fairness in the tax rate structure (H3c) and the under-reporting of income, as well as between the perception of fairness of the tax system (H3d) and the over-claiming of expenses. Finally, perceptions of the level of tax psychological costs (H3e) were significant determinants of the under-reporting of income and overall non-compliance. The possibility of non-compliance increased with the level of tax psychological costs. Companies with higher psychological costs, in terms of stress and anxiety in meeting their compliance obligations, tended to be more non-compliant.
73 Another possible explanation may be due to the regressive nature of tax compliance cost, which
suggests that large companies may not feel the tax burden as much as smaller companies. 74 For regression purposes, small PLCs with a sales turnover level of less than MYR100 million is
selected as the reference level. 75 The amount of tax liability is based on estimated tax liability for some companies, as the timing of this
study may not permit the determination of actual tax liabilities. The actual tax liability will only be available within a six-month period after the end of accounting period when the company is required to submit the tax return to IRBM.

eJournal of Tax Research Determinants of Tax Compliance Behaviour of Corporate Taxpayers in Malaysia
404
5. CONCLUSION
The findings in this study enhance the tax compliance literature in terms of the factors that are likely to influence the tax non-compliance of corporate taxpayers. Specifically, this study provides an empirical evaluation of the determinants of corporate tax non-compliance behaviour, namely, tax compliance costs, corporate characteristics and tax attitudinal aspects. While most existing studies examined the determinants of tax compliance behaviour in general, this study took the approach a step further by observing different types of non-compliance behaviour: the under-reporting of income, the over-claiming of expenses and overall non-compliance.
The overall conclusions from this study’s research findings on the tax compliance behaviour of corporate taxpayers are broadly in line with existing studies in this area. This study confirms that tax complexity is an important determinant of corporate taxpayer compliance.76 Concerning business size, this study found it to be a significant determinant of tax non-compliance behaviour.77
The findings of this study therefore add to the research evidence from countries in emerging economies, which tend to have weaker tax policy structures and less transparent tax systems than the advanced economies.78
Issues related to tax compliance behaviour are of interest to policy makers in the area of taxation, as well as to the taxation profession and corporate management. Information gathered from this study can assist the government, particularly the tax authorities, when formulating future tax policies. The findings of this study indicate that taxpayer compliance could be improved further mainly by enhancing the positive attitudes of taxpayers towards the psychological costs and complexity of the tax system. Apart from simplifying the tax system, the IRBM should consider improving its public relations strategies and developing a more comprehensive taxpayer charter, as has been practiced in most advanced economies.
This study is not without its limitations, and many of them represent opportunities for future research. In this study, corporate taxpayer attitudes and compliance behaviour were measured from the managerial or respondent’s perspective. Joulfaian introduced the concept of managerial preferences as a proxy to measure compliance behaviour of corporation.79 As the respondents were persons, not the company itself, they might not necessarily represent the attitudes and behaviour of the PLCs being studied. Another limitation is the use of hypothetical tax scenarios and the respective monetary amount in determining taxpayer compliance behaviour. It is recognised that the actual judgement of the respondents may vary and that the findings would depend considerably on their honesty. Nevertheless, as most corporations would have strong incentives to avoid revealing their non-compliance decisions, any direct measures will 76 In the context of individual taxpayers, see Cuccia AD, n 9 and McKerchar M, The impact of complexity
upon unintentional non-compliance for Australian personal income taxpayers (Unpublished doctoral dissertation, ATAX, University of New South Wales, Sydney, Australia, 2002). In the context of SMEs see Abdul-Jabbar, n 23
77 This finding is consistent with the findings of Joulfaian, n 11 and Hanlon, Mills and Slemrod, n 11, but it contradicts the findings of Rice, n 17 and Abdul-Jabbar, n 23. A possible reason for differences in research findings may be due to studies targeting different company sizes and/or adopting varying size measures
78 Ariff M and Pope J, Taxation and compliance cost in Asia Pacific economies (University Utara Malaysia Press, Sintok, 2002).
79 Joulfaian, n 11

eJournal of Tax Research Determinants of Tax Compliance Behaviour of Corporate Taxpayers in Malaysia
405
invariably suffer from substantial measurement errors (Rice, 1992). 80 As such, it should be acknowledged that these challenges are the limitations of this study.
Future research should consider conducting in-depth interviews as a complement to surveys, as they would be useful in providing a deeper understanding and explanation of the relationship between the variables. The use of case studies may provide better quality responses to some issues of interest, including probing the impact of lower compliance costs on compliance decisions. Future studies might consider the use of the experimental method, where the non-compliance behaviour of taxpayers is measured through a controlled experiment.81 Future studies may also consider other specific types of non-compliance behaviour, such as failure to submit a tax return and/or failure to remit taxes by the due date.82
Dealing with taxation matters, particularly in emerging economies, remains a challenge due to limited awareness, administrative flaws and a lack of government commitment to enforcing tax laws. This study has systematically identified, and analysed the areas that deserve due attention, focusing in this case on the compliance behaviour of corporate-taxpayers. To this end, the findings of this study have made a significant contribution to the body of tax knowledge, as well as to tax policy makers charged with devising specific measures to enhance voluntary compliance.
80 Rice, n 17. 81 Trivedi VU, Shehata M and Mestel-Man S, “Attitudes, incentives and tax compliance” (2005) 53(1)
Canadian Tax Journal 29-30. 82 See Baldry J and Kasipillai J, “Malaysia: Income tax enforcement” 1996 2(9) Asia-Pacific Tax Bulletin
26872.

eJournal of Tax Research Determinants of Tax Compliance Behaviour of Corporate Taxpayers in Malaysia
406
APPENDIX: QUESTIONNAIRE
Determinants of Tax Compliance Behavior of Corporate Taxpayers in Malaysia
SECTION A: TAX COMPLIANCE COSTS
Kindly fill in an approximate estimated time, monetary amount and/or breakdown of the following
internal costs of complying with corporate income tax:
1. How much time within the company was spent entirely on additional or exclusive work for company income tax purposes for 2009?
No. of Staff Total hours/ month
Finance Director; Chief Financial Controller/Officer Accountant / Tax Manager General / Non-Financial Manager Accounting Staff Other (please state) ___________________
2. Does your company incur any other additional non-staff costs in meeting the income tax requirements for the year of assessment 2009? (For example: Stationery, postage and travelling)
No, continue to Question 3 Yes, please respond to the following question: Please estimate the additional costs involved in 2009: 3. Does your company employ external tax professionals to handle income tax matters in 2009?
Yes, please continue to Question 8 No, please go to Question 6 (Section B)
4. The source of external advice were: (Please tick: if more than one, please rank in order of importance using 1 as most important).
Professional Accountants Tax agents Inland Revenue Board (IRB)
Other (please state) ____________________________________ 5. Please provide or estimate the external tax fees incurred by your company for the corporate
income tax activities in the financial year 2009: MYR
MYR
Tick Rank

eJournal of Tax Research Determinants of Tax Compliance Behaviour of Corporate Taxpayers in Malaysia
407
SECTION B: PERCEPTIONS AND OPINIONS
6. Kindly respond to the following statements to indicate your opinion to each of the statements. There are no right and wrong answers. (Please tick one box on a 6 point scale for each statement.)
LEVEL OF IMPORTANCE
Personally, I consider that the preparation of corporate income tax return is difficult.
Strongly agree
Strongly disagree
Corporate income tax law is relatively simple to understand. Strongly agree
Strongly disagree
Complexity in tax law is necessary so that companies are treated fairly.
Strongly agree
Strongly disagree
A ‘fair’ tax rate should be the same for every company regardless of their size (small, medium or large).
Strongly agree
Strongly disagree
Large companies have a greater ability to pay income tax, so it is fair that they should pay a higher rate of tax than small and medium companies.
Strongly agree
Strongly disagree
It is fair that high profit companies should pay a higher rate of tax than low profit companies.
Strongly agree
Strongly disagree
If there was a discrepancy in the annual tax return, how likely is that it would be audited?
Very Likely
Very
Unlikely
If your company was to be chosen for compulsory audit, how likely would a discrepancy be identified?
Very Likely
Very
Unlikely
If discrepancies were discovered during an audit, how severe are the penalties?
Very Severe
Not Very Severe
The chances of being audited (tax audit) are so low that it is worthwhile trying to economize a little on corporate income taxes for various reasons.
Strongly agree
Strongly disagree
I believe that each company’s officers have a moral obligation to report all of their company’s income and pay the correct amount of corporate income tax.
Strongly agree
Strongly disagree
Do you believe that the move to self-assessment made corporate tax laws more or less fair?
Much more fair
Much less fair
Overall, has the move to self-assessment made the distribution of the corporate income tax burden among small, medium and large companies more or less fair?
Much more fair
Much less fair
Do you believe that as a result of changes in corporate income tax during the past five years, large companies are paying more or fewer taxes?
Much more taxes
Much fewer taxes
The tax compliance requirement may have caused stress and anxiety to taxpayers. Indicate your position with respect to the psychological costs causes by the income tax system.
Very Stressful
Not Very Stressful

eJournal of Tax Research Determinants of Tax Compliance Behaviour of Corporate Taxpayers in Malaysia
408
SECTION C: COMPLIANCE BEHAVIOUR
7. Read the following and kindly indicate your opinion (by way of a tick) to the following scenario based on your experience:
(a) Taking into account all known and likely business circumstances, to what extent do you agree with Mr A’s possible action of not reporting that cash sale of MYR100,000 as his business income?
(b) Would he be likely to report only part of the MYR100,000 as business income?
Very Likely
Very Unlikely
8. Read the following and kindly indicate your opinion (by way of a tick) to the following scenario based on your experience:
(a) Taking into account all known and likely business circumstances, to what extent do you agree with Mr B’s possible action of claiming MYR10,000 as his business deduction?
(b) Would he be likely to deduct only part of the MYR10,000 as a business deduction?
Very Likely
Very Unlikely
Mr A, a self-employed businessman is considering not disclosing a cash sale of MYR100,000 as his business income in his 2009 tax return. Legally, the cash receipts of MYR100,000 should be included as a business income. However, he is almost certain that the tax authority will not audit him and would not know if the amount is not disclosed.
Strongly agree
Strongly disagree
Mr B, a self-employed businessman, had incurred MYR10,000 to repair his personal van. In preparing his 2009 tax return, he is thinking about claiming the costs of repair as if the van was used in his business. Legally, such claim is not allowable, but he is almost certain that he will not be audited and that the tax authority would not be able to detect the deduction.
Strongly agree
Strongly disagree

eJournal of Tax Research Determinants of Tax Compliance Behaviour of Corporate Taxpayers in Malaysia
409
SECTION D: GENERAL INFORMATION AND SUGGESTIONS
Kindly tick the most appropriate responses or fill in the appropriate details in the space
provided.
9. What is your company main business activity? Manufacturing
Services Property and Construction
Plantation and Agriculture Finance and Banking Others (please state) ____________
10. What was the turnover of the company in 2009: Less than MYR100 million MYR100,000,000–MYR500,000,000
MYR500,000,001–MYR1,000,000,000 More than MYR1,000 million
11. How much company income tax in total, in relation to the 2009 year of income did the company
remit to the Malaysian Inland Revenue Board? Nil (no tax liability)
Less than MYR5 million Between MYR5 million and MYR10 million More than MYR10 million
12. The period your company has been in business is: _______________ years.
Thank you for taking time to participate in this survey.
Confidentiality
The views expressed in the completed questionnaire will be treated in the strictest confidence. Any
information identifying the respondents will not be disclosed.