
EIL Annual PPT - FY 13-14 - May 2014 - Rev 2 - 23 May...
45
Investor Presentation Annual Results : FY 13-14 23 rd May 2014
Transcript of EIL Annual PPT - FY 13-14 - May 2014 - Rev 2 - 23 May...

Investor PresentationAnnual Results : FY 13-14
23rd May 2014

ContentsContents
Overview of Engineers India Limited (“EIL”)11 4
Page #
Track Record and Credentials22 15
Financials and Order Book Overview33 28
Business Outlook and Strategy44 37
Details of Follow on Public Offer 3755
2

11
Overview of Engineers India Limited (“EIL”)

O f I di ’ l di i i lt d EPC i
Company BackgroundCompany Background
One of India’s leading engineering consultancy and EPC companies
Nearly five decades of experience on landmark projects with global energy majors
Significant track record across entire oil & gas value chain including 10 green-field refineries 39 oil & gas processing plants 40 offshore process platforms 42
BPCL Refinery,Kochi
Marquee Projects
refineries, 39 oil & gas processing plants, 40 offshore process platforms, 42 pipelines and 7 petrochemical complexes
Focused diversification into other sectors:
Fertilizer and LNG Bina Refinery
Non-ferrous metallurgy
Infrastructure
Strategic crude oil storage
Nuclear and solar energy gy
E&P
Over 2,890 highly experienced professionals and technical workforce
In-house and collaborative R&D support with 14 registered patents
Panipat NaphthaCracker Unit
In house and collaborative R&D support with 14 registered patents
Expanding overseas presence in MENA and South East Asia
Zero debt firm with track record of healthy earnings and consistent dividend payout
Guru Gobind SinghRefinery, Bathinda
p y
4

Evolution & Key MilestonesEvolution & Key Milestones
Wh ll d C dE i i Di ifi d i tC d fi t E t d i t Wholly owned Government of India (GoI) company
Commenced services in sub-surface crude storages
Expansion in Hydrocarbons value chain Offshore Pipelines Onshore oil
Diversified into Infrastructure
Commenced first international assignment
Entered Fertilizer
Entered into PSC with GoI for exploration (NELP IX)
Overseas expansion in Onshore oil
and gassector
Non-ferrous metallurgical sector
expansion in fertilizer
19651965 19671967 19691969 19701970--7272 19891989 19971997 20012001 2006200619751975--7878 20102010 20112011 2012 2012 --1313
Incorporated pursuant to a formation agreement
R&D centre in Gurgaon
Listed on the BSE and NSE
Accorded the
Expansion to Petrochem with IPCL (now Reliance
Special interim dividend of 1000%
Diversification into nuclear and solar Energy sectoragreement
between GoI and Bechtel
Commenced work in the refineries
Accorded the Mini Ratna status
Reliance Industries Ltd) Successful FPO
of 3.36 Cr shares of Rs. 5 each
sector
JV in Saudi Arabia
5
refineries segment

Lines of BusinessLines of Business
Oil & GasOil & Gas Chemicals & MetallurgyChemicals & Metallurgy
Oil and Gas Processing Offshore & Onshore
Strategic Storage,
Terminals and Pipelines
Refinery Petrochemicals Fertilizer Mining andMetallurgy
O s o e p
InfrastructureInfrastructure PowerPower
Solar Thermal NuclearCity Gas Urban Development
Water and WasteManagement
6

Service Offering Service Offering -- From Concept to CommissioningFrom Concept to Commissioning
Pre-feasibility studies
Technology and licensor selection
Conceptual design & feasibility
Process Process DesignDesign
Residual engineering and FEED
Detailed engineering Engineering for procurement
EngineeringEngineering
Supplier and contractor management
Expediting and inspection
ProcurementProcurement
Conceptual design & feasibility
Process design package
Engineering for procurement Engineering for construction Vendor development
Construction Management Construction Management CommissioningCommissioningProject Project ManagementManagement
Materials and warehouse management Quality assurance and health, safety &
environment Progress monitoring/ Scheduling Mechanical completion
Pre-commissioning and commissioning assistance
Safety audit
Hazard and operability studies
Integrated project management services with focus on cost, quality and schedule
Mechanical completion Site closure
p y
Risk analysis
Specialized ServicesSpecialized Services CertificationCertification
Environment engineering
Heat and mass transfer
Plant operations and safety management
Specialist materials and maintenance
Certification and re-certification services
EIL subsidiary – Certification Engineers International Limited (CEIL)
Thi d i i
7
Specialist materials and maintenance services
Third party inspection

Service Offering Service Offering -- Modes of Contracts ManagedModes of Contracts Managed
Consultancy Contracts
Services related to process design, detailed
11 FrontFront--end end Engineering & Engineering &
Upstream process design, residual basic design and front-end basic engineering for complete definition of scope for selection
f C
22
EngineeringEngineering, , Procurement and Procurement and
Construction Construction Management Management
(EPCM)(EPCM)
engineering, procurement, construction supervision through co-ordination of various suppliers and contractors and commissioning and pre-commissioning assistance
Project Project Management Management C ltC lt
Design (FEED)Design (FEED)
Comprehensive project management Services for the implementation of a project through EPC contractors
of EPC contractor
33
Turnkey Contracts
p gConsultancy Consultancy
(PMC)(PMC)project through EPC contractors
11LumpLump--sum sum
turnkey ("LSTK")turnkey ("LSTK")
Fixed price contracts for Engineering, Procurement And Construction (EPC)
Single-point responsibility for completion of a project within the agreed schedule at the awarded turnkey price
Changes in scope of work are defined by change orders agreed by both parties
11
Open book Open book estimate ("OBE")estimate ("OBE")
Cost plus contracts contract with a provision for conversion to LSTK22
8
Wide spectrum of service offerings
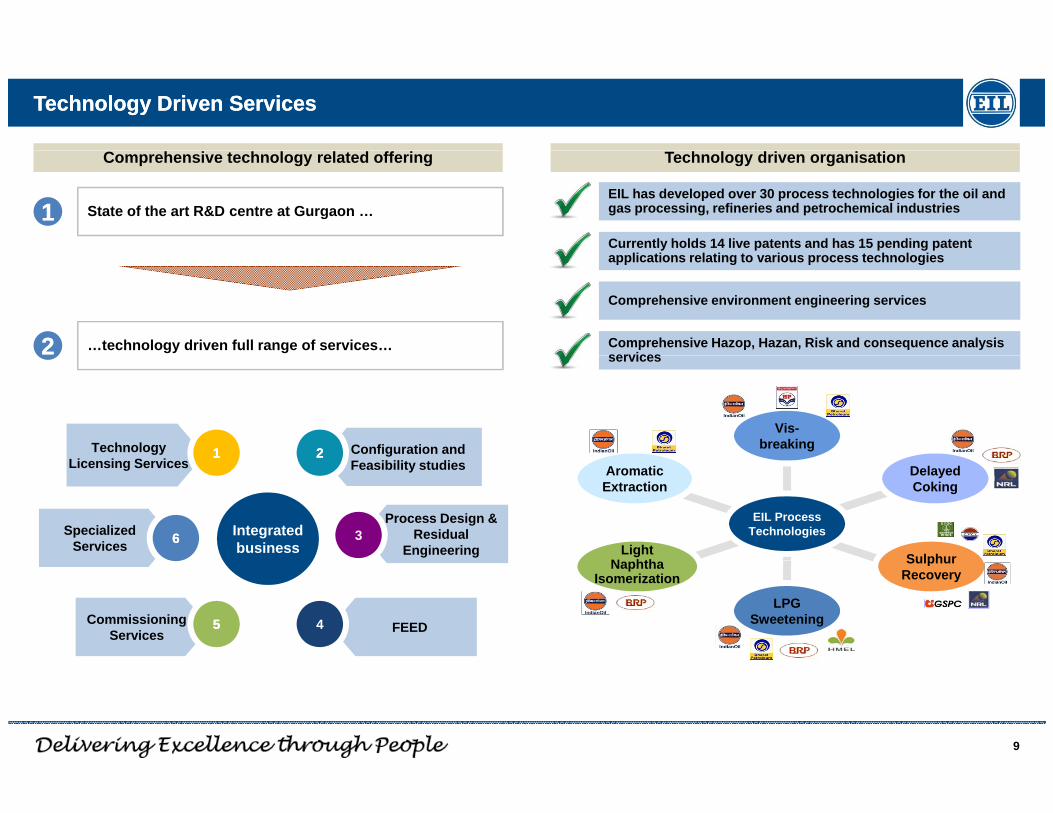
Technology Driven ServicesTechnology Driven Services
Comprehensive technology related offering Technology driven organisation
State of the art R&D centre at Gurgaon …11EIL has developed over 30 process technologies for the oil and gas processing, refineries and petrochemical industries
Currently holds 14 live patents and has 15 pending patent li ti l ti t i t h l i
…technology driven full range of services…22
applications relating to various process technologies
Comprehensive environment engineering services
Comprehensive Hazop, Hazan, Risk and consequence analysis services
Configuration and Technology 11 22
Vis-breaking
services
Process Design & Residual
EngineeringIntegrated business
3
Feasibility studies
SpecializedServices
Licensing Services
66EIL Process
Technologies
Delayed Coking
SulphurLight N hth
Aromatic Extraction
FEEDCommissioning Services
55 4
Sulphur Recovery
LPG Sweetening
Naphtha Isomerization
9
22
Track record and Credentials

Extensive Track Record and Strong Client RelationshipsExtensive Track Record and Strong Client Relationships
R fi P j t i l di
7 Petrochemical Complexes
37 Oil & GasProcessing Projects
Refinery Projects including10 Green-field Projects
40 Offshore Process Platforms
42 Pipeline Projects
8 Fertiliser Projects 8 Fertiliser Projects 13 Ports & Storage
Terminals BCPL BCIC
29 Mining & Metal Projects
Infrastructure Projects j j
Power / Captive
INDAL
11
17 Turnkey ProjectsPower / Captive Power Projects

Presence Across the Oil & Gas Value ChainPresence Across the Oil & Gas Value Chain
Offshore Oil & Gas Oil & Gas Transportation
Storage, Ports & Terminals Onshore Oil & Gas Refineries
Over 150 Well Platforms and 30 Process Platforms for
HBJ pipeline – India’s largest Gas Pipeline Network
Storage of Crude Oil in Underground Caverns -security initiative for
Gas Processing Complexes at Hazira and Uran and the
Refinery projects aggregating over 150 MMTPAProcess Platforms for
ONGC*
Offshore Platform Projects for the Deen Dayal Field D l P j f
Network
Jamnagar-Loni LPG Pipeline of GAIL (one of the world’s longest)
Strategic Pipelines for
security initiative for Strategic Crude Oil Storage as part of the Integrated Energy Policy of GoI
LNG T i l
and Uran and the C2/C3 and LPG recovery units
Gas Processing Complex of GSPC at K ki d I di
MMTPA
10 Grass-root Refinery Projects in India
Algiers and Skikda Refineries of
Development Project of GSPC East Coast, India
International Projects in Qatar, UAE
HPCL, BPCL, BORL, IOCL , HMEL, TAKREER*, ADNOC*, NPCC*
LNG Terminals re-gasification and downstream infra facilities for Petronet LNG, RGPPL* , Shell
Kakinada, India
International Projects in Algeria and UAE
SONATRACH, Algeria
Services for refinery majors in MENA region like KNPC*, ORPC*, KPRL BAPCO*,
Oil & Gas Exploration under NELP IX
and SONATRACHKPRL, BAPCO
* ONGC – Oil and Natural Gas Corporation Limited; TAKREER ‐ Abu Dhabi Oil Refining Company; ADNOC ‐ Abu Dhabi for Abu Dhabi National Oil Company; NPCC ‐ National Petroleum Construction Company , Abu Dhabi; KNPC ‐ Kuwait National Petroleum Corporation; ORPC ‐ Oman Refineries and Petrochemicals Limited ; BAPCO ‐ Bahrain Petroleum Company; RGPPL ‐ Ratnagiri Gas and Power Private limited
12
Nearly five decades of experience in the Hydrocarbon space with a presence across the entire value chain

Leadership Position in Refineries & Petrochemicals in IndiaLeadership Position in Refineries & Petrochemicals in India
Panipat Petro Plant Milestones
19 out of 22 Refineries in India have EIL Footprints
Guwahati RefineryPUNJAB
Guru Gobind Singh Refinery
Panipat Petro. Plant
Pata Petro. Plant
Worked on a combined refining capacity of more than 150 MMTPA (3 million BPD) in India
Engineered 10 grass root refineriesASSAMUP
Panipat Refinery
HARYANA
Guwahati Refinery
Barauni Refinery
Mathura Refinery Bongaigaon Refinery
Digboi RefineryVadinar Refinery
PUNJAB
Engineered 10 grass-root refineries
Involved in the establishment of 7 out of the 8 mega petrochemical complexes in India
Koyali Refinery BIHAR
GUJARAT WBNumaligarh Refinery
Digboi Refinery
Bina Refinery
MPAssam Petro. Plant
BCPL
Currently executing two green field and one brown field expansion project
Haldia Refinery MAHAR-ASHTRA
Mumbai Refinery
Mumbai Refinery
ANDHRA PRADESH
Visakh Refinery KARNATAKA
Haldia Petro. Plant Dahej Petro. Plant
Nagothane Petro. Plant
Forayed into new areas such as underground caverns for storages
Kochi Refinery
Manali Refinery
TN
Mangalore Refinery KARNATAKA
13
RefineryMega Petrochemical Plant
KeralaNagapattanam Refinery

Diverse Portfolio of high growth sectorsDiverse Portfolio of high growth sectors
Fertilizers Mining & Metallurgy Infrastructure Power
zzzzzzzzzzzzzzzzzzzzzzzzzzzzzzzzzzzzzzzzzz
Petrochemicals
7 out of the 8 mega Petrochemical Complexes in India
29 large Non-ferrous Metallurgical Projects of Alumina, Aluminum,
Modernization and redevelopment of Delhi & Mumbai airports
Fertilizer complexes at Phulpur, Bhatinda, Panipat, Bharuch
Thermal power plants for GAIL, OPGC* and Reliance Power (RPL)
Large petrochemical clients like GAIL, IOCL, IPCL* (now RIL), OPaL*, BCPL* and others
Copper, Zinc, Lead Titanium, Cadmium, Mica, Rock Phosphate, Graphite, Fluorspar, Limestone, and Lignite
Interceptor sewers for abatement of pollution in river Yamuna for Delhi Jal Board
Focus on water waste
Ammonia plants at Kalol, Taloja
Ammonia Urea complex at Nigeria for Indorama
ShahJalal fertilizer
Nuclear power plants for NPCIL* and NFC*
Solar thermal power project of RPL
Thermal Focus on Petrochemical projects
in Middle East region for Kuwait Aromatics Company and BOROUGE
Large clients include NALCO*, INDAL*, HINDALCO, Sterlite, HZL*, NMDC*, HCL*, JSWAL*, GMDC*
Focus on water, waste management and urban development
Development and operation of new city gas distribution projects
ShahJalal fertilizer project at Bangladesh for BCIC
Focus on Naphtha/ Gas based fertilizer plants
Thermal – Focus on consultancy services for balance of plant
Nuclear - Target strategic engineering consultancygas distribution projects consultancy opportunities; pursue collaborations with technology providers
* IPCL ‐ Indian Petrochemicals Corporation Limited; OPaL ‐ ONGC Petro‐additions Limited; BCPL ‐ Brahmaputra Cracker and Polymer Limited; NALCO ‐ National Aluminium Company Limited; INDAL ‐ Indian Aluminium Company Limited; HZL ‐ Hindustan Zinc Limited; NMDC ‐ National Mineral Development Corporation Limited ; HCL ‐ Hindustan Copper Limited; JSWAL ‐ JSW Aluminum Limited; GMDC ‐ Gujarat Mineral Development Corporation Limited;
14
Establishing strong foothold across emerging sectorsOPGC ‐ Orissa Power Gas Company; NPCIL ‐ Nuclear Power Corporation Limited; NFC ‐ Nuclear Fuel Complex

Increased Focus in Overseas GeographiesIncreased Focus in Overseas Geographies
S t C t Cli t S t C t Cli tSector Country Client
Oil & gas processing UAE NPCC, ADCO
Oil & gas processing Vietnam Petro-vietnam
Pipelines UAE GASCO, TAKREER, NPCC, ADNOC
Sector Country Client
LNG Algeria Sonatrach
Petrochemicals UAE BOROUGE, EQUATE
Petrochemicals Malaysia M/s Vinyl Chloride (Malaysia) sdn. Bhd
LONDON
MILAN
( y )
UAE
NIGERIA
ALGERIAVIETNAM
GHANA
SHANGHAI
MIDDLE EAST (UAE, Kuwait, Oman, KSA ..)VENEZUELA
EIL international offices
KENYAINDONESIA
MALAYSIAGHANA Oman, KSA ..)VENEZUELA
Sector Country ClientSector Country Client
Refinery Algeria Sonatrach (Formerly NAFTEC)
Refinery Oman Sohar
Refinery Kuwait KNPC
Refinery Indonesia WIKA
y
Fertilizers Nigeria Indo Rama
Fertilizers Bangladesh BCIC
Fertilizers Malaysia Petronas Fertilizer (Kedah) Sdn. Bhd.
15
JV : “JABAL EILIOT” in Kingdom of Saudi ArabiaWOS: “EILAP” in Malaysia
Refinery Kenya KPRL Non Ferrous Bahrain ALBA
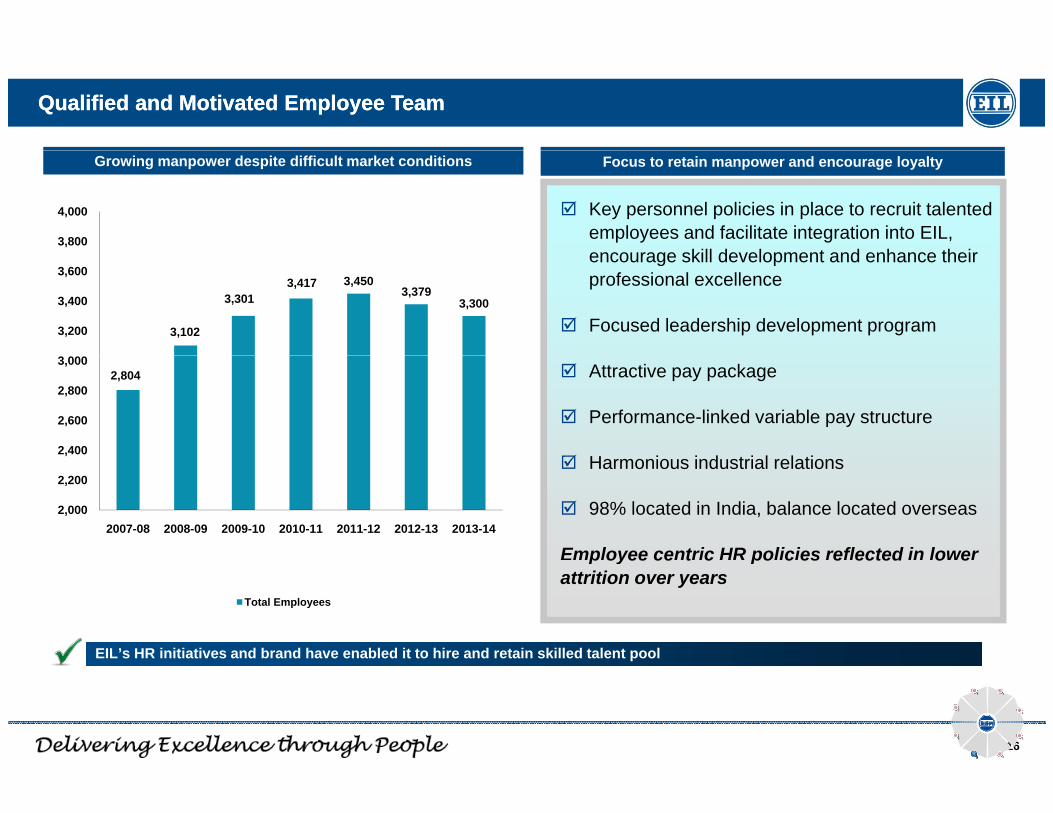
Qualified and Motivated Employee TeamQualified and Motivated Employee Team
Growing manpower despite difficult market conditions
3,800
4,000
Focus to retain manpower and encourage loyalty
Key personnel policies in place to recruit talented employees and facilitate integration into EIL, encourage skill development and enhance their
3,102
3,3013,417 3,450
3,3793,300
3,200
3,400
3,600encourage skill development and enhance their professional excellence
Focused leadership development program
2,804
2,400
2,600
2,800
3,000 Attractive pay package
Performance-linked variable pay structure
H i i d t i l l ti
2,000
2,200
2007-08 2008-09 2009-10 2010-11 2011-12 2012-13 2013-14
Harmonious industrial relations
98% located in India, balance located overseas
Employee centric HR policies reflected in lower
Total Employees
EIL’s HR initiatives and brand have enabled it to hire and retain skilled talent pool
p oyee ce t c po c es e ected o eattrition over years
16
Leadership position across the
hydrocarbon sector value chain in India
2
4
6
7
8
55
1
3

Experienced Board and Leadership Team: Executive DirectorsExperienced Board and Leadership Team: Executive Directors
Ashok K. Ashok K. PurwahaPurwahaChairman Chairman &&Managing Managing Director Director
32 years of experience in finance and cost accounting
More than 36 years of experience in the hydrocarbon sector Served with ONGC (more than 8 years) and with GAIL India Limited for over 24 years, last position held was as
Director (Business Development) on board of GAIL Led Mahanagar Gas Limited, Mumbai (a JV of GAIL India Limited and BG Group, UK) as MD for 5 years
Ram SinghRam SinghDirector (Finance) Director (Finance)
32 years of experience in finance and cost accounting Held positions with SAIL, BPCL, Petroleum Planning and Analysis Cell of MoP&NG, and the Oil Coordination
Committee Conferred with Business Today Best CFO of a PSU (Mid size) Award-2013 and India CFO Award for Excellence
in Risk Management by IMA India
Deepak Deepak MoudgilMoudgilDirector (Projects) Director (Projects)
Sanjay GuptaSanjay Gupta
Over 38 years of experience in construction and projects Successfully led EIL’s diversification into infrastructure sector He has worked in various departments of EIL, including construction, administration, marketing and projects
33 years of experience in implementation of mega projects in refineries, pipelines and petrochemicalsSanjay GuptaSanjay GuptaDirector Director (Commercial)(Commercial)
VV SS
Successfully implemented LSTK Project for PFCCU Project at MRPL He has been entrusted the task of leadership for formulation of the strategy group responsible for EPC initiatives
as well as business growth initiatives within the Company in the past couple of years
30 years of experience in Human Resource management in the petroleum and natural gas sector Prior to joining the Company, Ms. Swarup was with ONGC since 1983, where she headed the Performance
AjayAjay NN DeshpandeDeshpande
VeenaVeena SwarupSwarupDirector (HR)Director (HR)
33 years of experience in EIL spanning Oil & Gas, Refining & Petrochemicals segmentsH h th d t t l f f t t li ti b h lf f th h d d l t f th C
o o jo g e Co pa y, s S a up as O GC s ce 983, e e s e eaded e e o a ceManagement and Benchmarking Group, which steers the performance contracts and service level agreements between board level and unit chiefs
Headed the SAP-HR Project for ONGC
17
AjayAjay N N DeshpandeDeshpandeDirector (TechnicalDirector (Technical) ) He has co-authored a total of four patent applications on behalf of the research and development of the Company
Currently responsible for functioning of Divisions in the Technical Directorate of EIL
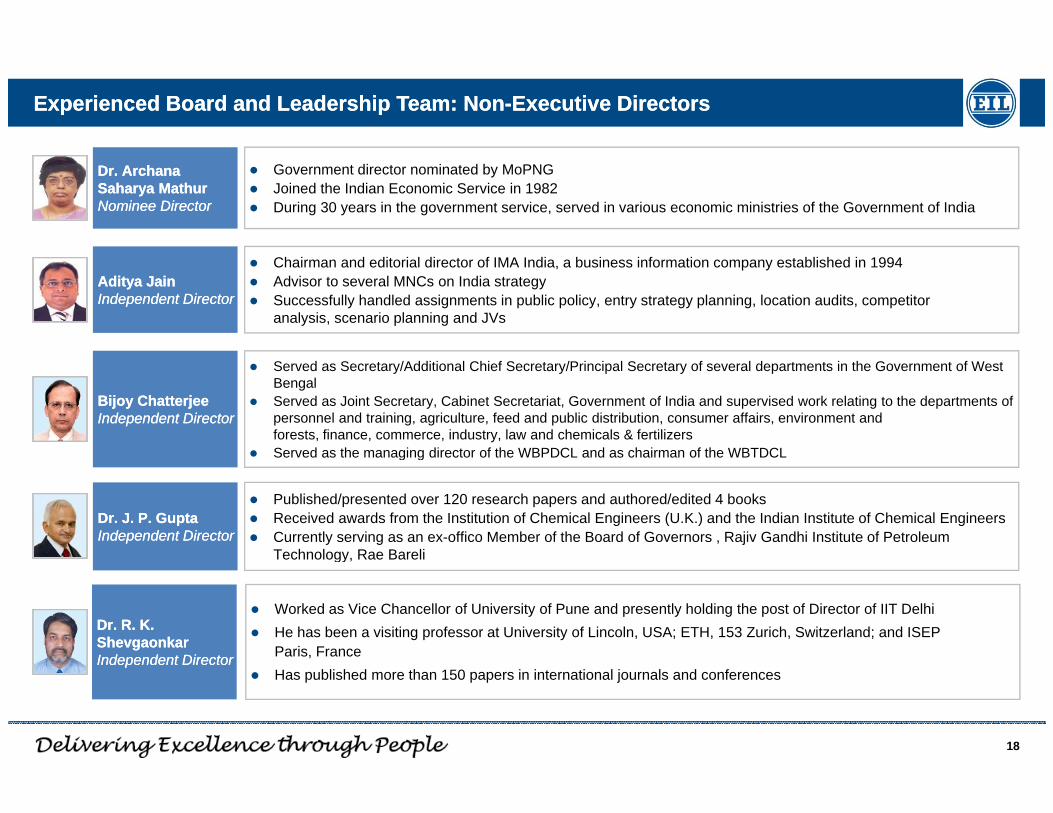
Experienced Board and Leadership Team: NonExperienced Board and Leadership Team: Non--Executive DirectorsExecutive Directors
Government director nominated by MoPNG Joined the Indian Economic Service in 1982 During 30 years in the government service, served in various economic ministries of the Government of India
Dr. Dr. ArchanaArchanaSaharyaSaharya MathurMathurNominee DirectorNominee Director
Chairman and editorial director of IMA India, a business information company established in 1994 Advisor to several MNCs on India strategy Successfully handled assignments in public policy, entry strategy planning, location audits, competitor
analysis, scenario planning and JVs
AdityaAditya JainJainIndependent DirectorIndependent Director
Served as Secretary/Additional Chief Secretary/Principal Secretary of several departments in the Government of West Bengal
Served as Joint Secretary, Cabinet Secretariat, Government of India and supervised work relating to the departments of personnel and training, agriculture, feed and public distribution, consumer affairs, environment and forests, finance, commerce, industry, law and chemicals & fertilizers
Served as the managing director of the WBPDCL and as chairman of the WBTDCL
BijoyBijoy ChatterjeeChatterjeeIndependent Director Independent Director
g g
Published/presented over 120 research papers and authored/edited 4 books Received awards from the Institution of Chemical Engineers (U.K.) and the Indian Institute of Chemical Engineers Currently serving as an ex-offico Member of the Board of Governors , Rajiv Gandhi Institute of Petroleum
Technology, Rae Bareli
Dr. J. P. GuptaDr. J. P. GuptaIndependent DirectorIndependent Director
gy,
Worked as Vice Chancellor of University of Pune and presently holding the post of Director of IIT Delhi He has been a visiting professor at University of Lincoln, USA; ETH, 153 Zurich, Switzerland; and ISEP
Paris, France
Dr. R. K. Dr. R. K. ShevgaonkarShevgaonkarIndependent DirectorIndependent Director
18
Has published more than 150 papers in international journals and conferencesIndependent Director Independent Director

Experienced Board and Leadership Team: NonExperienced Board and Leadership Team: Non--Executive DirectorsExecutive Directors
39 years of work experience in the Indian administrative sector, including ten years in positions of a joint secretary and above in the Government of India and Government of Gujarat
Handled the administrative divisions in the central ministries, dealing with several maharatna, navratna and mini ratna companies such as IOCL, HPCL, BPCL, MMTC, EPCGC, ITDC, GSFCL, etc
Dr. Christy Leon Dr. Christy Leon Fernandez Fernandez Independent DirectorIndependent Director
32 years of experience and has been associated with the legal service in the Ministry of Law and Justice (Department of Legal Affairs)
Served as the union law secretary monitoring the functioning of the department of legal affairs and functioned as
Mr. Mr. DhaniDhani Ram Ram MeenaMeena
Served as the union law secretary, monitoring the functioning of the department of legal affairs and functioned as an arbitrator and appellate authority and disposed of more than 200 cases as the law secretary
Independent DirectorIndependent Director
Over 37 years of experienceDr. Vizia SaradhiDr. Vizia Saradhi Previously worked with Hindustan Petroleum Corporation Limited and held various positions of responsibilities in
the organization Presently is a senior advisor to the University of Petroleum and Energy Studies, Uttarakhand
Dr. Vizia Saradhi Dr. Vizia Saradhi Vakkalanka Vakkalanka Venkateshwar Venkateshwar Independent DirectorIndependent Director
19
EIL’s Board of Directors comprise of qualified & reputed individuals with long-standing experience across industry verticals
Awards and Accolades (2010Awards and Accolades (2010--13)13)
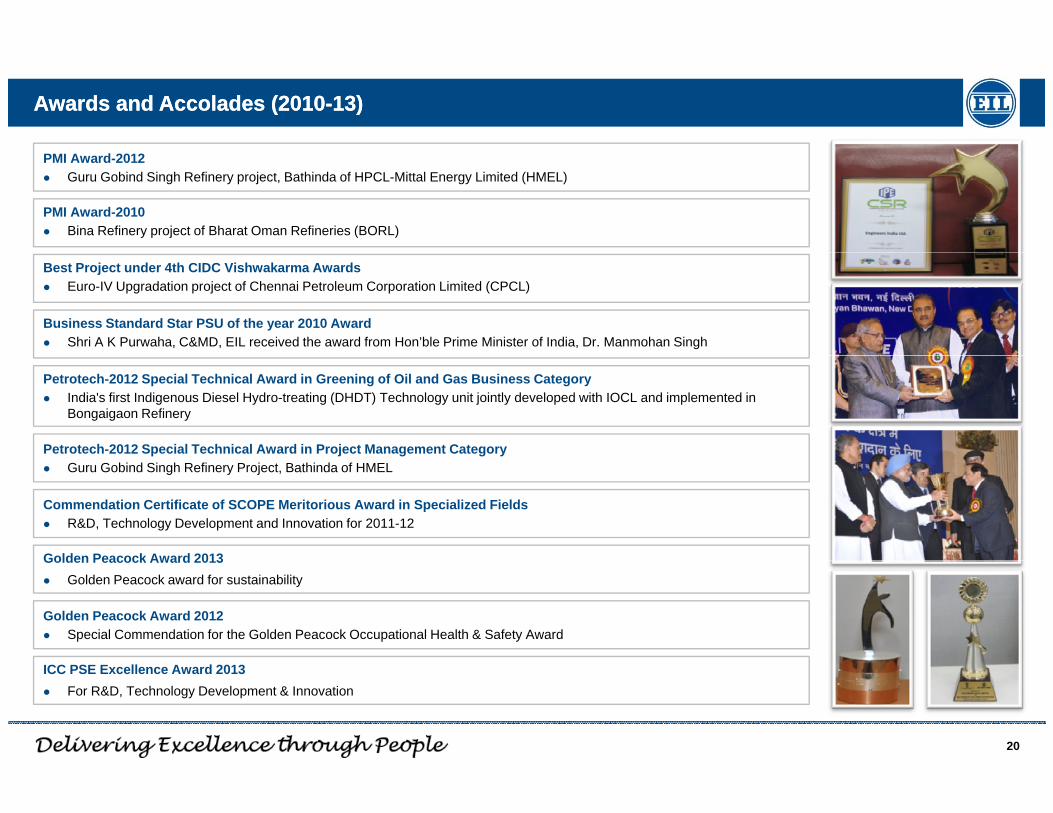
PMI Award-2010 Bina Refinery project of Bharat Oman Refineries (BORL)
PMI Award-2012 Guru Gobind Singh Refinery project, Bathinda of HPCL-Mittal Energy Limited (HMEL)
Best Project under 4th CIDC Vishwakarma Awards Euro-IV Upgradation project of Chennai Petroleum Corporation Limited (CPCL)
Business Standard Star PSU of the year 2010 Award Shri A K Purwaha, C&MD, EIL received the award from Hon’ble Prime Minister of India, Dr. Manmohan Singh
Petrotech-2012 Special Technical Award in Greening of Oil and Gas Business Category India's first Indigenous Diesel Hydro-treating (DHDT) Technology unit jointly developed with IOCL and implemented in
Bongaigaon Refinery
Petrotech-2012 Special Technical Award in Project Management Category
Golden Peacock Award 2013
Guru Gobind Singh Refinery Project, Bathinda of HMEL
Commendation Certificate of SCOPE Meritorious Award in Specialized Fields R&D, Technology Development and Innovation for 2011-12
Golden Peacock Award 2013 Golden Peacock award for sustainability
Golden Peacock Award 2012 Special Commendation for the Golden Peacock Occupational Health & Safety Award
20
ICC PSE Excellence Award 2013 For R&D, Technology Development & Innovation
Awards and Accolades (2010Awards and Accolades (2010--13)13)
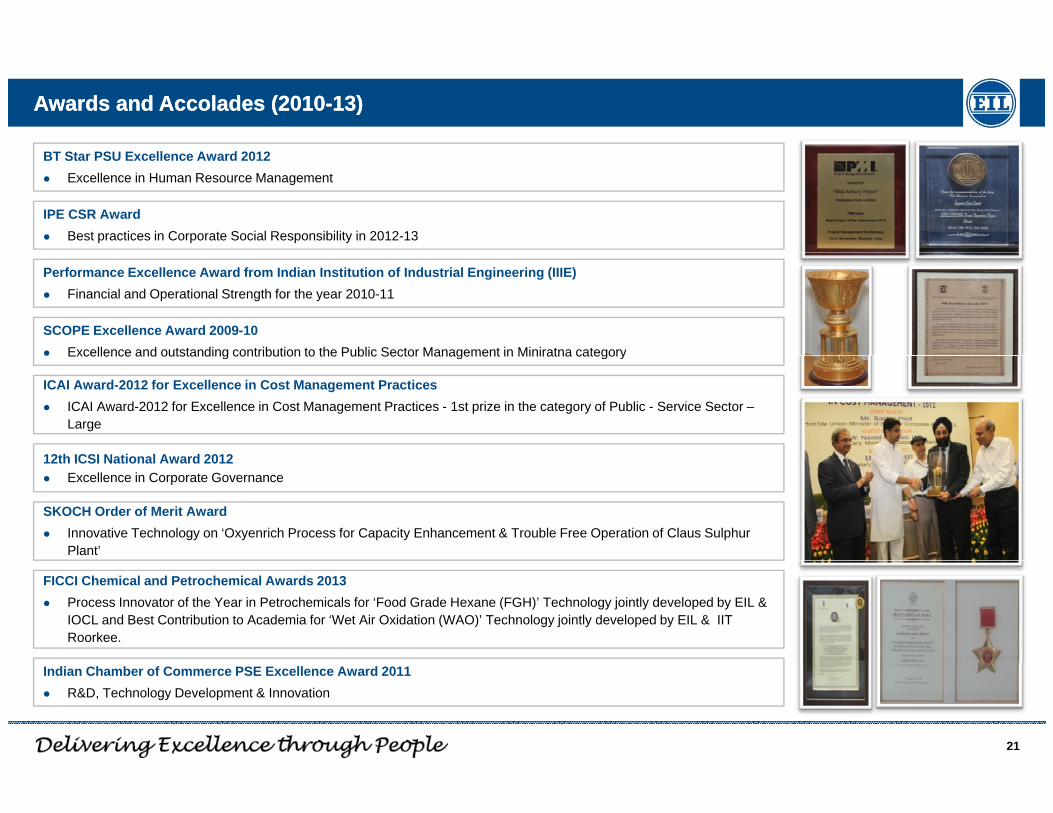
BT Star PSU Excellence Award 2012 Excellence in Human Resource Management
IPE CSR Award Best practices in Corporate Social Responsibility in 2012-13
SCOPE Excellence Award 2009-10 Excellence and outstanding contribution to the Public Sector Management in Miniratna category
Performance Excellence Award from Indian Institution of Industrial Engineering (IIIE) Financial and Operational Strength for the year 2010-11
Excellence and outstanding contribution to the Public Sector Management in Miniratna category
ICAI Award-2012 for Excellence in Cost Management Practices ICAI Award-2012 for Excellence in Cost Management Practices - 1st prize in the category of Public - Service Sector –
Large
12th ICSI National Award 201212th ICSI National Award 2012 Excellence in Corporate Governance
SKOCH Order of Merit Award Innovative Technology on ‘Oxyenrich Process for Capacity Enhancement & Trouble Free Operation of Claus Sulphur
Plant’
FICCI Chemical and Petrochemical Awards 2013 Process Innovator of the Year in Petrochemicals for ‘Food Grade Hexane (FGH)’ Technology jointly developed by EIL &
IOCL and Best Contribution to Academia for ‘Wet Air Oxidation (WAO)’ Technology jointly developed by EIL & IIT Roorkee.
21
Indian Chamber of Commerce PSE Excellence Award 2011 R&D, Technology Development & Innovation

33
Financials and Order Book Overview

Financial and Operating Track Record - Consolidated
T t l I (INR )* R S t ti **Total Income (INR mn)*
60%
80%Consulting Turnkey
Revenue Segmentation**
R m
n
30 000
40,000
50,000
53%40% 33%
50%61%
47%60% 67%
50%39%
2009-10 2010-11 2011-12 2012-13 2013-140%
20%
40%INR
21,97030,078
39,55728,458
21,824
0
10,000
20,000
30,000
2009 10 2010 11 2011 12 2012 13 2013 14
13,000
Consultancy & Engineering Revenue (INR mn)* Lumpsum Turnkey Projects Revenue (INR mn)*
28,000
** Revenue does not include Other Income2009-10 2010-11 2011-12 2012-13 2013-14
11,52812,139
12,573
11,32010,500
11,000
11,500
12,000
12,500
24,915
8,000
12,000
16,000
20,000
24,000
INR
mn
INR
mn
R f ll i l tt ib t d t l d i LSTK t
10,755,
9,500
10,000
2009-10 2010-11 2011-12 2012-13 2013-14
9,385 16,953
12,7177,145
0
4,000
,
2009-10 2010-11 2011-12 2012-13 2013-14
* Note: All figures have been taken on a consolidated basis
23
Revenue fall mainly attributed to slowdown in LSTK segment

Financial and Operating Track Record - Consolidated
Robust EBITDA** Performance (INR mn)*
30%8,000
mn
25%
23% 23%
21%
25%6,000
INR m
5,024
6,5477,157
5,928
3,830
19%
15%
20%
2,000
4,000
10%02009-10 2010-11 2011-12 2012-13 2013-14
EBITDA (INR mn) - LHS EBITDA Margins (%) - RHS
Fall in EBIDTA majorly on account of LSTK segment. EBIDTA mix sustained due to change in mix in favor of Consultancy
* Note: All figures have been taken on a consolidated basis** EBITDA: Earnings Before Interest, Tax, Depreciation and Amortization (does not include Other Income)
24
j y g g y
Leadership position across the
hydrocarbon sector value chain in India
2
5
6
7
8
44
1
3

Financial and Operating Track Record - Consolidated
30%8,000
Profitability (INR mn)*
19.1 18.820 80%30,000
Earnings per Share – EPS (INR)* Return on Net Worth (%)
INR Mn INR mnINR
5,313
6,439 6,322
4,82722%
25%26%
25%6,00013.2
15.8
14.3
14
16
18
18,988
22,952
25,217
50%
60%
70%
20,000
25,000
4,405
19%
17%
15%
20%
2 000
4,000
6
8
10
12
11,542
14,89939%36% 34%
28%
19%
30%
40%
50%
10,000
15,000
10%
15%
0
2,000
2009-10 2010-11 2011-12 2012-13 2013-140
2
4
2009-10 2010-11 2011-12 2012-13 2013-14
19%
0%
10%
20%
0
5,000
2009 10 2010 11 2011 12 2012 13 2013 14Profit After Tax (INR mn) - LHSPAT Margins (%) - RHS
2009 10 2010 11 2011 12 2012 13 2013 14
EPS (Basic and Diluted)
2009-10 2010-11 2011-12 2012-13 2013-14
Net worth (INR mn) - LHS
Return on Networth (%) - RHS
PAT Margins have improved even when overall PAT has fallen.
* Note: All figures have been taken on a consolidated basis
25
Overall growth in Net worth . Reduction in Net worth % due to fall in Profits
g p

Financial and Operating Track Record - Consolidated
Dividend Distribution (INR mn)*
6,967 1200%7,500
During FY 10‐11, Shares having face value of Rs 10 have been split into 2 shares of Rs 5 each During FY 10‐11 2:1 bonus shares were issued.
INR Mn
1060%
800%
1000%
4,500
6,000Dividend is based on enhanced capital after bonus
Successful Follow
1,218
1,9562,350 2,351
2,562
200%
400%
600%
1,500
3,000
fOn Public Offer (FPO for 10% disinvestment of Government stake.
35%
157%
37% 37% 37% 53%
185%
100%
120% 120% 130%
0%
200%
0
2008-09 2009-10 2010-11 2011-12 2012-13 2013-14Gross Dividend incl. tax (INR) - LHS Dividend Payout (%) - RHS
FPO concluded in Feb 2014
Dividend Rate (%) - (RHS)
* Note: All figures have been taken on a consolidated basis Dividend Payout calculated as a percentage of Profit After Tax (PAT)Dividend Rate calculated using net dividend (excluding dividend tax):
Consistent Dividend Track Record

Annual Performance Summary Annual Performance Summary –– StandaloneStandalone
Standalone Rs Mn
TURNOVER 2013-14 2012-13 2011-12 2010-11 2009-10 2008-09 2007-08
Consultancy 11,091 12,342 12,073 11,279 10,553 8,246 6,214
Turnkey 7,145 12,717 24,914 16,953 9,385 7,079 1,163
Consultancy + Turnkey 18,236 25,060 36,987 28,233 19,938 15,325 7,378
Other Income 3,360 3,164 2,321 1,604 1,837 2,215 1,356
Total Income 21,596 28,224 39,308 29,836 21,775 17,540 8,733
SEGMENT PROFITS 2013-14 2012-13 2011-12 2010-11 2009-10 2008-09 2007-08
Consultancy 3,880 5,271 5,108 4,866 4,242 2,999 2,078
Turnkey 403 1,105 2,452 1,956 920 310 144
Consultancy % 35% 43% 42% 43% 40% 36% 33%
Turnkey % 6% 9% 10% 12% 10% 4% 12%
PAT 2013-14 2012-13 2011-12 2010-11 2009-10 2008-09 2007-08
PAT 4798 6919 6363 5226 4356 3445 1946
27
PAT % 26% 28% 17% 19% 22% 22% 26%

Quarterly Performance Summary Quarterly Performance Summary -- StandaloneStandalone
FY : 13-14Rs MnStandalone
TURNOVER Q1 Q2 Q3 Q4 H1 H2 9M Annual
Consultancy – Domestic 2,650.5 2,300.0 2,469.7 2,270.6 4,950.4 4,740.3 7,420.2 9,690.7
FY : 13-14Rs MnStandalone
Consultancy - Overseas 341.0 319.0 373.0 367.0 660.0 740.0 1,033.0 1,400.0
Consultancy Total 2,991.5 2,619.0 2,842.7 2,637.6 5,610.4 5,480.3 8,453.2 11,090.7
Turnkey 1,440.4 2,032.8 1,361.2 2,310.7 3,473.2 3,672.0 4,834.4 7,145.1
Consultancy + Turnkey 4,431.9 4,651.8 4,204.0 4,948.3 9,083.6 9,152.2 13,287.6 18,235.9
Other Income 680.3 828.2 1,083.6 767.9 1,508.5 1,851.5 2,592.1 3,360.0
T t l ITotal Income 5,112.2 5,479.9 5,287.6 5,716.2 10,592.1 11,003.8 15,879.7 21,595.9
SEGMENT PROFIT Q1 Q2 Q3 Q4 H1 H2 9M Annual
Consultancy 1 172 5 904 8 1 046 2 757 0 2 077 3 1 803 2 3 123 5 3 880 5y 1,172.5 904.8 1,046.2 757.0 2,077.3 1,803.2 3,123.5 3,880.5
Turnkey 103.0 137.9 67.4 95.0 240.9 162.4 308.3 403.3
Total 1,275.5 1,042.8 1,113.6 852.0 2,318.2 1,965.5 3,431.8 4,283.8
28
* Note: All figures are on standalone basis and rounded off to nearest digit

Quarterly Performance Track Record - Standalone
9042
8,000
10,000 Consultancy Turnkey Other Income
Total Income
Mn
2780 2850 3233 3211 28923528
2896 3027 2991 2619 2843 2638
5756 54244692 4308
3149 3152
21081440
20331361
2311
418 540 444920 733 710 669 1053 680 828 1084 768
2,000
4,000
6,000 INR M
418 540 444
0 Q1 11-12 Q2 11-12 Q3 11-12 Q4 11-12 Q1 12-13 Q2 12-13 Q3 12-13 Q4 12-13 Q1 13-14 Q2 13-14 Q3 13-14 Q4 13-14
Consulting Turnkey
Revenue Mix (Consultancy Vs Turnkey)
59%67% 68%67% 66% 59%
74%60%30%
40%
50%
60%
70%
33% 34% 41%26%
40%53% 48%
59% 56% 53%66% 59% 60%
47% 52%41%
33%44%
32%47%
-10%
0%
10%
20%
30%
Q1 11-12 Q2 11-12 Q3 11-12 Q4 11-12 Q1 12-13 Q2 12-13 Q3 12-13 Q4 12-13 Q1 13-14 Q2 13-14 Q3 13-14 Q4 13-14
29Note: All figures have been taken on a standalone for EIL

Quarterly Performance Track Record – Standalone
1,455 1,530 1 3361,500
Consultancy Turnkey
Segment Wise Operating Profit
1,165 1,186 1,302
1,203 1,202 1,336
1,172
905 1,046
757 732557 481
682
450262 241
500
1,000
1,500
INR
Mn
262 241152 103 138 67 95
0 Q1 11-12 Q2 11-12 Q3 11-12 Q4 11-12 Q1 12-13 Q2 12-13 Q3 12-13 Q4 12-13 Q1 13-14 Q2 13-14 Q3 13-14 Q4 13-14
Segment Wise Profit %
30%
40%
50%
Consulting Turnkey
42% 42% 45% 41% 42% 43% 42% 44% 39% 35% 37%29%
13% 10% 10% 8% 10% 8% 8% 7% 7% 7% 5% 4%0%
10%
20%
Q1 11-12 Q2 11-12 Q3 11-12 Q4 11-12 Q1 12-13 Q2 12-13 Q3 12-13 Q4 12-13 Q1 13-14 Q2 13-14 Q3 13-14 Q4 13-1430
Note: All figures have been taken on a standalone for EIL

Business Secured and Order Book Business Secured and Order Book –– StandaloneStandalone
Business Secured FY 13-14 FY 12-13 FY 11-12 FY 10-11 FY 09-10
Consultancy (domestic) 4,073 11,573 5,072 8,364 6,337
Consultancy (overseas)* 54%
17% 10%
59%80%
100%
Consultancy Turnkey
Rs Mn
Consultancy (overseas) 696 1,386 1,217 362 706
Consultancy Total 4,768 12,959 6,289 8,726 7,043
Turnkey 6,779 1,425 1,297 31,821 8,175
Total Business secured 11 547 14 384 7 586 40 547 15 218
46%22%
83% 90%
41%
78%59%
0%
20%
40%
60%
Order Book March 14 March 13 March 12 March 11 March 10
Total Business secured 11,547 14,384 7,586 40,547 15,218 0%2009-10 2010-11 2011-12 2012-13 2013-14
Consultancy Turnkey
Rs Mn
Order Book March 14 March 13 March 12 March 11 March 10
Consultancy * 15,717 21,012 20,062 25,840 29,158
Turnkey 13,391 12,163 25,421 49,003 33,210
Total Order Book 29 108 33 175 45 483 74 843 62 368
53%65% 56%
37% 46%
40%
60%
80%
100%
Total Order Book 29,108 33,175 45,483 74,843 62,368
Consultancy % 54% 63% 44% 35% 47%
Turnkey % 46% 37% 56% 65% 53%
47%35% 44%
63% 54%
0%
20%
40%
2009-10 2010-11 2011-12 2012-13 2013-14Note : Data on unconsolidated basis
31
* Does not include US$ 139 Mn contract initialed with M/s Dangote Group for 20 Million Tone Refinery in Nigeria
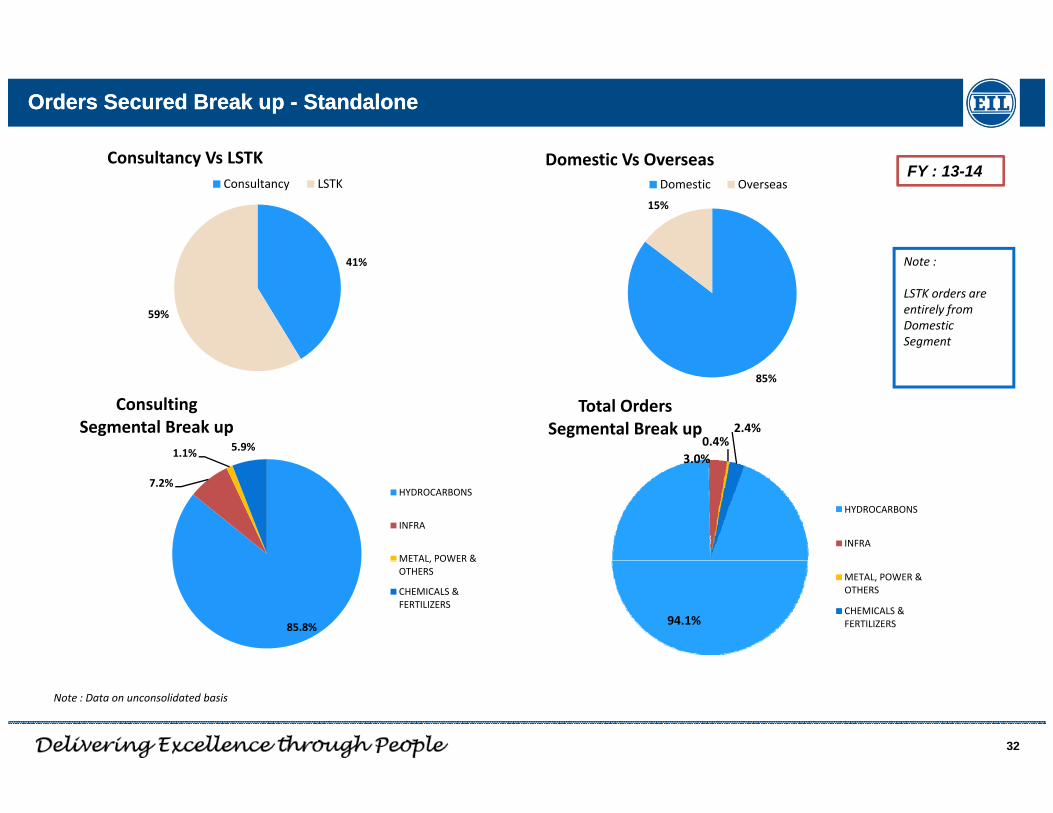
Orders Secured Break up Orders Secured Break up -- StandaloneStandalone
15%
Domestic Vs OverseasDomestic Overseas
Consultancy Vs LSTKConsultancy LSTK
FY : 13-14
41%
59%
Note :
LSTK orders are entirely from Domestic Segment
85%
3 0%0.4%
2.4%
Total OrdersSegmental Break up
1.1% 5.9%
Consulting Segmental Break up
3.0%
HYDROCARBONS
INFRA
7.2%HYDROCARBONS
INFRA
METAL, POWER &
94.1%
METAL, POWER & OTHERS
CHEMICALS & FERTILIZERS85.8%
METAL, POWER & OTHERS
CHEMICALS & FERTILIZERS
32
Note : Data on unconsolidated basis

Order Book Break up Order Book Break up -- StandaloneStandalone
1.0%
10.9%3.0%
OBP: Consulting Break up
HYDROCARBONS
C C S &
OBP: Consultancy Vs LSTK FY : 13-14
75.2%
10.0% CHEMICALS & FERTILIZERSMETAL
INFRA
POWER & OTHERS
54%46%
Consultancy
LSTK
OBP: Domestic Vs Overseas OBP: LSTK Break up
11%
Domestic
Overseas
11%
HYDROCARBONS
89% 89%
33
Note : Data on unconsolidated basis

Salient Orders Secured during the year Salient Orders Secured during the year -- StandaloneStandalone
DomesticDomestic
Project scope Client Contract Value(Rs. Million) Award Date Completion
Date
Coker Block of Resid Upgradation Project CPCL 6700 Q2,FY13-14 Q4,FY15-16
C lt S i f R i f U d Pl tf
TUURN
KEY
Consultancy Services for Revamping of Unmanned Platform Phase-II ONGC 585 Q1, FY3-14 Q2,FY17-18
PMC services for Kochi-Coimbatore-Erode-Salem LPG Pipeline Project BPCL 500 Q4, FY 13-14 Q3,FY15-16
Coke Chamber Replacement and Allied Modernization in C k A t B i R fi IOCL 445 Q3, FY 13-14 Q3,FY16-17Coker-A at Barauni Refinery IOCL 445 Q3, FY 13 14 Q3,FY16 17
PMC services for Irugur Devangonthi Pipeline Project BPCL 230 Q4, FY 13-14 Q3,FY15-16
PMC for Dahej Expansion-Phase IIIA PETRONET 200 Q4, FY13-14 Q3,FY16-17
ULTANCY
Consultancy Services for Housing Projects undertaken by Gujarat Housing Board - PART 1
Gujarat Housing Board 148 Q3, FY 13-14 Q3,FY15-16
Overseas
PMC for 1.900 TPD Ammonia plant at Central Sulawesi, Indonesia
Panca Amara Utama, Indonesia 235.06 Q2, FY13-14 Q4,FY 15-16
CONSU
PMC for EPC of Upgrade and Replacement of Substation Project Phase-1 (Substation 6 and U) ADGAS 194.50 Q2,FY13-14 Q1, FY 16-17
Adv FEED Studies for Kuzey Marmara Fixed Offshore Platforms & Pipelines and Offshore Engineering & Consultancy Services TPAO 109.049 Q3,FY 13-14 Q2,FY14-15
34
US$ 139 Million Consultancy contract initialed with M/s Dangote Group for 20 Million Tone Refinery in Nigeria

Select Ongoing Projects Select Ongoing Projects –– StandaloneStandalone
RefineryRefinery
6 MMTPA Integrated Refinery Expansion Project (IREP) at Kochi of Bharat Petroleum Corporation Ltd (BPCL)
Wax unit of Numaligarh Refineries Ltd (NRL)
Refinery expansion & up-gradation project for Mangalore Refinery and Petrochemicals Ltd (MRPL)
6 MMTPA capacity CDU-4 Project at Mumbai Refinery for BPCL
Rehabilitation and adaptation of Algiers refinery refinery of SONATRACH
Kochi-Coimbatore-Erode-Salem LPG Pipeline and Irugur Devangonthi Pipeline Projects of BPCL
Mallavaram-Bhopal-Bhilwara-Vijaipur Pipeline Project (MBBVPL) for Gujarat State Petroleum Corporation (GSPL) & Gujarat India Transco Ltd. (GITL)
PipelinesPipelines( )
Upgrading pump stations/ terminals of Naharkatiya-Barauni Crude Oil Pipeline for Oil India Limited
Dabhol-Bangalore gas pipeline of total 1200 KMs project for GAIL (India) Ltd
Mehsana-Bhatinda Pipeline Project of total 1600 KMs for GSPL
Terminal Terminal & & StoragesStorages
Dahej LNG Expansion (Phase IIIA ) for Petronet LNG
Strategic Crude Oil Facilities in Rock Caverns for the Indian Strategic Petroleum Reserves Limited at Mangalore, Vishakhapatnam and Padur
Development of port facilities for Ratnagiri Gas and Power Pvt Ltd for GAIL (India) Ltd
Offshore/Offshore/Onshore Oil & Onshore Oil &
GasGas
Revamp of Unmannned Platforms (Ph II) for ONGC
Offshore platform projects for Gujarat State Petroleum Corporation (GSPC)
Western Onshore Redevelopment Project for Mehsana, Ankleshwar and Ahmedabad Assets of ONGC
Habshan Acid Gas Flare Recovery Project for Abu Dhabi Gas Industries Ltd
35
Habshan Acid Gas Flare Recovery Project for Abu Dhabi Gas Industries Ltd.
Revamp of BPA/BPB platforms for ONGC

Select Ongoing Projects Select Ongoing Projects –– StandaloneStandalone
Petrochemicals & Petrochemicals & FertilizersFertilizers
Dahej Petrochemical Complex for ONGC Petro-additions Ltd (OPaL) Assam Gas Cracker Complex at Lepetkata for BCPL Petrochemical expansion project at GAIL Vijaipur and GAIL Pata plants Facility to produce fertilizer products in Port Harcourt, River State, Nigeria ShahJalal fertilizer project for BCIC, Bangladesh
Mining and Mining and MetallurgyMetallurgy
p j , g Ammonia Plant in Indonesia for Panca Amara Utama (PAU)
Second phase expansion of Bauxite Mines, Alumina Refinery for NALCO, Bhubaneswar Mahan Aluminum Smelter project, Madhya Pradesh for HINDALCO Aditya Aluminum Smelter project Odisha for HINDALCOMetallurgyMetallurgy
InfrastructureInfrastructure
Aditya Aluminum Smelter project, Odisha for HINDALCO Fourth Stream Upgradation Project for Bauxite Mines and Alumina Refinery, Orissa for NALCO
Canal, Pipeline and Pumping station works of Sardar Sarovar Narmada Nigam Limited (SSNNL) Data Centre of UIDAI at Delhi and Bengaluru for Unique Identification Authority of India (UIADI) Interceptor Sewer Project for the abatement of pollution in River Yamuna for Delhi Jal Board (DJB) Interceptor Sewer Project for the abatement of pollution in River Yamuna for Delhi Jal Board (DJB) Rajiv Gandhi Institute of Petroleum technology (RGIPT) at Rai Bareli and Sibsagar
Nuclear: Nuclear Fuel Complex at Rawatbhata, Kota Captive: Captive Power Plant for Paradip refinery of IOCL
PowerPower
Turnkey ProjectsTurnkey Projects
Coker Block for Resid Upgradation Project of CPCL, Chennai Butene-1 Project at Panipat Naphtha Cracker Complex for IOCL Onshore Gas Processing Complex at Kakinada for GSPC Pipeline and South Jetty Facilities for IOCL Paradip Refinery
36
Pipeline and South Jetty Facilities for IOCL Paradip Refinery PFCC, SRU and Polypropylene Projects of Phase III refinery project at Mangalore for MRPL

44
Business Outlook and Strategy

Investments planned in Energy and HydrocarbonsInvestments planned in Energy and Hydrocarbons
Sector Total 12th Plan Outlay (INR Bn)
Exploration & Production 2,837
Refinery & Marketing 1 056
Global Energy Demand to Grow By 4Bn toe over next 2 Decades Sustained Focus on Hydrocarbon Sector in India
16
17
NuclearHydro
Renew.*2030 Level
oe)
Demand Supply
Refinery & Marketing 1,056
Petro-Chemical 173
Total 4,066
Twelfth plan targetE i f i ti fi i b 50 6 MMTPA
13
14
15
OtherTight
Other
Shale
(Bill
ion
to
220 221
Investments of US$ 224 Bn expected in Indian Oil & Gas Space
RefineriesRefineries
LNG reLNG re--gasificationgasification
Expansion of existing refineries by 50.6 MMTPA
Commissioning of 30 MMTPA of new grassrootrefineries
Capacity to reach 50 MMTPA by 2016-17 from 13 60 MMTPA presentlyin US$ Bn (2010-2035)
122011 OECD Non-… 2011 Oil Natural… Coal Non-…
220
139
10590
132
221
6089
104122
gasificationgasification
PetroPetro--chemicalschemicals
13.60 MMTPA presently
Ethylene capacity estimated to increase from 3.867 MMT in 2011-12 to 7.087 MMT in 2016-17
Propylene capacity estimated to increase from 4.117 MMT in 2011-12 to 4.987 MMT in 2016-17
3958 6048
2944
China India Middle East Africa Latin America
Oil Refining NG Transmission&Dist. LNG
FertilizersFertilizers
Gas based urea capacity to increase from 24 MMTPA at present to 32 MMTPA by 2016-17.
Emphasis on conversion of present naphtha/fuel and oil based plants to use of natural gas as feed g
38
stock.
Source: BP Energy Outlook 2030 - Jan 2013, World Energy Outlook, 2010 and 2011 Source: 12th Five Year Plan , Planning Commission
Potential opportunities in Infrastructure and Non Ferrous MetallurgyPotential opportunities in Infrastructure and Non Ferrous Metallurgy
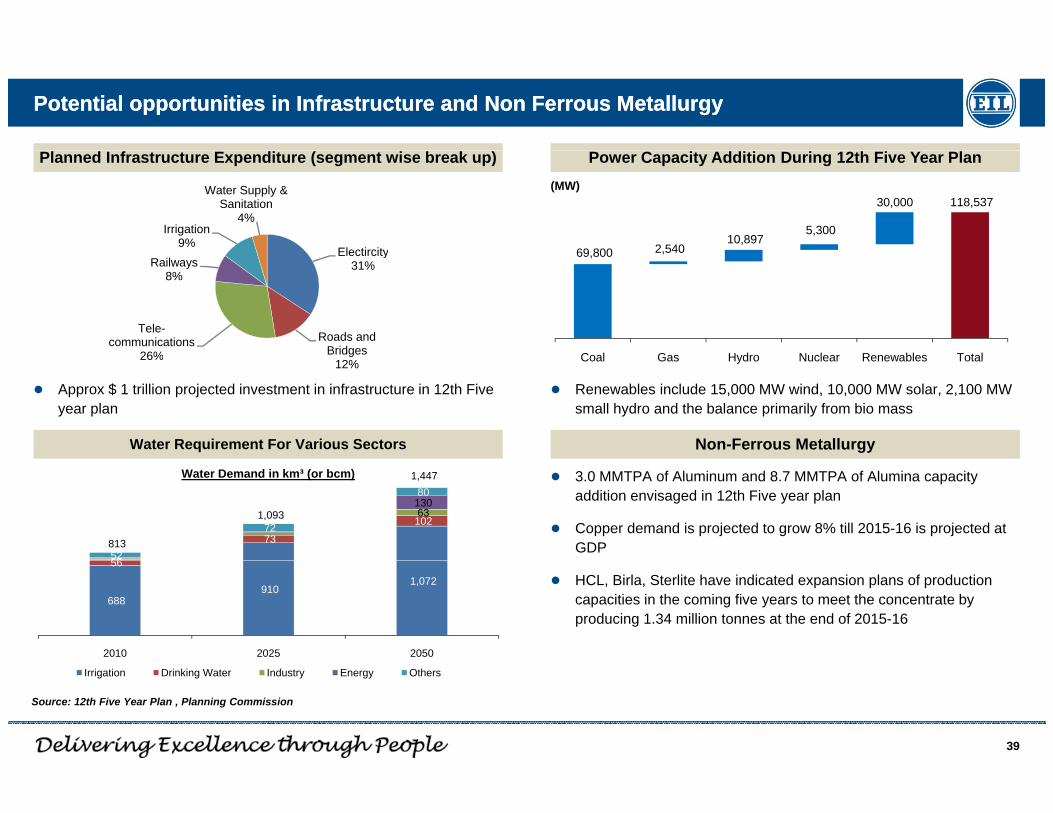
Planned Infrastructure Expenditure (segment wise break up) Power Capacity Addition During 12th Five Year Plan
Electircity
Irrigation9%
Water Supply & Sanitation
4%
69 800 2,540 10,897
5,300
30,000 118,537 (MW)
Electircity31%
Roads and Bridges
Tele-communications
26%
Railways8%
69,800 ,
Coal Gas Hydro Nuclear Renewables Total
Approx $ 1 trillion projected investment in infrastructure in 12th Five year plan
Renewables include 15,000 MW wind, 10,000 MW solar, 2,100 MW small hydro and the balance primarily from bio mass
Water Requirement For Various Sectors Non-Ferrous Metallurgy
g12%
26% Coal Gas Hydro Nuclear Renewables Total
56
73
102 63
130
52
72
80
813
1,093
1,447 3.0 MMTPA of Aluminum and 8.7 MMTPA of Alumina capacity addition envisaged in 12th Five year plan
Copper demand is projected to grow 8% till 2015-16 is projected at GDP
Water Demand in km³ (or bcm)
688 910
1,072
56
2010 2025 2050
HCL, Birla, Sterlite have indicated expansion plans of production capacities in the coming five years to meet the concentrate by producing 1.34 million tonnes at the end of 2015-16
39
Irrigation Drinking Water Industry Energy Others
Source: 12th Five Year Plan , Planning Commission

Strategy for Future GrowthStrategy for Future Growth
E t bli h lli d
Road map to Road map to become a world class become a world class
globally competitive globally competitive EPC EPC and total solutions and total solutions
companycompany
Leverage track record
Technology and knowledge development
Strategic alliances for
Establish alliances and share risks with strategic partners with complementary resources, skills and strategies
Focus on core strengths -
Strengthen presence in Middle East, North Africa and South East Asia –creation of engineering
Leverage track record for related diversification
Target specific project segments and industries where EIL has a competitive advantage
gdiversification
JVs and consortium for EPC and overseas
Long term relationships / MOUs with clients
Develop relationships/ JVs with other EPC players for bidding in large projects
gdesign, engineering and construction
Pursue EPC contracts
Bid for large scale projects
creation of engineering hub
Formulate entry strategy for Latin America and South Asia
p g MOUs with clients
Focus on Focus on technology technology and and alliancesalliances
Strategic relationshipsStrategic relationships
Selectively form alliances with key equipment manufacturers
M i t i l d hiM i t i l d hi
Expand international Expand international operationsoperations
Selectively diversifySelectively diversify
40
Maintain leadershipMaintain leadership

55
Details of Follow on Public Offer of EIL

Offer SummaryOffer Summary
Price Band offered / Final Issue Price Rs 145 to Rs 150 per share / Rs 150 per sharePrice Band offered / Final Issue Price Rs. 145 to Rs.150 per share / Rs 150 per share
Retail and Employee Discount Rs. 6 per share
Offer Size Rs. 4,813 Million to Rs. 4,981 Million
Dilution 10%
Public Offer aggregating to 33,693,660 equity shares of Rs. 5 each through an Offer For Sale by The President of India,acting through the Ministry of Petroleum and Natural Gas, Government of India
Consisting of:
Employee Reservation 500,000 Equity Shares
N t Off t P bli 33 193 660 E it ShNet Offer to Public: 33,193,660 Equity Shares
Of Which:
QIB Portion Not more than 16,596,830 Equity Shares (50%)
Non-Institutional Portion Not less than 4,979,049 Equity Shares (15%)
Retail Portion Not less than 11,617,781 Equity Shares (35%)
Issue Opening date Thursday, February 6, 2014
Issue Closing date Wednesday, February 12, 2014
Book Running Lead ManagersBook Running Lead Managers
Listing
Registrar to the Offer
42
Registrar to the Offer
Note: Above numbers are considering full subscription in the respective buckets

FPO Subscription detailsFPO Subscription details
Category No. of shares offered/reserved
Bid received (No. of Shares) No of Times Subscribed
Qualified Institutional Buyers (QIBs) 16,596,830 65,281,500 3.93
Non Institutional Investors (HNI) 4,979,049 1,136,800 0.23
Retail Individual Investors (RIIs) 11,617,781 ~28,812,000 2.48
Employee 500,000 110,200 0.22p y , ,
Overall 33,693,660 95,117,900 2.83
QIB Bidding Break up Total Shares applied for % of Total
Foreign Institutional Investors(FIIs) 1,38,93,000 21%
Domestic Financial Institutions(Banks/ Financial Institutions(FIs)/ Insurance Companies) 4,68,78,600 72%
Mutual funds 45,09,900 7%
Others - 0%
Grand Total 6,52,81,500 100%
43

DisclaimerDisclaimer
Thi t ti t i f di t ib ti l d h i t b itt d b li bl l It i bli h d l l f i f ti itThis presentation report is for distribution only under such circumstances as may be permitted by applicable law. It is published solely for information purposes, itdoes not constitute an advertisement and is not to be construed as a solicitation or an offer to buy or sell any securities or related financial instruments in anyjurisdiction. No representation or warranty, either express or implied, is provided in relation to the accuracy, completeness or reliability of the informationcontained herein, except with respect to information concerning EIL’s past performance, its subsidiaries and affiliates, nor is it intended to be a completestatement or summary of the future proposals , strategies and projections referred to in the report. EIL does not undertake that investors will obtain profits, norwill it share with investors any investment profits nor accept any liability for any investment losses. Investments involve risks and investors should exerciseprudence in making their investment decisions The report should not be regarded by recipients as a substitute for the exercise of their own judgment Pastprudence in making their investment decisions. The report should not be regarded by recipients as a substitute for the exercise of their own judgment. Pastperformance is not necessarily a guide to future performance. The value of any investment or income may go down as well as up and you may not get back thefull amount invested. Any opinions expressed in this report are subject to change without notice and may differ or be contrary to opinions expressed by otherbusiness groups of EIL as a result of using different assumptions and criteria.
This presentation report may contain certain “forward-looking statements”. These forward-looking statements generally can be identified by words or phrasessuch as “aim”, “anticipate”, “believe”, “expect”, “estimate”, “intend”, “objective”, “plan”, “project”, “shall”, “will”, “will continue”, “will pursue” or other words orphrases of similar import. Similarly, statements that describe our strategies, objectives, plans or goals are also forward-looking statements. All forward-lookingstatements are subject to risks, uncertainties and assumptions about us that could cause actual results to differ materially from those contemplated by therelevant statement. These forward looking statements are based on our current plans and expectations. Actual results may differ materially from thosesuggested by the forward-looking statements due to risks or uncertainties associated with our expectations with respect to, but not limited to, regulatory changespertaining to the industries in which we have our businesses and our ability to respond to them, our ability to successfully implement our strategy, our growth andexpansion, technological changes, our exposure to market risks, general economic and political conditions which have an impact on our business activities orinvestments the monetary and fiscal policies of India inflation deflation unanticipated turbulence in interest rates foreign exchange rates equity prices or otherinvestments, the monetary and fiscal policies of India, inflation, deflation, unanticipated turbulence in interest rates, foreign exchange rates, equity prices or otherrates or prices, the performance of the financial markets in India and globally, changes in Indian laws, regulations and taxes and changes in competition in ourindustry etc.
EIL reserves the right to alter, modify or otherwise change the presentation without notifying any person of such changes or revision. Neither the author or EILshall be liable for any direct or indirect damages that may arise due to any act or omission on the part of the user due to any reliance placed or guidance takenfrom this presentation report. Further, EIL is under no obligation to update or keep current the information contained herein.g
The disclosures contained in this presentation report produced by EIL shall be governed by and construed in accordance with laws of India. EIL specificallyprohibits the redistribution of this material in whole or in part without the written permission of EIL and EIL accepts no liability whatsoever for the actions of thirdparties in this respect. Images may depict objects or elements which are protected by third party copyright, trademarks and other intellectual property rights. Allrights reserved.
44
Thank You


![HIT-1 INJECTION MORTAR · [kN] 1,3 1,3 1,7 1,6 2,5 1,7. Recommended loads for hollow bricks Anchor size M8 M10 M12 Hollow bricks type HZL 12 Doppio Uni HZL 12 Doppio Uni HZL 12 Doppio](https://static.fdocuments.us/doc/165x107/5e147690eaf3262cbf51021f/hit-1-injection-mortar-kn-13-13-17-16-25-17-recommended-loads-for-hollow.jpg)


