
Eijggs3044
11
INTERNATIONAL JOURNAL OF GEOMATICS AND GEOSCIENCES Volume 2, No 2, 2011 © Copyright 2010 All rights reserved Integrated Publishing services Research article ISSN 0976 – 4380 Submitted on September 2011 published on November 2011 519 Land use and Land Cover mapping using digital classification technique in Tikamgarh district, Madhya Pradesh, India using Remote Sensing Karwariya.Sateesh 1 , Goyal Sandip 2 1- Research Associate, Centre for Policy Studies New Delhi, Associated With Madhya Pradesh Council of Science and Technology, Bhopal (MP) 462003, India 2- Sr.Scientist, Madhya Pradesh Council of Science and Technology, Bhopal (MP) 462003 [email protected] ABSTRACT Tikamgarh is one of the oldest inhabitation of India. It is located in the northwestern part of Sagar Division of Madhya Pradesh. Geographically it lies on the Bundhelkhand Plateau between the Jamni, a tributary of the Betwa and the Dhasan rivers. It extends between the 24° 26’ N to 25° 34’ N latitudes and 78° 26’ E to 79° 21 E longitudes. The total geographical area of Tikamgarh District is 5048 sq. km. The total population of the district is 12,02,998 (2001 Census). Male constitute 53% and female 47% of the total population. Land use and Land cover is an important parameter for developmental planning. In the present study an attempt has been made to generate the land use land cover map from IRS satellite image using unsupervised classification. The study is based on secondary data; and using Erdas imaging software to subset the study area. The satellite imagery has used to prepare the land use and land cover map using unsupervised classification. The land use and land cover map clearly shows that area of crop land is higher than others. In this research paper, remotely sensed data would be used to fill the gap in the knowledge on the state of land use and Land cover in Tikamgarh district. The goal is to undertake a detailed, spatially explicit inventory of local trends in land use and land cover changes. This data coupled with the interdisciplinary assortment of scientific methods will be used to investigate the causes and consequences of land use/cover change across a range of spatial and temporal scales. The result of this paper would contribute to developing recommendations to enhance sustainability and foster resilience Keywords: Land use, Land cover, LISS-3+Pan Data, Satellite imagery, Unsupervised classification technique. 1. Introduction Land use relates to the human activity or economic function associated with a specific piece of Land (Lillesand et al. 2004). Examples of land use include agriculture, urban development, grazing, logging, and mining. In contrast, land cover relates to the composition and Characteristics of land surface elements (Cihlar 2000). The term land cover originally referred to The kind and state of vegetation, but it has broadened in subsequent usage to include human Structures such as buildings or pavement and other aspects of the natural environment, such as Soil type, biodiversity, and surface and groundwater (Meyer 1995). Land cover categories Generally include cropland, forests, wetlands, pasture, roads, and urban areas.
-
Upload
sunilkumar-mandal -
Category
Documents
-
view
21 -
download
0
Transcript of Eijggs3044

INTERNATIONAL JOURNAL OF GEOMATICS AND GEOSCIENCES
Volume 2, No 2, 2011
© Copyright 2010 All rights reserved Integrated Publishing services
Research article ISSN 0976 – 4380
Submitted on September 2011 published on November 2011 519
Land use and Land Cover mapping using digital classification technique in
Tikamgarh district, Madhya Pradesh, India using Remote Sensing Karwariya.Sateesh
1, Goyal Sandip
2
1- Research Associate, Centre for Policy Studies New Delhi, Associated With Madhya
Pradesh Council of Science and Technology, Bhopal (MP) 462003, India
2- Sr.Scientist, Madhya Pradesh Council of Science and Technology, Bhopal (MP) 462003
ABSTRACT
Tikamgarh is one of the oldest inhabitation of India. It is located in the northwestern part of
Sagar Division of Madhya Pradesh. Geographically it lies on the Bundhelkhand Plateau
between the Jamni, a tributary of the Betwa and the Dhasan rivers. It extends between the 24°
26’ N to 25° 34’ N latitudes and 78° 26’ E to 79° 21 E longitudes. The total geographical area
of Tikamgarh District is 5048 sq. km. The total population of the district is 12,02,998 (2001
Census). Male constitute 53% and female 47% of the total population.
Land use and Land cover is an important parameter for developmental planning. In the
present study an attempt has been made to generate the land use land cover map from IRS
satellite image using unsupervised classification. The study is based on secondary data; and
using Erdas imaging software to subset the study area. The satellite imagery has used to
prepare the land use and land cover map using unsupervised classification. The land use and
land cover map clearly shows that area of crop land is higher than others.
In this research paper, remotely sensed data would be used to fill the gap in the knowledge on
the state of land use and Land cover in Tikamgarh district. The goal is to undertake a detailed,
spatially explicit inventory of local trends in land use and land cover changes. This data
coupled with the interdisciplinary assortment of scientific methods will be used to investigate
the causes and consequences of land use/cover change across a range of spatial and temporal
scales. The result of this paper would contribute to developing recommendations to enhance
sustainability and foster resilience
Keywords: Land use, Land cover, LISS-3+Pan Data, Satellite imagery, Unsupervised
classification technique.
1. Introduction
Land use relates to the human activity or economic function associated with a specific piece
of Land (Lillesand et al. 2004). Examples of land use include agriculture, urban development,
grazing, logging, and mining. In contrast, land cover relates to the composition and
Characteristics of land surface elements (Cihlar 2000). The term land cover originally
referred to The kind and state of vegetation, but it has broadened in subsequent usage to
include human Structures such as buildings or pavement and other aspects of the natural
environment, such as Soil type, biodiversity, and surface and groundwater (Meyer 1995).
Land cover categories Generally include cropland, forests, wetlands, pasture, roads, and
urban areas.
Land use and Land Cover mapping using digital classification technique in Tikamgarh district, Madhya
Pradesh, India using Remote Sensing
Karwariya.Sateesh, Goyal Sandip
International Journal of Geomatics and Geosciences
Volume 2 Issue 2, 2011 520
Land use is obviously constrained by environmental factors such as soil characteristics,
climate, topography and vegetation. But it also reflects the importance of land as a key and
finite resource for most human activities including agriculture, industry, forestry, energy
production, settlement, recreation, and water catchment and storage. Land is a fundamental
factor of production, and through much of the course of human history, it has been tightly
coupled with economic growth. Often improper Land use is causing various forms of
environmental degradation. For sustainable utilization of the land ecosystems, it is essential
to know the natural characteristics, extent and location, its quality, productivity, suitability
and limitations of various land uses. Land use is a product of interactions between a society's
cultural background, state, and its physical needs on the one hand, and the natural potential of
land on the other (Balak Ram and Kolarkar 1993). In order to improve the economic
condition of the area without further deteriorating the bio environment, every bit of the
available land has to be used in the most rational way.
As a result of technological advancements, changes of the earth’s surface have become
visible by satellite imagery as a result remote sensing has become the most effective tool for
assessing and monitoring all these transitions (Deer 1995). Therefore satellite remote sensing
has become a major data source for different change detection applications, because of the
repetitive data acquisition capabilities, digital format suitability for computer processing and
lower cost than those associated with traditional methods (Coppin et al. 2002; Deer 1995; Lu
et al. 2004).
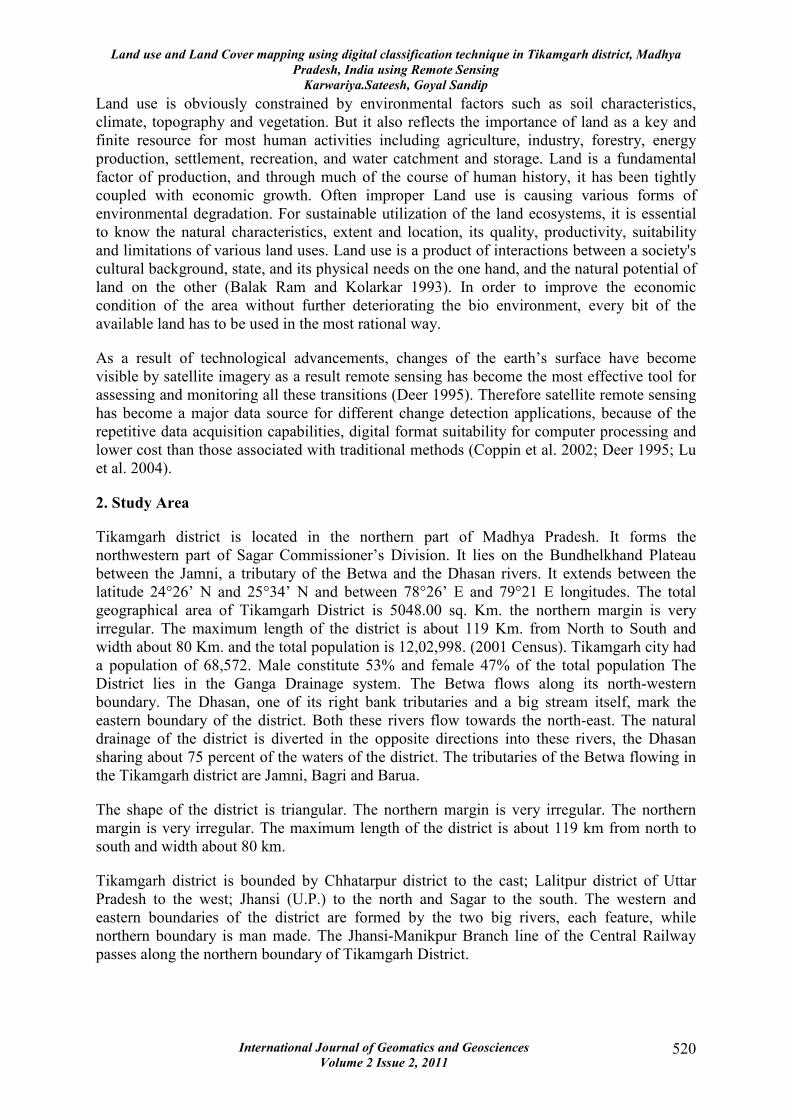
2. Study Area
Tikamgarh district is located in the northern part of Madhya Pradesh. It forms the
northwestern part of Sagar Commissioner’s Division. It lies on the Bundhelkhand Plateau
between the Jamni, a tributary of the Betwa and the Dhasan rivers. It extends between the
latitude 24°26’ N and 25°34’ N and between 78°26’ E and 79°21 E longitudes. The total
geographical area of Tikamgarh District is 5048.00 sq. Km. the northern margin is very
irregular. The maximum length of the district is about 119 Km. from North to South and
width about 80 Km. and the total population is 12,02,998. (2001 Census). Tikamgarh city had
a population of 68,572. Male constitute 53% and female 47% of the total population The
District lies in the Ganga Drainage system. The Betwa flows along its north-western
boundary. The Dhasan, one of its right bank tributaries and a big stream itself, mark the
eastern boundary of the district. Both these rivers flow towards the north-east. The natural
drainage of the district is diverted in the opposite directions into these rivers, the Dhasan
sharing about 75 percent of the waters of the district. The tributaries of the Betwa flowing in
the Tikamgarh district are Jamni, Bagri and Barua.
The shape of the district is triangular. The northern margin is very irregular. The northern
margin is very irregular. The maximum length of the district is about 119 km from north to
south and width about 80 km.
Tikamgarh district is bounded by Chhatarpur district to the cast; Lalitpur district of Uttar
Pradesh to the west; Jhansi (U.P.) to the north and Sagar to the south. The western and
eastern boundaries of the district are formed by the two big rivers, each feature, while
northern boundary is man made. The Jhansi-Manikpur Branch line of the Central Railway
passes along the northern boundary of Tikamgarh District.

Land use and Land Cover mapping using digital classification technique in Tikamgarh district, Madhya
Pradesh, India using Remote Sensing
Karwariya.Sateesh, Goyal Sandip
International Journal of Geomatics and Geosciences
Volume 2 Issue 2, 2011 521
Figure 1: Location Map of the Study Area
The roads connecting station Orchha, Barwa-Sagar, Niwari, Teharka, Ranipur Road and
Mau-Ranipur provide communication lines to the northern parts of the district. The district
headquarters is accessible by roads from Jhansi, Lalitpur, Sagar, Chhatarpur and Mau
Ranipur.
Climate of Tikamgarh district is monsoon type. The year may be divided into four seasons.
The cold season from December to February followed by the hot season, from March to
about the middle of June. The period from about mid-June to the end of September is the
rainy season. The months of October and November constitute the post-monsoon or transition
season.
There is no meteorological observation in the district. The description, which follows, is
based on the records of the observations in the neighboring districts, which have similar
climate. After February temperature rise progressively. May is generally the hottest month
with mean daily maximum temperature at about 43-degree Celsius and low 29-degree Celsius.
On individual day temperature may rise up to about 47 degree Celsius. The relative humidity

Land use and Land Cover mapping using digital classification technique in Tikamgarh district, Madhya
Pradesh, India using Remote Sensing
Karwariya.Sateesh, Goyal Sandip
International Journal of Geomatics and Geosciences
Volume 2 Issue 2, 2011 522
is high during the monsoon season, it being generally above 70 percent. In the rest of the year
the air is comparatively dry. The driest part of the year is summer season when the relative
humidity is less than 20 percent the afternoons. Average rainfall of the district is 40 inch. It
varies from 33 inch to 54 inch, in different parts of the district. It is seen that rainfall in the
district in general increases from northwest to southwest. Parts of the Niwari tehsil and
Mohangarh of Jatara tehsil also come in the low rainfall zone. About 90 percent of the annual
rainfall in the district is received during the south-west monsoon season - June - September,
July being the rainiest month.
Figure 2: IRS-1C PAN + LISS-III satellite image of a part of the study area
Image fusion techniques are useful to integrate the geometric detail of a high-resolution
panchromatic (PAN) image and the spectral information of a low-resolution multispectral
(MSS) image, particularly important for understanding land use dynamics at larger scale
(1:25000 or lower), which is required by the decision makers to adopt holistic approaches for
regional planning. Fused images can extract features from source images and provide more

Land use and Land Cover mapping using digital classification technique in Tikamgarh district, Madhya
Pradesh, India using Remote Sensing
Karwariya.Sateesh, Goyal Sandip
International Journal of Geomatics and Geosciences
Volume 2 Issue 2, 2011 523
information than one scene of MSS image. High spectral resolution aids in identification of
objects more distinctly while high spatial resolution allows locating the objects more clearly
3. Aim and Objective
• Preparation of various thematic data such land use and Land cover using LISS-3+Pan
Data.
• Create a land use land cover map from satellite imagery using unsupervised
classification.
3.1 Methodology
1. Geometric corrections of IRS-1C LISS-III+PAN data using survey of India (SOI)
Toposheet at 1:50,000 scales.
2. Selection of study area
3. Land use land cover classification using unsupervised classification
4. Land use \ Land Cover Classification by Normalized difference vegetation
5. The extraction of thematic layers.
6. Comparison of overall accuracies of each method with respect to Performance
Evaluation / Accuracy assessment.
7. Output generation
3.2 Data Processing
Analysis and interpretation of satellite data will be done by digital image processing as
depicted
The process generally includes 3 steps:
1. Image pre-processing
Preprocessing of satellite images prior to image classification and change detection is
essential. Preprocessing commonly comprises a series of sequential operations, including
atmospheric correction or normalization, image registration, geometric correction, and
masking (e.g., for clouds, water, irrelevant features) (Coppin & Bauer, 1996).
2. Image enhancement, this procedure will be applied to the image in order to increase the
Amount of information that can be displayed interactively;
Contrast enhancement
• Contrast enhancement is applied primarily to improve visual analysis. It is a
deterministic grey level transformation (DLGT) and involves a pixel-by-pixel
radiometric transformation that is designed to enhance visual discrimination of low
contrast image features.
Land use and Land Cover mapping using digital classification technique in Tikamgarh district, Madhya
Pradesh, India using Remote Sensing
Karwariya.Sateesh, Goyal Sandip
International Journal of Geomatics and Geosciences
Volume 2 Issue 2, 2011 524
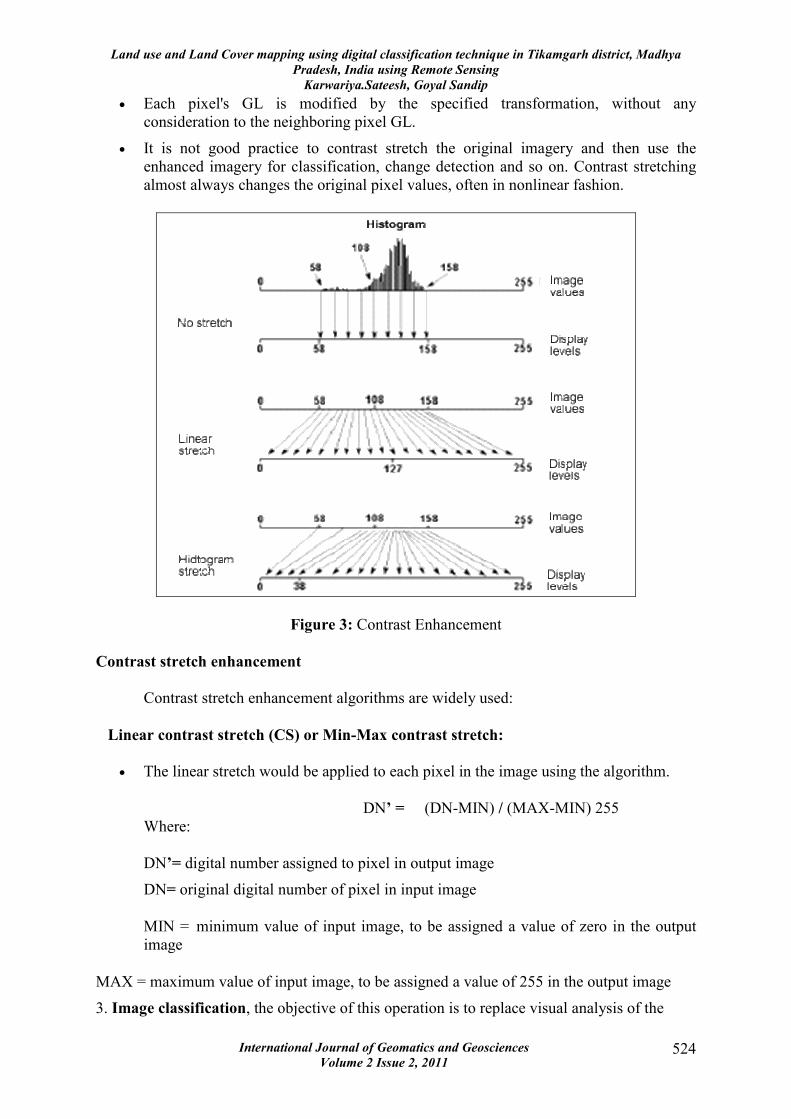
• Each pixel's GL is modified by the specified transformation, without any
consideration to the neighboring pixel GL.
• It is not good practice to contrast stretch the original imagery and then use the
enhanced imagery for classification, change detection and so on. Contrast stretching
almost always changes the original pixel values, often in nonlinear fashion.
Figure 3: Contrast Enhancement
Contrast stretch enhancement
Contrast stretch enhancement algorithms are widely used:
Linear contrast stretch (CS) or Min-Max contrast stretch:
• The linear stretch would be applied to each pixel in the image using the algorithm.
DN’ = (DN-MIN) / (MAX-MIN) 255
Where:
DN’= digital number assigned to pixel in output image
DN= original digital number of pixel in input image
MIN = minimum value of input image, to be assigned a value of zero in the output
image
MAX = maximum value of input image, to be assigned a value of 255 in the output image
3. Image classification, the objective of this operation is to replace visual analysis of the
Land use and Land Cover mapping using digital classification technique in Tikamgarh district, Madhya
Pradesh, India using Remote Sensing
Karwariya.Sateesh, Goyal Sandip
International Journal of Geomatics and Geosciences
Volume 2 Issue 2, 2011 525
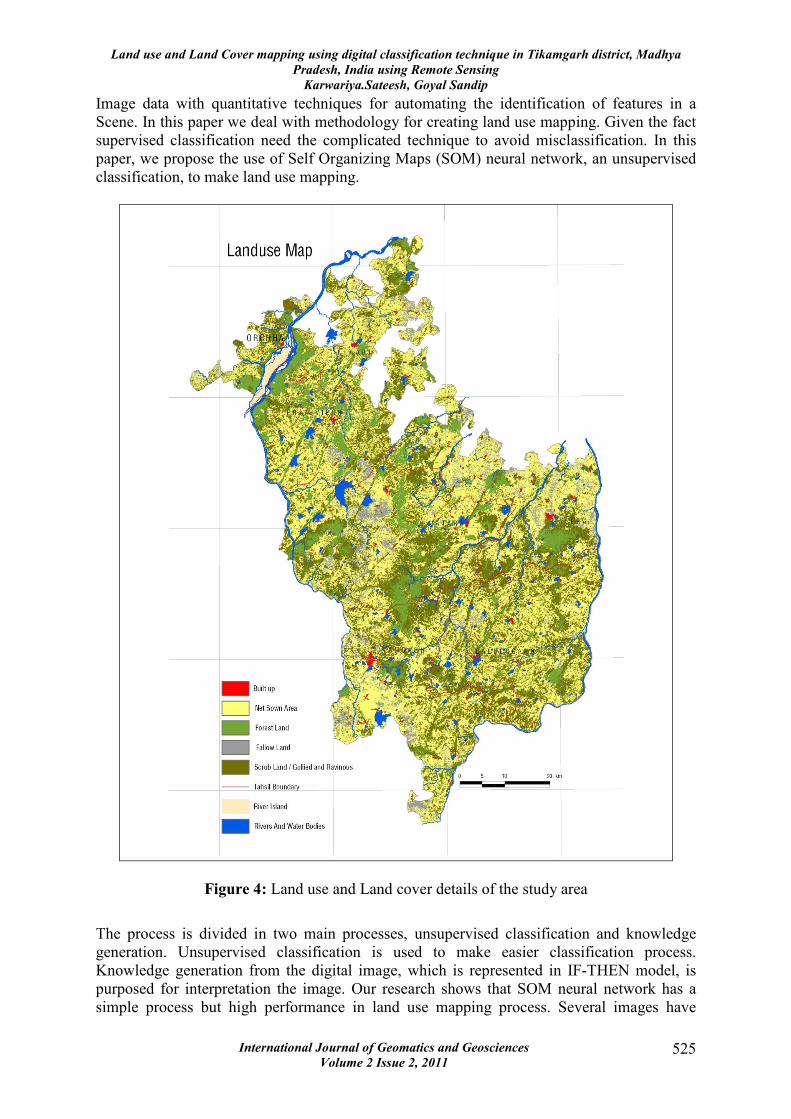
Image data with quantitative techniques for automating the identification of features in a
Scene. In this paper we deal with methodology for creating land use mapping. Given the fact
supervised classification need the complicated technique to avoid misclassification. In this
paper, we propose the use of Self Organizing Maps (SOM) neural network, an unsupervised
classification, to make land use mapping.
Figure 4: Land use and Land cover details of the study area
The process is divided in two main processes, unsupervised classification and knowledge
generation. Unsupervised classification is used to make easier classification process.
Knowledge generation from the digital image, which is represented in IF-THEN model, is
purposed for interpretation the image. Our research shows that SOM neural network has a
simple process but high performance in land use mapping process. Several images have

Land use and Land Cover mapping using digital classification technique in Tikamgarh district, Madhya
Pradesh, India using Remote Sensing
Karwariya.Sateesh, Goyal Sandip
International Journal of Geomatics and Geosciences
Volume 2 Issue 2, 2011 526
already been identified and acquired to represent the land use/cover status in the 1980’s,
1990’s and 2000’s. One major concern over the use of satellite images during rainy season is
the existence of cloud cover. Such a condition may limit the amount of information that may
be extracted from these images, and would create information gaps and loss of valuable data
(Al-Tahir et al 2008). To overcome these problem use temporal data.
3.3 Field surveys
Field surveys will be conducted within the study areas to determine the major types of land
use and land cover. Such data would be used in two aspects of the mapping of land use land
cover. Firstly it will aid in land use and land cover classification, by associating the ground
features of a specific type of land use and land cover with the relevant imaging and spectral
characteristics. Secondly, ground data will be used for accuracy assessment of the developed
land use and land cover maps.
4. Results
8.43
27.64
9.61
0.48
1.67
0.12
5.35
0.02
2.68
3.22
4.65
1.94
1.55
1.90
30.74
Kharif
Rabi
Doble crop
Crop in Fore
Low Dense F
Stony waste
Fallow land
Plantation
Scrub land
Dense Forest
Forest Blank
Water body
River
Habitation
Open land
Figure 5: Image showing land use and land cover area as a percentage
Circle Land use land cover

Land use and Land Cover mapping using digital classification technique in Tikamgarh district, Madhya
Pradesh, India using Remote Sensing
Karwariya.Sateesh, Goyal Sandip
International Journal of Geomatics and Geosciences
Volume 2 Issue 2, 2011 527
Table 1: Data showing total land cover
Land use land cover Area (hac)
Kharif 42482.9675
Rabi 139268.915
Doble crop 48430.3275
Crop in Forest 2402.6175
Low Dense Forest 8436.28
Stony waste 614.4275
Fallow land 26942.4925
Plantation 76.7575
Scrub land 13522.4625
Dense Forest 16220.5475
Forest Blank 23423.685
Water body 9782.875
River 7826.035
Habitation 9591.1675
Open land 154885.6175
Total 503907.175
The land use and land cover map clearly shows that area of cropland is higher than others.
Open Land/Waste land has 154885-hectare area it occupies second place in this district,
Forest blank getting third place has 23423 Hectare areas.
The classification accuracies were interpreted in terms of
(a) Effect of spatial resolution with same bandwidth.
(b) Comparison of three band set with MIR as either an additional
Band or a replacement,
(c) Effect of date of acquisition

Land use and Land Cover mapping using digital classification technique in Tikamgarh district, Madhya
Pradesh, India using Remote Sensing
Karwariya.Sateesh, Goyal Sandip
International Journal of Geomatics and Geosciences
Volume 2 Issue 2, 2011 528
4.1 Accuracy Assessment
The classification accuracy is most important aspect to assess the reliability of maps,
especially when comparing different classification techniques. During this study the accuracy
assessment method were used. Accuracy assessment, automatic random point to be selected
by software. This method shows above 90% accuracy of map.
Figure 6: Images showing the accuracy assessment

Land use and Land Cover mapping using digital classification technique in Tikamgarh district, Madhya
Pradesh, India using Remote Sensing
Karwariya.Sateesh, Goyal Sandip
International Journal of Geomatics and Geosciences
Volume 2 Issue 2, 2011 529
5. Conclusion
This basic study shows how to classify land use and land cover from satellite imagery, we
Calculated land use and land cover area for the study area using unsupervised classification,
The land use and land cover map clearly shows that area of cropland is higher than others.
The superior performance of neural network in terms of good classification accuracy has
been reported earlier (Paola J.D. and Schowengrdt R.A. The present study also supports their
results by achieving highest accuracy even in case of Land use land cover mapping.
6. References
1. Ram Chandra, T.V. S Uttam Kumar (2005)m from Abstract of their paper presented
at map India; geomedia 2005, Image fusion in GRDSS for land use mapping.
2. S.Sudhakar et, al. (1999)m Techniques of Classification for Land use/Land cover with
special reference for Forest type mapping in Jaldapara Wild life Sanctuary. Journal of
the Indian society of Remote Sensing, Vol. 27.No.4, 1999.
3. Sukhatme P.V. and Panse V.G. (1951)m Crop surveys in India – II Jr. of Indian
Society of Agricultural Statistics. Pp 97-168
4. Arvik, J.H. (1997), A review of remote imaging source provider. Modern Agriculture,
journal for site-specific crop management.
5. Grenzdorffer, G (1997), Remote sensing and geographic information system for site-
specific farm management system. In J.V. Stafford (ed) Precision Agriculture
6. Lillesand, J.M. and Kiefer, R.W., (2007), Remote sensing and image interpretation,
3rd edition, Wiley.
7. Jenson, J.R, (2005), Introductory Digital image processing, 3rd edition, Prentice hall
series.


