
EIGHT-STATES FREE ROUTE AIRSPACE PROJECT … · EIGHT-STATES FREE ROUTE AIRSPACE PROJECT ... PLC...
40
EUROPEAN ORGANISATION FOR THE SAFETY OF AIR NAVIGATION EUROCONTROL EXPERIMENTAL CENTRE EIGHT-STATES FREE ROUTE AIRSPACE PROJECT 1 st SMALL SCALE REAL TIME SIMULATION EEC Note No. 22/99 Project ASM-F-E1 Issued: December 1999 The information contained in this document is the property of the EUROCONTROL Agency and no part should be reproduced in any form without the Agency’s permission. The views expressed herein do not necessarily reflect the official views or policy of the Agency. EUROCONTROL
Transcript of EIGHT-STATES FREE ROUTE AIRSPACE PROJECT … · EIGHT-STATES FREE ROUTE AIRSPACE PROJECT ... PLC...

EUROPEAN ORGANISATIONFOR THE SAFETY OF AIR NAVIGATION
EUROCONTROL EXPERIMENTAL CENTRE
EIGHT-STATES FREE ROUTE AIRSPACE PROJECT1st SMALL SCALE REAL TIME SIMULATION
EEC Note No. 22/99
Project ASM-F-E1
Issued: December 1999
The information contained in this document is the property of the EUROCONTROL Agency and no part shouldbe reproduced in any form without the Agency’s permission.
The views expressed herein do not necessarily reflect the official views or policy of the Agency.
EUROCONTROL


REPORT DOCUMENTATION PAGE
Reference:EEC Note No. 22/99
Security Classification:Unclassified
Originator:EEC – OPS(Operational Services)
Originator (Corporate Author) Name/Location:EUROCONTROL Experimental CentreB.P.15F – 91222 Brétigny-sur-Orge CEDEXFRANCETelephone : +33 (0)1 69 88 75 00
Sponsor:EUROCONTROL
Sponsor (Contract Authority) Name/Location:EUROCONTROL AgencyRue de la Fusée, 96B –1130 BRUXELLESTelephone : +32 2 729 90 11
TITLE:EIGHT-STATES FREE ROUTE AIRSPACE PROJECTSMALL SCALE REAL TIME SIMULATION NUMBER 1, SIMULATION REPORT
AuthorP. ERIKSEN
Date
12/99
Pages
xii+ 27
Figures
20
Tables
10
Appendix
References
7
EATCHIP Task
Specification-
ProjectASM-F-E1
Task No. Sponsor
-
PeriodDecember 1999
Distribution Statement:(a) Controlled by: EUROCONTROL Project Manager
(b) Special Limitations: None
(c) Copy to NTIS: YES / NO
Descriptors (keywords):
Eight-States Free Routes Airspace Project - Real-Time Simulation – Free Routes Airspace Concept–Benefits – Controller Workload – ATC Capacity – Controller Task Distribution - EATCHIP Development– SYSCO – Civil-Military Co-ordination – Paper strips
Abstract:
This report describes the first small-scale real-time simulation study of the Free Routes AirspaceConcept within the context of the Eight-States Free Routes Airspace Project. Parts of Maastricht UpperInformation Region and København Flight Information Region were simulated. The simulation wasdesigned to support the validation of the Free Routes Airspace and is the first of six planned real-timesimulation studies. The study focused on the possible capacity gain by implementing the concept, butwas also designed to further develop the concept, identify the need to develop or redesign procedures,airspace lay-out, as well as civil-military issues. Human Performance issues were addressed in aparallel study conducted within the framework of the Free Routes Airspace Project, using the simulationas a vehicle to provide data

This document has been collated by mechanical means. Should there be missing pages, please reportto:
EUROCONTROL Experimental CentrePublications Office
B.P. 1591222 – BRETIGNY-SUR-ORGE CEDEX
France

FRAP SRT-1 EUROCONTROL
Project ASM-F-E1 - v
SUMMARY
This is the report of the 1st Eight-States Free Routes Airspace Project Real-timeSimulation. The simulation is the first in a series of 6 real-time simulations, thattogether with a number of other activities provides the basis for the validation of theFree Routes Airspace Concept.
The simulation was conducted at the EUROCONTROL Experimental Centre, andlasted for two weeks. Eleven controllers from DFS, CAA Denmark, CAA Norway andMaastricht UAC took part during one or two weeks. Airspace over Northern Germanyand Denmark was simulated.
The platform used was based on the functionality and Human Machine Interfacepresently in use within the Eight-States, and included features such as Paper Strips,Electronic Flight Lists, Short Term Conflict Alert, OLDI, and VHF- and telephonecommunication.
The methodology was mainly based on a comparison of controller workload in a FixedRoute and a Free Route environment. It was assumed that RVSM is introduced beforeFree Routes.
The simulation showed that there is a potential capacity gain and a possibility ofproviding a better service to airspace users related to the implementation of FreeRoutes. The capacity gain is in addition to the capacity gain derived from RVSM. Inthe simulated area this capacity gain can be achieved with only a few minor systemupgrades, however to fully exploit the possibilities provided by Free Routes, toolshelping to support controllers to maintain situational awareness will be required.
The most important problem facing Free Routes operations in this simulation was thecircumnavigation of segregated airspace.
No reduction in the level of service provided to military users was identified in thesimulated airspace.
The results obtained should not be considered as final results, but only as firstindicators. Only after more in-depth studies of the entire Eight-States airspace can thecomplete picture be seen.

EUROCONTROLFRAP SRT-1
Project ASM-F-E1vi
FRAP SRT-1 EUROCONTROL
Project ASM-F-E1 - vii
TABLE OF CONTENTS
Abbreviations .................................................................................................................... ixReferences, list of figures, list of tables ............................................................................. xi
1. INTRODUCTION............................................................................................................................. 12. OBJECTIVES AND MEASURES..................................................................................................... 22.1 Objectives ................................................................................................................................... 22.2 Measures..................................................................................................................................... 22.2.1 Questionnaires ...................................................................................................................... 32.2.2 ISA ........................................................................................................................................ 33. SIMULATION CONDUCT................................................................................................................ 63.1 Airspace ...................................................................................................................................... 63.1.1 The simulated area................................................................................................................ 63.1.2 Operations Room Configuration............................................................................................. 63.1.3 Route Structure ..................................................................................................................... 63.1.4 Temporary Segregated Airspace ........................................................................................... 63.1.5 Danger and Restricted Areas ................................................................................................. 73.2 Traffic.......................................................................................................................................... 73.2.1 Creation................................................................................................................................. 73.2.2 Traffic Sample Analysis......................................................................................................... 83.3 Program of exercises................................................................................................................. 103.4 Simulated ATC system .............................................................................................................. 103.4.1 Controller Working Positions................................................................................................ 103.4.2 System Functionality ........................................................................................................... 113.4.3 Human Machine Interface (HMI) .......................................................................................... 113.4.4 ATC Procedures .................................................................................................................. 123.4.5 Provision of service ............................................................................................................. 124. RESULTS ..................................................................................................................................... 134.1 ImpacT on controller Work ........................................................................................................ 134.1.1 Objective: ............................................................................................................................ 134.1.2 Recordings .......................................................................................................................... 134.1.3 Questionnaires .................................................................................................................... 154.1.4 De-briefings......................................................................................................................... 164.1.5 Objective: ............................................................................................................................ 164.1.6 Recordings .......................................................................................................................... 174.1.7 Questionnaires .................................................................................................................... 174.1.8 De-briefings......................................................................................................................... 184.2 Effeciency and Capacity ............................................................................................................ 194.2.1 Objective: ............................................................................................................................ 194.2.2 Recordings .......................................................................................................................... 194.2.3 Questionnaires .................................................................................................................... 204.3 Military Issues............................................................................................................................ 214.3.1 Objective: ............................................................................................................................ 214.3.2 Questionnaires .................................................................................................................... 224.3.3 Controller Opinions.............................................................................................................. 224.4 Airspace and Procedures........................................................................................................... 224.4.1 Objective: ............................................................................................................................ 224.4.2 Questionnaires .................................................................................................................... 224.4.3 De-briefings......................................................................................................................... 244.5 Systems .................................................................................................................................... 244.5.1 Objective: ............................................................................................................................ 244.5.2 Questionnaires .................................................................................................................... 244.5.3 De-briefings......................................................................................................................... 255. CONCLUSIONS............................................................................................................................ 266. RECOMMANDATIONS ................................................................................................................. 28

EUROCONTROLFRAP SRT-1
Project ASM-F-E1viii
FRAP SRT-1 EUROCONTROL
Project ASM-F-E1 - ix
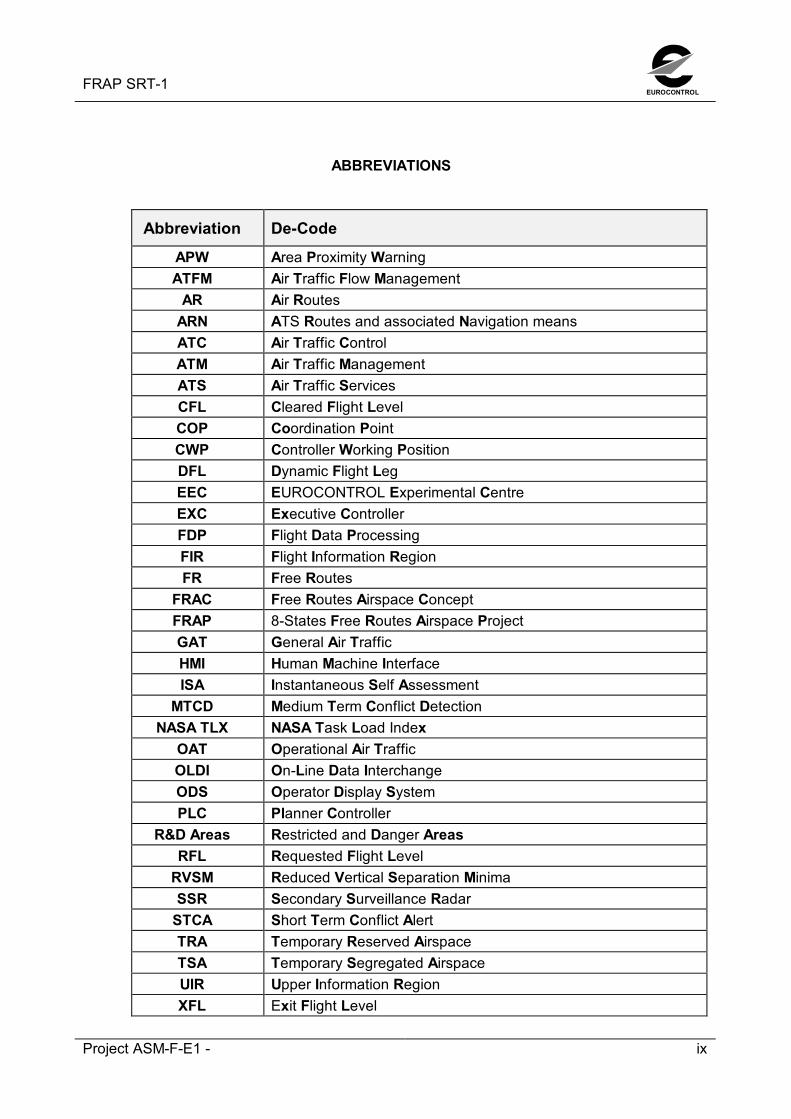
ABBREVIATIONS
Abbreviation De-CodeAPW Area Proximity WarningATFM Air Traffic Flow Management
AR Air RoutesARN ATS Routes and associated Navigation meansATC Air Traffic ControlATM Air Traffic ManagementATS Air Traffic ServicesCFL Cleared Flight LevelCOP Coordination PointCWP Controller Working PositionDFL Dynamic Flight LegEEC EUROCONTROL Experimental CentreEXC Executive ControllerFDP Flight Data ProcessingFIR Flight Information RegionFR Free Routes
FRAC Free Routes Airspace ConceptFRAP 8-States Free Routes Airspace ProjectGAT General Air TrafficHMI Human Machine InterfaceISA Instantaneous Self Assessment
MTCD Medium Term Conflict DetectionNASA TLX NASA Task Load Index
OAT Operational Air TrafficOLDI On-Line Data InterchangeODS Operator Display SystemPLC Planner Controller
R&D Areas Restricted and Danger AreasRFL Requested Flight Level
RVSM Reduced Vertical Separation MinimaSSR Secondary Surveillance Radar
STCA Short Term Conflict AlertTRA Temporary Reserved AirspaceTSA Temporary Segregated AirspaceUIR Upper Information RegionXFL Exit Flight Level

EUROCONTROLFRAP SRT-1
Project ASM-F-E1x

FRAP SRT-1 EUROCONTROL
Project ASM-F-E1 - xi
REFERENCES
1. Eight-States Free Routes Airspace Project Management Plan ver. 1.02. Eight-States Free Routes Airspace Project EEC Activity Plan Plan ver. 1.03. Eight-States Free Routes Airspace Project SRT-1 Facility Specification Part 1
(Conduct and Analysis)4. Eight-States Free Routes Airspace Project SRT-1 Controller Handbook
LIST OF FIGURES
Figure Page1. Example of ISA Recordings.................................................................. 42. ISA Sample 15MXAR (Route) .............................................................. 133. ISA Sample 15MXFR (Free Routes)..................................................... 134. ISA Sample 15MYAR (Route)............................................................... 135. ISA Sample 15MYFR (Free Routes)..................................................... 136. ISA Sample 15EXAR (Route)............................................................... 147. ISA Sample 15EXFR (Free Routes) ..................................................... 148. ISA Sample 15MXAR (Route) .............................................................. 149. ISA Sample 15MXFR (Free Routes)..................................................... 14
10. ISA Sample 15MXAR (Route) .............................................................. 1411. ISA Sample 15MXFR (Free Routes)..................................................... 1412. Percentage of aircraft cleared to requested level ................................. 1713. Tactical instructions peer aircraft/sector ............................................... 1914. Aircraft mean flying time peer sector .................................................... 20
LIST OF TABLES
Table Page1. Sample description................................................................................................ 52. Controller Working Position Configuration.............................................. 63. Temporary Segregated Airspace....................................................................... 64. Declared Sector Capacity....................................................................... 85. Hourly Throughput and Instantaneous Peak, 13AR Samples ................... 86. Hourly Throughput and Instantaneous Peak, 13FR Samples.................... 87. Hourly Throughput and Instantaneous Peak, 15AR Samples ................... 98. Hourly Throughput and Instantaneous Peak, 15FR Samples.................... 99. Program of Exercises 10

EUROCONTROLFRAP SRT-1
Project ASM-F-E1xii

FRAP SRT-1 EUROCONTROL
Project ASM-F-E1 1
1. INTRODUCTION
The first Small Scale Real-time Simulation of the Eight-States Free Routes AirspaceConcept (FRAC) took place at the EUROCONTROL Experimental Centre between22nd November and 3rd December 1999. The simulation was designed to meet therequirements of FRAP to validate the Free Routes Concept (FRAC).
The simulation was the first of a number of real-time simulations that, together with anumber of other activities, shall validate FRAC within the airspace of the 8participating states (Belgium, Denmark, Finland, Germany, Luxembourg, TheNetherlands, Norway, and Sweden.
This first simulation is seen as a study simulation, where the concept is furtherdeveloped as well as validated. The simulation was based on the upper airspace overthe northern part of Germany and parts of Denmark. The present airspace structurewas used, and traffic was based on collected traffic data from June 1999, augmentedto the agreed sector load. Civil and military traffic was simulated.
The simulation featured Reduced Vertical Separation Minimum (RVSM), as it isforeseen that RVSM will be implemented before FRAC.
The FRAP Human Performance Study was also part of the simulation, and performeda number of measurements related to human performances, such as Eye MovementTracking and Hart Beat Rate. The results of this study are published in a separatereport.

EUROCONTROLFRAP SRT-1
Project ASM-F-E12
2. OBJECTIVES AND MEASURES
2.1 OBJECTIVES
The objectives of the simulation were:
1. Assess the impact, in terms of controller workload and complexity, of theintroduction of FRAC in an operational environment representing a typical ATCsystem in the year 2003
2. Further develop Controller Roles to be used in Free Routes Airspace. 3. Determine whether expected efficiency gains are likely to be met. 4. Assess the impact on military counterparts with respect to OAT transit flights
and the use of segregated airspace when introducing FRAC. 5. Assess the proposed lateral and vertical limits of FRAC airspace with regard to
traffic complexity, traffic load and interface problems using traffic samplesreflecting the expected year 2003 traffic load and flows.
6. Provide feedback on the use of OLDI in a FRAC environment, and identify
shortcomings 7. Provide relevant data to other studies in FRAP (Human Performance Study)
2.2 MEASURES
In order to achieve the objective, the following measures were taken:
For objective number 1, 3 and 7 the results are based on a comparison betweena Routes Structured scenario (ARN-v3) and a Free Routes Scenario (FRAC)
The following data was collected during the simulation
Subjective data
• Questionnaires, The controllers were asked to fill in questionnaires before andafter the simulation.
• Instantaneous Self Assessment (ISA) (See below)• NASA TLX (See below)• Debriefings. Controller opinions were collected during the daily debriefings
Objective data
• System data, The following data-sets were recorded• The number of pilot inputs/controller tactical instructions• Radio usage (not yet included)

FRAP SRT-1 EUROCONTROL
Project ASM-F-E1 3
2.2.1 Questionnaires
The participating controllers were asked to decide how much they agreed with anumber of statements related to ATC and FRAC, as described in the example below
Example:
Towers should be build even higher to give a better view to the controllers.Stronglydisagree
Disagree slightlydisagree
slightlyagree
agree stronglyagree
X
In the above example the controller agrees with the idea that towers should be buildhigher. The opinion of eight controllers working on measured sectors is included inthis report
Comments given by the controllers in the questionnaires are listed below the subjectquestion.
2.2.2 ISAISA stands for Instantaneous Self-Assessment. It is a technique originally developedby the UKCAA and used here at the EEC for several years.
Each control position is equipped with a small box containing 5 buttons labelled:
• Very High• High• Fair• Low• Very Low
At five-minute intervals the controller is prompted by a flashing red light to press oneof the five buttons corresponding to his perceived workload during the previous fiveminutes. The light flashes for 30 seconds during which time the controller mustrespond. At each interval a record is written of the button selected and the delay inresponding so that by the end of the exercise we have a history of the variation ofeach controller’s perceived workload.
The main advantage of ISA is it’s simplicity. The procedure is very simple to explainand administer. The results are usually used to identify busy periods within a sectorrather than as an absolute measure of workload.
The principle disadvantages concern the intrusiveness, especially in simulationsinvolving new HMI and also the ease with which the results can be corrupted if theparticipants are not suitably motivated.

EUROCONTROLFRAP SRT-1
Project ASM-F-E14
Fig. 1: Example of ISA recording
Estimated WorkloadExercice=301199B,Traffic=15MYAR,Static
Measured Period = 8:00/
Very High High NormalLow Very Low No Answer
%
0
10
20
30
40
50
60
70
80
90
100
CSTEXC CSTPLN LINEXC LINPLN NS USCEXC USCPLN
FRAP SRT-1 EUROCONTROL
Project ASM-F-E1 5
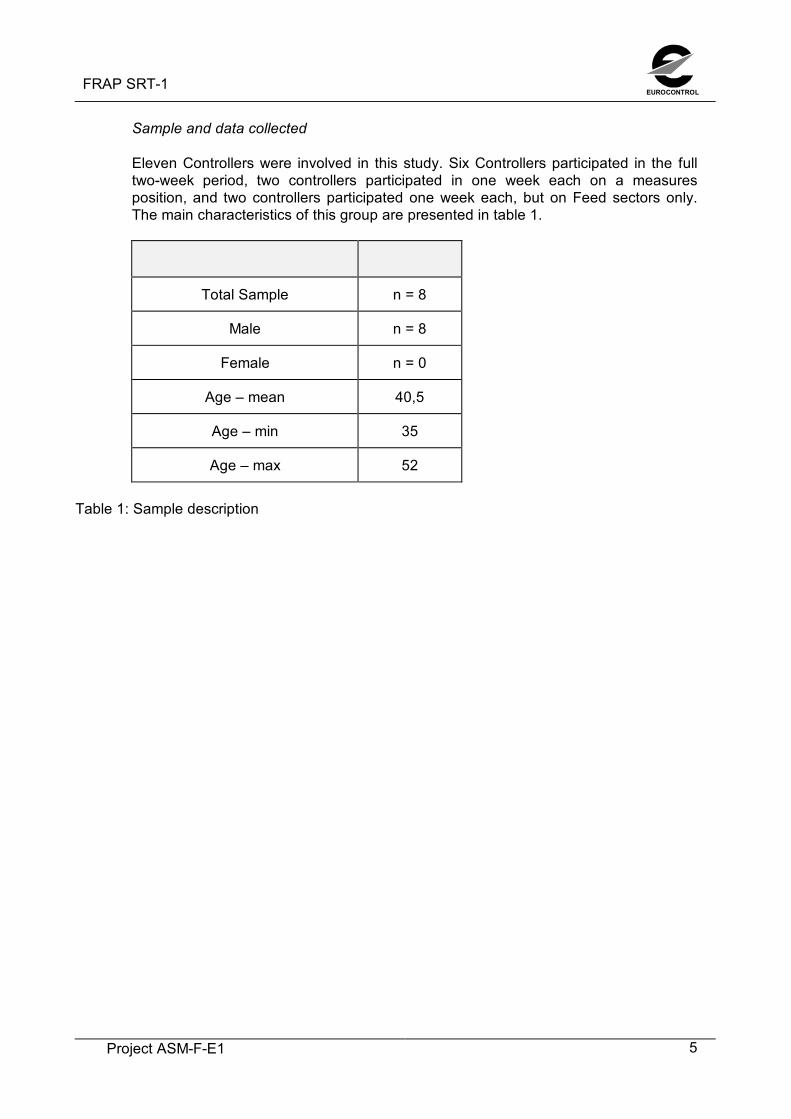
Sample and data collected
Eleven Controllers were involved in this study. Six Controllers participated in the fulltwo-week period, two controllers participated in one week each on a measuresposition, and two controllers participated one week each, but on Feed sectors only.The main characteristics of this group are presented in table 1.
Total Sample n = 8
Male n = 8
Female n = 0
Age – mean 40,5
Age – min 35
Age – max 52
Table 1: Sample description
EUROCONTROLFRAP SRT-1
Project ASM-F-E16
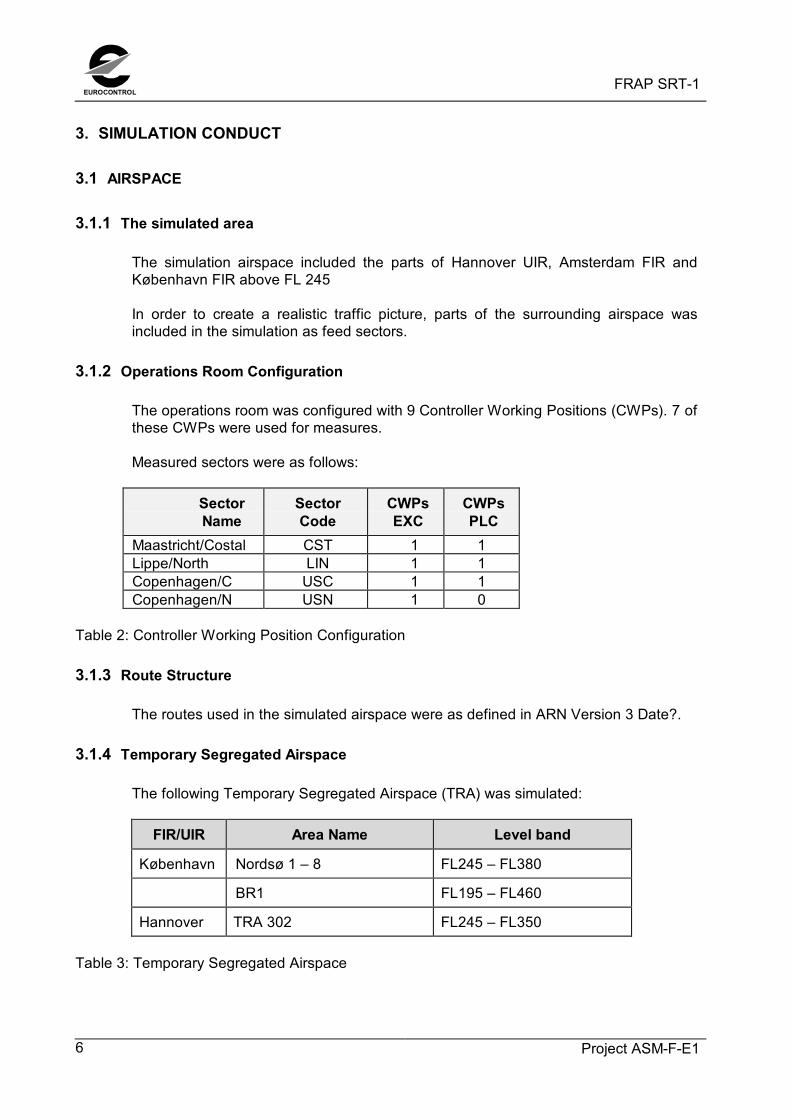
3. SIMULATION CONDUCT
3.1 AIRSPACE
3.1.1 The simulated area
The simulation airspace included the parts of Hannover UIR, Amsterdam FIR andKøbenhavn FIR above FL 245
In order to create a realistic traffic picture, parts of the surrounding airspace wasincluded in the simulation as feed sectors.
3.1.2 Operations Room Configuration
The operations room was configured with 9 Controller Working Positions (CWPs). 7 ofthese CWPs were used for measures.
Measured sectors were as follows:
SectorName
SectorCode
CWPsEXC
CWPsPLC
Maastricht/Costal CST 1 1Lippe/North LIN 1 1Copenhagen/C USC 1 1Copenhagen/N USN 1 0
Table 2: Controller Working Position Configuration
3.1.3 Route Structure
The routes used in the simulated airspace were as defined in ARN Version 3 Date?.
3.1.4 Temporary Segregated Airspace
The following Temporary Segregated Airspace (TRA) was simulated:
FIR/UIR Area Name Level band
København Nordsø 1 – 8 FL245 – FL380
BR1 FL195 – FL460
Hannover TRA 302 FL245 – FL350
Table 3: Temporary Segregated Airspace
FRAP SRT-1 EUROCONTROL
Project ASM-F-E1 7
3.1.5 Danger and Restricted AreasThe following Restricted Areas were simulated:
ED-D19A, ED-D41A&B, ED-D44, ED-D100, ED-R10B, EK-D51, EK-D52, EK-R12,EK-R13, EK-R14,
3.2 TRAFFIC
3.2.1 CreationThe traffic samples were created from IFPS traffic recordings of 18th June 1999. Afterthe data collection, the traffic samples were analysed and considered to berepresentative. No unusual ATFM or weather constraints were identified. The levelsof aircraft were then transformed into RVSM levels, using the guidelines developed bythe RVSM project.
Three base samples were created, two representing the traffic flow in the morning(MX & MY) and one in the Afternoon (EX). Each sample covered a time period of 1hour 15 minutes, 60 minutes of which was measured for analysis purposes.
The samples were adjusted, to include conflicting traffic situations within themeasured sectors and to reflect a workload equivalent to present published sectorcapacity. This was done to compensate for the implementation of RVSM and the factthat simulated traffic gives a lower load than real traffic on the controller. 30% trafficwas added on today’s published capacity to achieve this.
For each of the three traffic samples, a similar FRAC traffic sample was created, Inthe FRAC samples, traffic was routed directly from the entry point to FRAC airspace tothe exit point from FRAC airspace, however flightplans were constructed to avoidsegregated airspace. This was achieved by entering one ore more way-pointsbetween the FRAC entry and exit point
During the simulation an additional set of traffic samples was created, in order to putadditional load on controllers. These samples included an additional 20% trafficincrease, without flightplans avoiding segregated airspace.
Traffic samples in fixed routes are labelled “AR”. Free Route samples are labelled“FR”.
The traffic samples representing today’s workload have “13” as prefix. Samplesincluding an additional traffic increase of 20% have “15” as prefix.
MX, MY, EX are denotes the different traffic samples in each scenario.

EUROCONTROLFRAP SRT-1
Project ASM-F-E18
SECTOR ActualDeclaredCapacity
Aimedthroughput13-samples
Aimedthroughput15-samples
CST 47 57 72
LIN n/a n/a n/a
USC 47 50 65
USN 41 40 48
Table 4: Declared Sector Capacity
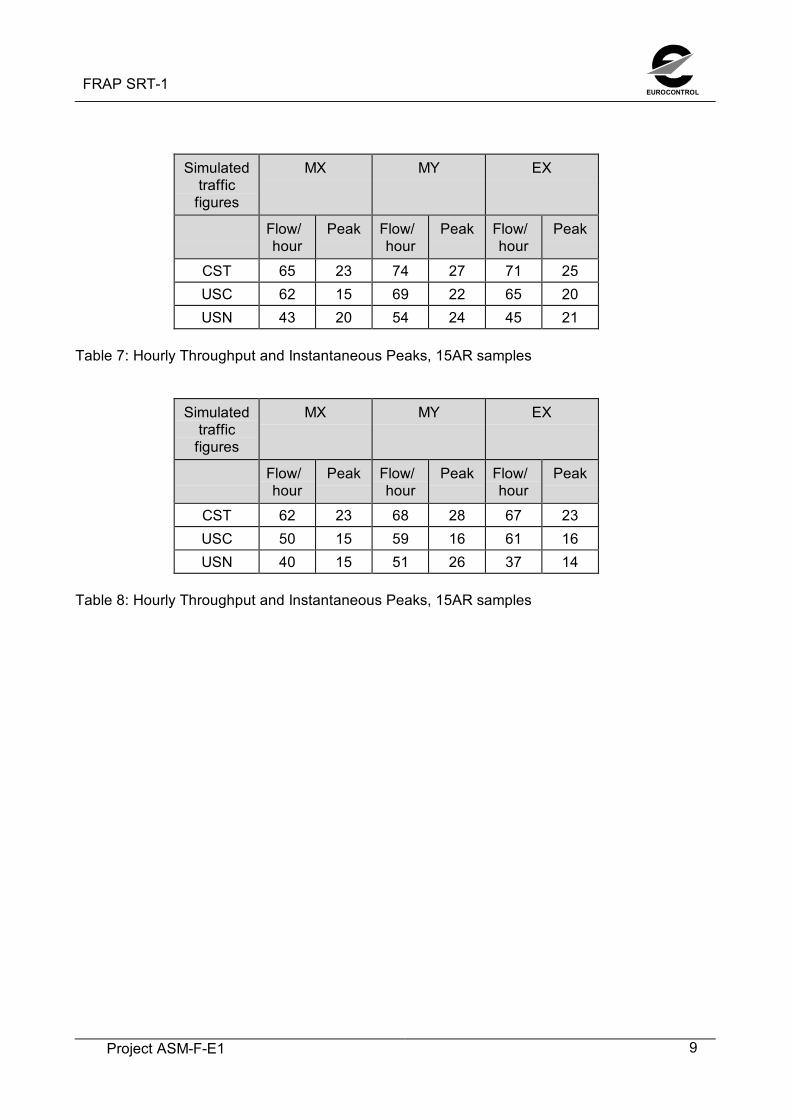
3.2.2 Traffic Sample Analysis
The analysis of the traffic samples below show the load that each sample representedfor the simulated measured sectors.
Simulatedtraffic
figures
MX MY EX
Flow/hour
Peak Flow/hour
Peak Flow/hour
Peak
CST 57 21 61 25 54 20USC 40 15 49 14 49 16USN 31 10 43 18 37 17
Table 5: Hourly Throughput and Instantaneous Peaks, 13AR samples
Simulatedtraffic
figures
MX MY EX
Flow/hour
Peak Flow/hour
Peak Flow/hour
Peak
CST 50 16 55 22 48 9USC 41 12 41 13 41 20USN 25 10 42 18 27 12
Table 6: Hourly Throughput and Instantaneous Peaks, 13FR samples
FRAP SRT-1 EUROCONTROL
Project ASM-F-E1 9
Simulatedtraffic
figures
MX MY EX
Flow/hour
Peak Flow/hour
Peak Flow/hour
Peak
CST 65 23 74 27 71 25USC 62 15 69 22 65 20USN 43 20 54 24 45 21
Table 7: Hourly Throughput and Instantaneous Peaks, 15AR samples
Simulatedtraffic
figures
MX MY EX
Flow/hour
Peak Flow/hour
Peak Flow/hour
Peak
CST 62 23 68 28 67 23USC 50 15 59 16 61 16USN 40 15 51 26 37 14
Table 8: Hourly Throughput and Instantaneous Peaks, 15AR samples

EUROCONTROLFRAP SRT-1
Project ASM-F-E110
3.3 PROGRAM OF EXERCISES
Day/Date Exercise 1 Exercise 2 Exercesi 3Day 1,22 Nov Training TrainingDay 2,23 Nov
13MXARN
13MYARN
13EXARN
Day 3,24 Nov
13MXFRAC
13MYFRAC
13EXFRAC
Day 4,25 Nov
13MXFRAC
13MYFRAC
13EXFRAC
Day 5,26 Nov
13MXARN
13MYARN
13EXARN
Day 6,29 Nov
15MXFRAC
15MYFRAC
15EXFRAC
Day 7,30 Nov
15MXARN
15MYARN
15EXARN
Day 8,1 Dec
15MXARN
15MYARN
15EXARN
Day 9,2 Dec
15EXFRAC
15MYFRAC
15MXFRAC
Day 10,3 Dec
15MXARN
Table 9: Program of exercises
24 measured exercises were executes, however for technical reasons recording werepartially or fully lost or disrupted for 4 exercises (marked with grey in table 4)
3.4 SIMULATED ATC SYSTEM
3.4.1 Controller Working PositionsThe Measured Controller Working Position consisted of:
• Sony 29’ square colour display, used to provide a multi-window workingenvironment; (LIN PLC and USC PLC used a 21’ monitor)
• Hewlett Packard processor and Metheus display driver;• 3 Button Mouse;• A simulation telecommunication system with headset, foot switch and panel-
mounted push-to-talk facility.
Each CWP included a subjective workload panel (Instantaneous Self-Assessment –ISA) used by the controller for periodic input during measured exercises.
FRAP SRT-1 EUROCONTROL
Project ASM-F-E1 11
3.4.2 System Functionality
3.4.2.1. Surveillance
The entire simulated area was covered by radar. In general the vertical limits of radarcoverage were from 3000’ to unlimited.
3.4.2.2. OLDI/SYSCO
Estimates were sent by the preceding sector 12 minutes before the flight time forpassing the sector boundary.
3.4.2.5. Safety Nets
• Short Term Conflict Detection (STCA)
Short Term Conflict Alert (STCA) was defined within the radar coverage area,taking into consideration Cleared Flight Level. The look-ahead time was 2minutes.
3.4.3 Human Machine Interface (HMI)3.4.3.1. General
The simulation used two different HMIs:
Maastricht/Lippe
Executive Controller (EXC) and Planner Controller (PLC) had radar windows withcolour coding of the data label of flights assumed by the sector The data labelcontained callsign, Mode-C level, Cleared Flightlevel (CFL) and Exit Flightlevel (XFL).Flight plan data was presented in list format after the same principles as are used inthe present MADAP System. A Short Term Conflict Alert (STCA) was activated if twoflights were predicted to be within 5 NM and 1000’ (2000’ for non-RVSM equippedaircraft and above Fl 400) within 2 minutes. Non-RVSM equipped aircraft weremarked with a colour coding of the Mode-C information.
Copenhagen
The EXC had a radar window with colour coding of the data label of flights assumedby the sector The data label contained callsign and Mode-C level. STCA wasactivated if two flights were predicted to be within 5 NM and 1000’ (2000’ for non-RVSM equipped aircraft and above Fl 400) within 2 minutes. Non-RVSM equippedaircraft were marked with a colour coding of the Mode-C information.
The PLC had paper-strips with flightplan information.
EUROCONTROLFRAP SRT-1
Project ASM-F-E112
3.4.4 ATC Procedures
A revised Letter of Agreement between Maastricht and Copenhagen was developed,in order to allow the use of Free Routes. All levels were following the RVSM semi-circular rule.
3.4.5 Provision of service
Maastricht/Lippe operated during the simulation with a two-service provider conceptwith very close co-operation between the civil and military controller. Data isautomatically displayed for the other part, and the phone co-ordination is reduced to aminimum.
Copenhagen operated with a single-service provider concept. One sector-suite ishandling all traffic within a given volume of airspace.
FRAP SRT-1 EUROCONTROL
Project ASM-F-E1 13
4. RESULTS
4.1 CONTROLLER WORKLOAD
4.1.1 Objective:
Assess the impact, in terms of controller workload and complexity, of the introductionof FRAC in an operational environment representing a typical ATC system in the year2003.
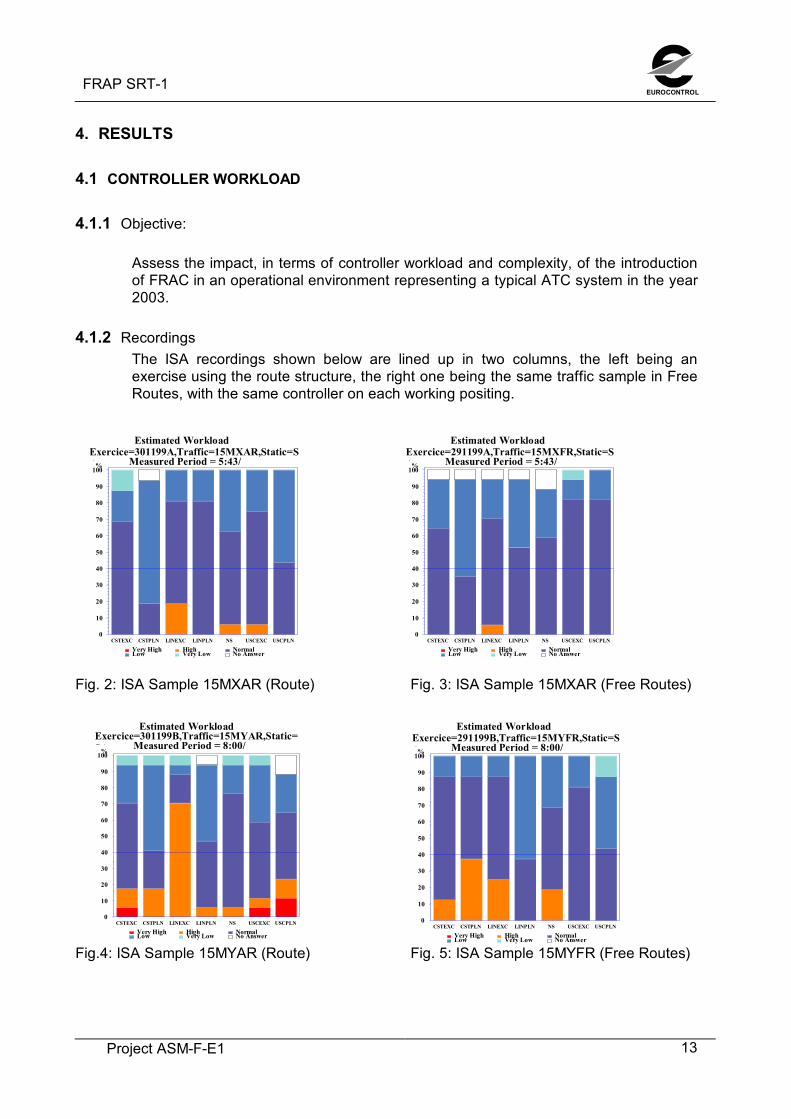
4.1.2 RecordingsThe ISA recordings shown below are lined up in two columns, the left being anexercise using the route structure, the right one being the same traffic sample in FreeRoutes, with the same controller on each working positing.
Fig. 2: ISA Sample 15MXAR (Route) Fig. 3: ISA Sample 15MXAR (Free Routes)
Fig.4: ISA Sample 15MYAR (Route) Fig. 5: ISA Sample 15MYFR (Free Routes)
Estimated Workload(ISA)Exercice=301199B,Traffic=15MYAR,Static=
SA Measured Period = 8:00/9 11
Very High High NormalLow Very Low No Answer
%
0
10
20
30
40
50
60
70
80
90
100
CSTEXC CSTPLN LINEXC LINPLN NS USCEXC USCPLN
Estimated Workload(ISA)Exercice=291199B,Traffic=15MYFR,Static=S
A Measured Period = 8:00/9 11
Very High High NormalLow Very Low No Answer
%
0
10
20
30
40
50
60
70
80
90
100
CSTEXC CSTPLN LINEXC LINPLN NS USCEXC USCPLN
Estimated Workload(ISA)Exercice=301199A,Traffic=15MXAR,Static=S
A Measured Period = 5:43/6 54
Very High High NormalLow Very Low No Answer
%
0
10
20
30
40
50
60
70
80
90
100
CSTEXC CSTPLN LINEXC LINPLN NS USCEXC USCPLN
Estimated Workload(ISA)Exercice=291199A,Traffic=15MXFR,Static=S
A Measured Period = 5:43/6 53
Very High High NormalLow Very Low No Answer
%
0
10
20
30
40
50
60
70
80
90
100
CSTEXC CSTPLN LINEXC LINPLN NS USCEXC USCPLN

EUROCONTROLFRAP SRT-1
Project ASM-F-E114
Fig. 6 ISA Sample 15EXAR (Route) Fig. 7: ISA Sample 15EXFR (Free Routes)
Fig. 8 ISA Sample 15MXAR (Route) Fig. 9: ISA Sample 15MXFR (Free Routes)
Fig. 10 ISA Sample 15MXAR (Route) Fig. 11: ISA Sample 15MXFR (Free Routes)
Estimated Workload(ISA)Exercice=301199C,Traffic=15EXAR,Static=S
A Measured Period =15 20/16 31
Very High High NormalLow Very Low No Answer
%
0
10
20
30
40
50
60
70
80
90
100
CSTEXC CSTPLN LINEXC LINPLN NS USCEXC USCPLN
Estimated Workload(ISA)Exercice=291199C,Traffic=15EXFR,Static=S
A Measured Period =15 20/16 32
Very High High NormalLow Very Low No Answer
%
0
10
20
30
40
50
60
70
80
90
100
CSTEXC CSTPLN LINEXC LINPLN NS USCEXC USCPLN
Estimated Workload (ISA)Exercice=031299A,Traffic=15MXAR,Static=SA
Measured Period = 5:43/ 6:54
Very High NormaLow Very No
%
0
10
20
30
40
50
60
70
80
90
100
CSTEXC CSTPLN LINEXC LINPLN NS USCEXC USCPLN
Estimated Workload (ISA)Exercice=011299A,Traffic=15MXFR,Static=SA Measured Period = 5:43/ 6:53
Very High NormaLow Very No
%
0
10
20
30
40
50
60
70
80
90
100
CSTEXC CSTPLN LINEXC LINPLN NS USCEXC USCPLN
Estimated Workload(ISA)Exercice=011299B,Traffic=15EXAR,Static=S
A Measured Period =15 20/16 32
Very High High NormalLow Very Low No Answer
%
0
10
20
30
40
50
60
70
80
90
100
CSTEXC CSTPLN LINEXC LINPLN NS USCEXC USCPLN
Estimated Workload (ISA)Exercice=021299B,Traffic=15EXFR,Static=SA
Measured Period = 15:20/16:31
Very High NormaLow Very No
%
0
10
20
30
40
50
60
70
80
90
100
CSTEXC CSTPLN LINEXC LINPLN NS USCEXC USCPLN
FRAP SRT-1 EUROCONTROL
Project ASM-F-E1 15
ISA recordings show no clear change in workload between the route structuredexercises and the Free Routes exercises, however there is a reduction in “Very High”,in Free Routes that indicates that the number of peaks where the controller isoverloaded is reduced
The PLCs feel in general a higher workload than the EXCs. This is in contradiction tothe statements made during de-briefings, where PLCs feels unable to support theEXC, and that the work becomes more tactical oriented in Free Routes.
The reason for this can be that the provided tool-set needs more development toprovide good support to the PLC
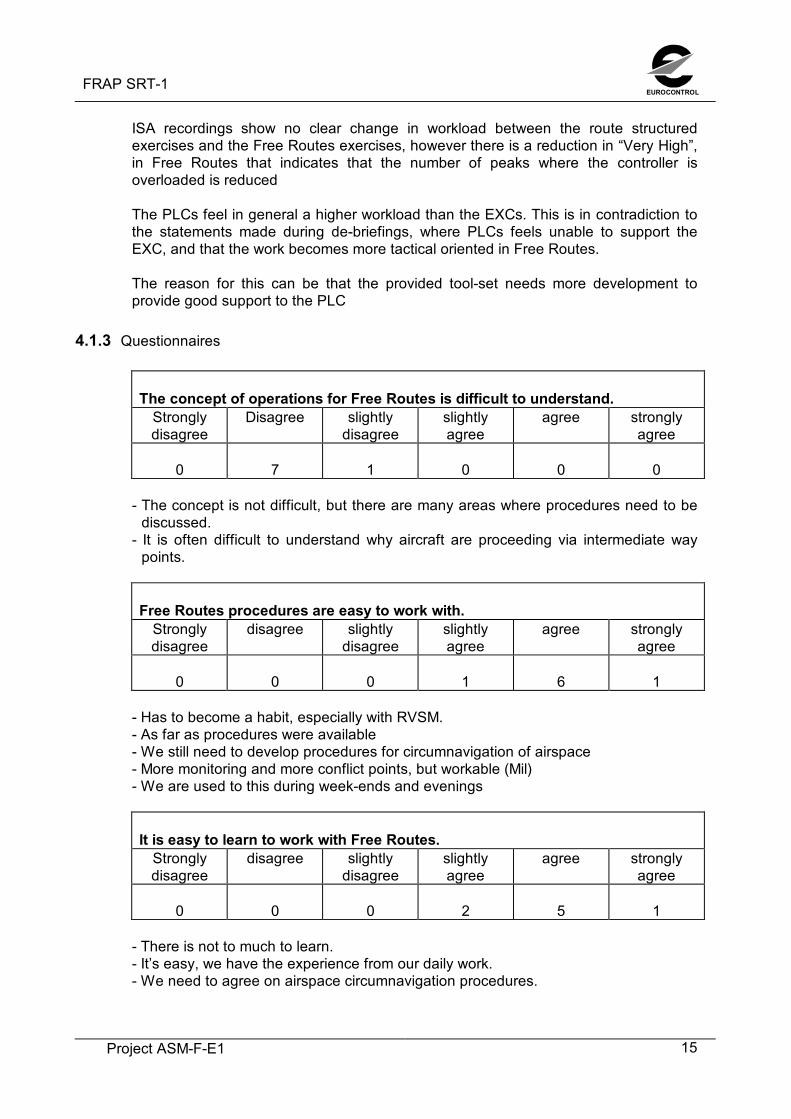
4.1.3 Questionnaires
The concept of operations for Free Routes is difficult to understand.Stronglydisagree
Disagree slightlydisagree
slightlyagree
agree stronglyagree
0 7 1 0 0 0
- The concept is not difficult, but there are many areas where procedures need to bediscussed.
- It is often difficult to understand why aircraft are proceeding via intermediate waypoints.
Free Routes procedures are easy to work with.Stronglydisagree
disagree slightlydisagree
slightlyagree
agree stronglyagree
0 0 0 1 6 1
- Has to become a habit, especially with RVSM.- As far as procedures were available- We still need to develop procedures for circumnavigation of airspace- More monitoring and more conflict points, but workable (Mil)- We are used to this during week-ends and evenings
It is easy to learn to work with Free Routes.Stronglydisagree
disagree slightlydisagree
slightlyagree
agree stronglyagree
0 0 0 2 5 1
- There is not to much to learn.- It’s easy, we have the experience from our daily work.- We need to agree on airspace circumnavigation procedures.
EUROCONTROLFRAP SRT-1
Project ASM-F-E116
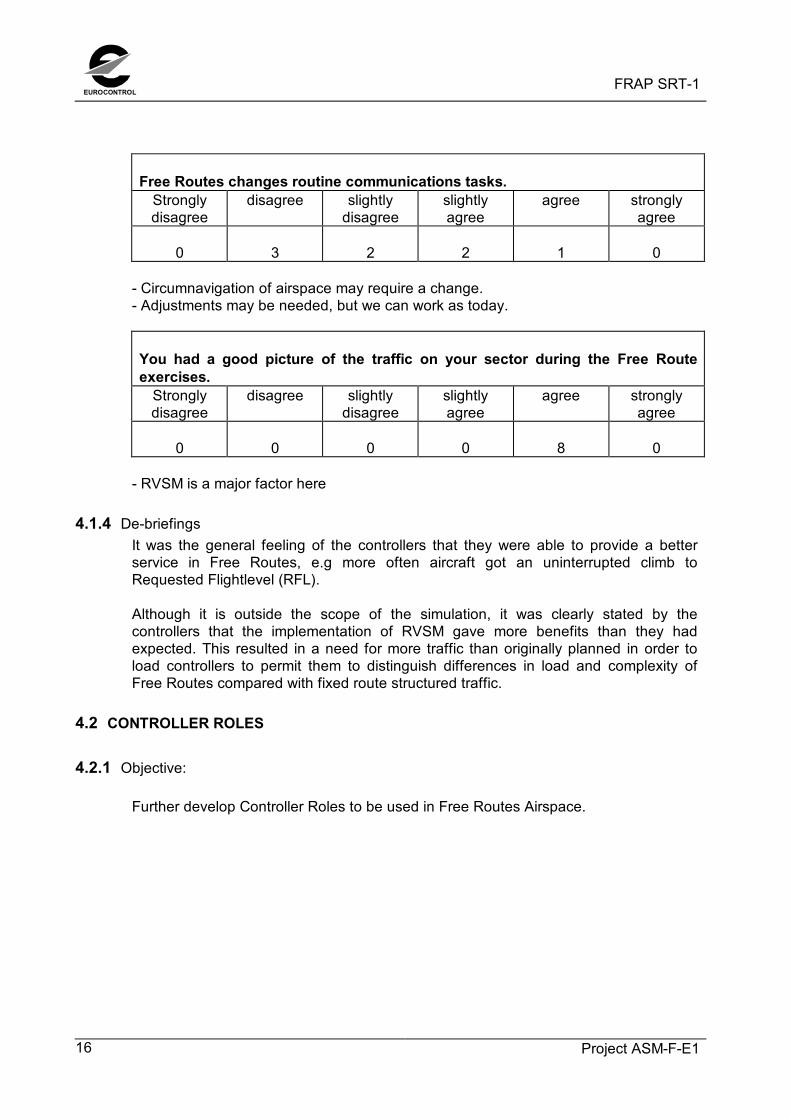
Free Routes changes routine communications tasks.Stronglydisagree
disagree slightlydisagree
slightlyagree
agree stronglyagree
0 3 2 2 1 0
- Circumnavigation of airspace may require a change.- Adjustments may be needed, but we can work as today.
You had a good picture of the traffic on your sector during the Free Routeexercises.
Stronglydisagree
disagree slightlydisagree
slightlyagree
agree stronglyagree
0 0 0 0 8 0
- RVSM is a major factor here
4.1.4 De-briefingsIt was the general feeling of the controllers that they were able to provide a betterservice in Free Routes, e.g more often aircraft got an uninterrupted climb toRequested Flightlevel (RFL).
Although it is outside the scope of the simulation, it was clearly stated by thecontrollers that the implementation of RVSM gave more benefits than they hadexpected. This resulted in a need for more traffic than originally planned in order toload controllers to permit them to distinguish differences in load and complexity ofFree Routes compared with fixed route structured traffic.
4.2 CONTROLLER ROLES
4.2.1 Objective:
Further develop Controller Roles to be used in Free Routes Airspace.

FRAP SRT-1 EUROCONTROL
Project ASM-F-E1 17
4.2.2 Recordings
%
80
82
84
86
88
90
92
94
13AR 13FR 15AR 15FR
Fig. 12. Percentage of aircraft cleared to requested cruising level
Figure 12 shows that 8,6% more flights in the 130% samples and 3.2% more flights inthe 150% samples were cleared to the requested flight level in Free Routes comparedto the routes scenario.
Turbulence was introduced in 50% of the 130% samples, this explains why moreaircraft are cleared to RFL in the 150% samples.
The recording of separation losses shows no difference between the two scenarios.
The data indicates a higher level of service, and less conflicts in the Free RoutesScenario.
4.2.3 Questionnaires
Free Routes will not fundamentally change the way that controllers work.Stronglydisagree
Disagree slightlydisagree
slightlyagree
Agree stronglyagree
0 0 1 2 5 0
- Free Routes is already applied in week-ends- In Copenhagen, where we use strips, it will change, as we cannot identify the
conflicts on the strips. Conflict search is left to the EXC.

EUROCONTROLFRAP SRT-1
Project ASM-F-E118
Conflict solving becomes more tactical in Free Routes, it is difficult for thePLC/Coordinator to foresee conflicts.
Stronglydisagree
Disagree slightlydisagree
slightlyagree
Agree stronglyagree
0 1 0 3 3 1
- The PLC must have a radar screen.- It will not be difficult - only different.- Difficult for both (Mil)- Depending on the tools available and the environment you work in.- But MTCD might give the PLC a better indication of conflicts.- A question of experience
Free Routes enables a re-distribution of tasks within the team.Stronglydisagree
Disagree slightlydisagree
slightlyagree
Agree stronglyagree
0 2 1 1 4 0
- It requires different equipment and better tools.- Not really in a paper-strip environment.- Especially for the military coordinator.
Free Routes makes you think differently about the tasks.Stronglydisagree
Disagree slightlydisagree
slightlyagree
Agree stronglyagree
0 4 1 2 1 0
- Basically we are still separating aircraft.- Closer coordination civil-military- Only activate TRA’s when needed
4.2.4 De-briefingsThe job becomes more tactical. It is more difficult for the PLC to foresee and solveproblems. At the same time the capacity gain stemming from RVSM and the expectedcapacity gain from Free Routes adds on the EXC’s tasks. Higher traffic figures meansan increase in routine tasks such as frequency changes, SSR-code modifications
This means that the load on the controller team becomes uneven distributed, and theEXC becomes the bottleneck in the system, as it is clearly shown in the ISArecordings.
There are several ways to reduce this problem:

FRAP SRT-1 EUROCONTROL
Project ASM-F-E1 19
• Sector that are bigger in the lateral plan, but with a vertical split will reduce thenumber of frequency changes, however it may not be possible to monitor the trafficsafely in a big sector.
• Avoidance of SSR-code changes (mode-S)• Introduction of monitoring tools such as Medium Term Conflict Detection (MTCD)
and Area Proximity Warning (APW). The monitoring tools would empower the PLCto off-load the EXC, and hereby reduce the bottleneck. This would result in highercapacity.
• Air-ground data-link; even a limited implementation could releive the EXC forcertain non-time-critical routine tasks such as frequency changes.
The above measures shall not be seen as constraints for the introduction of the FreeRoutes concept, but as ways to increase the capacity once Free Routes isimplemented. They are mentioned because it is expected that the benefits of thesemeasures will be higher in a Free Route environment that with fixed routes.
4.3 EFFICIENCY AND CAPACITY
4.3.1 Objective: Determine whether expected efficiency gains are likely to be met.
4.3.2 Recordings
Number of instructions
0,00
0,50
1,00
1,50
2,00
2,50
3,00
3,50
4,00
4,50
13AR 13FR 15AR 15FR
Fig. 13, Tactical instruction pr. aircraft/sector
Fig. 13 shows the average number of tactical instructions (level, heading and direct)pr sector in Air routes (AR) and Free Routes (FR) in the two traffic levels 130% (13)and 150% (15).
A reduction of tactical instructions of 11.8% in the 130% samples and 4.8% in the150% samples were recorded. This indicates a possible capacity gain on the
EUROCONTROLFRAP SRT-1
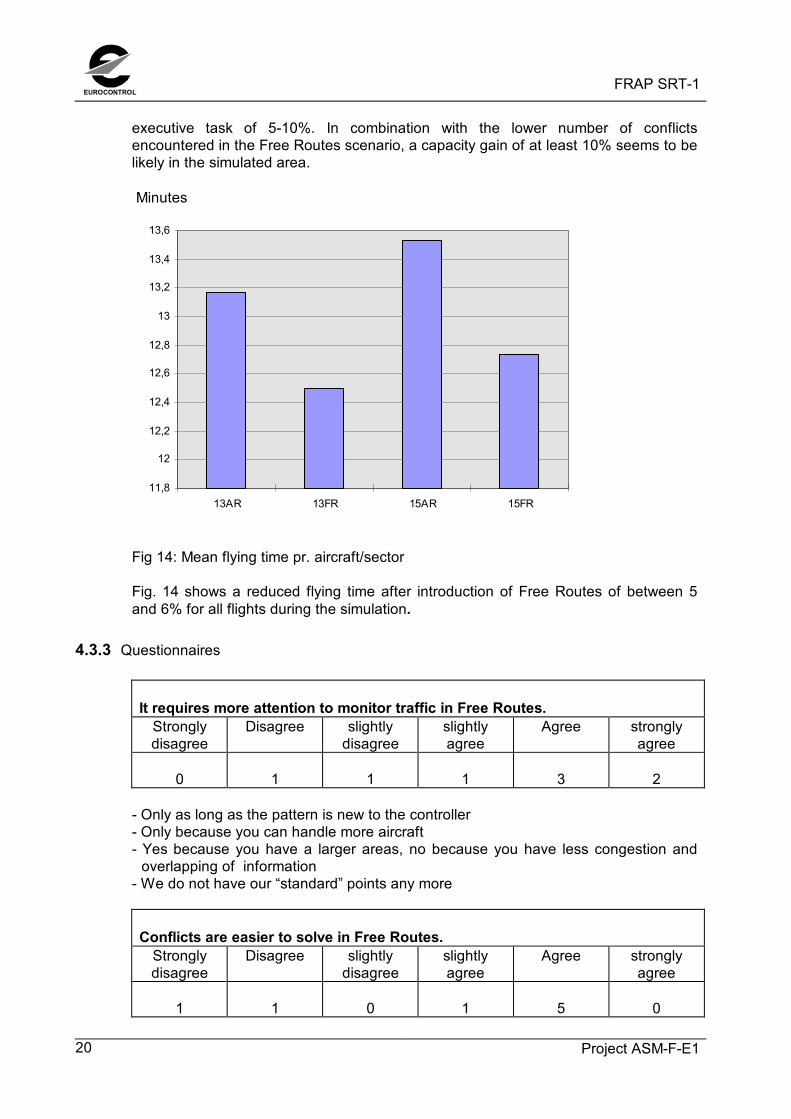
Project ASM-F-E120
executive task of 5-10%. In combination with the lower number of conflictsencountered in the Free Routes scenario, a capacity gain of at least 10% seems to belikely in the simulated area.
Minutes
11,8
12
12,2
12,4
12,6
12,8
13
13,2
13,4
13,6
13AR 13FR 15AR 15FR
Fig 14: Mean flying time pr. aircraft/sector
Fig. 14 shows a reduced flying time after introduction of Free Routes of between 5and 6% for all flights during the simulation.
4.3.3 Questionnaires
It requires more attention to monitor traffic in Free Routes.Stronglydisagree
Disagree slightlydisagree
slightlyagree
Agree stronglyagree
0 1 1 1 3 2
- Only as long as the pattern is new to the controller- Only because you can handle more aircraft- Yes because you have a larger areas, no because you have less congestion and
overlapping of information- We do not have our “standard” points any more
Conflicts are easier to solve in Free Routes.Stronglydisagree
Disagree slightlydisagree
slightlyagree
Agree stronglyagree
1 1 0 1 5 0

FRAP SRT-1 EUROCONTROL
Project ASM-F-E1 21
- More space available- There are more “holes” for OAT- Only when we have segregated airspace next to the ATS-route
Free Routes enabled you to handle more traffic in generalStronglydisagree
Disagree slightlydisagree
slightlyagree
Agree stronglyagree
0 0 0 1 7 0
- Don’t underestimate the RVSM factor
Free Routes enabled you to handle more traffic as long as the number of activeTRA’s and R&D Areas was low.
Stronglydisagree
Disagree slightlydisagree
slightlyagree
Agree stronglyagree
0 0 1 0 5 1
Free Routes enabled you to provide the airspace users with a better service.Stronglydisagree
Disagree slightlydisagree
slightlyagree
Agree stronglyagree
0 0 0 1 6 1
- Shorter route, and more often at the requested level- A more flexible use of the airspace is an advantage for all- Usually straight up to requested level
Free Routes enabled you to execute your tasks more effectively.Stronglydisagree
disagree Slightlydisagree
slightlyagree
Agree stronglyagree
0 1 1 0 5 0
- As the aircraft are more spread out, conflict solving is easier
4.4 MILITARY ISSUES
4.4.1 Objective: Assess the impact on military counterparts with respect to OAT transit flights and theuse of segregated airspace when introducing FRAC.

EUROCONTROLFRAP SRT-1
Project ASM-F-E122
4.4.2 Questionnaires
Civil-military coordination becomes more demanding in Free RoutesStronglydisagree
Disagree slightlydisagree
slightlyagree
Agree stronglyagree
0 1 0 3 3 1
- When standard agreements are laid down, it should not be more demanding.- Should be re-evaluated with live traffic.
4.4.3 Controller OpinionsThe Lippe controllers (MIL) felt an increase in the monitoring task with Free Routesoperations compared to route structured traffic, but this extra load was compensatedby more space to manoeuvre between the civil flights. The general feeling was thatthe overall effect for OAT traffic was unchanged.
Some doubt was expressed about other areas, where the civil traffic is denser. HereFree Routes may cause problems to OAT traffic. The same doubt was expressedabout regions where the civil-military cooperation is less flexible than between LippeRadar and the civil Coastal Sector. The issue needs studying in one of theforthcoming simulations.
4.5 AIRSPACE AND PROCEDURES
4.5.1 Objective:
Assess the proposed lateral and vertical limits of FRAC airspace with regard to trafficcomplexity, traffic load and interface problems using traffic samples reflecting the2003 traffic load and flows.
4.5.2 Questionnaires
Controlling a mixture of Free Routes and non-Free Routes flights is moredemanding than controlling pure Free Routes traffic
Stronglydisagree
disagree slightlydisagree
slightlyagree
Agree stronglyagree
0 2 0 4 2 0
- Disagree as an OAT-controller- We only had a few non-Free Route flights- In this simulation it was either fixed or free, in real life we also have hybrids, which
will make it manageable.- We want to be efficient and clear all flights direct. It’s just an irritation if some cannot
or aren’t allowed.
FRAP SRT-1 EUROCONTROL
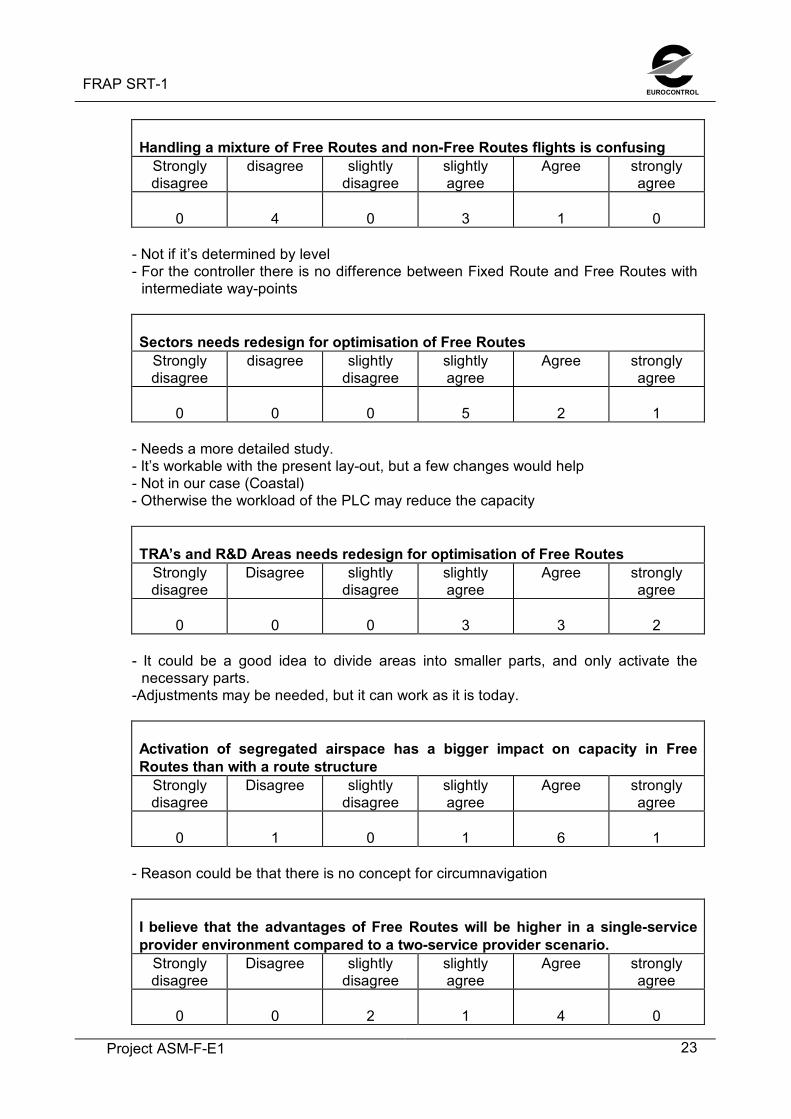
Project ASM-F-E1 23
Handling a mixture of Free Routes and non-Free Routes flights is confusingStronglydisagree
disagree slightlydisagree
slightlyagree
Agree stronglyagree
0 4 0 3 1 0
- Not if it’s determined by level- For the controller there is no difference between Fixed Route and Free Routes with
intermediate way-points
Sectors needs redesign for optimisation of Free RoutesStronglydisagree
disagree slightlydisagree
slightlyagree
Agree stronglyagree
0 0 0 5 2 1
- Needs a more detailed study.- It’s workable with the present lay-out, but a few changes would help- Not in our case (Coastal)- Otherwise the workload of the PLC may reduce the capacity
TRA’s and R&D Areas needs redesign for optimisation of Free RoutesStronglydisagree
Disagree slightlydisagree
slightlyagree
Agree stronglyagree
0 0 0 3 3 2
- It could be a good idea to divide areas into smaller parts, and only activate thenecessary parts.
-Adjustments may be needed, but it can work as it is today.
Activation of segregated airspace has a bigger impact on capacity in FreeRoutes than with a route structure
Stronglydisagree
Disagree slightlydisagree
slightlyagree
Agree stronglyagree
0 1 0 1 6 1
- Reason could be that there is no concept for circumnavigation
I believe that the advantages of Free Routes will be higher in a single-serviceprovider environment compared to a two-service provider scenario.
Stronglydisagree
Disagree slightlydisagree
slightlyagree
Agree stronglyagree
0 0 2 1 4 0
EUROCONTROLFRAP SRT-1
Project ASM-F-E124
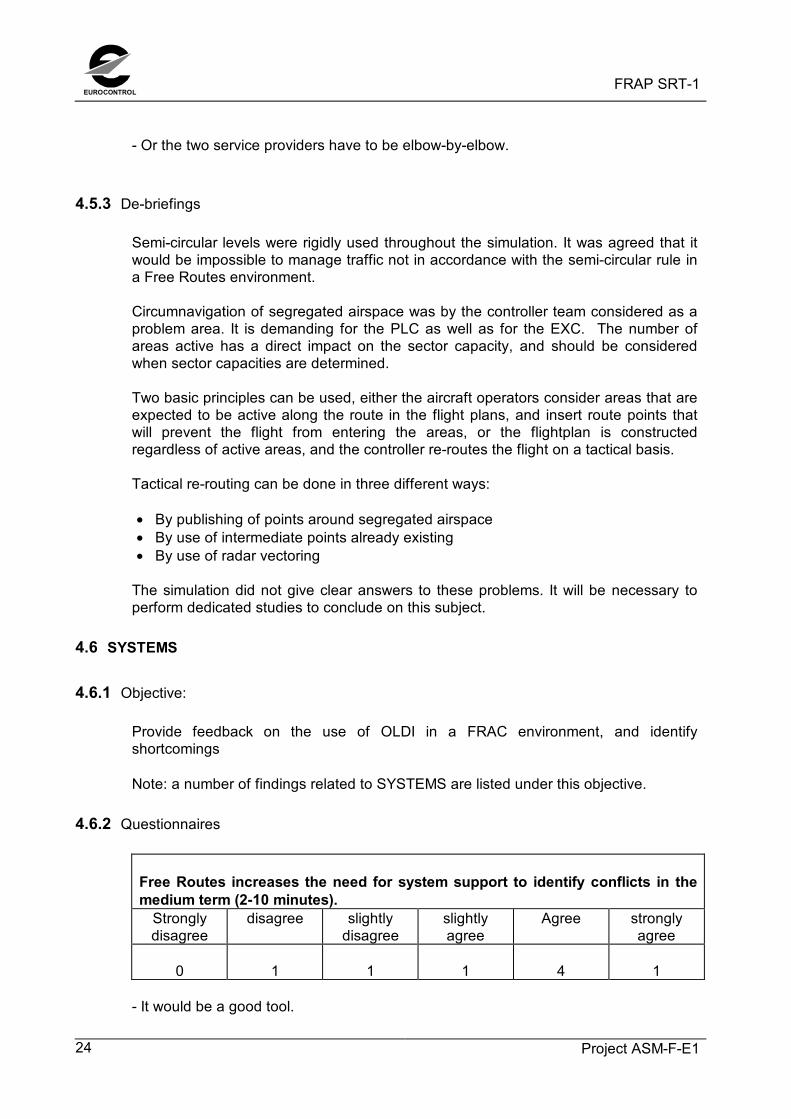
- Or the two service providers have to be elbow-by-elbow.
4.5.3 De-briefings
Semi-circular levels were rigidly used throughout the simulation. It was agreed that itwould be impossible to manage traffic not in accordance with the semi-circular rule ina Free Routes environment.
Circumnavigation of segregated airspace was by the controller team considered as aproblem area. It is demanding for the PLC as well as for the EXC. The number ofareas active has a direct impact on the sector capacity, and should be consideredwhen sector capacities are determined.
Two basic principles can be used, either the aircraft operators consider areas that areexpected to be active along the route in the flight plans, and insert route points thatwill prevent the flight from entering the areas, or the flightplan is constructedregardless of active areas, and the controller re-routes the flight on a tactical basis.
Tactical re-routing can be done in three different ways:
• By publishing of points around segregated airspace• By use of intermediate points already existing• By use of radar vectoring
The simulation did not give clear answers to these problems. It will be necessary toperform dedicated studies to conclude on this subject.
4.6 SYSTEMS
4.6.1 Objective: Provide feedback on the use of OLDI in a FRAC environment, and identifyshortcomings
Note: a number of findings related to SYSTEMS are listed under this objective.
4.6.2 Questionnaires
Free Routes increases the need for system support to identify conflicts in themedium term (2-10 minutes).
Stronglydisagree
disagree slightlydisagree
slightlyagree
Agree stronglyagree
0 1 1 1 4 1
- It would be a good tool.
FRAP SRT-1 EUROCONTROL
Project ASM-F-E1 25
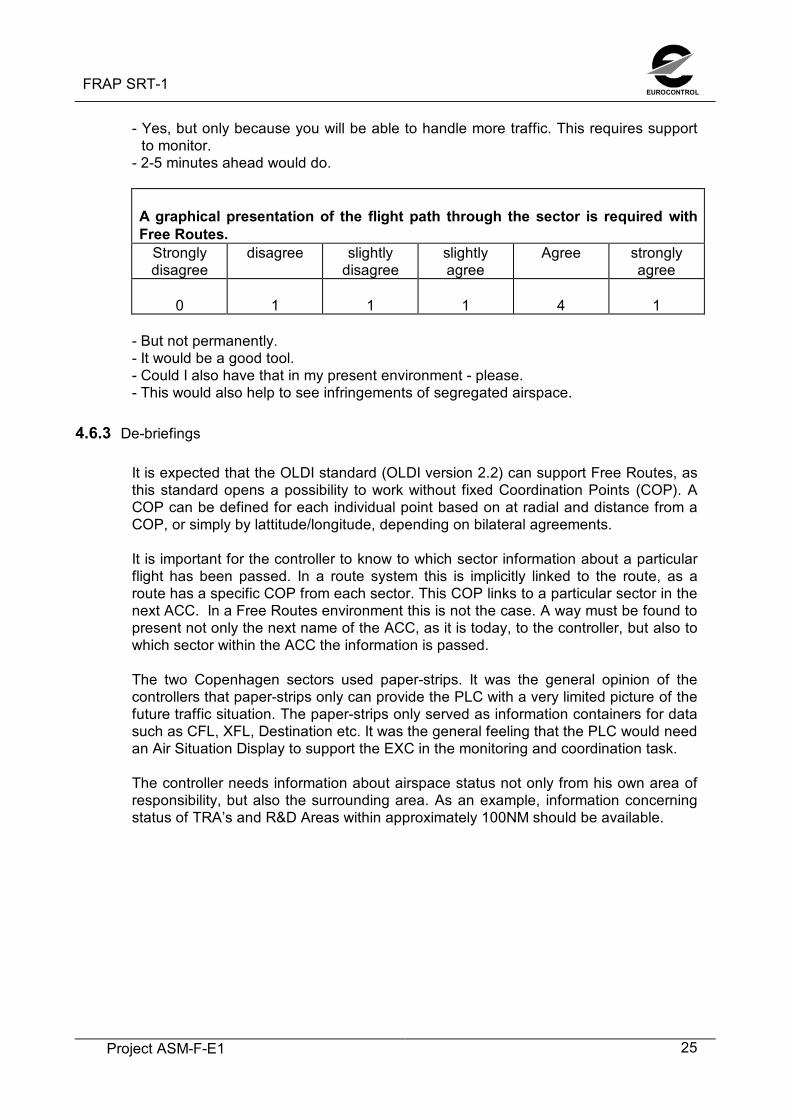
- Yes, but only because you will be able to handle more traffic. This requires supportto monitor.
- 2-5 minutes ahead would do.
A graphical presentation of the flight path through the sector is required withFree Routes.
Stronglydisagree
disagree slightlydisagree
slightlyagree
Agree stronglyagree
0 1 1 1 4 1
- But not permanently.- It would be a good tool.- Could I also have that in my present environment - please.- This would also help to see infringements of segregated airspace.
4.6.3 De-briefings
It is expected that the OLDI standard (OLDI version 2.2) can support Free Routes, asthis standard opens a possibility to work without fixed Coordination Points (COP). ACOP can be defined for each individual point based on at radial and distance from aCOP, or simply by lattitude/longitude, depending on bilateral agreements.
It is important for the controller to know to which sector information about a particularflight has been passed. In a route system this is implicitly linked to the route, as aroute has a specific COP from each sector. This COP links to a particular sector in thenext ACC. In a Free Routes environment this is not the case. A way must be found topresent not only the next name of the ACC, as it is today, to the controller, but also towhich sector within the ACC the information is passed.
The two Copenhagen sectors used paper-strips. It was the general opinion of thecontrollers that paper-strips only can provide the PLC with a very limited picture of thefuture traffic situation. The paper-strips only served as information containers for datasuch as CFL, XFL, Destination etc. It was the general feeling that the PLC would needan Air Situation Display to support the EXC in the monitoring and coordination task.
The controller needs information about airspace status not only from his own area ofresponsibility, but also the surrounding area. As an example, information concerningstatus of TRA’s and R&D Areas within approximately 100NM should be available.

EUROCONTROLFRAP SRT-1
Project ASM-F-E126
5. CONCLUSIONS
Assess the impact, in terms of controller workload and complexity, of the introductionof FRAC in an operational environment representing a typical ATC system in the year2003
• Controllers had no problems to understand and to learn to work in the Free Routesenvironment. In this context it should be noted that the Maastrich and Copenhagencontrollers are used to working in a “Direct Route” environment.
• Civil airspace users will have an improved level of service.• This simulation did not identify deterioration in the service level to military users.• Although it is the general opinion amongst the participating controllers that the
monitoring task becomes more demanding, no objective data points in thatdirection.
• It becomes more difficult for the Planner Controller to monitor the traffic andforesee conflicts in a Free Routes Scenario.
• Especially in systems using paper strips will it be difficult for the PLC to predictconflicts.
• Higher capacity increases routine communication tasks; this increases the load onthe EXC.
• Conflict detection becomes more tactical, and the EXC becomes the bottleneck.
Further develop Controller Roles to be used in Free Routes Airspace.
• In order to develop a more evenly balanced task distribution on the sector, it will benecessary to empower the PLC, i.e. give the PLC tools that enables him to solveproblems before they become EXC tasks.
Determine whether expected efficiency gains are likely to be met.
• An ATC capacity gain of 10% compared to a fixed route environment can beexpected in the simulated area was demonstrated.
• An improvement of PLC tools may lead to bigger capacity gains.• Active areas will have a direct impact on sector capacity.
Assess the impact on military counterparts with respect to OAT transit flights and theuse of segregated airspace when introducing FRAC.
• No negative effect was identified in this geographical area using the civil-militaryconcepts as they are today.
Assess the proposed lateral and vertical limits of FRAC airspace with regard to trafficcomplexity, traffic load and interface problems using traffic samples reflecting theexpected year 2003 traffic load and flows.
• No negative results or comments are recorded with regard to the proposed verticallevel division.
• Mixed-mode operation (sectors operating with a mixture of Free Routes and fixedroutes traffic) had only a initial negative effect.
FRAP SRT-1 EUROCONTROL
Project ASM-F-E1 27
Provide feedback on the use of OLDI in a FRAC environment, and identifyshortcomings
• OLDI version 2.2 can support Free Routes.• It is a requirement that the sector sequence is known to the controller (succeeding
and preceding sector).
Other system related issues:
• Introduction of planning tools that can move tasks from the EXC to the PLC willhave a positive effect on capacity.
• The PLC needs a presentation of surveillance data.• A graphical presentation of the planned trajectory (Dynamic Flight Leg) and radar
data is required for the Planning Controller.• Paper strips are of very limited use in a Free Route environment, as they give no
useful presentation of the flight path.• Airspace status for surrounding areas shall be available.
EUROCONTROLFRAP SRT-1
Project ASM-F-E128
6. RECOMMENDATIONSThe following additional studies should be carried out during the Validation Phase ofthe Eight-States Free Routes Project
1. Identify the best way to circumnavigate segregated airspace on a tactical basis.2. Assess the consequences of implementing The Free Routes Concept in areas
with separate civil and military service provision.3. Assess possible ways to achieve a more evenly balanced distribution of task
between PLC and EXC4. Perform real-time simulation in the busiest and most complex areas of the Eight-
States.5. Develop OLDI/SYSCO requirements for Free Routes operation.