Eight County Freight Plan IADOT Meeting - ECIATrans
52
Eight County Freight Study Iowa DOT Transportation Meeting December 14, 2017 Dubuque, IA
Transcript of Eight County Freight Plan IADOT Meeting - ECIATrans

Eight County Freight StudyIowa DOT Transportation Meeting
December 14, 2017Dubuque, IA

2
Project Sponsors

3
Presentation Map
The Eight County Freight Study• Work Plan• Schedule and Status
Key Outcomes and Information to be Delivered
Next Steps

• Inconsistent data across freight modes• Understand link between freight transportation system and
local economy• Be aware freight system needs and opportunities• Incorporate freight in local transportation planning
decisions
Project Objective
Project Motivations
To develop a better understanding of the multimodal freight system in the bistate region and to use this information to better inform policy and programming decisions in the region.
4

5
Eight County Freight Study
Key Tasks
• Physical System Inventory
• Commodity Flow Profile
• Freight System Needs Assessment
• Freight System Recommendations & Benefits Evaluation
• Stakeholder Outreach
December 2017

6
Work Plan Overview
1 2 3 4 5 6 7 8 9 10 11 12 13 14Project Inception
Task 0.1 - Kick-Off MeetingTask 0.2 - Literature Review and Initial Data CollectionTask 0.3 - Project Management & revise Work Plan, as needed
Task 1 - Data Collection and InventoryTask 1.1 - Physical ProfileTask 1.2 - Operational ProfileTask 1.3 - Stakeholder Consultations & 6 Council Meetings
Task 2 - Needs Assessment and AnalysisTask 2.1 - Freight System Performance MeasuresTask 2.2 - Existing and Future Commodity Flow AssessmentTask 2.3 - Freight Modal Profiles and Needs Assessment Report
Task 3 - Study RecommendationsTask 3.1 - Freight System Infrastructure ProjectsTask 3.2 - Project Evaluation and PrioritizationTask 3.3 - Supporting Freight System Strategies
Task 4 - ReportingTask 4.1 - Draft Final ReportTask 4.2 - Final Report
LegendMajor Task Duration Work Activity Meeting
Months
We are here

7
Presentation Map
Key Outcomes and Information to be Delivered• Primary questions to be answered• Datasets and tools to be delivered
The Eight County Freight Study
Next Steps
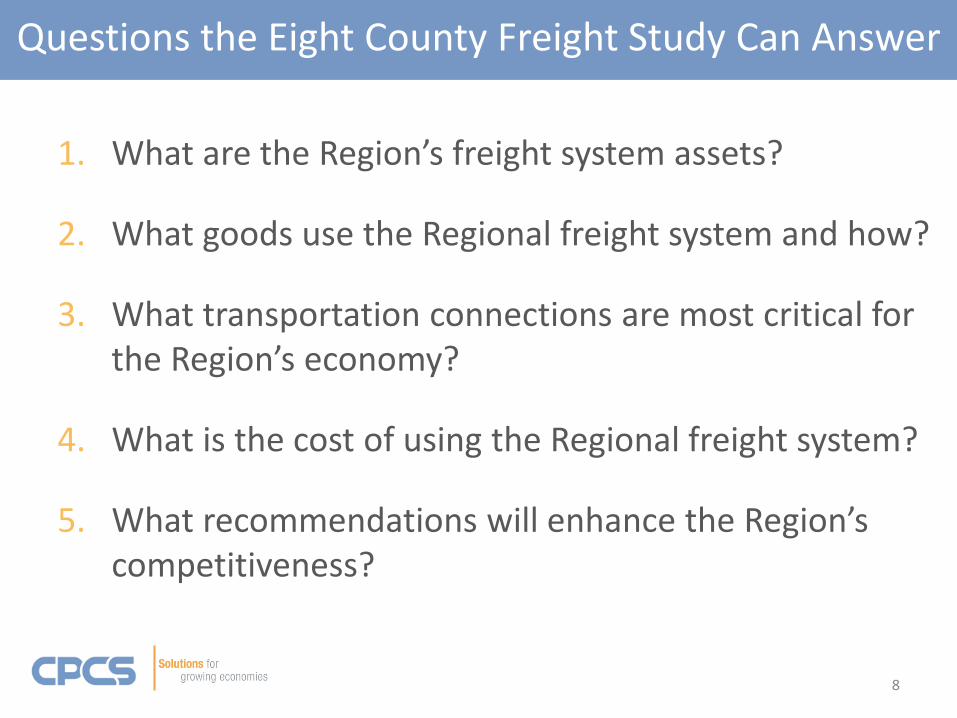
1. What are the Region’s freight system assets?
2. What goods use the Regional freight system and how?
3. What transportation connections are most critical for the Region’s economy?
4. What is the cost of using the Regional freight system?
5. What recommendations will enhance the Region’s competitiveness?
Questions the Eight County Freight Study Can Answer
8

What are the Region’s freight system assets?
Why is this question important?• This is the backbone of your Regional economy.
– Key industries– Key facilities– Physical system
Key Question 1
9
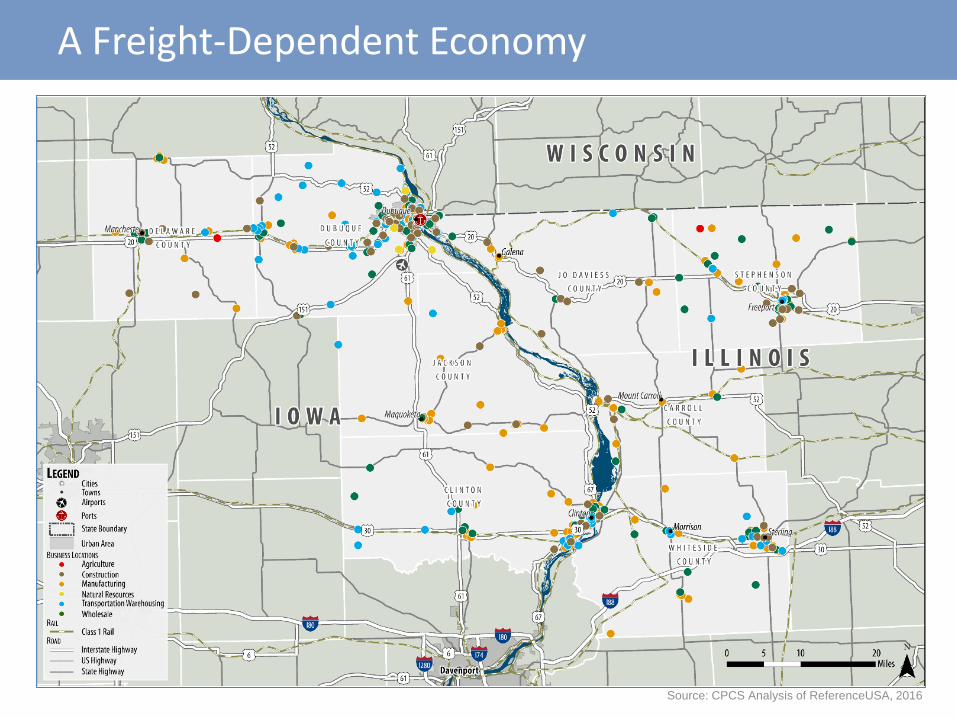
A Freight-Dependent Economy
Source: CPCS Analysis of ReferenceUSA, 2016
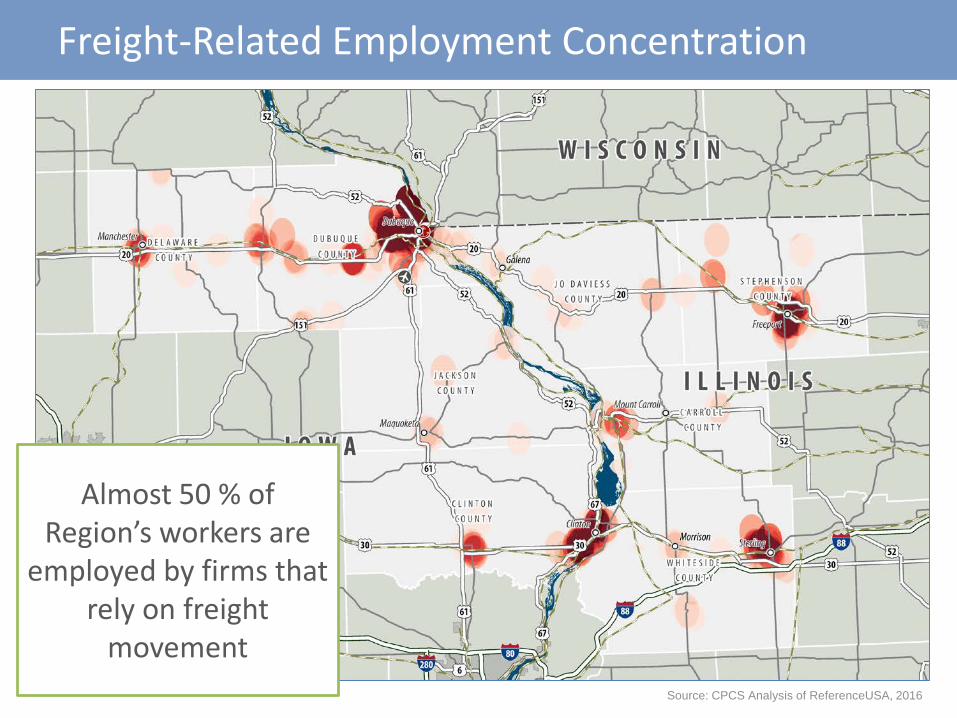
Freight-Related Employment Concentration
Almost 50 % of Region’s workers are
employed by firms that rely on freight
movementSource: CPCS Analysis of ReferenceUSA, 2016

NAICSFirms with
20-49 Employees
Firms with50-99
Employees
Firms with 100+
Employees
(11) Agriculture, Forestry, Fishing, and Hunting 3 2 1
(21) Mining, Quarrying, Oil and Gas Extraction 5 2 2
(22) Utilities 5 0 5
(23) Construction 87 12 24
(31-33) Manufacturing 144 49 92
(42) Wholesale Trade 69 24 117
(44-45) Retail Trade 191 44 52
(48-49) Transportation and Warehousing 81 16 10
Freight-Related Employment
Source: CPCS Analysis of ReferenceUSA, 2016
12

What the Region does Better (Location Quotient)
Industry
Carr
oll
Clin
ton
Del
awar
e
Dub
uque
Jack
son
Jo D
avie
ss
Step
hens
on
Whi
tesi
de
(11) Agriculture ND ND 1.58 ND 1.97 ND 2.66 ND
(21) Mining, Quarrying, Oil and Gas Extraction ND ND NC ND NC ND NC ND
(22) Utilities ND 1.11 ND 0.66 ND ND ND 0.33
(23) Construction 0.9 0.9 1.25 0.86 0.97 1.3 1.36 0.6
(31-33) Manufacturing 2.13 2.28 3.18 1.68 1.65 1.6 2.3 2.02
(42) Wholesale trade 2.15 0.5 1.9 1.16 1.33 ND 0.67 0.96
(44-45) Retail trade 1.24 0.98 0.95 0.98 1.35 1.14 0.89 1.16
(48-49) Transportation, Warehousing ND ND ND 2.07 1.17 ND 1.06 ND
Source: CPCS Analysis of Bureau of Labor Statistics, 2015ND indicates that a quotient is not disclosable, and NC indicates quotients that could not be calculated.
13

Multimodal Freight Transportation System
The Region’s transportation assets are aligned for the efficient
movement of bulk goods.
31 specific facilities available that can transfer
goods between modes
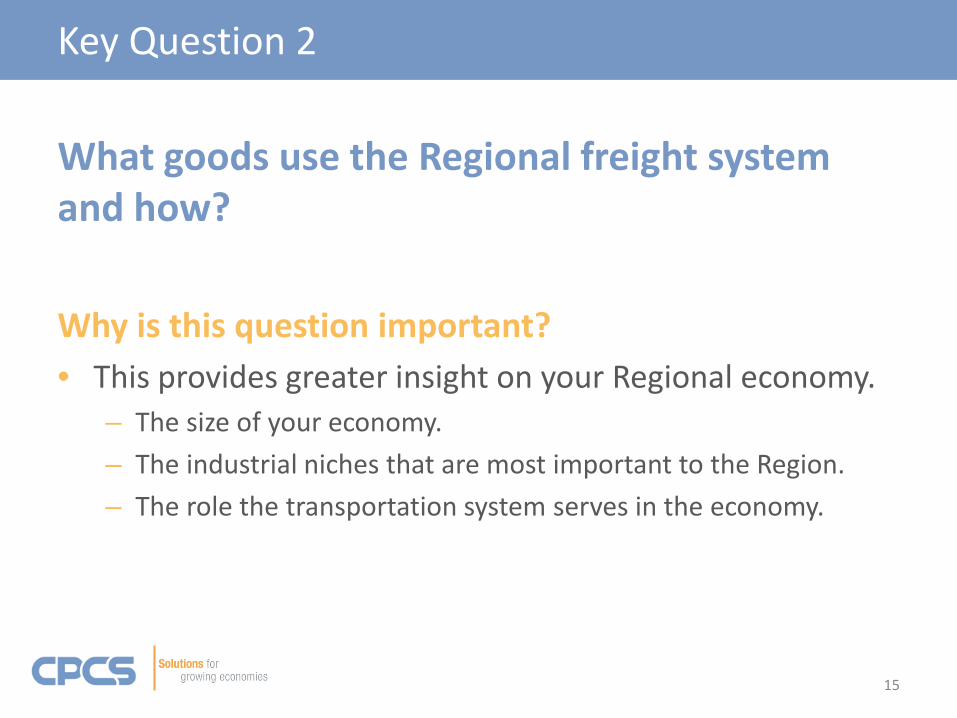
What goods use the Regional freight system and how?
Why is this question important?• This provides greater insight on your Regional economy.
– The size of your economy.– The industrial niches that are most important to the Region.– The role the transportation system serves in the economy.
Key Question 2
15
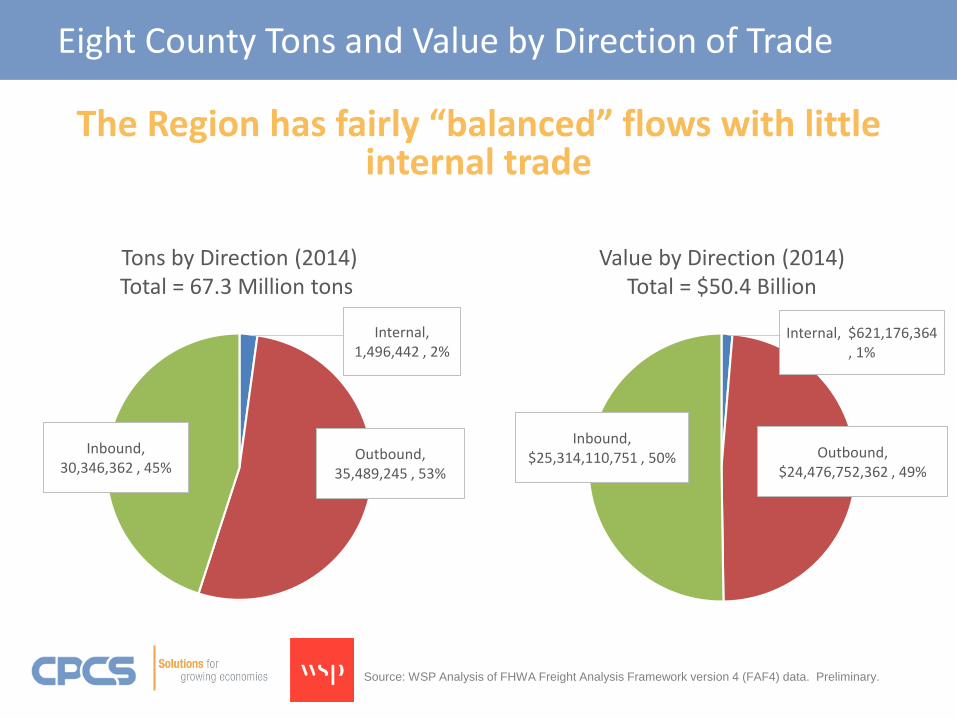
Eight County Tons and Value by Direction of Trade
Internal, 1,496,442 , 2%
Outbound, 35,489,245 , 53%
Inbound, 30,346,362 , 45%
Internal, $621,176,364 , 1%
Outbound, $24,476,752,362 , 49%
Inbound, $25,314,110,751 , 50%
Tons by Direction (2014)Total = 67.3 Million tons
Value by Direction (2014)Total = $50.4 Billion
The Region has fairly “balanced” flows with little internal trade
Source: WSP Analysis of FHWA Freight Analysis Framework version 4 (FAF4) data. Preliminary.

Eight County Tons and Value by Mode
Truck- 49.3 million
Rail- 15.5 million (23%)
Water- 0.7 million (1%)
Multiple Modes-1.8 million (3%)
Truck-$41.2 billion
Rail-$3.4 billion
Water-$0.7 billion
Multiple Modes- $5.1
Tons by Mode (2014)Total = 67.3 Million tons
Value by Mode (2014)Total = $50.4 Billion
Source: WSP Analysis of FHWA Freight Analysis Framework version 4 (FAF4) data. Preliminary.
Trucks represent 73% of tonnage and 82% of value, indicating trucks are used to carry higher-value, lower
weight manufactured goods

Eight County Tons and Value by Commodity
Cereal grains 18%
Fertilizers 17%
Gravel15%
Other ag prods.
Coal5%
Nonmetal min. prods. 5%
Other foodstuffs4%
Animal feed 4%
Waste/scrap 2%
Gasoline 2%
All Other21%
Machinery 8%
Unknown/Mixed 8%
Motorized vehicles 7%
Other ag prods. 6%
Other foodstuffs 6%
Cereal grains 5%
Plastics/rubber 5%
Fertilizers 5%Electronics 4%
Pharmaceuticals4%
All Other42%
Tons by Commodity (2014)Total = 67.3 Million tons
Value by Commodity (2014)Total = $50.4 Billion
Top tonnage and value commodities are linked to the Region’s key industries – manufacturing and agriculture
Source: WSP Analysis of FHWA Freight Analysis Framework version 4 (FAF4) data. Preliminary.

What transportation connections are most critical for the Region’s economy?
Why is this question important?• This articulates the connections critical to your Regional
economy.– Other regions– Trade lanes– Modes used
Key Question 3
19

Eight County Proximity

21
Trip Ends by Analysis Zone
Source: ATRI FPM Program, American Transportation Research Institute, 2017
22
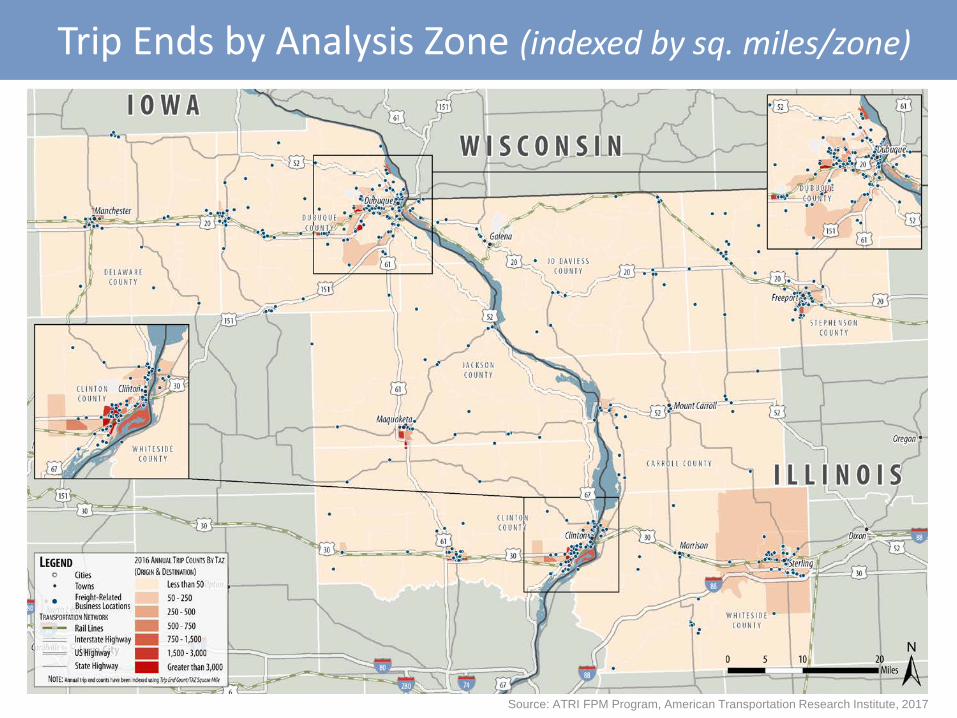
Trip Ends by Analysis Zone (indexed by sq. miles/zone)
Source: ATRI FPM Program, American Transportation Research Institute, 2017

23
Within a 1-day truck drive from the Region…
Source: ATRI FPM Program, American Transportation Research Institute, 2017

Within a 2-day truck drive from the Region…
24Source: ATRI FPM Program, American Transportation Research Institute, 2017

25
Within a 3-day truck drive from the Region…
Source: ATRI FPM Program, American Transportation Research Institute, 2017
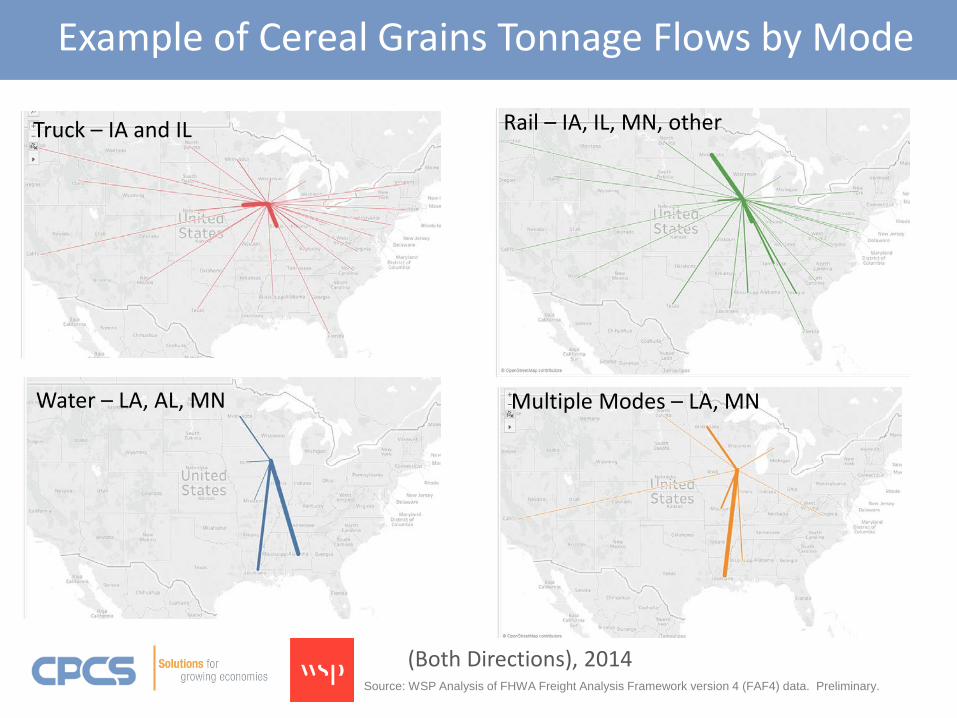
Example of Cereal Grains Tonnage Flows by Mode
(Both Directions), 2014
Truck – IA and IL
Water – LA, AL, MN
Rail – IA, IL, MN, other
Multiple Modes – LA, MN
Source: WSP Analysis of FHWA Freight Analysis Framework version 4 (FAF4) data. Preliminary.

What is the cost of using the Regional freight system?
Why is this question important?• This informs the competiveness of the services provided
in the Region.
Key Question 4
27
28
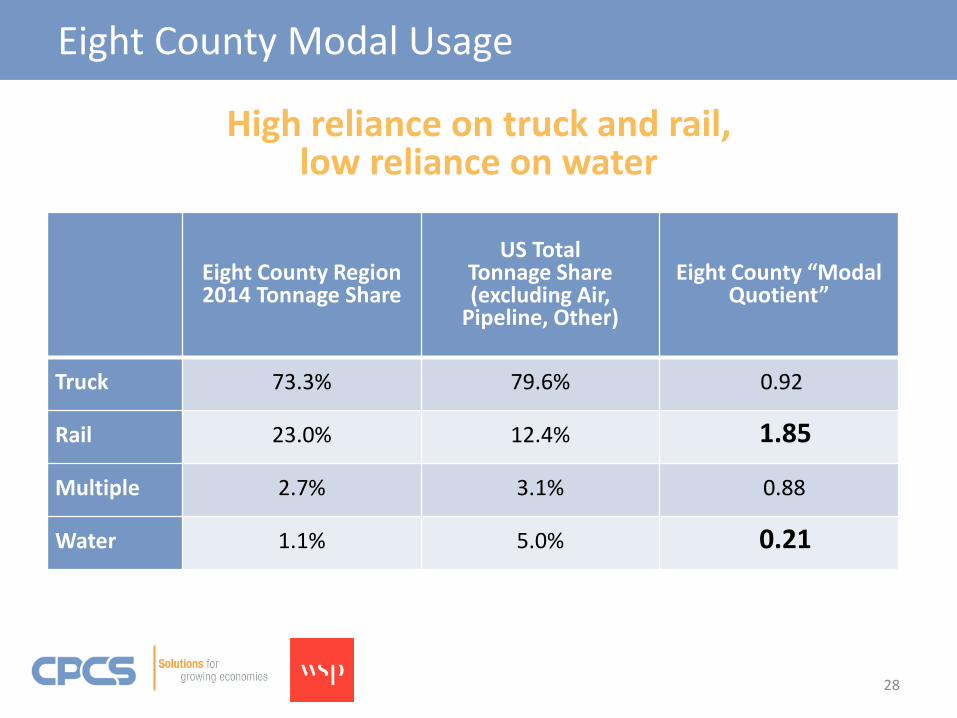
Eight County Modal Usage
Eight County Region 2014 Tonnage Share
US TotalTonnage Share (excluding Air,
Pipeline, Other)
Eight County “Modal Quotient”
Truck 73.3% 79.6% 0.92
Rail 23.0% 12.4% 1.85
Multiple 2.7% 3.1% 0.88
Water 1.1% 5.0% 0.21
High reliance on truck and rail, low reliance on water

29
Transportation Cost Results
The Eight County Region “freight bill” can be estimated at roughly $2 billion per year
Rate per Ton-Mile Ton-Miles, 2014 Estimated Transportation Cost
Truck $ 0.108 13,056,538,943 $ 1,410,106,206
Rail $ 0.083 6,159,485,019 $ 511,237,257
Multiple $ 0.097 1,012,159,822 $ 98,179,503
Water $ 0.050 385,064,490 $ 19,253,224
Total $ 2,038,776,190

What recommendations will enhance the Region’s competitiveness?
Why is this question important?• A freight plan goal is to increase freight system safety,
speed, reliability, and modal availability, and to decreasecost.
Key Question 5
30

Freight System Needs Assessment
31

32
Safety: Truck Crashes per Mile

33
Safety: The Cost of Crashes in the Region
Code Definition Associated Cost
K Fatality $4,008,900
A Disabling Injury – Hospitalization required $216,000
B Evident Injury – Scrapes and bruises, no hospitalization required. “Can walk away.” $79,000
C Possible Injury – No visible injury, but complaints of pain $44,900
O Property Damage Only $7,400
KABCO codes are assigned to crashes based on maximum level of injury.
Source: Highway Safety Manual, First Edition, Draft 3.1. April 2009.

34
Safety: Areas of Greatest Truck Crash Cost/Severity
Note: Map shows crashes per segment, not per mile
35
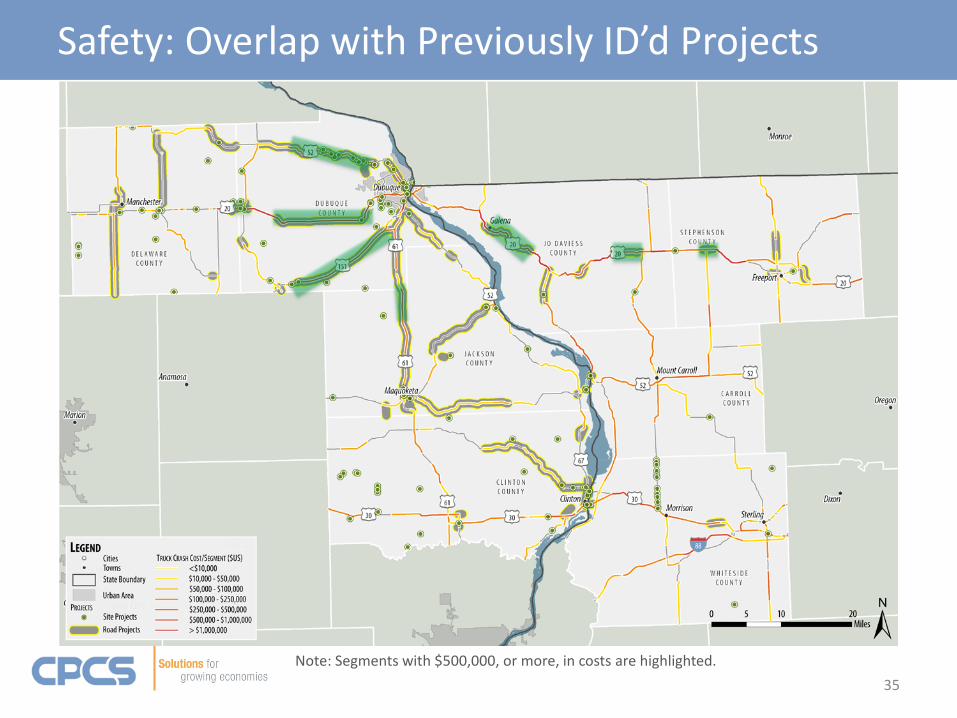
Safety: Overlap with Previously ID’d Projects
Note: Segments with $500,000, or more, in costs are highlighted.
36
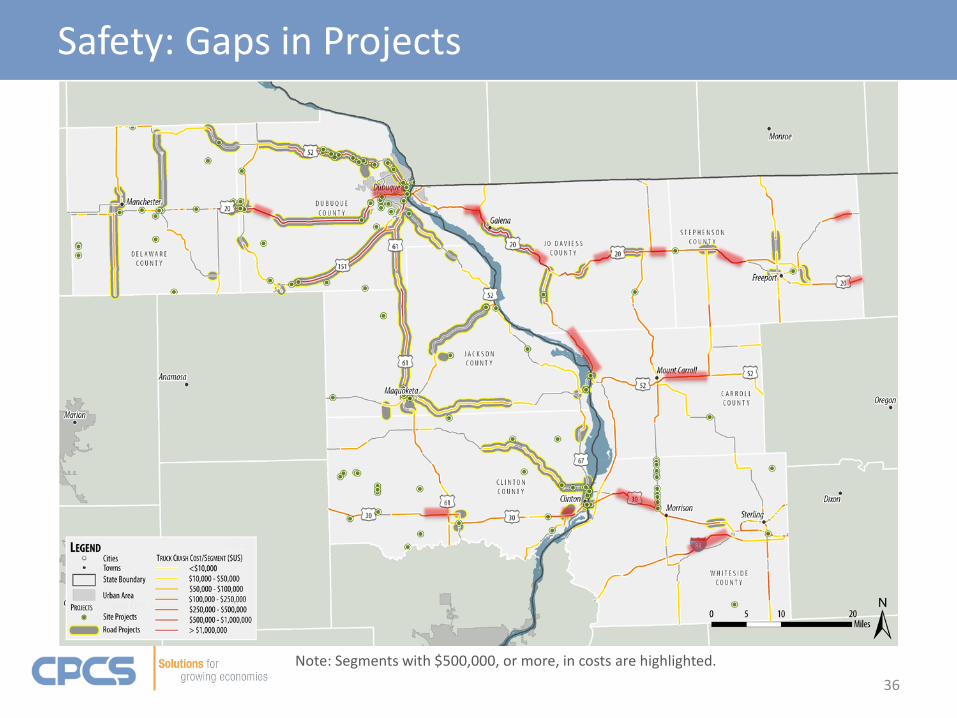
Safety: Gaps in Projects
Note: Segments with $500,000, or more, in costs are highlighted.
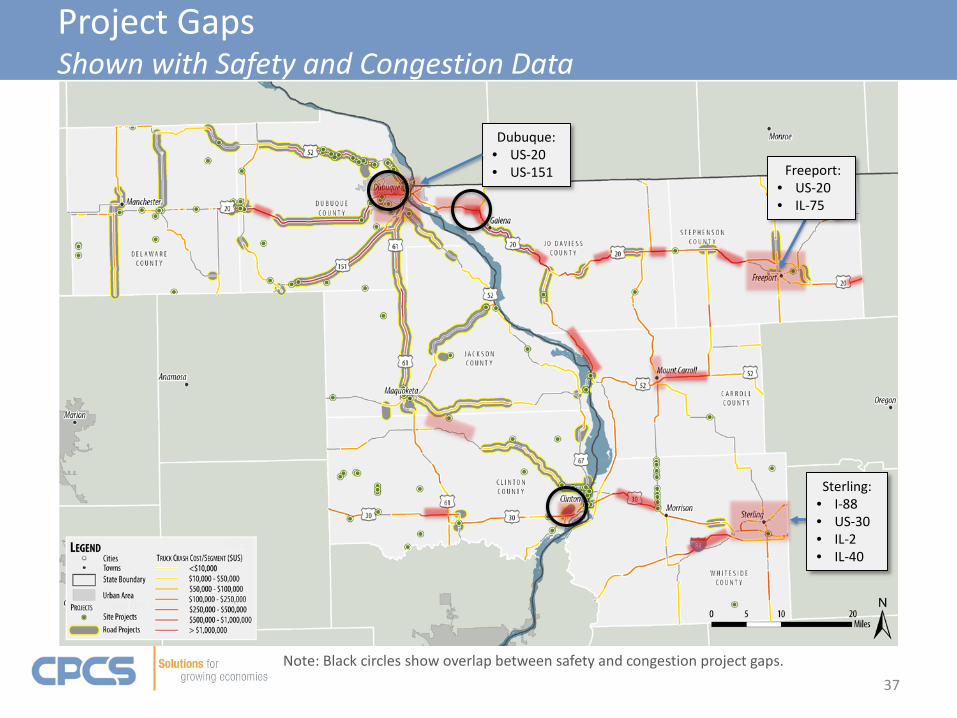
37
Project GapsShown with Safety and Congestion Data
Dubuque:• US-20• US-151 Freeport:
• US-20• IL-75
Sterling:• I-88• US-30• IL-2• IL-40
Note: Black circles show overlap between safety and congestion project gaps.
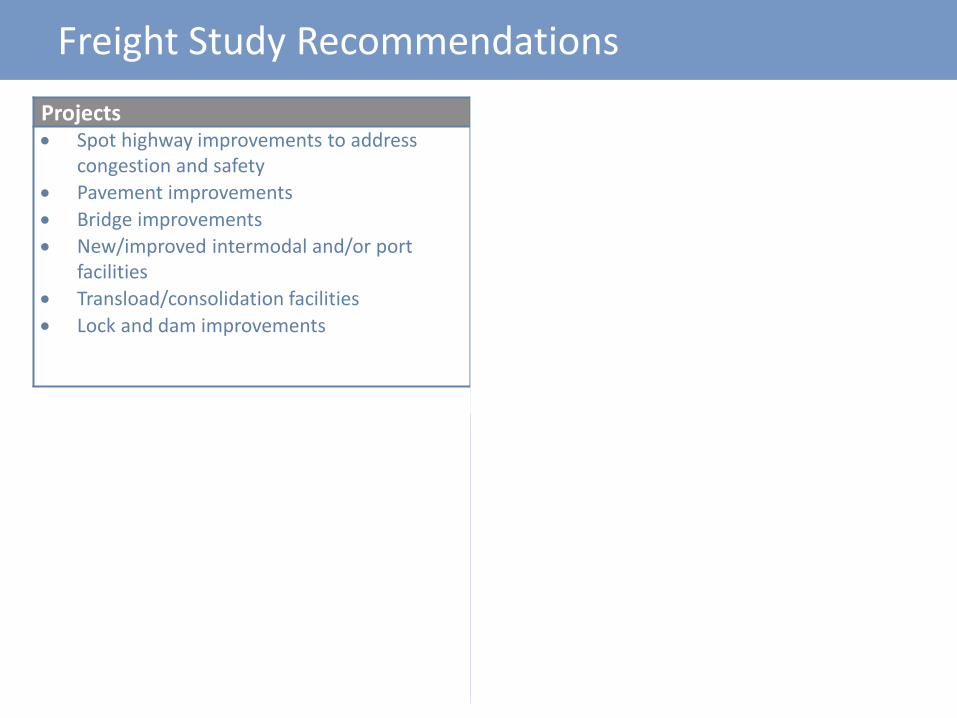
Freight Study RecommendationsProjects Programs• Spot highway improvements to address
congestion and safety• Pavement improvements• Bridge improvements• New/improved intermodal and/or port
facilities• Transload/consolidation facilities• Lock and dam improvements
• Programs focused on highway and railway safety
• Programs focused on enhancing skills of local workforce
• Programs focused on technology applications to the (freight) transportation system
• Freight planning program to monitor needs, issues and progress
Policies Partnerships• Truck regulation harmonization between
Iowa and Illinois• Illinois seasonal exemption for agricultural
loads (up to 90,000lbs).• Truck route guidance
• State, county and local public agency partnerships
• Federal transportation agencies, including USDOT and the USACE
• Regional and local economic development agencies
• Class I and short line railroads• Airports• Water ports• Other local private industry/businesses,
39
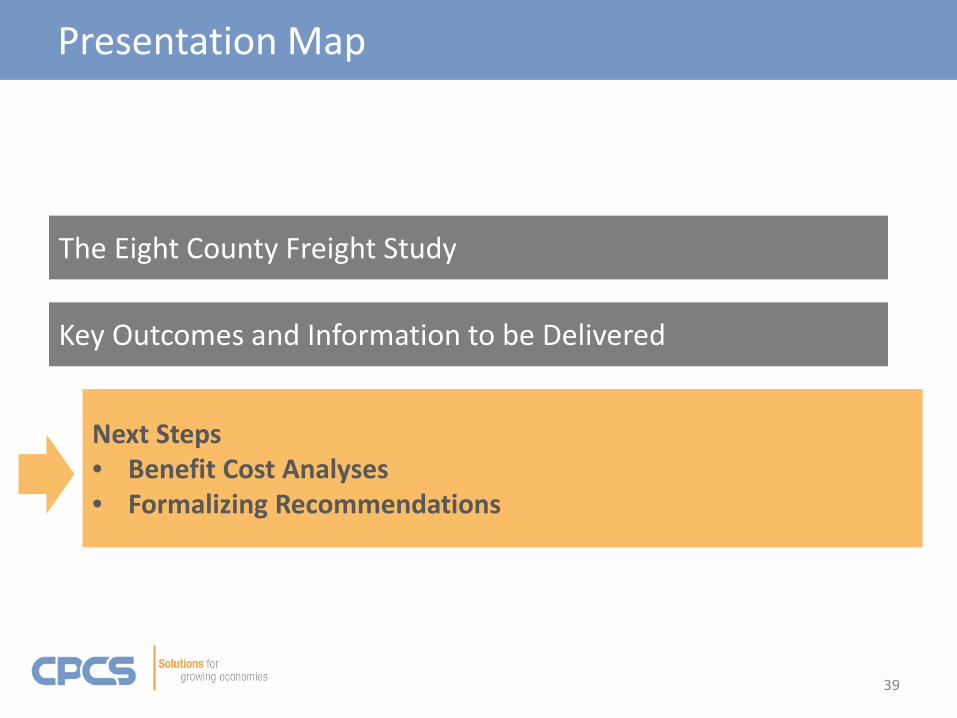
Presentation Map
Next Steps • Benefit Cost Analyses• Formalizing Recommendations
Key Outcomes and Information to be Delivered
The Eight County Freight Study

• Formalize list of project recommendations• Conduct benefit-cost analysis on select project
types• Coordinate with public and private sector
stakeholders to vet and validate full slate of strategic recommendations
• Develop final Eight County Freight Study and tools
Next Steps
40

Evaluate 3 Projects using BCA model from recent TIGER/INFRA grant solicitation • Road – safety improvements to US 20• Water – high-value, oversized manufactured
goods port development• Rail – Improved rail link to Cedar Rapids facility?
Feed results into state plans and state/federal grant programs
Benefit-Cost Analyses
43
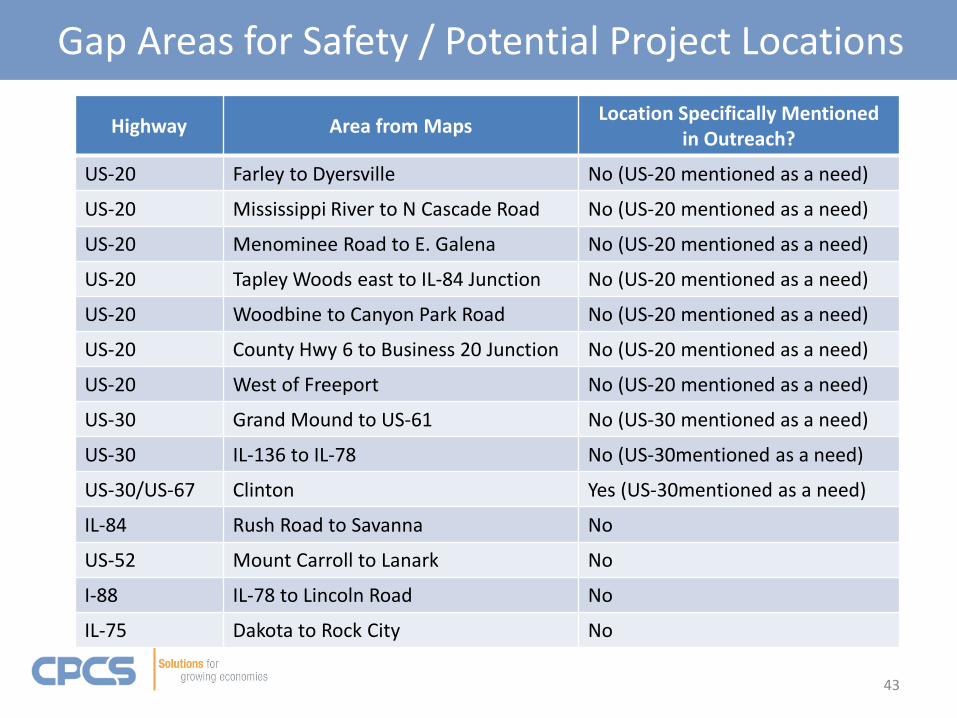
Gap Areas for Safety / Potential Project Locations
Highway Area from Maps Location Specifically Mentionedin Outreach?
US-20 Farley to Dyersville No (US-20 mentioned as a need)
US-20 Mississippi River to N Cascade Road No (US-20 mentioned as a need)
US-20 Menominee Road to E. Galena No (US-20 mentioned as a need)
US-20 Tapley Woods east to IL-84 Junction No (US-20 mentioned as a need)
US-20 Woodbine to Canyon Park Road No (US-20 mentioned as a need)
US-20 County Hwy 6 to Business 20 Junction No (US-20 mentioned as a need)
US-20 West of Freeport No (US-20 mentioned as a need)
US-30 Grand Mound to US-61 No (US-30 mentioned as a need)
US-30 IL-136 to IL-78 No (US-30mentioned as a need)
US-30/US-67 Clinton Yes (US-30mentioned as a need)
IL-84 Rush Road to Savanna No
US-52 Mount Carroll to Lanark No
I-88 IL-78 to Lincoln Road No
IL-75 Dakota to Rock City No

• Between 2010 and 2015:– US 20 had 2,534 crashes in total. 44% in Illinois, 56% in Iowa.– 324 (13%) of these crashes were truck-involved.– 160 (49%) of truck-involved crashes occurred in Illinois. 164
in Iowa.
44
Count of US 20 Crashes
0
5
10
15
20
25
30
35
40
2010 2011 2012 2013 2014 2015
Truc
k-In
volv
ed C
rash
es P
er Y
ear
Illinois Iowa
0
50
100
150
200
250
300
2010 2011 2012 2013 2014 2015
Tota
l Cra
shes
per
Yea
r
Illinois Iowa

45
Cost of US 20 Crashes
$0
$1,000,000
$2,000,000
$3,000,000
$4,000,000
$5,000,000
$6,000,000
$7,000,000
$8,000,000
$9,000,000
$10,000,000
2010 2011 2012 2013 2014 2015
Annu
al T
ruck
-Invo
lved
Cra
sh C
ost
Illinois Iowa
• Between 2010 and 2015:– US 20 total crash cost exceeded $148.5 million. 75% in IL,
25% in IA. – Truck involved crashes cost $31.8 million (21%).– Illinois had 73% of truck crash costs ($23m).
$-
$2,000,000
$4,000,000
$6,000,000
$8,000,000
$10,000,000
$12,000,000
$14,000,000
$16,000,000
$18,000,000
$20,000,000
2010 2011 2012 2013 2014 2015
Annu
al T
otal
Cra
sh C
ost
Illinois Iowa
46
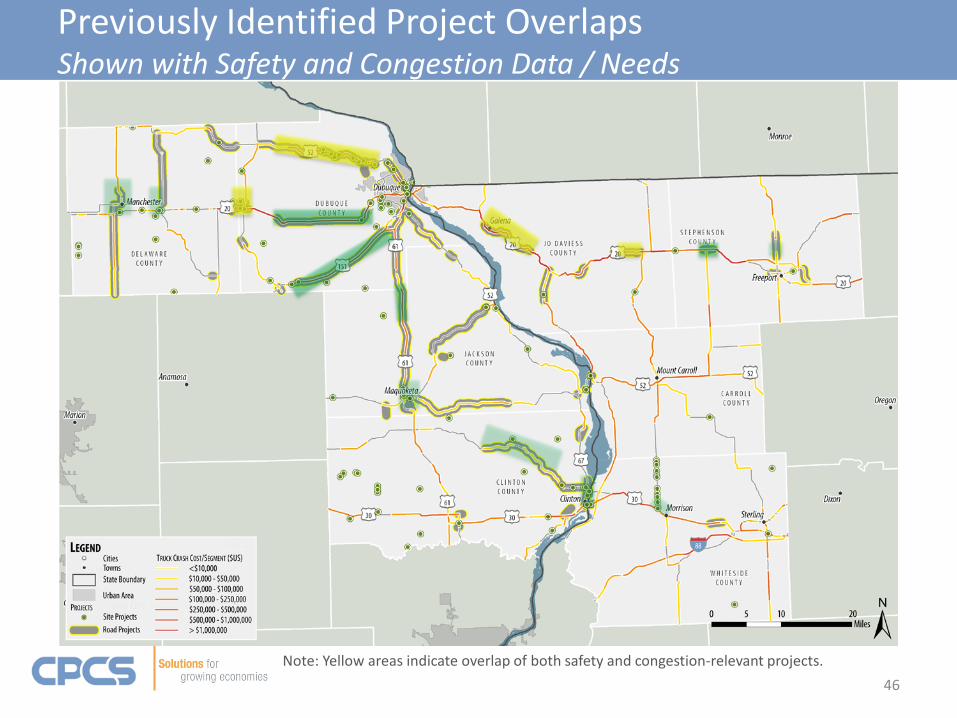
Previously Identified Project OverlapsShown with Safety and Congestion Data / Needs
Note: Yellow areas indicate overlap of both safety and congestion-relevant projects.
• Information Gathering– EDC stakeholder meetings– Consultant team one-on-ones– Survey Monkey online questionnaire– Steering Committee feedback
47
Stakeholder Insights
Stakeholder insights (qualitative data) will be compared against the performance assessment
(quantitative data)
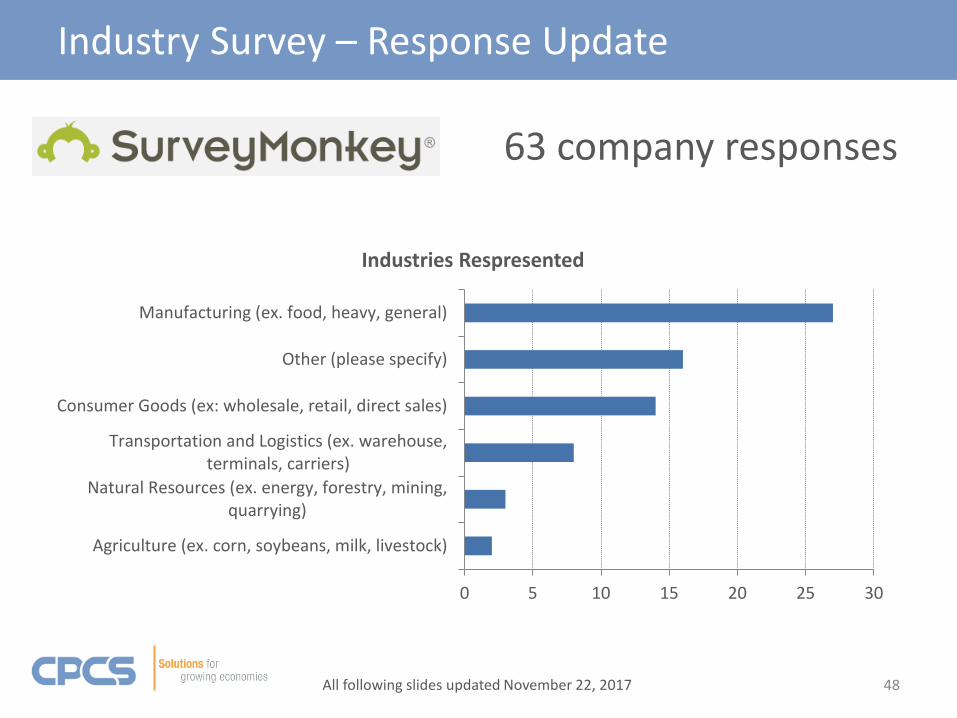
63 company responses
48
Industry Survey – Response Update
All following slides updated November 22, 2017
Agriculture (ex. corn, soybeans, milk, livestock)
Natural Resources (ex. energy, forestry, mining,quarrying)
Transportation and Logistics (ex. warehouse,terminals, carriers)
Consumer Goods (ex: wholesale, retail, direct sales)
Other (please specify)
Manufacturing (ex. food, heavy, general)
0 5 10 15 20 25 30
Industries Respresented

Industry Survey – Transportation System Performance
Cost
Access to modes/competitive services
Other infrastructure issues (bridge weight limits,…
Safety
Congestion
Regulatory Issues (delivery restrictions, truck…
Geometric issues (turn lanes, lane drops, clearance…
Other (please specify)
Truck Parking
0 5 10 15 20 25 30 35 40 45
"Top 3" Transportation Issues in Eight County Region
49
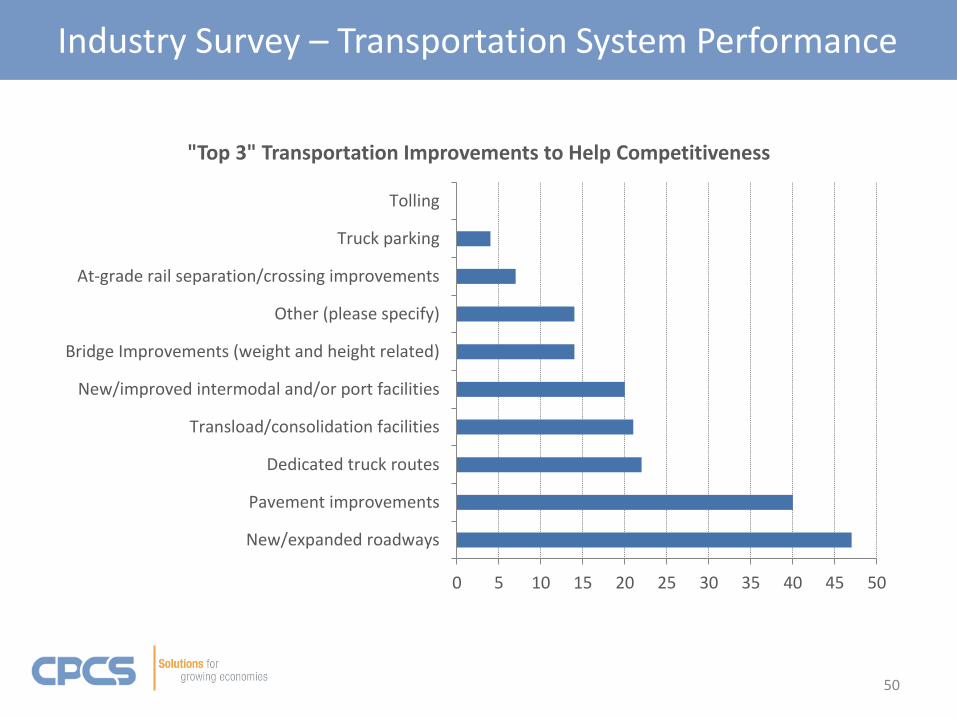
Industry Survey – Transportation System Performance
New/expanded roadways
Pavement improvements
Dedicated truck routes
Transload/consolidation facilities
New/improved intermodal and/or port facilities
Bridge Improvements (weight and height related)
Other (please specify)
At-grade rail separation/crossing improvements
Truck parking
Tolling
0 5 10 15 20 25 30 35 40 45 50
"Top 3" Transportation Improvements to Help Competitiveness
50
What do we learn?• Benefits of freight improvements
– Improvements in supply chain performance -- cost, speed, reliability, etc. – compared to without-project conditions
– Performance and cost data to help define/fine-tune projects– Support discretionary grant applications
• Benefit-cost analysis typically does not include economic impact evaluation (jobs, wages, taxes, etc.) or neutral “transfers” of benefits across regions or facilities
About Benefit-Cost Analysis
51
Recent USDOT guidance for INFRA and TIGER• Costs and monetized benefits calculated annually over long-
term (20-30 years) and discounted to present value at 7% and 3%; BCR is the ratio of discounted benefits to discounted costs
• Primary benefit categories1. State of good repair (pavement damage, etc.)2. Economic competitiveness (transportation cost, land value)3. Livability (congestion reduction, etc.)4. Sustainability (emissions reduction, etc.)5. Safety (crash reduction, etc.)
• New provisions– Reduced value for modal diversion projects– No recommended federal value for marginal social cost of carbon– Increased rigor in modeling congestion and safety improvements
Benefit Cost Analysis Guidance
52