E/ICEF/2016/AB/L.6 Economic and Social Council...E/ICEF/2016/AB/L.6 16-12351 3/15 Introduction 1. A...
15
United Nations E/ICEF/2016/AB/L.6 Economic and Social Council Distr.: Limited 18 July 2016 Original: English For decision 16-12351 (E) 050816 *1612351* United Nations Children’s Fund Executive Board Second regular session 2016 14-16 September 2016 Item 11 of the provisional agenda* UNICEF Strategic Plan: updated financial estimates, 2016-2019 Summary A four -year financial framework forms part of the UNICEF Strategic Plan, which is presented, usually for a period of four years, in accordance with Executive Board decisions 2000/3 and 2013/20. The financial plan is reviewed and revised annually on a rolling basis. The current Strategic Plan covers the period 2014-2017. Total revenue is forecast to be $4.8 billion in 2016, a decline of 3 per cent from 2015. Revenue is projected to decrease a further 1 per cent in 2017 compared with 2016. In 2018 and 2019, revenue is expected to resume gradual growth. Total expenditures in 2016 are estimated at $5.2 billion, exceeding forecast revenue by $357 million. The deficit will be financed from cash balances. The planned expenditures will reduce cash balances, but UNICEF will continue to meet a prudent liquidity requirement. This financial framework of revenue and expenditure estimates provides a basis for determining the level of regular resources programme submissions to be approved in 2017. Allocations of regular resources for country programmes during the period under review will be managed through the modified system for allocation of regular resources for programmes, as revised by the Executive Board in its decisions 2008/15 and 2013/20. UNICEF recommends that the Executive Board approve the framework of planned financial estimates for the period 2016 -2019 and approve the preparation of programme expenditure submissions to the Executive Board of up to $1,465 million from regular resources in 2017, subject to the availability of resources and the continued validity of these planned financial estimates. A draft decision is included in section III. * E/ICEF/2016/13.
Transcript of E/ICEF/2016/AB/L.6 Economic and Social Council...E/ICEF/2016/AB/L.6 16-12351 3/15 Introduction 1. A...

United Nations E/ICEF/2016/AB/L.6
Economic and Social Council Distr.: Limited
18 July 2016
Original: English
For decision
16-12351 (E) 050816
*1612351*
United Nations Children’s Fund Executive Board
Second regular session 2016
14-16 September 2016
Item 11 of the provisional agenda*
UNICEF Strategic Plan: updated financial estimates, 2016-2019
Summary
A four-year financial framework forms part of the UNICEF Strategic Plan,
which is presented, usually for a period of four years, in accordance with Executive
Board decisions 2000/3 and 2013/20. The financial plan is reviewed and revised
annually on a rolling basis. The current Strategic Plan covers the period 2 014-2017.
Total revenue is forecast to be $4.8 billion in 2016, a decline of 3 per cent from
2015. Revenue is projected to decrease a further 1 per cent in 2017 compared with
2016. In 2018 and 2019, revenue is expected to resume gradual growth. Total
expenditures in 2016 are estimated at $5.2 billion, exceeding forecast revenue by
$357 million. The deficit will be financed from cash balances. The planned
expenditures will reduce cash balances, but UNICEF will continue to meet a prudent
liquidity requirement.
This financial framework of revenue and expenditure estimates provides a basis
for determining the level of regular resources programme submissions to be
approved in 2017. Allocations of regular resources for country programmes during
the period under review will be managed through the modified system for allocation
of regular resources for programmes, as revised by the Executive Board in its
decisions 2008/15 and 2013/20.
UNICEF recommends that the Executive Board approve the framework of
planned financial estimates for the period 2016-2019 and approve the preparation of
programme expenditure submissions to the Executive Board of up to $1,465 million
from regular resources in 2017, subject to the availability of resources and the
continued validity of these planned financial estimates. A draft decision is included
in section III.
* E/ICEF/2016/13.

E/ICEF/2016/AB/L.6
16-12351 2/15
Contents Page
Introduction . . . . . . . . . . . . . . . . . . . . . . . . . . . . . . . . . . . . . . . . . . . . . . . . . . . . . . . . . . . . . . . . . . . 3
I. Financial review, 2015 . . . . . . . . . . . . . . . . . . . . . . . . . . . . . . . . . . . . . . . . . . . . . . . . . . . . . . . . . . 3
A. Revenue . . . . . . . . . . . . . . . . . . . . . . . . . . . . . . . . . . . . . . . . . . . . . . . . . . . . . . . . . . . . . . . . . . 3
B. Expenditure . . . . . . . . . . . . . . . . . . . . . . . . . . . . . . . . . . . . . . . . . . . . . . . . . . . . . . . . . . . . . . . 4
C. Trust funds . . . . . . . . . . . . . . . . . . . . . . . . . . . . . . . . . . . . . . . . . . . . . . . . . . . . . . . . . . . . . . . . 4
D. Reserves and liquidity . . . . . . . . . . . . . . . . . . . . . . . . . . . . . . . . . . . . . . . . . . . . . . . . . . . . . . 4
II. Planned financial estimates for 2016-2019 . . . . . . . . . . . . . . . . . . . . . . . . . . . . . . . . . . . . . . . . . . 5
A. Revenue . . . . . . . . . . . . . . . . . . . . . . . . . . . . . . . . . . . . . . . . . . . . . . . . . . . . . . . . . . . . . . . . . . 5
B. Expenditure . . . . . . . . . . . . . . . . . . . . . . . . . . . . . . . . . . . . . . . . . . . . . . . . . . . . . . . . . . . . . . . 6
C. Funded reserves . . . . . . . . . . . . . . . . . . . . . . . . . . . . . . . . . . . . . . . . . . . . . . . . . . . . . . . . . . . . 7
D. Cash balance . . . . . . . . . . . . . . . . . . . . . . . . . . . . . . . . . . . . . . . . . . . . . . . . . . . . . . . . . . . . . . 8
III. Draft decision . . . . . . . . . . . . . . . . . . . . . . . . . . . . . . . . . . . . . . . . . . . . . . . . . . . . . . . . . . . . . . . . . 8
Annex
Planned financial estimates tables . . . . . . . . . . . . . . . . . . . . . . . . . . . . . . . . . . . . . . . . . . . . . . . . . 9
E/ICEF/2016/AB/L.6
3/15 16-12351
Introduction
1. A four-year financial plan forms part of the UNICEF Strategic Plan in
accordance with Executive Board decisions 2000/3 and 2013/20 and is reviewed and
revised annually on a rolling basis.
2. The financial plan is preceded by a review of the financial performance of
UNICEF in the previous year, with highlights of the financial trends that evolved
during a recent multi-year period. The purpose of the review is to provide key high -
level information on revenue, expenditure and liquidity as a baseline to the fi nancial
plan.
I. Financial review, 2015
A. Revenue
3. Total revenue decreased by 3 per cent in 2015, to $5,010 million, which to a
large extent was impacted by volatility in the currency markets. The strengthening
United States dollar had a negative impact on the absolute levels of revenue
recorded on non-United States-dollar-based contributions. In 2015, due to the
stronger United States dollar, the impact on private-sector contributions was
approximately 15 per cent less United States dollar revenue recorded. The main
source of revenue continued to be voluntary contributions from Governments,
private organizations and individuals, which accounted for 98 per cent of total
revenue. The remaining 2 per cent of the revenue was generated by interest of $ 35
million, procurement services for partners of $42 million, miscellaneous activities
of $14 million and royalties and sales of greeting cards and products of $9 million.
4. Regular resources revenue (non-earmarked or “core” funds) in 2015 was $1.17
billion, a decrease of 11 per cent as compared with 2014 ($1.33 billion). Other
resources (regular) (earmarked funds) contributions were $2.06 billion and other
resources (emergency) were $1.78 billion. Increases in other resources (emergency)
funds of $200 million were offset by decreases in other resources (regular) of $210
million, bringing the overall level of other resources in line with 2014 levels.
E/ICEF/2016/AB/L.6
16-12351 4/15
5. The increase in other resources (emergency) revenue of 13 per cent over 2014
is attributed primarily to funding received for support to Syrian refugees and Ebola
response, as well as to Iraq, Nepal, South Sudan, the Syrian Arab Republic and
Yemen. Core resources accounted for 23 per cent of total revenue in 2015 compared
with 26 per cent in 2014.
6. In 2015, a total of 135 Governments contributed to UNICEF resources. Total
public-sector contributions (from Governments, intergovernmental organizations
and inter-organizational arrangements), at $3,455 million, were 29 per cent more
than planned, but 6 per cent less than in 2014. Private-sector contributions (from
National Committees, individual donors, non-governmental organizations and
foundations), at $1,457 million, were 12 per cent more than planned and 4 per cent
more than in 2014.
B. Expenditure
7. Total expenditures amounted to $5.2 billion in 2015, an increase of 5 per cent
over 2014. Programme and development effectiveness represented 91 per cent of
total UNICEF expenditure in 2015 compared with 90 per cent in 2014. Further
detailed analysis of 2015 financial performance is provided in chapter IV of the
UNICEF Financial Statements for 2015 as well as in the annual report of the
Executive Director of UNICEF, presented at the 2016 annual session of the
Executive Board.
C. Trust funds
8. Trust funds are established mainly for services carried out on behalf of
Governments and other organizations for the procurement of vaccines and other
commodities essential for the well-being of children.
9. Procurement services receipts tripled in the past ten years, from $593 million
in 2006 to $1,789 million in 2015. This increase reflects the evolving opportunities
that UNICEF has to shape the global market for vaccines and other child -related
products and to achieve savings for partners and UNICEF.
D. Reserves and liquidity
Cash held in reserves
10. Reserves in cash amounted to $499 million as at 31 December 2015, an
increase of 1.6 per cent over the balance of $467 million as at 31 December 2014.
They comprise reserves for procurement services, capital assets, after-service health
insurance (ASHI) and staff separation. The latter two reserves, ASHI and the staff
separation fund, accounted for 97 per cent of the total cash held in reserves.
Liquidity after reserves
11. The total available cash balance, excluding reserves, at the end of 2015 was
$2.48 billion: $560 million of regular resources and $1.92 billion of other resources.
E/ICEF/2016/AB/L.6
5/15 16-12351
12. Contributions for both other resources and trust funds are normally received
before implementation begins and are governed by multi-year agreements.
13. In 2015, UNICEF met the requirement of a prudent level of liquidity for
regular resources, defined as the equivalent of expenditure for three to six months,
or about $300 million to $600 million. This prudent guideline concurs with the
general practice of non-profit organizations, including the United Nations
community.
II. Planned financial estimates for the period 2016-2019
14. This section presents the projections of UNICEF financial resources for the
period 2016-2019. It comprises revenue and expenditure projections, and the
resulting cash balances for regular resources and other resources. Estimates for trust
funds are also included. In line with decision 2013/20, the presentation of the
planned financial estimates has been aligned with the format of the integrated
resource plan as presented in the UNICEF integrated budget for 2014 -2017 and
presents the planned use of resources grouped by the harmonized cost classification
categories.
15. The financial projections provide a financial framework for the yearly phasing
of estimated regular resources expenditure. In particular, it provides a financial
context for future programme submissions to be made to the Executive Board.
A. Revenue
16. The present financial plan has been developed during a period of economic
uncertainty. While children’s needs increase during periods of economic hardship,
the realities of fiscal austerity and high unemployment in some donor countries
dictate prudent financial projections. Despite the ongoing difficult economic
climate, UNICEF continues to be a partner of choice for donors.
17. Other resources revenue is projected to decline by 8 per cent in 2016
compared with 2015. In 2017, other resources revenue is estimated to decline b y
another 2 per cent. In 2018 and 2019 other resources revenue will start to slightly
increase year by year at a rate of 1 per cent. One of the main drivers for the other
resources revenue decline is related to other resources (emergency) revenue, which
is projected to decrease in 2016 by 26 per cent compared with 2015, despite the
increased humanitarian funding requirement of $3.3 billion by December 2015.
Revenue estimates are provided in table 1 (see annex).
18. The share of private contributions in UNICEF total revenue is expected to
increase in the medium term, from 29 per cent in 2015 to 34 per cent in 2019.
19. Regular resources revenue is targeted to increase by 11 per cent in 2016 by
focusing on growing revenue from pledge donors and expanding legacy funding.
20. Regular resources revenue is targeted to maintain a modest growth of between
1 and 2 per cent per year over the period 2017-2019, primarily resulting from
growth in private-sector fundraising. Estimates of regular resources revenue are
provided in table 1.
E/ICEF/2016/AB/L.6
16-12351 6/15
B. Expenditure
21. Despite the projected decline in total revenue in 2016, total expenditure is
expected to increase by 1 per cent compared with 2015. Smooth implementation of
ongoing programmes will be facilitated by financing the deficit with cash balances.
If, as forecasted, total revenue declines further in 2017, total expenditure will be
adjusted downward in 2017, but will still be higher than revenue.
22. As shown in table 2 (see annex), total estimated annual expenditure during the
planning period will exceed the projected annual revenue. The resulting deficit will
be funded from the balance accumulated in prior years, when actual revenue was
greater than planned.
Regular resources expenditure
23. The main components of estimated regular resources expenditure for the
period 2016-2019 are: (a) development activities comprising (i) programmes and
(ii) development effectiveness, and accounting for 77 per cent of the total use of
regular resources; (b) management activities accounting for 11 per cent; and
(c) special-purpose activities, including private-sector fundraising, accounting for
12 per cent.
Programmes
24. As noted in the review of revenue performance, overall regular resources to
UNICEF decreased by 11 per cent in 2015. Public-sector regular resources
contributions declined by 17 per cent, while private-sector regular resources
contributions declined by 7 per cent. Both are slightly offset by a 3 per cent increase
in other regular resources revenue. Contributions from both the public and private
sectors were negatively impacted by exchange -rate variations. Regular resources
and thematic funds directly support the achievement of programme results by
enabling longer-term planning and lowering transaction costs. It is critical for
UNICEF and its partners to redouble efforts to ensure a flexible and predictable
funding base.
25. If the conservative revenue projections under this plan are realized, UNICEF
intends to maintain the current 2016 annual allocation of regula r resources for
programme assistance of $935 million for the years between 2017 and 2019.
Allocations of regular resources to country programmes will be managed according
to the modified system for allocation, approved by the Executive Board in its
decisions 2008/15 and 2013/20, which favours countries in greatest need. Table 4
(see annex) indicates how regular resources expenditures on approved, new and
future proposals for programmes will be phased each year from 2016 through 2019.
26. At the beginning of 2016, regular resource expenditures for ongoing country
programmes were estimated at $1.79 billion. The amount of regular resources for
programmes proposed to the Executive Board for approval in 2016 totals $1.32
billion for programme cycles that start in 2017.
27. For 2017, the estimated amount of regular resources for programme proposals
to be approved by the Executive Board is $1.47 billion for programme cycles that
start in 2018. The level of planned programme expenditures will be continuously
reviewed and adjusted on the basis of updated information on projected revenue.
E/ICEF/2016/AB/L.6
7/15 16-12351
Institutional budget
28. At its second regular session of 2013, the Executive Board approved a four -
year institutional budget of $2.10 billion for the period 2014 -2017 to support the
UNICEF Strategic Plan, 2014-2017. A report on the midterm review of the
integrated budget, 2014-2017 was presented at the annual session of 2016 and
approved by the Executive Board to be maintained at the initially approved level of
$2.10 billion. The budget for development effectiveness, United Nations
development coordination, management and special purpose (capital investments)
costs is referred to as the institutional budget. It is funded from regular resources,
other resources and cost recovery.
Cost recovery
29. For the period 2014-2017, UNICEF has started to apply the new cost-recovery
methodology and rates as approved in decision 2013/5. In line with the approved
cost-recovery methodology, cost recovery from other resources will fund the
management and special purpose (capital investment) activities of the institutional
budget. The proposed use of cost recovery is reflected in table 5.
30. The institutional budget for the period 2014-2017, as originally approved in
2013, was estimated to be funded 55 per cent from regular resources, 39 per cent
from cost recovery and 6 per cent directly from other resources. In 2015, the actual
institutional budget funding split was 39 per cent from regular resources, 55 per
cent from cost recovery and 6 per cent from other resources. Actual cost recovery in
2015 was $257 million compared with a planned amount of $247 million. The
additional cost recovery was used to fund the institutional budget (“management”
and “special purpose – capital investment” cost-classification categories), reducing
the amount of regular resources used to fund the institutional budget, while
remaining within the overall approved institutional budget (see table 5, annex). This
trend is expected to continue for the remainder of the approved integrated budget
period (2016-2017) and into the period 2018-2019.
Other resources expenditure
31. The projections of programme assistance expenditure funded by other
resources, presented in table 5, reflect efforts to accelerate implementation. Actual
other resources expenditure in 2015 was $123 million higher than revenue, which is
an improvement compared with 2014, when actual other resources expenditure was
$188 million lower than revenue. Other resources expenditure in 2016 is projected
to be 8 per cent greater than other resources revenue, and this trend is expected to
accelerate further in the following years, with expenditure up to 11 per cent greater
than other resources revenue. The revenue-expenditure gap is financed from the
balance of other resources carried over from previous years.
C. Funded reserves
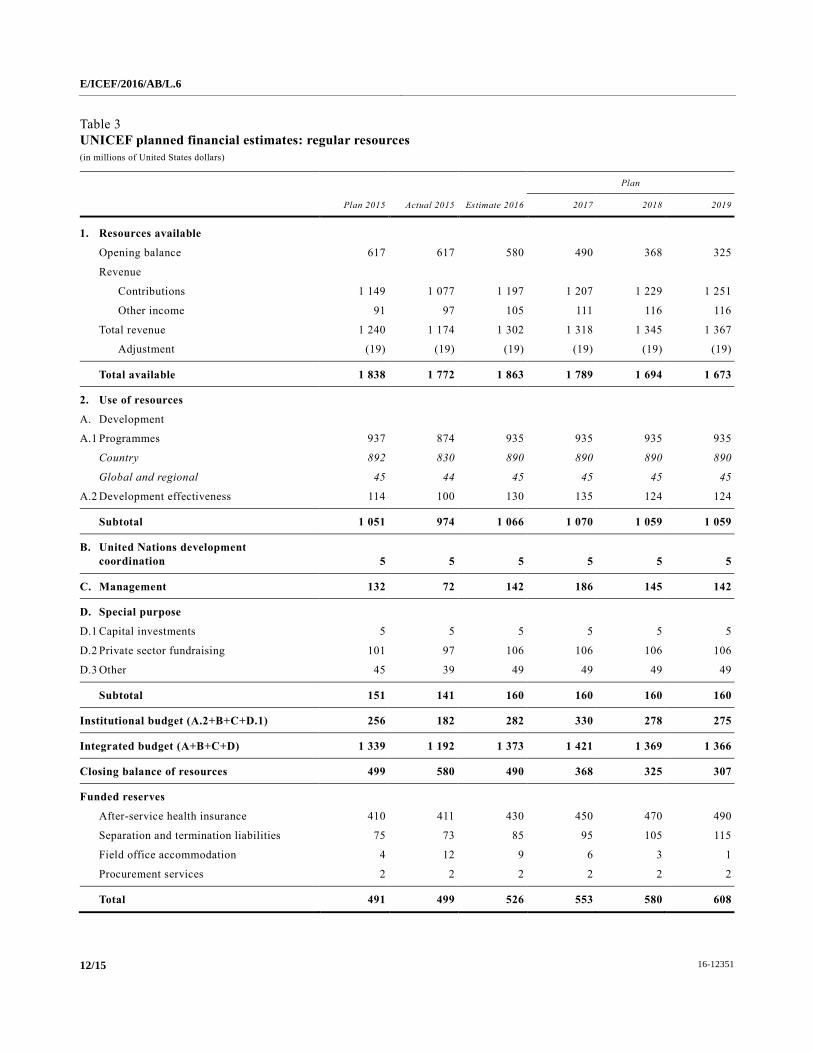
32. The two largest funded reserves are for post-service staff liabilities. These
reserves are: the separation fund for repatriation costs and accrued annual leave, and
the ASHI fund. The total amount of funding for these reserves is projected to
increase from $499 million in 2015 to $608 million in 2019, as shown in table 3
(see annex).
E/ICEF/2016/AB/L.6
16-12351 8/15
33. Following discussions with the Executive Board in recent years and with the
implementation of the International Public Sector Accounting Standards, which
require the full reporting of after-service staff liabilities in corporate financial
statements, UNICEF has developed and is implementing a robust funding strategy
for these liabilities. The strategy will ensure that, over time, the reserve for these
liabilities is accumulated from the funding sources to which post costs are correctly
attributed. UNICEF will continue to monitor the effectiveness of and make
appropriate adjustments to the strategy as financial variables change.
D. Cash balance
34. The regular resources cash balance at year end 2016 is projected to be $490
million, which is equivalent to four or five months of disbursements. The regular
resources cash balance is used as working capital to mitigate the liquidity risk
related to fluctuations in cash inflows. Unlike other resources, which are allocated
to programmes when cash is received from a donor, regular resources allocations for
country programmes are made in November for the following year, before regular
resources funds are received. It is therefore critical to have working capital to start
programme implementation while awaiting cash from donors. The best practice
among development organizations is to maintain working capital sufficient for three
to six months of expenditures. In the case of UNICEF, those levels would translate
to between $300 million and $600 million. The projected working capital falls
within that range, reaching $307 million by 2019, as indicated in table 3.
35. As part of the efforts to accelerate programme implementation, other resources
expenditure is projected to be greater than revenue for every year of the planning
period 2016-2019. Therefore, the other resources available balance is projected to
decrease from $1.92 billion at year end 2015 to $490 million in 2019.
III. Draft decision
36. UNICEF recommends that the Executive Board adopt the following draft
decision:
The Executive Board
1. Takes note of the planned financial estimates for the period 2016-2019 as
contained in document E/ICEF/2016/AB/L.6 as a flexible framework for supporting
UNICEF programmes;
2. Approves the integrated resources framework of planned financial
estimates for the period 2016-2019 and approves the preparation of programme
expenditure submissions to the Executive Board of up to $1.47 billion from regular
resources in 2017, subject to the availability of resources and the continued validity
of these planned financial estimates;
3. Requests UNICEF to provide annual updates to the Executive Board on
the progress of funding its reserves for staff liabilities.

E/ICEF/2016/AB/L.6
9/15 16-12351
Annex
Planned financial estimates tables1
1. UNICEF revenue estimates
2. Integrated resources plan: regular and other resources
3. UNICEF planned financial estimates: regular resources
4. Regular resources: yearly phasing of estimated expenditures for programme
5. UNICEF planned financial estimates: other resources
6. UNICEF planned financial estimates: trust funds (procurement services
activities)
__________________
1 The totals in the tables may not add up exactly due to rounding.

E/ICEF/2016/AB/L.6
16-12351 10/15
Table 1
UNICEF revenue estimates
(in millions of United States dollars)
Plan
Plan 2015 Actual 2015a Estimate 2016 2017 2018 2019
Regular resources
Governments 561 546 542 530 529 530
Private sector 588 530 655 678 700 721
Other revenue 91 97 105 111 116 116
Total — regular resources 1 240 1 174 1 302 1 318 1 345 1 367
Growth percentage (6)% (11)% 11% 1% 2% 2%
Other resources
Regular
Governments 1 260 1 080 1 134 1 195 1 195 1 195
Private sector 759 713 826 806 846 871
Inter-organizational arrangements 221 262 268 226 211 211
Subtotal — programmes 2 240 2 055 2 228 2 226 2 251 2 276
Growth percentage (1)% (9)% 8% (0)% 1% 1%
Emergencies
Governments 839 1 396 1 049 983 987 987
Private sector 180 214 90 90 90 90
Inter-organizational arrangements 210 170 175 175 175 175
Subtotal — emergencies 1 229 1 780 1 315 1 249 1 252 1 252
Growth percentage (22)% 13% (26)% (5)% 0% 0%
Total — other resources 3 469 3 836 3 543 3 475 3 503 3 528
Growth percentage (10)% (0)% (8)% (2)% 1% 1%
Total revenue 4 709 5 010 4 845 4 793 4 848 4 895
Growth percentage (9)% (3)% (3)% (1)% 1% 1%
a Actual growth percentage in 2015 is in comparison to 2014 actual.

E/ICEF/2016/AB/L.6
11/15 16-12351
Table 2
Integrated resource plan: regular resources and other resources
(in millions of United States dollars)
Plan
Plan 2015 Actual 2015 Estimate 2016 2017 2018 2019
1. Resources available
Opening balance 2 658 2 658 2 498 2 122 1 639 1 215
Revenue
Contributions 4 618 4 913 4 740 4 682 4 732 4 779
Other income 91 97 105 111 116 116
Total revenue 4 709 5 010 4 845 4 793 4 848 4 895
Adjustment (19) (19) (19) (19) (19) (19)
Total available 7 348 7 648 7 323 6 895 6 468 6 090
2. Use of resources
A. Development
A.1 Programmes 4 319 4 546 4 439 4 438 4 477 4 514
Country 4 145 4 395 4 259 4 256 4 294 4 332
Global and regional 174 150 179 182 182 182
A.2 Development effectiveness 142 129 159 166 155 155
Subtotal 4 461 4 675 4 598 4 604 4 632 4 669
B. United Nations development
coordination 9 6 11 11 9 9
C. Management 370 312 385 429 389 389
D. Special purpose
D.1 Capital investments 14 22 11 11 14 14
D.2 Private-sector fundraising 101 97 147 151 160 162
D.3 Other 45 39 49 49 49 49
Subtotal 160 158 208 212 224 225
Institutional budget (A.2+B+C+D.1) 535 469 567 617 568 568
Integrated budget (A+B+C+D) 5 000 5 150 5 202 5 256 5 254 5 293
Closing balance of resources 2 348 2 498 2 122 1 639 1 215 797
Funded reserves
After-service health insurance 410 411 430 450 470 490
Separation and termination liabilities 75 73 85 95 105 115
Field office accommodation 4 12 9 6 3 1
Procurement services 2 2 2 2 2 2
Total 491 499 526 553 580 608
E/ICEF/2016/AB/L.6
16-12351 12/15
Table 3
UNICEF planned financial estimates: regular resources
(in millions of United States dollars)
Plan
Plan 2015 Actual 2015 Estimate 2016 2017 2018 2019
1. Resources available
Opening balance 617 617 580 490 368 325
Revenue
Contributions 1 149 1 077 1 197 1 207 1 229 1 251
Other income 91 97 105 111 116 116
Total revenue 1 240 1 174 1 302 1 318 1 345 1 367
Adjustment (19) (19) (19) (19) (19) (19)
Total available 1 838 1 772 1 863 1 789 1 694 1 673
2. Use of resources
A. Development
A.1 Programmes 937 874 935 935 935 935
Country 892 830 890 890 890 890
Global and regional 45 44 45 45 45 45
A.2 Development effectiveness 114 100 130 135 124 124
Subtotal 1 051 974 1 066 1 070 1 059 1 059
B. United Nations development
coordination 5 5 5 5 5 5
C. Management 132 72 142 186 145 142
D. Special purpose
D.1 Capital investments 5 5 5 5 5 5
D.2 Private sector fundraising 101 97 106 106 106 106
D.3 Other 45 39 49 49 49 49
Subtotal 151 141 160 160 160 160
Institutional budget (A.2+B+C+D.1) 256 182 282 330 278 275
Integrated budget (A+B+C+D) 1 339 1 192 1 373 1 421 1 369 1 366
Closing balance of resources 499 580 490 368 325 307
Funded reserves
After-service health insurance 410 411 430 450 470 490
Separation and termination liabilities 75 73 85 95 105 115
Field office accommodation 4 12 9 6 3 1
Procurement services 2 2 2 2 2 2
Total 491 499 526 553 580 608

E/ICEF/2016/AB/L.6
13/15 16-12351
Table 4
Regular resources: yearly phasing of estimated expenditures for programmes
(in millions of United States dollars)
2016 2017 2018 2019
Beyond
2019
Total
recommendations
Programme
1. Country programmes approved in prior years 791 528 235 158 76 1 788
2. New country programmes to be submitted to 2016
Executive Board sessions 263 263 263 526 1 315
3. New country programmes to be prepared for submission to
2017 Executive Board sessions 293 293 879 1 465
4. New country programmes to be prepared for submission to
future Executive Board sessions 77 717 794
5. Amount set aside 62 62 62 62
6. Estimated allocation of net revenue from sale of greeting
cards in countries with UNICEF programmes 2 2 2 2
Subtotal 855 855 855 855
7. Additional emergency requirements 35 35 35 35
Subtotal 890 890 890 890
8. Global and regional programmes 45 45 45 45
Total: programmes 935 935 935 935

E/ICEF/2016/AB/L.6
16-12351 14/15
Table 5
UNICEF planned financial estimates: other resources
(in millions of United States dollars)
Plan
Plan 2015 Actual 2015 Estimate 2016 2017 2018 2019
1. Resources available
Opening balance 2 041 2 041 1 918 1 631 1 271 889
Revenue
Contributions 3 469 3 836 3 543 3 475 3 503 3 528
Total revenue 3 469 3 836 3 543 3 475 3 503 3 528
Total available 5 510 5 877 5 461 5 106 4 774 4 417
2. Use of resources
A. Development
A.1 Programmes 3 383 3 672 3 503 3 503 3 541 3 579
Country 3 253 3 566 3 369 3 366 3 404 3 442
Global and regional 129 107 134 137 137 137
A.2 Development effectiveness 27 29 29 31 32 32
Subtotal 3 410 3 701 3 532 3 534 3 573 3 611
B. United Nations development
coordination 4 1 6 6 4 4
C. Managementa 238 240 243 244 244 247
D. Special purpose
D.1 Capital investmentsa 9 17 7 7 9 9
D.2 Private-sector fundraising – – 41 45 54 56
D.3 Other – – – – – –
Subtotal 9 17 48 52 64 65
Institutional budget (A.2+B+C+D.1) 279 287 285 287 289 292
Integrated budget (A+B+C+D) 3 661 3 959 3 829 3 835 3 885 3 927
Closing balance of resources 1 849 1 918 1 631 1 271 889 490
a Amounts reflect use of other resources cost recovery to fund management and capital investments.

E/ICEF/2016/AB/L.6
15/15 16-12351
Table 6
UNICEF planned financial estimates: trust funds (procurement
services activities)
(in millions of United States dollars)
Plan
Actual 2015 Estimate 2016 2017 2018 2019
1. Opening balance 414 459 680 727 754
2. Receipts 1 789 1 808 1 745 1 787 1 787
3. Disbursements 1 745 1 587 1 697 1 760 1 779
4. Closing balance 459 680 727 754 763