Ehrhardt & Brigham
46
© 2014 Cengage Learning. All Rights Reserved. May not be copied, scanned, or duplicated, in whole or in part, except for use as permitted in a license distributed with a certain product or service or otherwise on a password-protected website for classroom use. Ehrhardt & Brigham Corporate Finance: A Focused Approach 5e
description
Ehrhardt & Brigham. Corporate Finance: A Focused Approach 5e. CHAPTER 16. Supply Chains and Working Capital Management. Topics in Chapter. Alternative current operating assets investment and financing policies Cash, inventory, and A/R management Accounts payable management - PowerPoint PPT Presentation
Transcript of Ehrhardt & Brigham
© 2014 Cengage Learning. All Rights Reserved. May not be copied, scanned, or duplicated, in whole or in part, except for use as permitted in a license distributed with a certain product or service or otherwise on a password-protected website for classroom use.
1
Ehrhardt & Brigham
Corporate Finance:A Focused Approach
5e

© 2014 Cengage Learning. All Rights Reserved. May not be copied, scanned, or duplicated, in whole or in part, except for use as permitted in a license distributed with a certain product or service or otherwise on a password-protected website for classroom use.
2
CHAPTER 16
Supply Chains and Working Capital Management

© 2014 Cengage Learning. All Rights Reserved. May not be copied, scanned, or duplicated, in whole or in part, except for use as permitted in a license distributed with a certain product or service or otherwise on a password-protected website for classroom use.
3
Topics in Chapter
Alternative current operating assets investment and financing policies
Cash, inventory, and A/R management
Accounts payable management Short-term financing Bank loans, their costs, and
commercial paper

© 2014 Cengage Learning. All Rights Reserved. May not be copied, scanned, or duplicated, in whole or in part, except for use as permitted in a license distributed with a certain product or service or otherwise on a password-protected website for classroom use.
Value = + + ··· +FCF1 FCF2 FCF∞
(1 + WACC)1 (1 + WACC)∞
(1 + WACC)2
Free cash flow(FCF)
Market interest rates
Firm’s business risk
Market risk aversion
Firm’s debt/equity mix
Cost of debt
Cost of equity
Weighted average
cost of capital(WACC)
Sales revenues
Operating costs and taxes
Required investments in operating capital
−
−
=
Determinants of Intrinsic Value: Working Capital and FCF

© 2014 Cengage Learning. All Rights Reserved. May not be copied, scanned, or duplicated, in whole or in part, except for use as permitted in a license distributed with a certain product or service or otherwise on a password-protected website for classroom use.
5
Basic Definitions Net operating working capital (NOWC):
Operating CA – Operating CL =(Cash + Inv. + A/R) – (Accruals +
A/P) Working capital:
Total current assets used in operations.
Net working capital:Current assets – Current liabilities.(More…)

© 2014 Cengage Learning. All Rights Reserved. May not be copied, scanned, or duplicated, in whole or in part, except for use as permitted in a license distributed with a certain product or service or otherwise on a password-protected website for classroom use.
6
Definitions (Continued)
Working capital management: Includes both establishing working capital policy and then the day-to-day control of cash, inventories, receivables, accruals, and accounts payable.
Working capital policy: The level of each current asset. How current assets are financed.

© 2014 Cengage Learning. All Rights Reserved. May not be copied, scanned, or duplicated, in whole or in part, except for use as permitted in a license distributed with a certain product or service or otherwise on a password-protected website for classroom use.
7
Selected Ratios for RRRR Industry
Current 1.75 2.25
Quick 0.92 1.16
TL/Assets 58.76% 50.00%
Turnover of Cash 16.67 22.22
DSO(365-day year)
45.63 32.00
Inv. Turnover 10.80 20.00
F.A. Turnover 7.75 13.22
T.A. Turnover 2.60 3.00
Profit Margin 2.07% 3.50%
ROE 10.45% 21.00%
Payables deferral 30.00 33.00
© 2014 Cengage Learning. All Rights Reserved. May not be copied, scanned, or duplicated, in whole or in part, except for use as permitted in a license distributed with a certain product or service or otherwise on a password-protected website for classroom use.
8
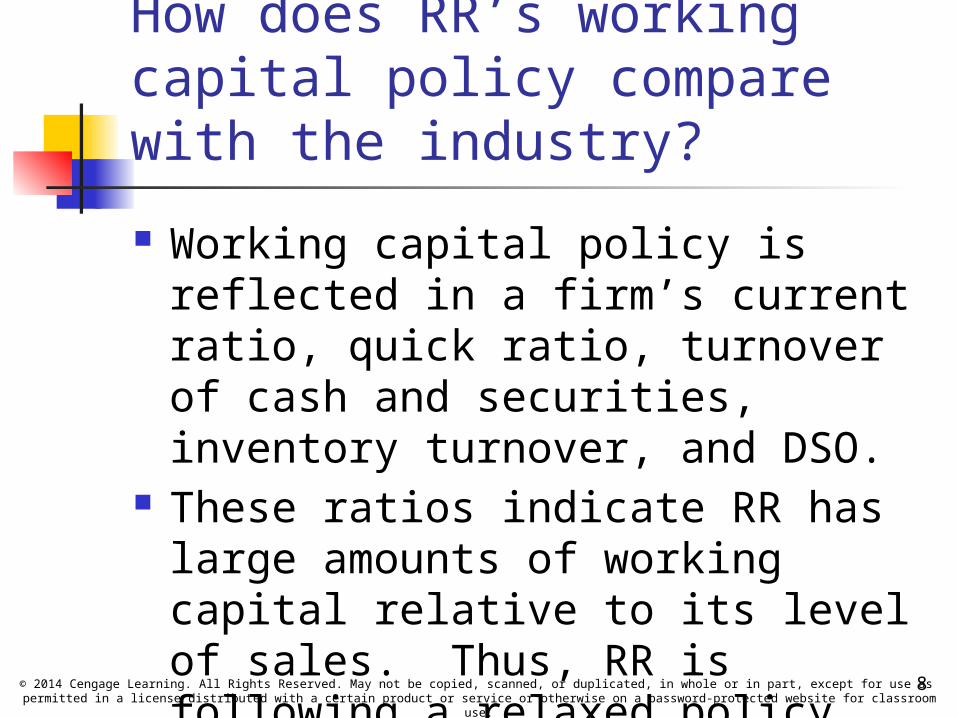
How does RR’s working capital policy compare with the industry?
Working capital policy is reflected in a firm’s current ratio, quick ratio, turnover of cash and securities, inventory turnover, and DSO.
These ratios indicate RR has large amounts of working capital relative to its level of sales. Thus, RR is following a relaxed policy.

© 2014 Cengage Learning. All Rights Reserved. May not be copied, scanned, or duplicated, in whole or in part, except for use as permitted in a license distributed with a certain product or service or otherwise on a password-protected website for classroom use.
9
Is RR inefficient or just conservative?
A relaxed policy may be appropriate if it reduces risk more than profitability.
However, RR is much less profitable than the average firm in the industry. This suggests that the company probably has excessive working capital.

© 2014 Cengage Learning. All Rights Reserved. May not be copied, scanned, or duplicated, in whole or in part, except for use as permitted in a license distributed with a certain product or service or otherwise on a password-protected website for classroom use.
10
Cash Conversion Cycle
The cash conversion cycle focuses on the time between payments made for materials and labor and payments received from sales: Cash Conversion = Cycle
InventoryConversion + Period
Average Collection − Period
Payables Deferral Period

© 2014 Cengage Learning. All Rights Reserved. May not be copied, scanned, or duplicated, in whole or in part, except for use as permitted in a license distributed with a certain product or service or otherwise on a password-protected website for classroom use.
Cash Conversion Cycle (Cont.)
Data: Annual sales = $660,000 COGS/Sales = 90% Inventory turnover = COGS/Inventory =
10.8 COGS = (0.9)($660,000) = $594,000. Inventory = $594,000/10.8 =
$55,000. Inv. Conv. = $55,000/($594,000/365) = 33.8 days.
11

© 2014 Cengage Learning. All Rights Reserved. May not be copied, scanned, or duplicated, in whole or in part, except for use as permitted in a license distributed with a certain product or service or otherwise on a password-protected website for classroom use.
12
Cash Conversion Cycle (Cont.)
CCC = + –
CCC = 33.8 + 45.6 – 30
CCC = 49.4 days.
Inventory conversion
period
Payables deferral period
Days salesoutstanding

© 2014 Cengage Learning. All Rights Reserved. May not be copied, scanned, or duplicated, in whole or in part, except for use as permitted in a license distributed with a certain product or service or otherwise on a password-protected website for classroom use.
13
Cash Management: Cash doesn’t earn interest, so why hold it?
Transactions (Routine): Must have some cash to pay current bills. Essential that the firm have sufficient cash
to take trade discounts. Transactions (Precaution): “Safety
stock.” Not as much needed if company has credit
line or other holdings of short-term securities.
Compensating balances: For loans and/or services provided.

© 2014 Cengage Learning. All Rights Reserved. May not be copied, scanned, or duplicated, in whole or in part, except for use as permitted in a license distributed with a certain product or service or otherwise on a password-protected website for classroom use.
14
What’s the goal of cash management?Minimize the cash amount the firm must hold for conducting its normal business activities, yet, at the same time, have a sufficient cash reserve to:
Take trade discounts. Pay promptly and maintain its
credit rating. Meet any unexpected cash needs.

© 2014 Cengage Learning. All Rights Reserved. May not be copied, scanned, or duplicated, in whole or in part, except for use as permitted in a license distributed with a certain product or service or otherwise on a password-protected website for classroom use.
15
Ways to Minimize Cash Holdings
Use lockboxes. Insist on wire transfers or
automatic debit from customers. Synchronize inflows and outflows. Use float.
(More…)

© 2014 Cengage Learning. All Rights Reserved. May not be copied, scanned, or duplicated, in whole or in part, except for use as permitted in a license distributed with a certain product or service or otherwise on a password-protected website for classroom use.
16
Minimizing Cash (Continued)
Increase forecast accuracy to reduce the need for a cash “safety stock.”
Hold marketable securities instead of a cash “safety stock.”
Negotiate a line of credit (also reduces need for a “safety stock”).

© 2014 Cengage Learning. All Rights Reserved. May not be copied, scanned, or duplicated, in whole or in part, except for use as permitted in a license distributed with a certain product or service or otherwise on a password-protected website for classroom use.
17
Cash Budget: The Primary Cash Management Tool Purpose: Uses forecasts of cash inflows,
outflows, and ending cash balances to predict loan needs and funds available for temporary investment.
Timing: Daily, weekly, or monthly, depending upon budget’s purpose. Monthly for annual planning, daily for actual cash management.

© 2014 Cengage Learning. All Rights Reserved. May not be copied, scanned, or duplicated, in whole or in part, except for use as permitted in a license distributed with a certain product or service or otherwise on a password-protected website for classroom use.
18
Data Required for Cash Budget Sales forecast. Information on collections delay. Forecast of purchases and
payment terms. Forecast of cash expenses: wages,
taxes, utilities, and so on. Initial cash on hand. Target cash balance.

© 2014 Cengage Learning. All Rights Reserved. May not be copied, scanned, or duplicated, in whole or in part, except for use as permitted in a license distributed with a certain product or service or otherwise on a password-protected website for classroom use.
19
RR’s Cash Budget for January and February
Net Cash Inflows
January February
Collections $67,651.95
$62,755.40
Purchases 44,603.75 36,472.65
Wages 6,690.56 5,470.90
Rent 2,500.00 2,500.00
Total Payments $53,794.31
$44,443.55

© 2014 Cengage Learning. All Rights Reserved. May not be copied, scanned, or duplicated, in whole or in part, except for use as permitted in a license distributed with a certain product or service or otherwise on a password-protected website for classroom use.
20
Cash Budget (Continued)
January February
Cash on hand at start of forecast $3,000.00
Net CF (Coll – Pymt)
13,857.64 18,311.85
Cumulative NCF $16,857.64 $35,169.49
– Target cash 1,500.00 1,500.00
Surplus cash $15,357.64 $33,669.49

© 2014 Cengage Learning. All Rights Reserved. May not be copied, scanned, or duplicated, in whole or in part, except for use as permitted in a license distributed with a certain product or service or otherwise on a password-protected website for classroom use.
21
Should depreciation be explicitly included in the cash budget?
No. Depreciation is a noncash charge. Only cash payments and receipts appear on cash budget.
However, depreciation does affect taxes, which do appear in the cash budget.

© 2014 Cengage Learning. All Rights Reserved. May not be copied, scanned, or duplicated, in whole or in part, except for use as permitted in a license distributed with a certain product or service or otherwise on a password-protected website for classroom use.
22
What are some other potential cash inflows besides collections?
Proceeds from fixed asset sales. Proceeds from stock and bond
sales. Interest earned. Court settlements.

© 2014 Cengage Learning. All Rights Reserved. May not be copied, scanned, or duplicated, in whole or in part, except for use as permitted in a license distributed with a certain product or service or otherwise on a password-protected website for classroom use.
23
How can interest earned or paid on short-term securities or loans be incorporated in the cash budget?
Interest earned: Add line in the collections section.
Interest paid: Add line in the payments section.
Found as interest rate x surplus/loan line of cash budget for preceding month.
Note: Interest on any other debt would need to be incorporated as well.

© 2014 Cengage Learning. All Rights Reserved. May not be copied, scanned, or duplicated, in whole or in part, except for use as permitted in a license distributed with a certain product or service or otherwise on a password-protected website for classroom use.
24
How could bad debts be worked into the cash budget? Collections would be reduced by
the amount of bad debt losses. For example, if the firm had 3%
bad debt losses, collections would total only 97% of sales.
Lower collections would lead to lower surpluses and higher borrowing requirements.

© 2014 Cengage Learning. All Rights Reserved. May not be copied, scanned, or duplicated, in whole or in part, except for use as permitted in a license distributed with a certain product or service or otherwise on a password-protected website for classroom use.
25
Cash budget forecasts the company’s cash holdings to exceed targeted cash balance every month, except for October and November.
Cash budget indicates the company probably is holding too much cash.
RR could improve its EVA by either investing its excess cash in more productive assets or by paying it out to the firm’s shareholders.

© 2014 Cengage Learning. All Rights Reserved. May not be copied, scanned, or duplicated, in whole or in part, except for use as permitted in a license distributed with a certain product or service or otherwise on a password-protected website for classroom use.
26
Why might RR want to maintain a relatively high amount of cash?
If sales turn out to be considerably less than expected, RR could face a cash shortfall.
A company may choose to hold large amounts of cash if it does not have much faith in its sales forecast, or if it is very conservative.
The cash may be there, in part, to fund a planned fixed asset acquisition.

© 2014 Cengage Learning. All Rights Reserved. May not be copied, scanned, or duplicated, in whole or in part, except for use as permitted in a license distributed with a certain product or service or otherwise on a password-protected website for classroom use.
27
Is RR holding too much inventory? RR’s inventory turnover (10.80) is
considerably lower than the industry average (20.00). The firm is carrying a lot of inventory per dollar of sales.
By holding excessive inventory, the firm is increasing its operating costs which reduces its NOPAT. Moreover, the excess inventory must be financed, so EVA is further lowered.

© 2014 Cengage Learning. All Rights Reserved. May not be copied, scanned, or duplicated, in whole or in part, except for use as permitted in a license distributed with a certain product or service or otherwise on a password-protected website for classroom use.
28
If RR reduces its inventory, without adversely affecting sales, what effect will this have on its cash position?
Short run: Cash will increase as inventory purchases decline.
Long run: Company is likely to then take steps to reduce its cash holdings.

© 2014 Cengage Learning. All Rights Reserved. May not be copied, scanned, or duplicated, in whole or in part, except for use as permitted in a license distributed with a certain product or service or otherwise on a password-protected website for classroom use.
29
Accounts Receivable Management: Do RR’s customers pay more or less promptly than those of its competitors?
RR’s days’ sales outstanding (DSO) of 45.6 days is well above the industry average (32 days).
RR’s customers are paying less promptly.
RR should consider tightening its credit policy to reduce its DSO.

© 2014 Cengage Learning. All Rights Reserved. May not be copied, scanned, or duplicated, in whole or in part, except for use as permitted in a license distributed with a certain product or service or otherwise on a password-protected website for classroom use.
30
Elements of Credit Policy
Cash Discounts: Lowers price. Attracts new customers and reduces DSO.
Credit Period: How long to pay? Shorter period reduces DSO and average A/R, but it may discourage sales.
(More…)

© 2014 Cengage Learning. All Rights Reserved. May not be copied, scanned, or duplicated, in whole or in part, except for use as permitted in a license distributed with a certain product or service or otherwise on a password-protected website for classroom use.
31
Credit Policy (Continued)
Credit Standards: Tighter standards reduce bad debt losses, but may reduce sales. Fewer bad debts reduces DSO.
Collection Policy: Tougher policy will reduce DSO, but may damage customer relationships.

© 2014 Cengage Learning. All Rights Reserved. May not be copied, scanned, or duplicated, in whole or in part, except for use as permitted in a license distributed with a certain product or service or otherwise on a password-protected website for classroom use.
32
Does RR face any risk if it tightens its credit policy?
YES! A tighter credit policy may discourage sales. Some customers may choose to go elsewhere if they are pressured to pay their bills sooner.

© 2014 Cengage Learning. All Rights Reserved. May not be copied, scanned, or duplicated, in whole or in part, except for use as permitted in a license distributed with a certain product or service or otherwise on a password-protected website for classroom use.
33
If RR succeeds in reducing DSO without adversely affecting sales, what effect would this have on its cash position?
Short run: If customers pay sooner, this increases cash holdings.
Long run: Over time, the company would hopefully invest the cash in more productive assets, or pay it out to shareholders. Both of these actions would increase EVA.

© 2014 Cengage Learning. All Rights Reserved. May not be copied, scanned, or duplicated, in whole or in part, except for use as permitted in a license distributed with a certain product or service or otherwise on a password-protected website for classroom use.
34
Is there a cost to accruals? Can firms control accruals?
Accruals are free in that no explicit interest is charged.
Firms have little control over the level of accruals. Levels are influenced more by industry custom, economic factors, and tax laws.
© 2014 Cengage Learning. All Rights Reserved. May not be copied, scanned, or duplicated, in whole or in part, except for use as permitted in a license distributed with a certain product or service or otherwise on a password-protected website for classroom use.
35
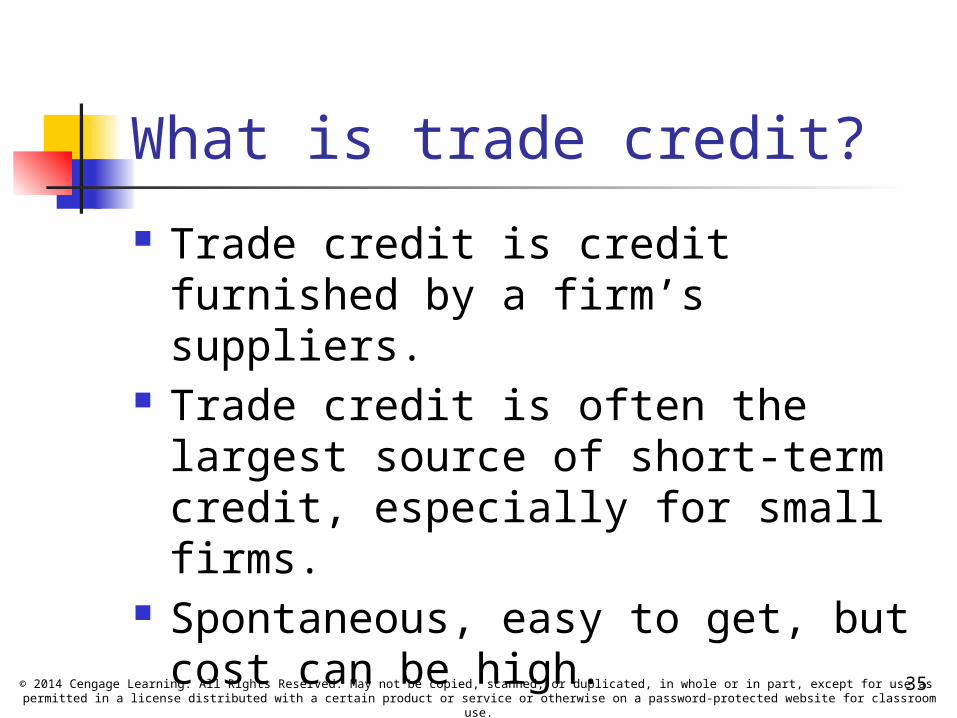
What is trade credit?
Trade credit is credit furnished by a firm’s suppliers.
Trade credit is often the largest source of short-term credit, especially for small firms.
Spontaneous, easy to get, but cost can be high.

© 2014 Cengage Learning. All Rights Reserved. May not be copied, scanned, or duplicated, in whole or in part, except for use as permitted in a license distributed with a certain product or service or otherwise on a password-protected website for classroom use.
36
RR buys $200,000 of materials net, on terms of 1/10, net 30 but pays on Day 40. Find free and costly trade credit.
Net daily purchases = $200,000/365 = $547.94.
Ann. gross purch.= $200,000/(1 – 0.01) = $202,020.

© 2014 Cengage Learning. All Rights Reserved. May not be copied, scanned, or duplicated, in whole or in part, except for use as permitted in a license distributed with a certain product or service or otherwise on a password-protected website for classroom use.
37
Gross/Net Breakdown Company buys equip worth
$200,000. That’s the equipment’s cash price.
The firm must pay $2,020 more if it doesn’t take discounts.
Think of the extra $2,020 as a financing cost similar to the interest on a loan.
Want to compare that cost with the cost of a bank loan.

© 2014 Cengage Learning. All Rights Reserved. May not be copied, scanned, or duplicated, in whole or in part, except for use as permitted in a license distributed with a certain product or service or otherwise on a password-protected website for classroom use.
38
Payables level if don’t take discount: Payables = $547.94(40) = $21,918.
Total trade credit = $21,918 Free trade credit = 5,479 Costly trade credit = $16,439
Free and Costly Trade Credit
Payables level for equipment if take discount: Payables = $547.94(10) = $5,479.

© 2014 Cengage Learning. All Rights Reserved. May not be copied, scanned, or duplicated, in whole or in part, except for use as permitted in a license distributed with a certain product or service or otherwise on a password-protected website for classroom use.
39
Nominal Cost of Costly Trade Credit, rNOM
But the $2,020 is paid all during the year, not at year-end, so effective annual rate is higher.
Firm loses 0.01($202,020) = $2,020 of discounts to obtain $16,439 in extra trade credit, so:
rNOM = = 0.1229 = 12.29%$2,020
$16,439

© 2014 Cengage Learning. All Rights Reserved. May not be copied, scanned, or duplicated, in whole or in part, except for use as permitted in a license distributed with a certain product or service or otherwise on a password-protected website for classroom use.
40
Nominal Cost Formula, 1/10, net 40
Pays 1.01% 12.167 times per year.
rNOM = Discount %
1 – Discount %
× 365 days
Days
Taken
Discount
Period
–
=1
99×
365
30= 0.0101 × 12.1667
= 0.1229 = 12.29%

© 2014 Cengage Learning. All Rights Reserved. May not be copied, scanned, or duplicated, in whole or in part, except for use as permitted in a license distributed with a certain product or service or otherwise on a password-protected website for classroom use.
41
Effective Annual Rate (EAR), 1/10, net 40 Periodic rate = 0.01/0.99 = 1.01%.
Periods/year = 365/(40 – 10)= 12.1667.
EAR = (1 + Periodic rate)n – 1.0 = (1.0101)12.1667 – 1.0
= 13.01%.

© 2014 Cengage Learning. All Rights Reserved. May not be copied, scanned, or duplicated, in whole or in part, except for use as permitted in a license distributed with a certain product or service or otherwise on a password-protected website for classroom use.
42
Current Operating Assets Financing Policies Moderate: Match the maturity of
the assets with the maturity of the financing.
Aggressive: Use short-term financing to finance permanent assets.
Conservative: Use permanent capital for permanent assets and temporary assets.

© 2014 Cengage Learning. All Rights Reserved. May not be copied, scanned, or duplicated, in whole or in part, except for use as permitted in a license distributed with a certain product or service or otherwise on a password-protected website for classroom use.
43
Years
$
Perm NOWC
Fixed Assets
Temp. NOWC
Lower dashed line, more aggressive.
} S-TLoans
L-T Fin:Stock &Bonds,
Moderate Financing Policy

© 2014 Cengage Learning. All Rights Reserved. May not be copied, scanned, or duplicated, in whole or in part, except for use as permitted in a license distributed with a certain product or service or otherwise on a password-protected website for classroom use.
44
What are the advantages of short-term debt vs. long-term debt?
Low cost-- yield curve usually slopes upward.
Can get funds relatively quickly. Can repay without penalty.

© 2014 Cengage Learning. All Rights Reserved. May not be copied, scanned, or duplicated, in whole or in part, except for use as permitted in a license distributed with a certain product or service or otherwise on a password-protected website for classroom use.
45
What are the disadvantages of short-term debt vs. long-term debt?
Higher risk. The required repayment comes quicker, and the company may have trouble rolling over loans.

© 2014 Cengage Learning. All Rights Reserved. May not be copied, scanned, or duplicated, in whole or in part, except for use as permitted in a license distributed with a certain product or service or otherwise on a password-protected website for classroom use.
46
Commercial Paper (CP) Short term notes issued by large,
strong companies. RR couldn’t issue CP--it’s too small.
CP trades in the market at rates just above T-bill rate.
CP is bought with surplus cash by banks and other companies, then held as a marketable security for liquidity purposes.


![[PPT]Time Value of Moneyleeds-faculty.colorado.edu/Donchez/Brigham - Ehrhardt... · Web viewTitle Time Value of Money Subject Powerpoint Show Author Mike Ehrhardt Last modified by](https://static.fdocuments.us/doc/165x107/5aafb2587f8b9a22118d8755/ppttime-value-of-moneyleeds-ehrhardtweb-viewtitle-time-value-of-money-subject.jpg)