Ehab A. Etellisi & Yiming Deng Departments of Electrical … · 2013-12-07 · Ehab A. Etellisi &...
19
Ehab A. Etellisi & Yiming Deng Departments of Electrical Engineering University of Colorado Denver ASPRS Conference, Milwaukee, USA, 2011
Transcript of Ehab A. Etellisi & Yiming Deng Departments of Electrical … · 2013-12-07 · Ehab A. Etellisi &...

Ehab A. Etellisi & Yiming DengDepartments of Electrical Engineering
University of Colorado Denver
ASPRS Conference, Milwaukee, USA, 2011

Introduction Addressed Problem & Some Applications Communications System Block Diagram Image Pre-Processing Sequential Detection of Change Algorithm Simulation Results Future Work
2

Oil spills on the sea surface might happen without any previous caution and areseen relatively often. Efficient and effective oil spill monitoring and detectionaccelerates response time, thus minimizing remediation costs and limitingdangerous impact to the environment.
An innovative satellite-based oil pollution detecting framework is demonstrated inthis presentation, including satellite imaging system modeling, noise model forimages transmission and image pre-processing: enhancement and segmentation.
Finally, an optimized sequential detection of change (SDC) algorithm is proposedto detect oil spills on the ocean surface from the enhanced remote sensing data.Moderate Resolution Imaging Spectroradiometer (MODIS) images of the Gulf ofMexico accident from NASA between May and June 2010 are adopted .
The results of this research show that the proposed algorithms can effectivelydistinguish the spills covering vast areas of the marine environment even withsevere additive noise and have good separation properties against complexsignatures, such as the vicinity to the irregular coast or foggy and cloudy weatherconditions.
3

Recognition of Oil Spill shapes in Satellite
Images Using the Sequential Detection of
Change Algorithm
4

(1) Recognition of Oil Spills (3) Recognition of Airplanes
5
(2) NEOs Detection (4) Voice Activity detection and Recognition of Cyber Exploits

6

Segmentation
Image Enhancement
AWGN +Fading Channel
Sequential Test
Decision
Scenario #1Satellite’s images
Scenario #2Boats’s images
Scenario #3Helicopter’s images
Ground receiving station
Scenario #1: Tracking andmonitoring directly from thesatellite.
Scenario #2: The boat takes multi-images from the interested areaaround the boat and sends themfrom LAN (Local Area Network) toWAN (Wide Area Network such asVSAT). Then, from boat’s VSAT tothe ground receive station toprocess them and detect if there isany oil spill.
Scenario #3: The helicopter takesmulti-images from the region ofinterest and sends them to theground receiving station to processthem and detect if there is any oilspill. 7

Approach
1) Modeling the Image.
2) Add AWGN to the image.
3) Convert the RGB image to Gray image then to Binary Image using some threshold.
4) Assumption: each pixel is independent with the neighbors pixels around.
5) Use Bernoulli distribution.
6) Compute the p, q, and the updating step.
7) Start applying the sequential detection of change test.
8) Make the final decision.8
Start
Modulator Modulator
AWGN Extra AWGN
Demodulator Demodulator
Gray to Binary Image Transformation
Making the Final Decision
Compare Results and Check if the Proposed Model Robust or Not
End
BER M
Easurment
+
RGB to Gray Image
Tested Image
Satellite Channel
Satellite Channel
+
Sequential Detection of Change Test

RGB TO GRAY-LEVEL IMAGE RGB TO GRAY-LEVEL IMAGE
WITH MORE AWGN
9

GRAY IMAGE TO BINARY
WITH MORE AWGNGRAY IMAGE TO BINARY
10

Columns
One row will be
used to compute
the false alarm
and power curves
Rows
11
1 2
3
8
Row
s
Columns

(a) Have (m-1) parallel algorithms operating. The ith algorithm; {i =1,..., (m-1)} is monitoring a {f0 → fi} shift. denotes theoperating value of the ith algorithm at time n, given the observationsequence . The operating value is updated as follows.
12
)x|x()x|x( log+) (xT 0,max = ) (xT
0 T
1-n1n0
1-n1n1-n
10in
10in
0i0
1n ffi
) (xT n1
0in
(b) Select a threshold δ0 > 0.(c) The algorithmic system stops the first time n when either one of the
(m-1) parallel algorithms crosses the common threshold δ0 .(d) If the ith algorithm is the one that first crosses the threshold, then it is
declared that a {f0 → fi} shift has occurred.

For f0 f1 For f1 f0
Select 0 positive threshold. Then, Select 1 positive threshold. Then,
Where
13
),(x+) (xT 0,max = ) (xT
0 T
n1-n
11-nn1n
0
pq
Stop the first time n such that Tn(x1
n) 0 0
0
0
Observed n-data
Decide change from 10 ff
13
),(x-) (xT 0,max = ) (xT
0 T
n1-n
11-nn1n
0
pq
1
0
Decide change from 01 ff
Observed n-data
)]1(/)1(log[)]1/()1log[(),(qppq
pqpq
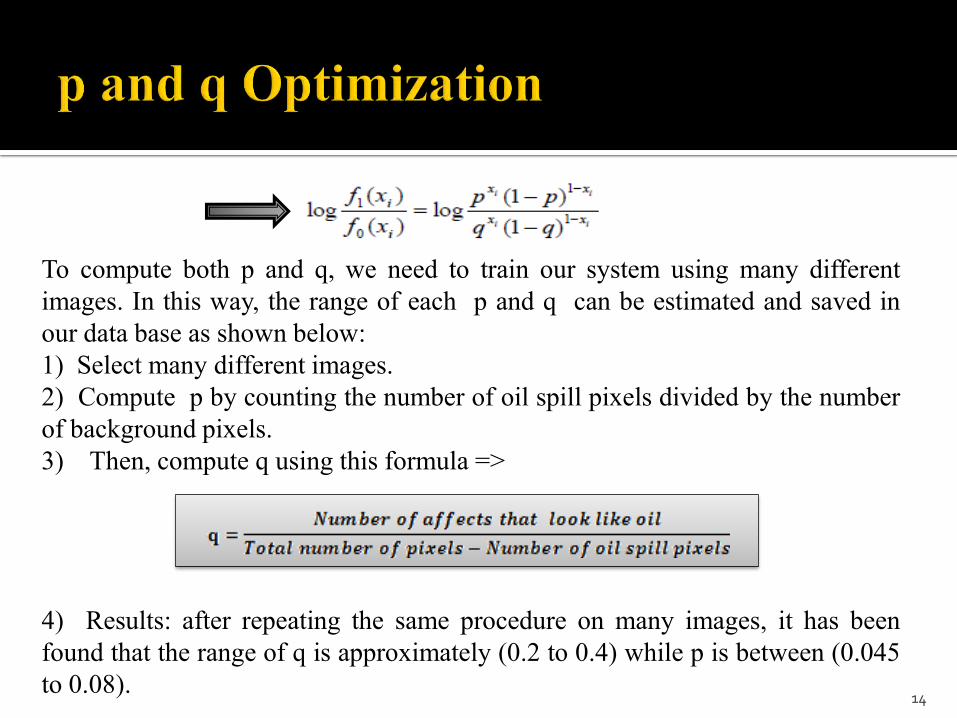
To compute both p and q, we need to train our system using many differentimages. In this way, the range of each p and q can be estimated and saved inour data base as shown below:1) Select many different images.2) Compute p by counting the number of oil spill pixels divided by the numberof background pixels.3) Then, compute q using this formula =>
4) Results: after repeating the same procedure on many images, it has beenfound that the range of q is approximately (0.2 to 0.4) while p is between (0.045to 0.08).
14

15
(e)Binary Noisy Image
(c)Binary Image
(a) Original Image
(f) Detecting Oil Leak
(b) Gray Image
(d) Detecting Oil Leak
(f) Detecting Oil Leak
(e)Binary Noisy Image
(c)Binary Image
(b) Gray Image
(a) Original Image
(d) Detecting Oil Leak
(f) Detecting Oil Leak

16
Recognition of Shapes of Interest in Images

Started introducing higher level models instead of the Bernoulli model. Started working on real time videos using the sequential detection of
change algorithm. Some Results: 1) Oil Spill Detection; 2) Airplanes Detection; 3)
Hurricanes Detection; 4) NEOs Detection; 5) SubmarineDetection,….etc
17

[1] Sherwell, P.: BP disaster: worst oil spill in US history turns seas into a dead zone. May 2010. http://www.telegraph.co.uk/finance/newsbysector/energy/oilandgas/7783656/BP-disaster-worst-oil-spill-in-US-history-turns-seas-into-a-dead-zone.html.
[2] Shafer, D., Laplante, P.A.: The BP Oil Spill: Could Software be a Culprit?. IEEE Computer Society. IT Professional . 2010[3] NASA Database Gulf of Mexico Oil Spill.: http://www.nasa.gov/topics/earth/features/oilspill/oil_spill_gallery.html.[4] Worldatlas, World Map with Latitude and Longitude.:
http://www.worldatlas.com/aatlas/latitude_and_longitude_finder.htm[5] MODIS Rapid Response System, Gulf of Mexico Oil Spill.: http://rapidfire.sci.gsfc.nasa.gov/gallery/?search=oil.[6] Ippolito, L. J.: Satellite Communications Systems Engineering Atmospheric Effects, Satellite Link Design and System
Performance, Wiely. (2008).[7] E.A. Etellisi and P. Papantoni-Kazakos, “Sequential Tests for the Detection of Voice Activity and the Recognition of Cyber
Exploits”, EURASIP, special issue on Object Tracking and Monitoring using Advanced Signal Processing Techniques,2011.
[8] E.A. Etellisi, A.T. Burrell, and P. Papantoni-Kazakos, “A Core Algorithm in Object Tracking and Monitoring Distributed Wireless Sensor Networks”, EURASIP, special issue on Object Tracking and Monitoring using Advanced Signal Processing Techniques,2011.
[9] E.A. Etellisi, “Modulation, Coding and Detection for satellite and Space Communications”, MS thesis, University of Colorado Denver, May 2011.
[10] Papantoni-Kazakos, P.: Algorithms for monitoring changes in quality of communication links. IEEE Transactions on Communication, 27, 1979, 682-692.
18