Egypt Food Processing Ingredients Annual 2015 · leading subsector is dairy with a compound annual...
18
THIS REPORT CONTAINS ASSESSMENTS OF COMMODITY AND TRADE ISSUES MADE BY USDA STAFF AND NOT NECESSARILY STATEMENTS OF OFFICIAL U.S. GOVERNMENT POLICY Date: 09/11/2015 GAIN Report Number: Approved By: Prepared By: Post: Report Highlights: Egypt’s food processing is a very dynamic sector, averaging a compound annual growth rate of 12 percent in the last 5 years. The food processing industry in Egypt is very fragmented, providing ample opportunities to tap into the market at all levels. Barriers to entry are low, as Egypt only requires product registration for special dietary food products. However, many U.S. food ingredients face high tariffs vis-a-vis ingredients from Europe, Africa and the Middle East, which enjoy a favorable tariff regimen due to trade agreements. The top U.S. food ingredient export to Egypt is processed dairy products at $106 million in 2014 or 82 percent of total exports of U.S. food ingredients, and will remain the leading food ingredient export from the US in the near future. Other best prospects include U.S. processed eggs, retaining a 20 percent market share Cairo Orestes Vasquez Ibrahim Mohamed Ron Verdonk Annual 2015 Food Processing Ingredients Egypt 11/9/2015 Required Report - public distribution
Transcript of Egypt Food Processing Ingredients Annual 2015 · leading subsector is dairy with a compound annual...
THIS REPORT CONTAINS ASSESSMENTS OF COMMODITY AND TRADE ISSUES MADE BY USDA STAFF AND NOT NECESSARILY STATEMENTS OF OFFICIAL U.S. GOVERNMENT POLICY
Date: 09/11/2015 GAIN Report Number:
Approved By:
Prepared By:
Post:
Report Highlights: Egypt’s food processing is a very dynamic sector, averaging a compound annual growth rate of 12 percent in the last 5 years. The food processing industry in Egypt is very fragmented, providing ample opportunities to tap into the market at all levels. Barriers to entry are low, as Egypt only requires product registration for special dietary food products. However, many U.S. food ingredients face high tariffs vis-a-vis ingredients from Europe, Africa and the Middle East, which enjoy a favorable tariff regimen due to trade agreements. The top U.S. food ingredient export to Egypt is processed dairy products at $106 million in 2014 or 82 percent of total exports of U.S. food ingredients, and will remain the leading food ingredient export from the US in the near future. Other best prospects include U.S. processed eggs, retaining a 20 percent market share
Cairo
Orestes Vasquez Ibrahim Mohamed
Ron Verdonk
Annual 2015
Food Processing Ingredients
Egypt
11/9/2015
Required Report - public distribution

and an annual growth rate in sales of 5 percent. U.S. processed vegetables and pulses have established a niche market in Egypt’s food processing sector. Food preparations face comparatively lower tariff rates at 5 percent, against the non-tariff rate for African, European, and Middle Eastern competitors. SECTION I: MARKET SUMMARY Overview The World Bank defines Egypt as a lower middle income economy with a Gross National Income (GNI) per capita of $3,436 (2014). Agriculture accounts for 29 percent of the labor force; industry and services absorb 24 and 47 percent of the labor force, respectively. In 2013, agriculture accounted for 14.5 percent of Egypt’s gross domestic product (GDP) of $272 billion; industry and services accounted for 37.6 and 47.6 percent, respectively.
The Egyptian Central Agency for Public Mobilization and Statistics (CAPMAS) estimates Egypt’s population at 87.7 million (December 2014). Egypt’s population growth rate is 2.2 percent, resulting in an increase in population that approaches 2 million people every year.
Food Processing Sector Egypt’s food processing is a very dynamic sector, accounting for five percent of the country’s GDP valued at LE 108 billion ($13.5 billion) in 2014 (figure 1). The sector averaged an annual growth rate of 12 percent in the last 5 years and consists of 77,285 establishments, employing hundreds of thousands of Egyptians.
The food processing sub-sectors have all increased sales at a brisk pace, with the nutrition/staple sector dominating all other sectors. In 2014, this sector attained sales of close to EGP 57 billion

($7.3 billion), followed by the impulse and indulgence product sector at EGP 24 billion ($3.07 billion), and dried processed food at EGP 11.9 billion ($1.62 billion).
The food processing sector imported $1.89 billion in food ingredients in 2014, excluding meat and bulk commodities, an increase of 15 percent over 2013. In the last 5 years, imports have grown by an annual rate of 15 percent (figure 3).
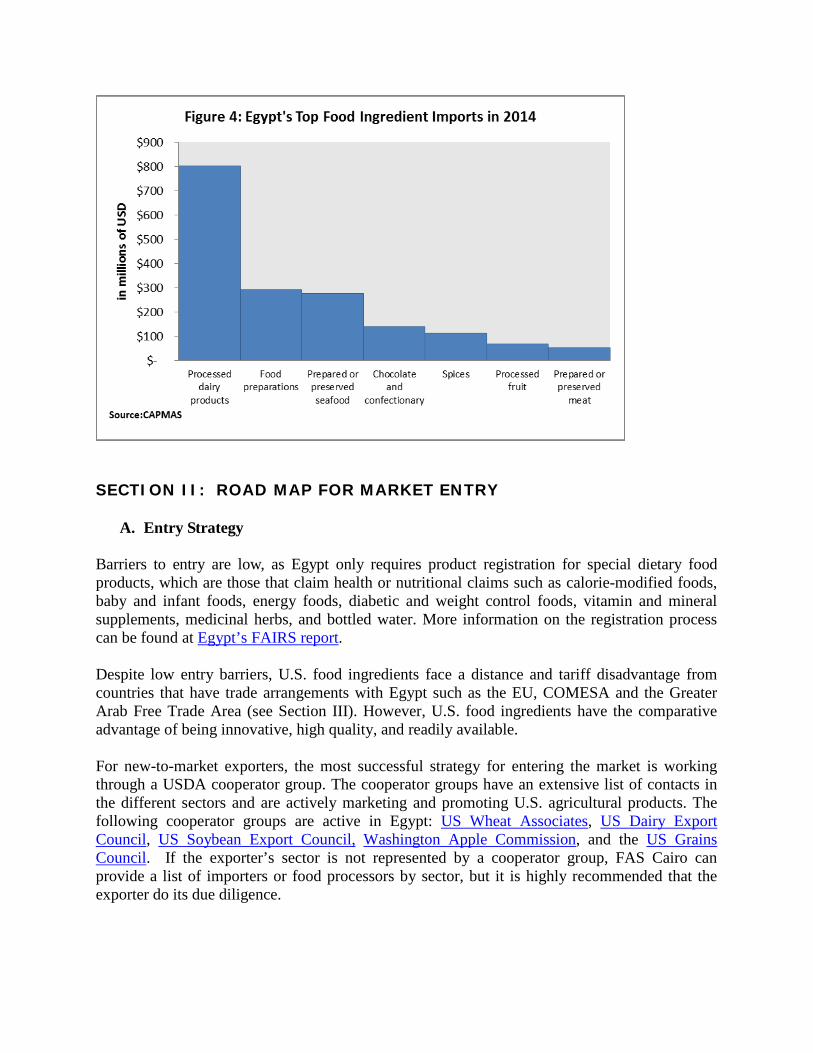
In 2014, Egypt’s top food ingredient import was processed dairy products valued at $802 million, which includes powdered milk, butter, whey, and cheese. The second largest import category was food preparations at $293 million, and this includes malt extract, protein concentrates, yeasts, pectates, and starch. The third highest value import was prepared or preserved seafood at $278 million (figure 4).
SECTION II: ROAD MAP FOR MARKET ENTRY
A. Entry Strategy Barriers to entry are low, as Egypt only requires product registration for special dietary food products, which are those that claim health or nutritional claims such as calorie-modified foods, baby and infant foods, energy foods, diabetic and weight control foods, vitamin and mineral supplements, medicinal herbs, and bottled water. More information on the registration process can be found at Egypt’s FAIRS report. Despite low entry barriers, U.S. food ingredients face a distance and tariff disadvantage from countries that have trade arrangements with Egypt such as the EU, COMESA and the Greater Arab Free Trade Area (see Section III). However, U.S. food ingredients have the comparative advantage of being innovative, high quality, and readily available. For new-to-market exporters, the most successful strategy for entering the market is working through a USDA cooperator group. The cooperator groups have an extensive list of contacts in the different sectors and are actively marketing and promoting U.S. agricultural products. The following cooperator groups are active in Egypt: US Wheat Associates, US Dairy Export Council, US Soybean Export Council, Washington Apple Commission, and the US Grains Council. If the exporter’s sector is not represented by a cooperator group, FAS Cairo can provide a list of importers or food processors by sector, but it is highly recommended that the exporter do its due diligence.

It is highly advisable that companies wanting to do business in Egypt attend trade shows. Egyptian companies flock in significant numbers to international events like Gulfood and ANUGA, as well at the locally held Food Africa trade show. Once a relationship has been established, it is of utmost importance to visit and keep in continuous and close contact with Egyptian partners. Additionally, exporters should ensure good quality and a reasonable price since the Egyptian market is a price-sensitive market. B. MARKET STRUCTURE
Egypt’s market strructure is straightforward. Importers can be either food processors or agents. Large companies prefer to source their food ingredients or products directly from abroad. They do it to obtain reasonable pricing, guaranteed continuous product flow, and for quality assurance purposes. Agents and distributors play a critical role in the market structure, since Egypt’s food processing sector is highly fragmented with many small and medium enterprises depending exclusively on the former for their ingredients for the following reasons: they purchase small quantities, refrain from risks associated with importation, pay for their purchases in local currency, and are unable to sustain large inventories.
Chart 1: Distribution Channel for Imported Food Ingredients

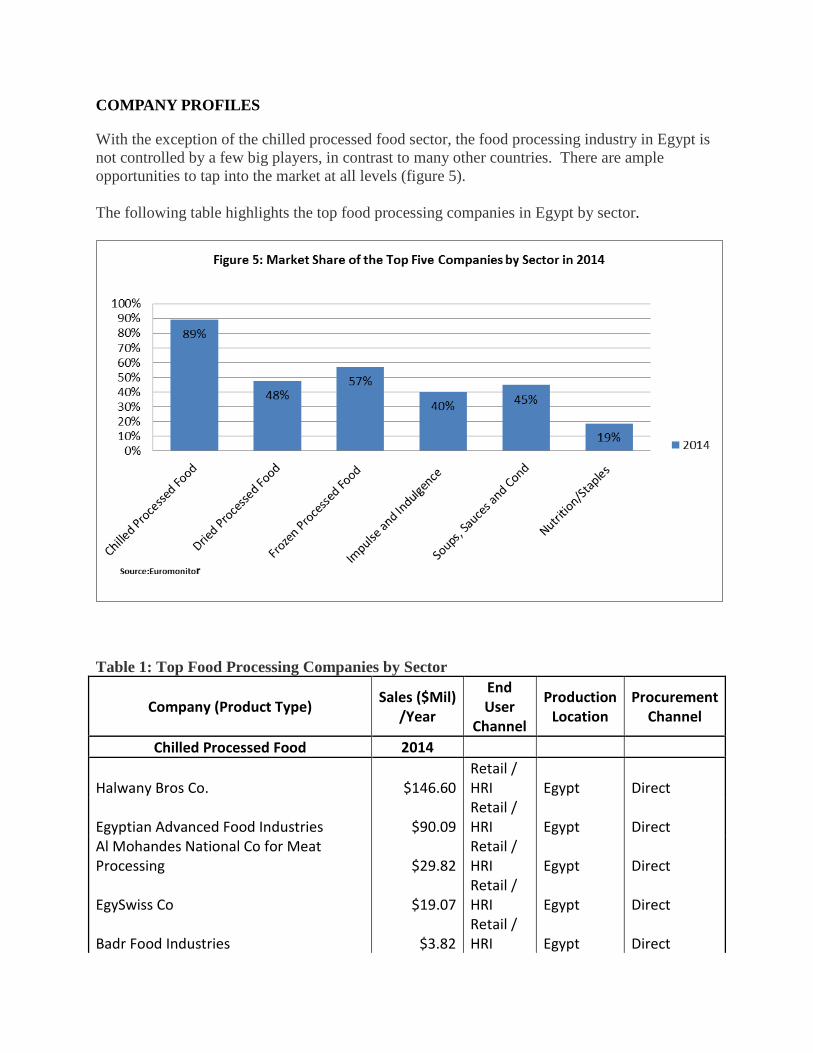
COMPANY PROFILES
With the exception of the chilled processed food sector, the food processing industry in Egypt is not controlled by a few big players, in contrast to many other countries. There are ample opportunities to tap into the market at all levels (figure 5). The following table highlights the top food processing companies in Egypt by sector.
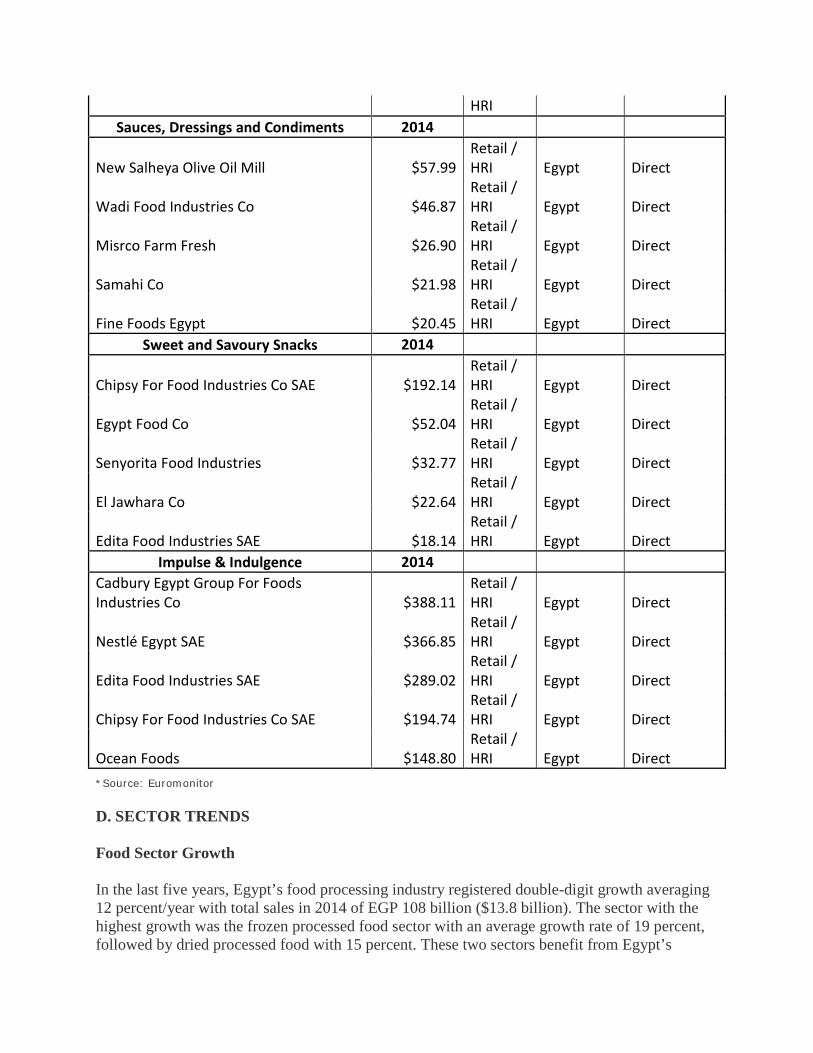
Table 1: Top Food Processing Companies by Sector
Company (Product Type) Sales ($Mil) /Year
End User
Channel
Production Location
Procurement Channel
Chilled Processed Food 2014
Halwany Bros Co. $146.60 Retail / HRI Egypt Direct
Egyptian Advanced Food Industries $90.09
Retail / HRI Egypt Direct
Al Mohandes National Co for Meat Processing $29.82
Retail / HRI Egypt Direct
EgySwiss Co $19.07 Retail / HRI Egypt Direct
Badr Food Industries $3.82 Retail / HRI Egypt Direct

Frozen Processed Food 2014
Cairo Poultry Processing Co $328.64 Retail / HRI Egypt Direct
Al Moutaheda Foods $107.73 Retail / HRI Egypt Direct
Egyptian Co for Advanced Foodstuff Industries (Faragello) $129.52
Retail / HRI Egypt Direct
Halwani Bros Co $117.16 Retail / HRI Egypt Direct
Badr Food Industries $75.85 Retail / HRI Egypt Direct
Dried Processed Food 2014
Al Doha Co for Processing & Distribution $357.39 Retail / HRI Egypt Direct
Al Farasha Co $140.05 Retail / HRI Egypt Direct
Zamzam Beverage Co $105.50 Retail / HRI Egypt Direct
Regina Pasta & Food Industries $97.32 Retail / HRI Egypt Direct
Nahrain Co for Food Products SAE $95.98 Retail / HRI Egypt Direct
Canned Preserved Food 2014
Songkla Canning PCL $22.56 Retail / HRI Thailand Direct
Gulf Food Industries $22.59 Retail / HRI Egypt Direct
Harvest Foods Co $7.67 Retail / HRI Egypt Direct
Al Mohandes National Co for Meat Processing $7.35
Retail / HRI Egypt Direct
Egyptian Advanced Food Industries $4.03 Retail / HRI Egypt Direct
Cheese 2014
El Manzala Co $168.82 Retail / HRI Egypt Direct
Middle East Dairy & Foodstuff Co $105.80 Retail / HRI Egypt Direct
Best Cheese Co for Dairy Products SAE $98.26 Retail / HRI Egypt Direct
Royal FrieslandCampina NV $77.53 Retail / HRI Netherland Direct
Arabian Food Industry Co (Domty) $70.07 Retail / Egypt Direct
HRI Sauces, Dressings and Condiments 2014
New Salheya Olive Oil Mill $57.99 Retail / HRI Egypt Direct
Wadi Food Industries Co $46.87 Retail / HRI Egypt Direct
Misrco Farm Fresh $26.90 Retail / HRI Egypt Direct
Samahi Co $21.98 Retail / HRI Egypt Direct
Fine Foods Egypt $20.45 Retail / HRI Egypt Direct
Sweet and Savoury Snacks 2014
Chipsy For Food Industries Co SAE $192.14 Retail / HRI Egypt Direct
Egypt Food Co $52.04 Retail / HRI Egypt Direct
Senyorita Food Industries $32.77 Retail / HRI Egypt Direct
El Jawhara Co $22.64 Retail / HRI Egypt Direct
Edita Food Industries SAE $18.14 Retail / HRI Egypt Direct
Impulse & Indulgence 2014 Cadbury Egypt Group For Foods Industries Co $388.11
Retail / HRI Egypt Direct
Nestlé Egypt SAE $366.85 Retail / HRI Egypt Direct
Edita Food Industries SAE $289.02 Retail / HRI Egypt Direct
Chipsy For Food Industries Co SAE $194.74 Retail / HRI Egypt Direct
Ocean Foods $148.80 Retail / HRI Egypt Direct
*Source: Euromonitor D. SECTOR TRENDS Food Sector Growth In the last five years, Egypt’s food processing industry registered double-digit growth averaging 12 percent/year with total sales in 2014 of EGP 108 billion ($13.8 billion). The sector with the highest growth was the frozen processed food sector with an average growth rate of 19 percent, followed by dried processed food with 15 percent. These two sectors benefit from Egypt’s
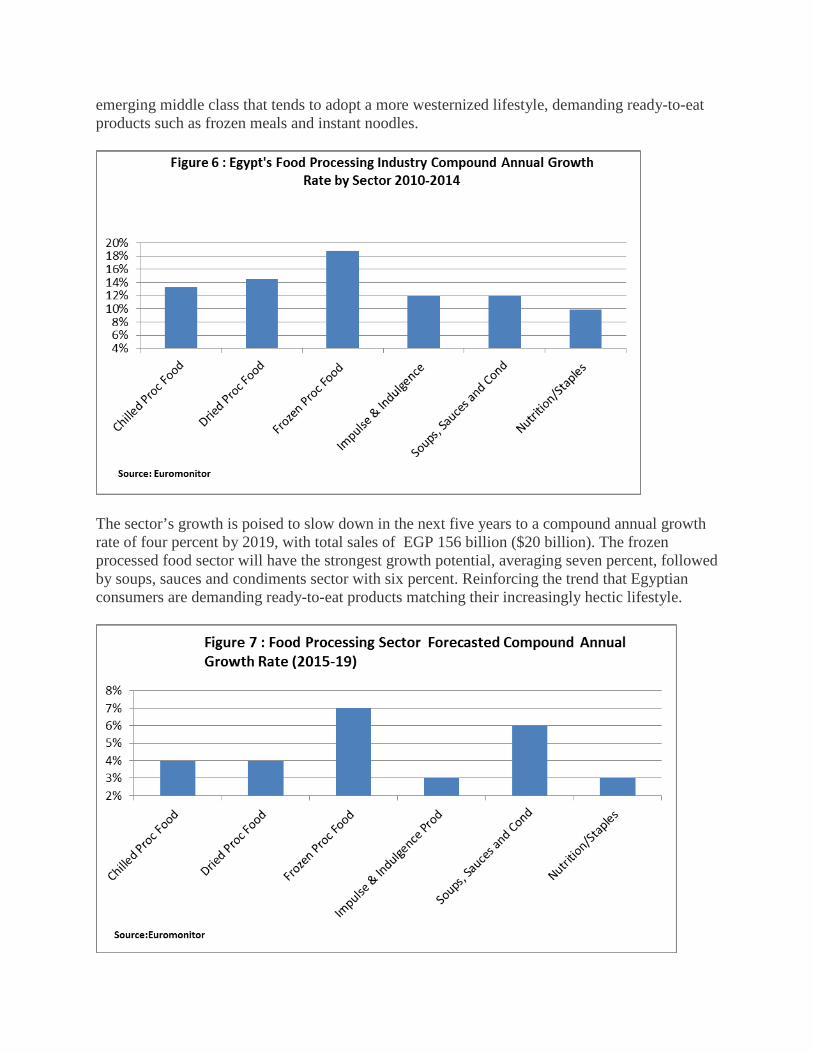
emerging middle class that tends to adopt a more westernized lifestyle, demanding ready-to-eat products such as frozen meals and instant noodles.
The sector’s growth is poised to slow down in the next five years to a compound annual growth rate of four percent by 2019, with total sales of EGP 156 billion ($20 billion). The frozen processed food sector will have the strongest growth potential, averaging seven percent, followed by soups, sauces and condiments sector with six percent. Reinforcing the trend that Egyptian consumers are demanding ready-to-eat products matching their increasingly hectic lifestyle.
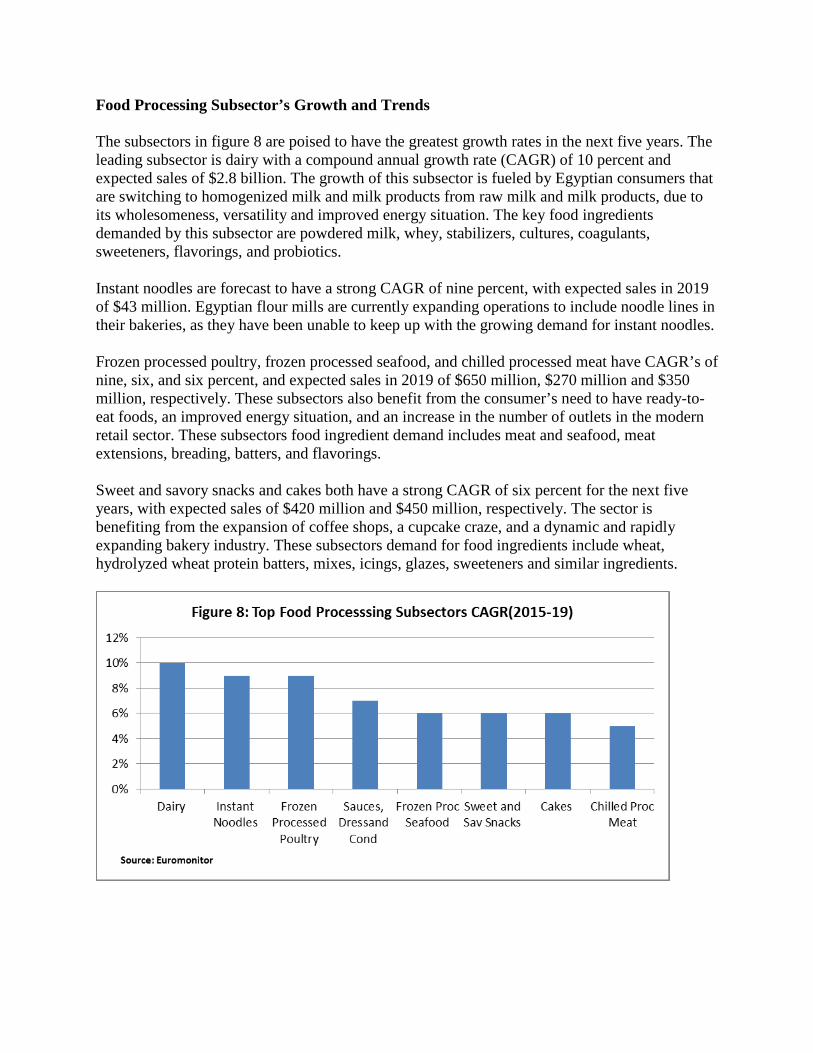
Food Processing Subsector’s Growth and Trends The subsectors in figure 8 are poised to have the greatest growth rates in the next five years. The leading subsector is dairy with a compound annual growth rate (CAGR) of 10 percent and expected sales of $2.8 billion. The growth of this subsector is fueled by Egyptian consumers that are switching to homogenized milk and milk products from raw milk and milk products, due to its wholesomeness, versatility and improved energy situation. The key food ingredients demanded by this subsector are powdered milk, whey, stabilizers, cultures, coagulants, sweeteners, flavorings, and probiotics. Instant noodles are forecast to have a strong CAGR of nine percent, with expected sales in 2019 of $43 million. Egyptian flour mills are currently expanding operations to include noodle lines in their bakeries, as they have been unable to keep up with the growing demand for instant noodles. Frozen processed poultry, frozen processed seafood, and chilled processed meat have CAGR’s of nine, six, and six percent, and expected sales in 2019 of $650 million, $270 million and $350 million, respectively. These subsectors also benefit from the consumer’s need to have ready-to-eat foods, an improved energy situation, and an increase in the number of outlets in the modern retail sector. These subsectors food ingredient demand includes meat and seafood, meat extensions, breading, batters, and flavorings. Sweet and savory snacks and cakes both have a strong CAGR of six percent for the next five years, with expected sales of $420 million and $450 million, respectively. The sector is benefiting from the expansion of coffee shops, a cupcake craze, and a dynamic and rapidly expanding bakery industry. These subsectors demand for food ingredients include wheat, hydrolyzed wheat protein batters, mixes, icings, glazes, sweeteners and similar ingredients.

Egypt’s Food Processing Sector’s Exports Over the five-year period ending in 2014, Egypt’s processed food sector’s exports were on a declining trend, exporting close to 23 percent of its production value in 2010 to 16 percent by 2014. Export growth was slow with a CAGR of 1.4 percent and an export value of $2.2 billion in 2014 (figure 9).
In 2014, Egypt’s top export destinations were mainly to its Arab neighbors and the Gulf (figure 10), with Saudi Arabia as its largest destination with $288 million, followed by Libya with an export value of $140 million and UAE with $104 million.

Egypt’s top processed product export was processed and unprocessed cheese with a value of $338 million, followed by chocolate and chocolate products with an export value of $145 million, and frozen vegetables with an export value of $135 million.
III. COMPETITION In 2014, the US was the third largest supplier of food ingredients to Egypt at a value of $128 million and a market share of 7 percent. The top suppliers were New Zealand and Thailand with a value of $298 and $175 million, respectively (figure 12).
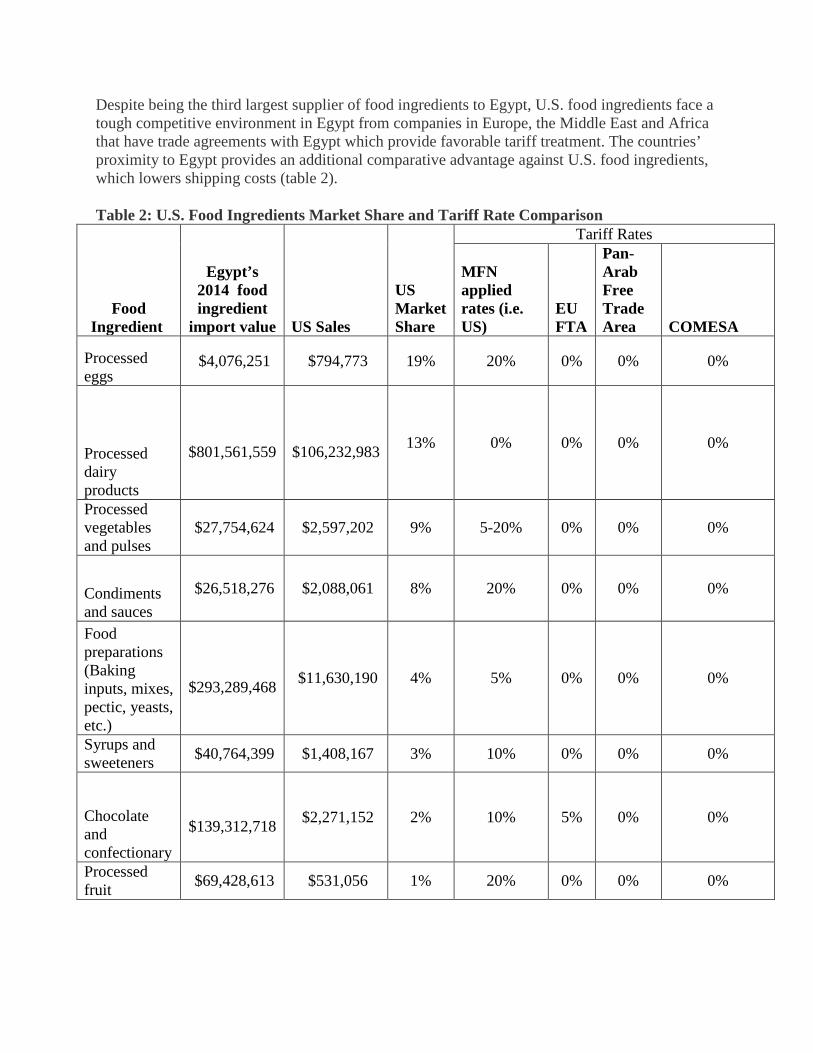
Despite being the third largest supplier of food ingredients to Egypt, U.S. food ingredients face a tough competitive environment in Egypt from companies in Europe, the Middle East and Africa that have trade agreements with Egypt which provide favorable tariff treatment. The countries’ proximity to Egypt provides an additional comparative advantage against U.S. food ingredients, which lowers shipping costs (table 2). Table 2: U.S. Food Ingredients Market Share and Tariff Rate Comparison
Tariff Rates
Food Ingredient
Egypt’s 2014 food ingredient
import value US Sales
US Market Share
MFN applied rates (i.e. US)
EU FTA
Pan-Arab Free Trade Area COMESA
Processed eggs
$4,076,251 $794,773 19% 20% 0% 0% 0%
Processed dairy products
$801,561,559
$106,232,983 13% 0% 0% 0% 0%
Processed vegetables and pulses
$27,754,624 $2,597,202 9% 5-20% 0% 0% 0%
Condiments and sauces
$26,518,276 $2,088,061 8% 20% 0% 0% 0%
Food preparations (Baking inputs, mixes, pectic, yeasts, etc.)
$293,289,468 $11,630,190 4% 5% 0% 0% 0%
Syrups and sweeteners $40,764,399 $1,408,167 3% 10% 0% 0% 0%
Chocolate and confectionary
$139,312,718 $2,271,152 2% 10% 5% 0% 0%
Processed fruit $69,428,613 $531,056 1% 20% 0% 0% 0%
Prepared or preserved meat
$52,855,995 $274,848 1% 20% 0% 0% 0%
Prepared or preserved seafood
$277,772,919 $372,338 0% 0% 0% 0% 0%
Spices
$113,082,544 $114,178 0% 2% 1.8% 0% 0%
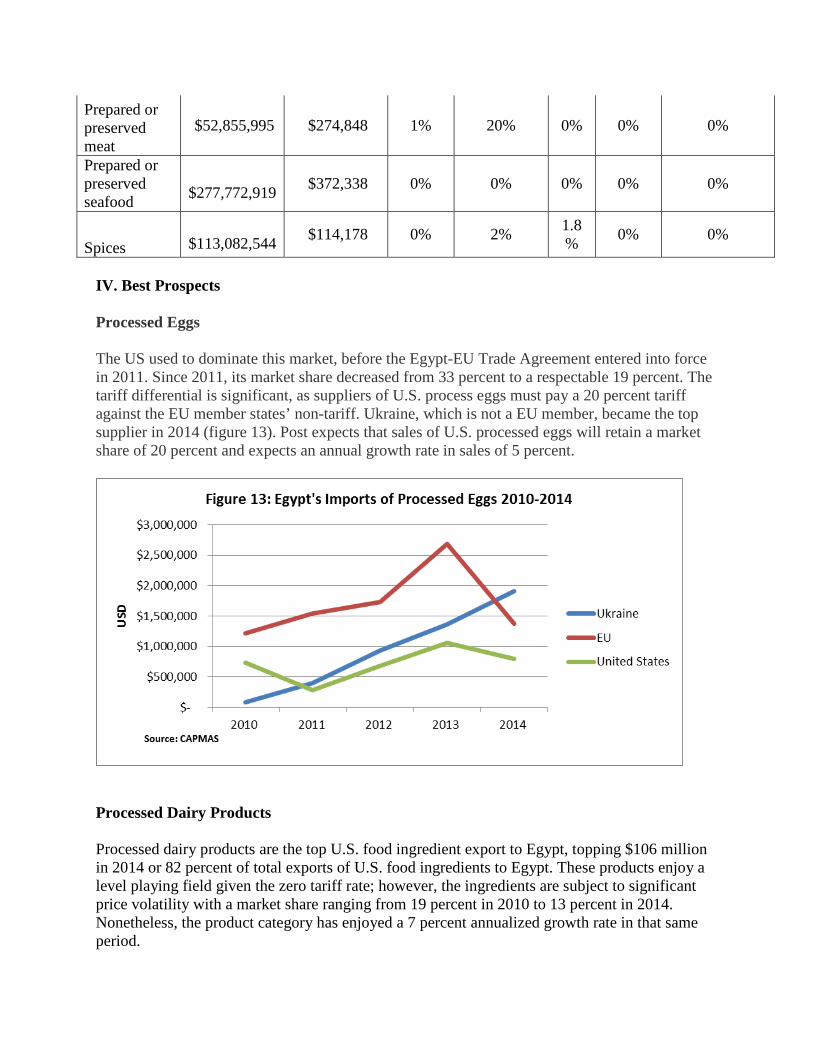
IV. Best Prospects Processed Eggs The US used to dominate this market, before the Egypt-EU Trade Agreement entered into force in 2011. Since 2011, its market share decreased from 33 percent to a respectable 19 percent. The tariff differential is significant, as suppliers of U.S. process eggs must pay a 20 percent tariff against the EU member states’ non-tariff. Ukraine, which is not a EU member, became the top supplier in 2014 (figure 13). Post expects that sales of U.S. processed eggs will retain a market share of 20 percent and expects an annual growth rate in sales of 5 percent.
Processed Dairy Products Processed dairy products are the top U.S. food ingredient export to Egypt, topping $106 million in 2014 or 82 percent of total exports of U.S. food ingredients to Egypt. These products enjoy a level playing field given the zero tariff rate; however, the ingredients are subject to significant price volatility with a market share ranging from 19 percent in 2010 to 13 percent in 2014. Nonetheless, the product category has enjoyed a 7 percent annualized growth rate in that same period.

The top U.S. dairy product imported by Egypt in 2014 was powdered milk and cream of not more than 1.5 percent fat content with a value of $40 million, followed by butter with a value of $35 million and, in third place, cheese with a value of $26 million (figure 14).
In the last five years the products with the highest annualized growth rates are whey, growing by an outstanding annualized growth rate of 44 percent from 2010 to 2014, followed by butter with a CAGR of 21 percent, and cheese with a CAGR of 4 percent in the same period (table 3). Post expects that whey and butter exports will continue to experience double-digit growth over the next five years. Table 3: Compounded Annualized Growth Rate of Egyptian Imports of U.S. Dairy Ingredients from 2010-2014.
Product Compound Annualized Growth Rate (2010-2014)
Powdered Milk and Cream not over 1.5 % fat 1% Butter 21% Cheese 4% Whey 44%
Processed Vegetables and Pulses Despite facing high tariffs vis-à-vis African, European and Middle East competitors, U.S. product in this category has been able to establish a niche market in Egypt’s food processing sector. The leading product by far was tomato paste with sales of $1.77 million in 2014, followed by preserved cucumbers at $216,000 and frozen leguminous vegetables at $129,000 (figure 15).
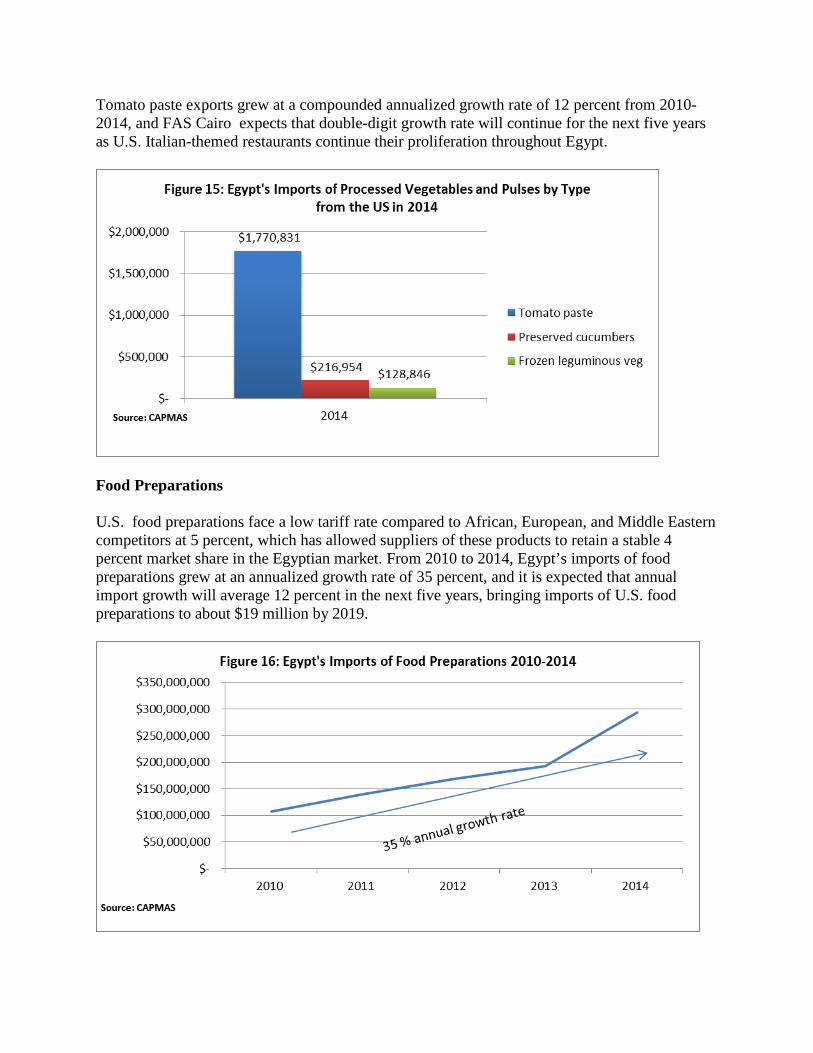
Tomato paste exports grew at a compounded annualized growth rate of 12 percent from 2010-2014, and FAS Cairo expects that double-digit growth rate will continue for the next five years as U.S. Italian-themed restaurants continue their proliferation throughout Egypt.
Food Preparations U.S. food preparations face a low tariff rate compared to African, European, and Middle Eastern competitors at 5 percent, which has allowed suppliers of these products to retain a stable 4 percent market share in the Egyptian market. From 2010 to 2014, Egypt’s imports of food preparations grew at an annualized growth rate of 35 percent, and it is expected that annual import growth will average 12 percent in the next five years, bringing imports of U.S. food preparations to about $19 million by 2019.

In 2014, the value of U.S. food preparations not specifically identified imported by Egypt was $5 million, followed by protein concentrates and textured protein at $3.9 million, and mixes and dough for bakers at $380,000.