
EGW Annual Water Outlook 2017 - East Gippsland Water · EAST GIPPPSLAND WATER ANNUAL WATER OUTLOOK:...
40
33 Macleod Street, PO Box 52, Bairnsdale Victoria 3875 T 03 5150 4444 F (03) 5150 4477 E [email protected] W www.egwater.vic.gov.au Annual Water Outlook November 2017 Final 2 EGW TRIM Ref: DOC/17/46815 Photo: Mitchell River near East Gippsland Water off-take at Glenaladale
Transcript of EGW Annual Water Outlook 2017 - East Gippsland Water · EAST GIPPPSLAND WATER ANNUAL WATER OUTLOOK:...

33 Macleod Street, PO Box 52, Bairnsdale Victoria 3875
T 03 5150 4444 F (03) 5150 4477
E [email protected] W www.egwater.vic.gov.au
Annual Water Outlook
November 2017
Final 2
EGW TRIM Ref: DOC/17/46815
Photo: Mitchell River near East Gippsland Water off-take at Glenaladale

EAST GIPPPSLAND WATER ANNUAL WATER OUTLOOK: 2017-2018
Nov 2017 Version: Final 2 Page ii of 40 EGW Doc Ref: DOC/17/46815

EAST GIPPPSLAND WATER ANNUAL WATER OUTLOOK: 2017-2018
Nov 2017 Version: Final 2 Page 3 of 40 EGW Doc Ref: DOC/17/46815
TABLE OF CONTENTS
EXECUTIVE SUMMARYEXECUTIVE SUMMARYEXECUTIVE SUMMARYEXECUTIVE SUMMARY ............................................................................................................................................................................................................................................................................................................................................................................................ 5555
1111 INTRODUCTIONINTRODUCTIONINTRODUCTIONINTRODUCTION ........................................................................................................................................................................................................................................................................................................................................................................................ 6666
1.1 WATER SYSTEMS .......................................................................................................................6
1.2 RECENT WATER NETWORK IMPROVEMENTS .................................................................................7
1.3 RAINFALLTRENDS .......................................................................................................................7
1.4 DEMAND TRENDS .................................................................................................................... 10
2222 CLIMATE OUTLOOKCLIMATE OUTLOOKCLIMATE OUTLOOKCLIMATE OUTLOOK ........................................................................................................................................................................................................................................................................................................................................................ 12121212
2.1 GENERAL TRENDS .................................................................................................................. 12
2.2 EAST GIPPSLAND OUTLOOK ..................................................................................................... 12
3333 MITCHELL SYSTEMMITCHELL SYSTEMMITCHELL SYSTEMMITCHELL SYSTEM ........................................................................................................................................................................................................................................................................................................................................................ 14141414
3.1 CURRENT WATER RESOURCE POSITION .................................................................................... 15
3.2 FORWARD OUTLOOK .............................................................................................................. 16
3.2.1 Raw water storage volumes ............................................................................................ 16
3.2.2 Treated water storage volumes ....................................................................................... 17
3.2.3 Overall outlook and probability of water restrictions ........................................................ 18
4444 ORBOSTORBOSTORBOSTORBOST ................................................................................................................................................................................................................................................................................................................................................................................................................................ 20202020
4.1 CURRENT WATER POSITION ..................................................................................................... 20
4.2 FORWARD OUTLOOK .............................................................................................................. 21
4.2.1 Short term strategy and 5 year plan ................................................................................ 21
4.2.2 Outlook ............................................................................................................................. 21
5555 MALLACOOTAMALLACOOTAMALLACOOTAMALLACOOTA ............................................................................................................................................................................................................................................................................................................................................................................................ 23232323
5.1 CURRENT WATER POSITION ..................................................................................................... 23
5.2 FORWARD OUTLOOK .............................................................................................................. 24
5.2.1 Short term strategy and 5 year plan ................................................................................ 24
5.2.2 Outlook ............................................................................................................................. 24
5.2.3 Actions ............................................................................................................................. 24
6666 DINNER PLAINDINNER PLAINDINNER PLAINDINNER PLAIN ........................................................................................................................................................................................................................................................................................................................................................................................ 25252525
6.1 CURRENT WATER POSITION ..................................................................................................... 25
6.2 FORWARD OUTLOOK .............................................................................................................. 26
6.2.1 Short term strategy and 5 year plan ................................................................................ 26
6.2.2 Outlook ............................................................................................................................. 26
7777 OMEOOMEOOMEOOMEO ............................................................................................................................................................................................................................................................................................................................................................................................................................................ 27272727
7.1 CURRENT WATER POSITION ..................................................................................................... 27
7.2 FORWARD OUTLOOK .............................................................................................................. 28
7.2.1 Short term strategy and 5 year plan ................................................................................ 28
7.2.2 Outlook ............................................................................................................................. 28
8888 SWIFTS CREEKSWIFTS CREEKSWIFTS CREEKSWIFTS CREEK .................................................................................................................................................................................................................................................................................................................................................................................... 29292929
8.1 CURRENT WATER POSITION ..................................................................................................... 29
8.2 FORWARD OUTLOOK .............................................................................................................. 30
8.2.1 Short term strategy and 5 year plan ................................................................................ 30
8.2.2 Outlook ............................................................................................................................. 30
9999 BUCHANBUCHANBUCHANBUCHAN ............................................................................................................................................................................................................................................................................................................................................................................................................................ 31313131
9.1 CURRENT WATER POSITION ..................................................................................................... 31
9.2 FORWARD OUTLOOK .............................................................................................................. 32

EAST GIPPPSLAND WATER ANNUAL WATER OUTLOOK: 2017-2018
Nov 2017 Version: Final 2 Page 4 of 40 EGW Doc Ref: DOC/17/46815
9.2.1 Short term strategy and 5 year plan ................................................................................ 32
9.2.2 Outlook ............................................................................................................................. 32
10101010 BEMM RIVERBEMM RIVERBEMM RIVERBEMM RIVER ................................................................................................................................................................................................................................................................................................................................................................................................ 33333333
10.1 CURRENT WATER POSITION ..................................................................................................... 33
10.2 FORWARD OUTLOOK .............................................................................................................. 34
10.2.1 Short term strategy and 5 year plan ............................................................................ 34
10.2.2 Outlook ........................................................................................................................ 34
11111111 CANN RIVERCANN RIVERCANN RIVERCANN RIVER .................................................................................................................................................................................................................................................................................................................................................................................................... 35353535
11.1 CURRENT WATER POSITION ..................................................................................................... 35
11.2 FORWARD OUTLOOK .............................................................................................................. 36
11.2.1 Short term strategy and 5 year plan ............................................................................ 36
11.2.2 Outlook ........................................................................................................................ 36
12121212 SHORT TERM ACTION PLSHORT TERM ACTION PLSHORT TERM ACTION PLSHORT TERM ACTION PLANANANAN .................................................................................................................................................................................................................................................................................................... 37373737
13131313 REFERENCESREFERENCESREFERENCESREFERENCES ............................................................................................................................................................................................................................................................................................................................................................................................ 40404040
Document Status
Rev No
Comments Issue Date Prepared By Approved By
Draft A Draft for internal comment
23/10/2017 Andrew Harrison Elaine Mowat
Final 1 Addressing internal review comments. Release to DELWP for review
1/11/2017 Andrew Harrison Elaine Mowat
Final 2 Addressing DELWP comments and up-dating with new BoM seasonal outlook
21/11/2017 Andrew Harrison Elaine Mowat
EAST GIPPPSLAND WATER ANNUAL WATER OUTLOOK: 2017-2018
Nov 2017 Version: Final 2 Page 5 of 40 EGW Doc Ref: DOC/17/46815
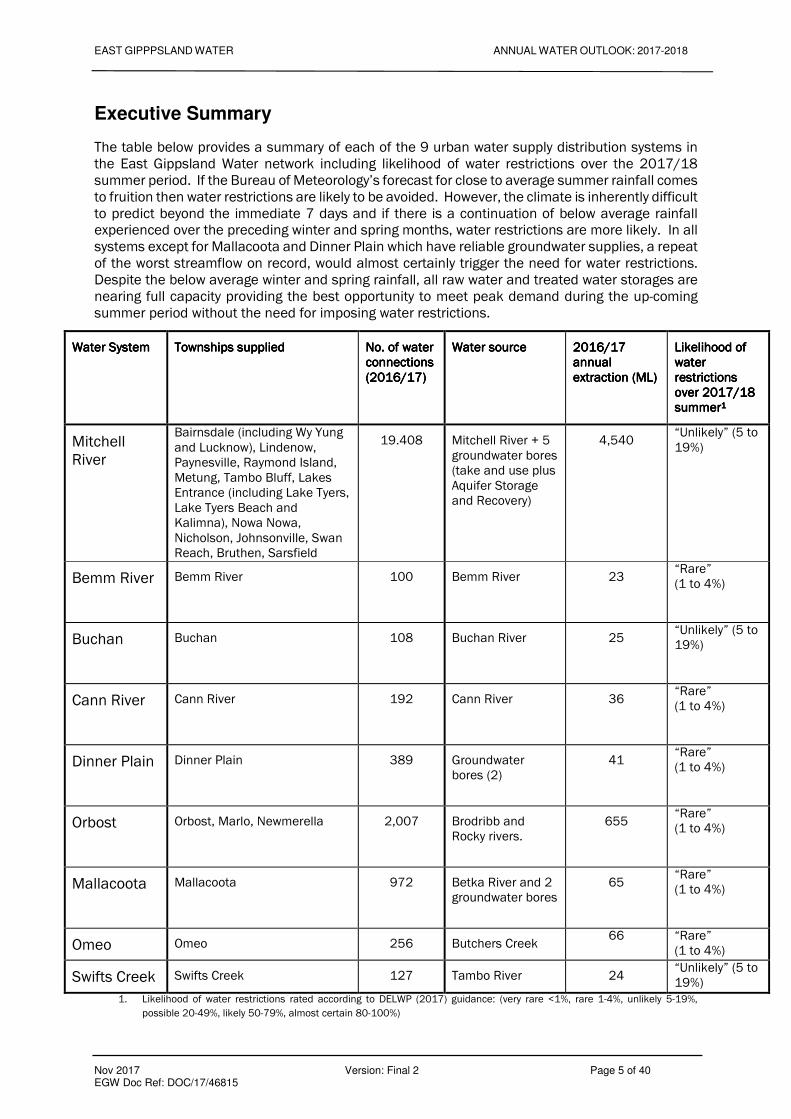
Executive Summary
The table below provides a summary of each of the 9 urban water supply distribution systems in the East Gippsland Water network including likelihood of water restrictions over the 2017/18 summer period. If the Bureau of Meteorology’s forecast for close to average summer rainfall comes to fruition then water restrictions are likely to be avoided. However, the climate is inherently difficult to predict beyond the immediate 7 days and if there is a continuation of below average rainfall experienced over the preceding winter and spring months, water restrictions are more likely. In all systems except for Mallacoota and Dinner Plain which have reliable groundwater supplies, a repeat of the worst streamflow on record, would almost certainly trigger the need for water restrictions. Despite the below average winter and spring rainfall, all raw water and treated water storages are nearing full capacity providing the best opportunity to meet peak demand during the up-coming summer period without the need for imposing water restrictions.
Water SystemWater SystemWater SystemWater System Townships suppliedTownships suppliedTownships suppliedTownships supplied No. of water No. of water No. of water No. of water connections connections connections connections (2016/17)(2016/17)(2016/17)(2016/17)
Water sourceWater sourceWater sourceWater source 2016/17 2016/17 2016/17 2016/17 annual annual annual annual extraction (ML)extraction (ML)extraction (ML)extraction (ML)
Likelihood of Likelihood of Likelihood of Likelihood of water water water water restrictions restrictions restrictions restrictions over 2017/18 over 2017/18 over 2017/18 over 2017/18 summersummersummersummer1111
Mitchell River
Bairnsdale (including Wy Yung and Lucknow), Lindenow, Paynesville, Raymond Island, Metung, Tambo Bluff, Lakes Entrance (including Lake Tyers, Lake Tyers Beach and Kalimna), Nowa Nowa, Nicholson, Johnsonville, Swan Reach, Bruthen, Sarsfield
19.408 Mitchell River + 5 groundwater bores (take and use plus Aquifer Storage and Recovery)
4,540 “Unlikely” (5 to 19%)
Bemm River
Bemm River 100 Bemm River
23 “Rare” (1 to 4%)
Buchan
Buchan 108 Buchan River 25 “Unlikely” (5 to 19%)
Cann River
Cann River 192 Cann River
36 “Rare” (1 to 4%)
Dinner Plain
Dinner Plain 389 Groundwater bores (2)
41 “Rare” (1 to 4%)
Orbost
Orbost, Marlo, Newmerella 2,007 Brodribb and Rocky rivers.
655 “Rare” (1 to 4%)
Mallacoota
Mallacoota 972 Betka River and 2 groundwater bores
65 “Rare” (1 to 4%)
Omeo Omeo 256 Butchers Creek 66 “Rare”
(1 to 4%)
Swifts Creek Swifts Creek 127 Tambo River 24 “Unlikely” (5 to 19%)
1. Likelihood of water restrictions rated according to DELWP (2017) guidance: (very rare <1%, rare 1-4%, unlikely 5-19%,
possible 20-49%, likely 50-79%, almost certain 80-100%)

EAST GIPPPSLAND WATER ANNUAL WATER OUTLOOK: 2017-2018
Nov 2017 Version: Final 2 Page 6 of 40 EGW Doc Ref: DOC/17/46815
1 Introduction
1.1 WATER SYSTEMS
East Gippsland Water operate nine separate potable water reticulation systems. The systems are a mixture of:
• Surface water (e.g. rivers, streams and creeks) supplied with off-stream storages (Bemm River, Buchan, Cann River, Orbost, Omeo and Swifts Creek systems);
• Mixture of surface water and groundwater supplied with off-stream storages (Mitchell River and Mallacoota systems); and,
• Groundwater supplied with above ground storage (Dinner Plain).
The towns provided with reticulated sewer and water services are shown in Figure 1-1. The Mitchell River Water Supply System is the largest in the East Gippsland Water region providing potable water to approximately 18,300 customers within major towns such as Bairnsdale, Lakes Entrance, Metung and Paynesville. All of the systems are independent of each other and none of the systems are connected to the Victoria Water grid.
FIGURE 1FIGURE 1FIGURE 1FIGURE 1----1: Towns supplied with reticulated sewer and water services1: Towns supplied with reticulated sewer and water services1: Towns supplied with reticulated sewer and water services1: Towns supplied with reticulated sewer and water services
Mitchell River Water Supply System
Orbost Water Supply System
Bemm River Water Supply System
Cann River Water Supply System
Mallacoota Water Supply System
Buchan Water Supply System
Swifts Ck Water Supply System
Omeo Water Supply System
Dinner Plain Water Supply System

EAST GIPPPSLAND WATER ANNUAL WATER OUTLOOK: 2017-2018
Nov 2017 Version: Final 2 Page 7 of 40 EGW Doc Ref: DOC/17/46815
1.2 RECENT WATER NETWORK IMPROVEMENTS
East Gippsland Water is continuously improving the water supply network including renewing aged assets and augmenting to cater for growth. The key improvements to the water network in 2016/17 included:
• Replacing 1km of water main in Calvert St, Bairnsdale and a 300m section of water main in Macleod St, Bairnsdale
• Commencing the replacement of 500m of water main pipeline in Main Street, Bairnsdale. This project is now nearing completion as at October 2017.
• Realigning 200m of water main in Tamhaven Drive, Swan Reach
• A number of improvements at the Wy Yung treated water storage site at Bairnsdale including: o Installation of two 400KL tanks to supplement the covered storage o Construction of a bypass of the Wy Yung storage making it easier to conduct maintenance activities at the site without disrupting downstream customers;
o Re-alignment of 500m of the Wy Yung to Sarsfield transfer main o Planning for the replacement of the Wy Yung Number 1 storage which has developed a leak in the liner
• Installation of an innovative cover over the 10ML raw water storage basin at Omeo comprising thousands of interlocking floating hexagonal discs designed to reduce the potential for airborne and algal contamination of the stored water while also reducing evaporation.
In addition, the following works are currently being planned and will be completed by the end of 2017/18:
• Bemm River: Installation of a 500KL treated water storage tank and conversion of the current open treated water storage to a raw water storage basin
• Cann River: Installation of a 350KL treated water storage tank
• Buchan: Refurbishment and/or replacement of a number of treated water storage tanks
• Omeo: Installation of a 200KL treated water storage tank
1.3 RAINFALLTRENDS
Figures 1-2 to 1-5 show the deviation from mean monthly rainfall over the last 12 months for Bairnsdale, Orbost, Mallacoota and Omeo respectively. The graphs show that the preceding winter months have been consistently below average. However, despite below average rainfall, there has generally been sufficient river flow and/or groundwater supply to ensure that water storage levels are approaching full supply levels as demonstrated in the storage volumes stated in Sections 3 to 11.

EAST GIPPPSLAND WATER ANNUAL WATER OUTLOOK: 2017-2018
Nov 2017 Version: Final 2 Page 8 of 40 EGW Doc Ref: DOC/17/46815
FIGURE 1FIGURE 1FIGURE 1FIGURE 1----2: Bairnsdale: Deviation from mean monthly rainfall for 12 month period to 2: Bairnsdale: Deviation from mean monthly rainfall for 12 month period to 2: Bairnsdale: Deviation from mean monthly rainfall for 12 month period to 2: Bairnsdale: Deviation from mean monthly rainfall for 12 month period to Sept 2017Sept 2017Sept 2017Sept 2017
FIGUREFIGUREFIGUREFIGURE 1111----3333: : : : OrbostOrbostOrbostOrbost: Deviation from mean monthly rainfall for 12 month period to Sept : Deviation from mean monthly rainfall for 12 month period to Sept : Deviation from mean monthly rainfall for 12 month period to Sept : Deviation from mean monthly rainfall for 12 month period to Sept 2017201720172017

EAST GIPPPSLAND WATER ANNUAL WATER OUTLOOK: 2017-2018
Nov 2017 Version: Final 2 Page 9 of 40 EGW Doc Ref: DOC/17/46815
FIGUREFIGUREFIGUREFIGURE 1111----4444: : : : MallacootaMallacootaMallacootaMallacoota: Deviation from : Deviation from : Deviation from : Deviation from mean monthly rainfall for 12 month period to mean monthly rainfall for 12 month period to mean monthly rainfall for 12 month period to mean monthly rainfall for 12 month period to Sept 2017Sept 2017Sept 2017Sept 2017
FIGUREFIGUREFIGUREFIGURE 1111----5555: : : : OmeoOmeoOmeoOmeo: Deviation from mean monthly rainfall for 12 month period to Sept : Deviation from mean monthly rainfall for 12 month period to Sept : Deviation from mean monthly rainfall for 12 month period to Sept : Deviation from mean monthly rainfall for 12 month period to Sept 2017201720172017

EAST GIPPPSLAND WATER ANNUAL WATER OUTLOOK: 2017-2018
Nov 2017 Version: Final 2 Page 10 of 40 EGW Doc Ref: DOC/17/46815
1.4 DEMAND TRENDS
The demand for all systems over time is shown in Table 1-1. The water use per connection for residential and non-residential use is shown in Figure 1-6 while the residential demand per person is shown in Figure 1-7 (assuming an average 2.27 people per household (.ID, 2017)). The data shows that although the total use has been steadily increasing over time, the use per connection and per person has shown a decreasing trend over time. However, in contrast to the longer term trend, there has been a slight increase in per connection residential use over the last 3 years. TABLE 1TABLE 1TABLE 1TABLE 1----1: Wa1: Wa1: Wa1: Water demand over time for all 9 water systemster demand over time for all 9 water systemster demand over time for all 9 water systemster demand over time for all 9 water systems

EAST GIPPPSLAND WATER ANNUAL WATER OUTLOOK: 2017-2018
Nov 2017 Version: Final 2 Page 11 of 40 EGW Doc Ref: DOC/17/46815
FIGURE 1FIGURE 1FIGURE 1FIGURE 1----6: Annual 6: Annual 6: Annual 6: Annual residential and nonresidential and nonresidential and nonresidential and non----residential residential residential residential water use per connection over water use per connection over water use per connection over water use per connection over timetimetimetime
FIGUREFIGUREFIGUREFIGURE 1111----7777: Annual: Annual: Annual: Annual residential water use per personresidential water use per personresidential water use per personresidential water use per person

EAST GIPPPSLAND WATER ANNUAL WATER OUTLOOK: 2017-2018
Nov 2017 Version: Final 2 Page 12 of 40 EGW Doc Ref: DOC/17/46815
2 Climate Outlook
2.1 GENERAL TRENDS
Victoria’s climate has shown a warming and drying trend over recent decades, and this trend is expected to continue. In comparison to historical conditions we are already experiencing:
• Higher temperatures, particularly during the warmer months of the year;
• Reductions in rainfall in autumn and early winter, and in some locations, increases in rainfall during the warmer months; and,
• In some catchments, less streamflow is generated for the same amount of rain.
The decline in rainfall during autumn and early winter is associated with a southerly shift in rain bearing weather systems. Global warming is a contributor to this southerly shift, which means that the downward trend is likely to continue.
Over the longer term, modelling indicates that we can expect:
• the rainfall reductions in autumn and winter to remain, or become drier still;
• reductions in spring rainfall but possible increases in summer rainfall; and,
• overall reductions in streamflow.
Even if there is an increase in summer rainfall, it is unlikely to offset the streamflow impact of rainfall reductions in other seasons.
Although there will still be a lot of variability in Victoria’s climate, the chances of experiencing cooler conditions and higher than average streamflow is lower now than it was in previous decades. Conversely, the chances of experiencing warmer conditions and less streamflow is now higher than in past decades.
The Bureau of Meteorology seasonal climate outlooks build in the influence of changes in climate that have already occurred.
More information on the observed changes and longer-term future climate projections can be found at https://www.water.vic.gov.au/climate-change
The Victorian Government is investing in further research to better understand how Victoria’s climate is changing and the water resource implications, as part of implementing Water for Victoria.
2.2 EAST GIPPSLAND OUTLOOK
The Bureau of Meteorology’s climate outlook provides the following summary for the period Dec 2017 to Feb 2018:
Australia's major climate drivers are neutral, but a La Niña watch remains in place due to recent cooling in the eastern tropical Pacific. Sea surface temperature patterns in the western Pacific and eastern Indian Ocean are not typical of La Niña, and are counteracting its normally wet signal. (Bureau of Meteorology, 2017)

EAST GIPPPSLAND WATER ANNUAL WATER OUTLOOK: 2017-2018
Nov 2017 Version: Final 2 Page 13 of 40 EGW Doc Ref: DOC/17/46815
Figures 2.1 and 2.2 show the Bureau of Meteorology’s predicted likelihood of above average rainfall and above average maximum temperatures for the period Dec 2017 to Feb 2018 respectively. The information suggests that rainfall is likely to be close to average with a 65% to 70% chance of above average maximum temperatures.
The regional climate outlook suggests that although there is a strong likelihood that summer surface water flows used for supply sources across the network are likely to be close to average, demand resulting from higher temperatures may also be higher. Also, river flows are also likely to be influenced by the melt from greater than average snowfalls during the winter/spring period.
FIGURE 2FIGURE 2FIGURE 2FIGURE 2----1: Predicted probability of abov1: Predicted probability of abov1: Predicted probability of abov1: Predicted probability of above median raie median raie median raie median rainfall for period Dec 2017 to Febnfall for period Dec 2017 to Febnfall for period Dec 2017 to Febnfall for period Dec 2017 to Feb 2018 (Bureau of Meteorology2018 (Bureau of Meteorology2018 (Bureau of Meteorology2018 (Bureau of Meteorology prediction issued 16prediction issued 16prediction issued 16prediction issued 16thththth NovNovNovNov, 2017), 2017), 2017), 2017)....

EAST GIPPPSLAND WATER ANNUAL WATER OUTLOOK: 2017-2018
Nov 2017 Version: Final 2 Page 14 of 40 EGW Doc Ref: DOC/17/46815
FIGURE 2FIGURE 2FIGURE 2FIGURE 2----2222: Predicted probabi: Predicted probabi: Predicted probabi: Predicted probability of exceeding median maximum temperature for period lity of exceeding median maximum temperature for period lity of exceeding median maximum temperature for period lity of exceeding median maximum temperature for period Dec 2017 to FebDec 2017 to FebDec 2017 to FebDec 2017 to Feb 2018 (2018 (2018 (2018 (Bureau of MeteorologyBureau of MeteorologyBureau of MeteorologyBureau of Meteorology prediction issued 16prediction issued 16prediction issued 16prediction issued 16thththth NovNovNovNov, 2017, 2017, 2017, 2017))))....

EAST GIPPPSLAND WATER ANNUAL WATER OUTLOOK: 2017-2018
Nov 2017 Version: Final 2 Page 15 of 40 EGW Doc Ref: DOC/17/46815
3 Mitchell System
3.1 CURRENT WATER RESOURCE POSITION
Towns suppliedTowns suppliedTowns suppliedTowns supplied: : : : Bairnsdale, Wy Yung, Lucknow, Paynesville, Metung, Lakes Entrance, Nowa Nowa, Nicholson, Johnsonville, Swan Reach, Bruthen, Sarsfield
System configurationSystem configurationSystem configurationSystem configuration
Water from the Mitchell River and 5 groundwater bores is treated at the Woodglen Water Treatment Plant at a rate of up to 20ML/d using a dissolved air flotation and filtration process (DAFF). Treated water is piped to a number of balancing storages before being distributed to various reticulated networks.
Number of connections (2016/17)Number of connections (2016/17)Number of connections (2016/17)Number of connections (2016/17):::: 19,408
Water Source: Water Source: Water Source: Water Source:
• Mitchell River: Bulk Entitlement: 9,208ML/yr
• 5 groundwater bores at Woodglen: o Aquifer Storage and Recovery Licence: Injected volume up to a max.
of 200ML/yr o Conventional take and use licence: 171ML/yr
200ML/yr ASR + 171ML/yr take and use

EAST GIPPPSLAND WATER ANNUAL WATER OUTLOOK: 2017-2018
Nov 2017 Version: Final 2 Page 16 of 40 EGW Doc Ref: DOC/17/46815
• TOTAL:TOTAL:TOTAL:TOTAL: 9,579ML/yr9,579ML/yr9,579ML/yr9,579ML/yr
Annual extraction (2016/17): Annual extraction (2016/17): Annual extraction (2016/17): Annual extraction (2016/17):
• Mitchell River: 4,537ML
• Groundwater bores: 3ML
• TOTAL:TOTAL:TOTAL:TOTAL: 4,540ML4,540ML4,540ML4,540ML
Main storage capacityMain storage capacityMain storage capacityMain storage capacity::::
• Raw Water: o Woodglen 1: 813ML o Woodglen 2: 713ML o Aquifer storage: 200ML TOTAL: TOTAL: TOTAL: TOTAL: 1,7261,7261,7261,726MLMLMLML
• Treated water: o Wy Yung 1: 88ML o Lindenow: 13ML o Sarsfield Tank: 6ML o Eagle Point Tanks: 12ML o Metung Tanks: 4.5ML o Sunlakes Reservoir: 48ML o Merrangbaur Reservoir: 4.5ML TOTAL: TOTAL: TOTAL: TOTAL: 176ML176ML176ML176ML
Oct 2017 Storage volumes:Oct 2017 Storage volumes:Oct 2017 Storage volumes:Oct 2017 Storage volumes:
• Raw water: o Surface storage: 1,449ML (95% full) o Groundwater storage: 2ML (1% full)
• Treated water: 159ML (95% full)
DemandDemandDemandDemand::::
• Actual 2016/17 demand: 4,210ML
• Forecast 2017/18 demand: 4,273ML
• Assumed annual growth rate: 1.5%pa
3.2 FORWARD OUTLOOK
3.2.1 Raw water storage volumes
Short term sShort term sShort term sShort term strategy:trategy:trategy:trategy:
Figure 3-1 shows the daily Mitchell River flow over the last 12 months plotted against average flow over the entire period of record dating back to 1937. The data clearly shows the below average flows during the February to July period resulting in periods of restricted pumping as per the bulk entitlement rules. Current flows (to the end of Oct 2017) are also below average and unless there is significant rainfall over the November/ December period, is also likely to be tracking towards restricted pumping.
During the autumn months, the storage volume of water in the two Woodglen storages was drawn down to allow maintenance activities and a turnover of the water to prevent blue-green algae outbreaks. During the winter and spring months, the volumes in storage were increased to the current 82% full levels to ensure sufficient capacity to cater for the up-coming high demand summer period. The Woodglen storages will continue to be filled to be as close to 100% capacity as possible.

EAST GIPPPSLAND WATER ANNUAL WATER OUTLOOK: 2017-2018
Nov 2017 Version: Final 2 Page 17 of 40 EGW Doc Ref: DOC/17/46815
In addition, water from the Mitchell River is currently being injected into five groundwater bores in the Woodglen area as an additional storage of raw water. The recently renewed “aquifer storage and recovery” groundwater licence allows up to 200ML to be stored in the aquifer for later use when needed. The new condition of the licence to transfer 95% of the un-used portion of the injected water in any one year to the following year provides added incentive to inject the maximum possible volume of water (the previous licence conditions prevented any carry over of injected water to subsequent years meaning usable injection volumes were effectively re-set to zero at the start of each year). 5 year plan5 year plan5 year plan5 year plan The following projects are scheduled for the period up to June 2023 to address projected deficiencies in the raw water storages:
• Woodglen dam safety up-grades
• Options analysis to determine most cost efficient approach to addressing identified future need for additional raw water storage and/or supply
OutloOutloOutloOutlook:ok:ok:ok: Figure 3-2 shows the actual raw water storage volumes since the beginning of 2017 and the predicted raw water storage volumes for a number of Mitchell River flow scenarios including average flows, 5th percentile flows and lowest October to March flows on record (occurred in 1967). Figure 3-2 also shows the current guideline storage volumes for the imposition of Stage 1 to 4 water restrictions. The predicted flows take into account the river extraction rules as stated in the East Gippsland Water Mitchell River Bulk Entitlement and the average monthly demand. There is no allowance for a reduction in demand resulting from imposing water restrictions so the predictions can be considered to be conservative. The information in Figure 3-2 shows that:
• For Mitchell River flows greater than the 10th percentile of historic flows, the supply and demand over the up-coming summer period is approximately balanced with raw water storage remaining at or close to capacity;
• If Mitchell River flows are at the 5th percentile of historic flows, the guideline trigger levels for Stage 2 water restrictions are likely to be reached. The average frequency of such events of one in 20 years is within the guideline frequency for imposing Stage 1 or 2 restrictions of no more than 1 in 10 years.
• Stage 4 water restriction triggers are only likely to be reached if river flows are the lowest on the record or there is a catastrophic water quality event preventing any extraction from the river (such as occurred in the high turbidity event of 2007).
3.2.2 Treated water storage volumes
Short term sShort term sShort term sShort term strategy:trategy:trategy:trategy: Treated water storage volumes are being filled to as close to capacity as possible in preparation for the up-coming summer period. Planning is underway to replace Wy Yung 1 storage which has a known leak in the liner. Currently, the Wy Yung 1 storage leakage has stabilised and is expected to continue to provide close to 80ML of usable treated storage in the short term while design and construction of a replacement is underway. A number of contingencies have been enacted in case of any acceleration of leakage issues including:
• The construction of a bypass around the Wy Yung storage allowing the network to continue operating without the Wy Yung storage. Construction of the bypass is complete and it is currently being commissioned.
• The development of an emergency supply management plan (in progress) to ensure peak demand can continue to be met including the operation of the bypass, careful management of other clear water storages and water restrictions (as a last resort).

EAST GIPPPSLAND WATER ANNUAL WATER OUTLOOK: 2017-2018
Nov 2017 Version: Final 2 Page 18 of 40 EGW Doc Ref: DOC/17/46815
5 year plan5 year plan5 year plan5 year plan The following projects are scheduled for the period up to June 2023 to address projected deficiencies in the treated water network:
• Replacement of Wy Yung 1 storage
• Additional treated water storage at Sarsfield
• Covered treated water storage to replace open storage at Lindenow
• Planning for additional clear water storage and/or up-grade of Woodglen Water Treatment Plan capacity (implementation planned for 2023 to 2028)
• Bairnsdale to Eagle Point Main Supply Pipeline up-grade
• Sarsfield to Johnsonville Main Supply Pipeline up-grade Outlook: Outlook: Outlook: Outlook:
The recently completed Mitchell Water Network Master Plan showed that the current clear water storage volumes and pipeline transfer capacity is sufficient to meet the internal guideline that all treated water storages are at least 50% full at the end of a peak week (Stantec, 2017). This conclusion is based on at least 60ML of storage available at Wy Yung. Although the leakage at the Wy Yung 1 Basin has stabilised to a manageable level allowing 80ML of storage, in the unlikely event that leakage rates accelerates over the summer period, then there are a number of options available as detailed above to ensure summer demand can still be met (including imposing water restrictions as a last resort).
3.2.3 Overall outlook and probability of water restrictions
Given that modelling indicates that the guideline triggers for water restrictions are likely to be met when the Mitchell River flows are approximately at the 5th percentile of historical flows or below, the likelihood of water restrictions is rated at the lowest end of “unlikely” (5 to 19%) using the DELWP (2017) grading system.
FIGURE 3FIGURE 3FIGURE 3FIGURE 3----1: Mitchell River at Glenaladale daily flow over last 12 month period co1: Mitchell River at Glenaladale daily flow over last 12 month period co1: Mitchell River at Glenaladale daily flow over last 12 month period co1: Mitchell River at Glenaladale daily flow over last 12 month period compared mpared mpared mpared to average flowto average flowto average flowto average flow

EAST GIPPPSLAND WATER ANNUAL WATER OUTLOOK: 2017-2018
Nov 2017 Version: Final 2 Page 19 of 40 EGW Doc Ref: DOC/17/46815
FIGURE 3FIGURE 3FIGURE 3FIGURE 3----2222: Historical and predicted future Woodglen raw water storage levels: Historical and predicted future Woodglen raw water storage levels: Historical and predicted future Woodglen raw water storage levels: Historical and predicted future Woodglen raw water storage levels

EAST GIPPPSLAND WATER ANNUAL WATER OUTLOOK: 2017-2018
Nov 2017 Version: Final 2 Page 20 of 40 EGW Doc Ref: DOC/17/46815
4 Orbost
4.1 CURRENT WATER POSITION
Towns supplied: Towns supplied: Towns supplied: Towns supplied: Orbost, Marlo, Newmerella
System configuration: System configuration: System configuration: System configuration:
Number of connections (2016/17):Number of connections (2016/17):Number of connections (2016/17):Number of connections (2016/17): 2,007
Water Source: Water Source: Water Source: Water Source:
Brodribb and Rocky River: Bulk Entitlement: 2,031ML/yr
Annual extraction (2016/17): Annual extraction (2016/17): Annual extraction (2016/17): Annual extraction (2016/17): 655ML
Main storage capacity:Main storage capacity:Main storage capacity:Main storage capacity:

EAST GIPPPSLAND WATER ANNUAL WATER OUTLOOK: 2017-2018
Nov 2017 Version: Final 2 Page 21 of 40 EGW Doc Ref: DOC/17/46815
• Raw Water: 6ML
• Treated water: 45ML
Oct 2017 Storage volumes:Oct 2017 Storage volumes:Oct 2017 Storage volumes:Oct 2017 Storage volumes:
• Raw water: 5.1ML (85%)
• Treated water: 40.4ML (90%)
Demand:Demand:Demand:Demand:
• Actual 2016/17 demand: 640ML
• Forecast 2017/18 demand: 644ML
• Assumed annual growth rate: 0.6%pa
4.2 FORWARD OUTLOOK
4.2.1 Short term strategy and 5 year plan
The strategy to ensure demand can be met over the up-coming summer is to ensure that all storages are as full as possible. Although the condition of the Rocky River pipeline is deteriorating, the Urban Water Strategy recommends that the pipeline be maintained in the short term until an options analysis is undertaken of the Mitchell River system to determine whether transporting water from the Orbost system to Lakes Entrance is desirable (EGW, 2017).
In the longer term, a new clear water storage tank is planned for the period 2018 to 2023 to ensure peak demands can continue to be met.
4.2.2 Outlook
Flow in the Brodribb River in particular is reliable and imposition of water restrictions has been rare (2 instances since 1973). Flow in the Rocky River is less reliable and is considered a supplementary source. Figure 4-1 shows that over the period 1975 to June 2015, flows in the Brodribb River have never exceeded the limit for a reduction in pumping under the Bulk Entitlement rules. The minimum flow recorded over the entire period of record dating back to 1922 is 16.4 ML/day in Feb 2010 followed by 17.0 ML/day in Feb 2007 which is well in excess of the 5.74ML/d trigger for a reduction in pumping. Annual extraction volumes are currently well below the maximum allowable in the bulk entitlement and are likely to remain so for the foreseeable future.
Given the historical flow record, the conditions of the bulk entitlement and close to average rainfall outlook, the likelihood of water restrictions over the up-coming summer period is rated as “rare” (1 to 4%) using the DELWP (2017) grading system.

EAST GIPPPSLAND WATER ANNUAL WATER OUTLOOK: 2017-2018
Nov 2017 Version: Final 2 Page 22 of 40 EGW Doc Ref: DOC/17/46815
FIGURE 4FIGURE 4FIGURE 4FIGURE 4----1: 1: 1: 1: Brodribb River flow exceedance Brodribb River flow exceedance Brodribb River flow exceedance Brodribb River flow exceedance –––– 1975 to 20151975 to 20151975 to 20151975 to 2015

EAST GIPPPSLAND WATER ANNUAL WATER OUTLOOK: 2017-2018
Nov 2017 Version: Final 2 Page 23 of 40 EGW Doc Ref: DOC/17/46815
5 Mallacoota
5.1 CURRENT WATER POSITION
Towns supplied: Towns supplied: Towns supplied: Towns supplied: Mallacoota
System configuration: System configuration: System configuration: System configuration:
Number of connections (2016/17):Number of connections (2016/17):Number of connections (2016/17):Number of connections (2016/17): 972
Water Source: Water Source: Water Source: Water Source:
• Betka River; Bulk Entitlement: 330ML
• 2 groundwater bores; licence volume: 220ML TOTAL:TOTAL:TOTAL:TOTAL: 555555550ML0ML0ML0ML
Annual extraction (2016/17): Annual extraction (2016/17): Annual extraction (2016/17): Annual extraction (2016/17):
• Surface water: 65ML
• Groundwater: 80ML TOTAL:TOTAL:TOTAL:TOTAL: 145ML145ML145ML145ML
Main storage capacity:Main storage capacity:Main storage capacity:Main storage capacity:
• Raw Water: 41ML
• Treated water: 23ML TOTALTOTALTOTALTOTAL:::: 64ML64ML64ML64ML
Oct 2017 Storage volumes:Oct 2017 Storage volumes:Oct 2017 Storage volumes:Oct 2017 Storage volumes:
• Raw water: 38.6ML (94%)
• Treated water: 22.5ML (97%) TOTAL:TOTAL:TOTAL:TOTAL: 66661.1ML1.1ML1.1ML1.1ML (95%)(95%)(95%)(95%)
Demand:Demand:Demand:Demand:

EAST GIPPPSLAND WATER ANNUAL WATER OUTLOOK: 2017-2018
Nov 2017 Version: Final 2 Page 24 of 40 EGW Doc Ref: DOC/17/46815
• Actual 2016/17 demand: 144ML
• Forecast 2017/18 demand: 145ML
• Assumed annual growth rate: 1.1%pa
5.2 FORWARD OUTLOOK
5.2.1 Short term strategy and 5 year plan
The strategy to ensure demand can be met over the up-coming summer is to ensure that all storages are as full as possible and that groundwater and surface water pumps are maintained in working order.
Over the longer term, a replacement treated water storage is planned for the period 2018 to 2023 to reduce the risk of contamination.
5.2.2 Outlook
The security of supply to Mallacoota has greatly improved in recent years with the addition of supply from two groundwater bores to supplement the Betka River water source. Limited historical river flow data suggests that flow in the Betka River is below the trigger level for reduced pumping as stated in the bulk entitlement approximately 38% of the time with cease to flow approximately 8% of the time. Groundwater is a more reliable source with both bores being pumped at a rate of approximately 12l/s intermittently without any long term impact on groundwater levels (EGW, 2017).
A spreadsheet water balance developed as part of the Urban Water Strategy showed that volumes available to extract from the Betka River based on bulk entitlement rules combined with allowable groundwater extraction volumes is sufficient to ensure storages are kept at or near capacity even during peak summer months. However, the analysis is based on a limited historical river dataset and does not reflect the long term variability in river flow. To test the impact of river variability, a zero river flow was simulated for the summer period and the spreadsheet model suggested that groundwater supply alone is sufficient to cater for current summer demands.
Given the flexibility of having a climate independent groundwater supply in addition to a surface water supply combined with a close to average rainfall outlook and storage capacity, the likelihood of water restrictions in the coming summer period is rated as “rare” (1 to 4%) using the DELWP (2017) grading system.
5.2.3 Actions
The key short term actions to ensure on-going security of supply are:
• To agree with Southern Rural Water on the conditions of a single groundwater licence amalgamating two previous licences. East Gippsland Water is currently discussing this issue with Southern Rural Water

EAST GIPPPSLAND WATER ANNUAL WATER OUTLOOK: 2017-2018
Nov 2017 Version: Final 2 Page 25 of 40 EGW Doc Ref: DOC/17/46815
6 Dinner Plain
6.1 CURRENT WATER POSITION
Towns supplied: Towns supplied: Towns supplied: Towns supplied: Dinner Plain
System configuration: System configuration: System configuration: System configuration:
Number of connections (2016/17):Number of connections (2016/17):Number of connections (2016/17):Number of connections (2016/17): 389
Water Source: Water Source: Water Source: Water Source:
• 2 groundwater bores; licence volume: 120ML
Annual extraction (2016/17): Annual extraction (2016/17): Annual extraction (2016/17): Annual extraction (2016/17):
• 2 groundwater bores: 41ML
Main storage capacity:Main storage capacity:Main storage capacity:Main storage capacity:
• Raw Water: 0.6ML
Oct 2017 Storage volumes:Oct 2017 Storage volumes:Oct 2017 Storage volumes:Oct 2017 Storage volumes:
• Raw water: 0.6ML (98%)
Demand:Demand:Demand:Demand:
• Actual 2016/17 demand: 41ML
• Forecast 2017/18 demand: 41ML
• Assumed annual growth rate: 0.32%pa

EAST GIPPPSLAND WATER ANNUAL WATER OUTLOOK: 2017-2018
Nov 2017 Version: Final 2 Page 26 of 40 EGW Doc Ref: DOC/17/46815
6.2 FORWARD OUTLOOK
6.2.1 Short term strategy and 5 year plan
Peak demand occurs in the winter snow season which is currently nearing completion. A recent analysis of the Dinner Plain bores showed that the combination of an increased population during the ski season and snow making had put significant stress on the two water supply bores (DOC/17/35726). The current rate of pumping results in groundwater levels not recovering to their pre-pumping water level during periods of non-pumping which is likely to result in reduced yields in the short term. A recommendation was made to formalise the arrangement with the Mt Hotham Ski Company to restrict snow making to 6 days a week only allowing a day a week for the bore water levels to recover.
The key strategy to ensure peak winter demands are met is to:
• Ensure the 600KL raw water storage is kept as full as possible;
• Agree with the Mt Hotham Ski Company on snow making practices to ensure periods of bore water level recovery;
• Reduce water leakage (particularly high when compared to other systems in the network)
Pumping tests of the two bores are planned for the 2018 to 2023 period to allow analysis of whether a third supply bore is needed.
6.2.2 Outlook
Given the two groundwater bores at Dinner Plain are a relatively climate independent source, predictions on supply meeting demand have significantly greater certainty than for a surface water source. A spreadsheet water balance model developed for the Urban Water Strategy suggests that the current 2 groundwater bores and 600KL storage tank can meet predicted demand to at least 2040. However, the Urban Water Strategy also noted a strong reliance on 2 bores with the need to consider a 3rd bore for redundancy reasons in case there are problems with one or both bores or pumps.
Given the relative climate independence of the two groundwater bores and the calculations in the Urban Water Strategy that predicted demands can be met until at least 2040, the likelihood of water restrictions in the next 12 months is rated as “rare” (1 to 4%) using the DELWP (2017) grading system.

EAST GIPPPSLAND WATER ANNUAL WATER OUTLOOK: 2017-2018
Nov 2017 Version: Final 2 Page 27 of 40 EGW Doc Ref: DOC/17/46815
7 Omeo
7.1 CURRENT WATER POSITION
Towns supplied: Towns supplied: Towns supplied: Towns supplied: Omeo
System configuration: System configuration: System configuration: System configuration:
Number of connections (2016/17):Number of connections (2016/17):Number of connections (2016/17):Number of connections (2016/17): 256
Water Source: Water Source: Water Source: Water Source:
• Butchers Creek; licence volume: 77ML
Annual extraction (2016/17): Annual extraction (2016/17): Annual extraction (2016/17): Annual extraction (2016/17):
• Butchers Creek: 66ML
Main storage capacity:Main storage capacity:Main storage capacity:Main storage capacity:
• Raw Water: 15ML
• Treated Water: 0.2ML
Oct 2017 Storage volumes:Oct 2017 Storage volumes:Oct 2017 Storage volumes:Oct 2017 Storage volumes:
• Raw water: 13.8ML (92%)
• Treated water: 0.2ML (84%)
Demand:Demand:Demand:Demand:
• Actual 2016/17 demand: 63ML
• Forecast 2017/18 demand: 63ML
• Assumed annual growth rate: 0.12%pa

EAST GIPPPSLAND WATER ANNUAL WATER OUTLOOK: 2017-2018
Nov 2017 Version: Final 2 Page 28 of 40 EGW Doc Ref: DOC/17/46815
7.2 FORWARD OUTLOOK
7.2.1 Short term strategy and 5 year plan
Hexagonal floating discs have been recently installed on the lined 10ML raw water storage to protect against algae outbreaks and reduce evaporation. Prior to the installation of the discs, the storage was rarely used due to the risk of contaminating the treated water.
Plans are well advanced for the installation of a new 200KL treated water storage tank at Omeo to increase the security of supply. Construction of the new tank is likely to be complete by February 2018.
The combination of the new 200KL treated water storage and bringing the 10ML raw water storage back into operation has dramatically improved the security of supply in the Omeo system.
The key short-term strategy to ensure up-coming peak summer demands can be met is to keep the storages as full as possible. No major capital works on the Omeo system are planned for the next 5 years other than those capital projects mentioned above.
7.2.2 Outlook
Analysis in the Urban Water Strategy suggests that the biggest risk to meeting demand is the occurrence of cease to flow events in Butchers Creek (such as occurred in the 2009/10 period). Although long term records suggest that such events are rare (one event in the 7 years of river record), climate change is likely to increase their frequency.
A spreadsheet water balance developed for the Urban Water Strategy suggests that even with the lowest river flow on record (2009/10), there was sufficient raw water storage to ensure that current demand was able to be met without water restrictions. Therefore, the likelihood of water restrictions in the next 12 months is rated as “rare” (1 to 4%) using the DELWP (2017) grading system.

EAST GIPPPSLAND WATER ANNUAL WATER OUTLOOK: 2017-2018
Nov 2017 Version: Final 2 Page 29 of 40 EGW Doc Ref: DOC/17/46815
8 Swifts Creek
8.1 CURRENT WATER POSITION
Towns supplied: Towns supplied: Towns supplied: Towns supplied: Swifts Creek
System configuration: System configuration: System configuration: System configuration:
Number of Number of Number of Number of connections (2016/17):connections (2016/17):connections (2016/17):connections (2016/17): 127
Water Source: Water Source: Water Source: Water Source:
• Tambo River; licence volume: 224ML
Annual extraction (2016/17): Annual extraction (2016/17): Annual extraction (2016/17): Annual extraction (2016/17):
• Tambo River: 24ML
Main storage capacity:Main storage capacity:Main storage capacity:Main storage capacity:
• Raw Water: 4.6ML
• Treated Water: 0.41ML TOTAL:TOTAL:TOTAL:TOTAL: 5.01ML5.01ML5.01ML5.01ML
Oct 2017 Storage Oct 2017 Storage Oct 2017 Storage Oct 2017 Storage volumes:volumes:volumes:volumes:
• Raw water: 3.8ML (83%)
• Treated water: 0.3ML (69%)
Demand:Demand:Demand:Demand:
• Actual 2016/17 demand: 36ML
• Forecast 2017/18 demand: 36ML
• Assumed annual growth rate: 0%pa

EAST GIPPPSLAND WATER ANNUAL WATER OUTLOOK: 2017-2018
Nov 2017 Version: Final 2 Page 30 of 40 EGW Doc Ref: DOC/17/46815
8.2 FORWARD OUTLOOK
8.2.1 Short term strategy and 5 year plan
The key strategy to ensure up-coming peak summer demands can be met is to keep the storages at or close to capacity and ensure the off-take pool in the Tambo River is as deep and clear of obstacles as possible.
Other actions to improve water security include the installation of a pump to allow all of the 414KL storage tank to be used (currently only 75% of the tank capacity is usable from a gravity feed arrangement).
The conversion of the 4.6ML previously treated water storage to a raw water storage and the addition of a 414KL treated water storage tank have dramatically improved the risks of water contamination and the security of supply. No further augmentations are planned for the up-coming 5 year period.
8.2.2 Outlook
The Urban Water Strategy concludes that although calculations show that current demand can be mostly met based on historical flows and current storage volumes, the biggest risk to meeting demand is the occasional cease to flow event in the Tambo River. Since 1947, the flow in the Tambo River has dropped below 1 ML/d approximately 8 times with one cease to flow event in 2007. In such low flow events, water restrictions are likely. For instance, since 1998, there have been 3 instances of water restrictions imposed in Swifts Creek due to low flow events. The frequency of low flow or cease to flow events is likely to increase with the impact of climate change.
Given the risk of low flow or cease to flow events, the likelihood of water restrictions in the next 12 months is rated as “unlikely” (5 to 19%) using the DELWP (2017) grading system.

EAST GIPPPSLAND WATER ANNUAL WATER OUTLOOK: 2017-2018
Nov 2017 Version: Final 2 Page 31 of 40 EGW Doc Ref: DOC/17/46815
9 Buchan
9.1 CURRENT WATER POSITION
Towns supplied: Towns supplied: Towns supplied: Towns supplied: Buchan
System configuration: System configuration: System configuration: System configuration:
Number of connections Number of connections Number of connections Number of connections (2016/17):(2016/17):(2016/17):(2016/17): 108
Water Source: Water Source: Water Source: Water Source:
• Buchan River; licence volume: 170ML
Annual extraction (2016/17): Annual extraction (2016/17): Annual extraction (2016/17): Annual extraction (2016/17):
• Buchan River: 25ML
Main storage capacity:Main storage capacity:Main storage capacity:Main storage capacity:
• Treated Water: 0.63ML
Oct 2017 Storage volumes:Oct 2017 Storage volumes:Oct 2017 Storage volumes:Oct 2017 Storage volumes:
• Treated water: 0.51ML (80%)
Demand:Demand:Demand:Demand:
• Actual 2016/17 demand: 25ML
• Forecast 2017/18 demand: 25ML
• Assumed annual growth rate: 0.1%pa
EAST GIPPPSLAND WATER ANNUAL WATER OUTLOOK: 2017-2018
Nov 2017 Version: Final 2 Page 32 of 40 EGW Doc Ref: DOC/17/46815
9.2 FORWARD OUTLOOK
9.2.1 Short term strategy and 5 year plan
A current investigation into the condition of the 14 clear water storage tanks at Buchan will provide recommendations on whether they should be repaired or replaced. Cracks have been observed in many of the tanks. All but one of the tanks is currently operational with one tank off-line due to observed leakage. The tanks will either be repaired or replaced by the end of the 2017/18 financial year.
There is also a plan to add a 400KL raw water storage tank to the system to allow the turbid water from the river to settle before being treated. Currently, the raw water storage is planned for 2022/23 financial year. Although the primary driver for the raw water storage is water quality, the additional storage will also increase the security of supply.
9.2.2 Outlook
The Urban Water Strategy concluded that the main risk to providing water supply to Buchan is not being able to meet demand during periods of low or no flow in the Buchan River. Despite there being only two periods of zero flow in the Buchan River over 69 years of record, such events are likely to increase in duration and frequency due to climate change. Calculations reported in the Urban Water Strategy suggest that the volume of storage, the bulk entitlement rules and likely river flows are adequate to ensure demand is met for all but occasional cease to flow events.
Fires in the region in October have not yet created any threat to the water quality in the catchment. However, runoff from fire affected land has the potential to increase turbidity in the river with subsequent treatment and water quality issues. Turbidity levels are being closely monitored and will continue to be monitored over the upcoming summer period. No issues are expected but ensuring treated water storages are as full as possible will ensure there is sufficient treated water available to organise alternative supply arrangements in the unlikely event that river water is too turbid to treat and use.
A recent analysis suggest that a common summer day, the demand is approximately 220KL/day with the highest peak day recorded of 310KL/d. Given the current 13 operational clear water storage tanks totalling 585KL, these peak days equate to between 1.9 to 2.7 days of storage. This is sufficient time to organise carting of water if there were issues with the treatment plant and/or river supply during peak summer demand. With repairs or replacement of the current tanks to ensure they are all operational and an additional 400KL in 2022/23, the storage volume will equate to between 3.3 to 4.7 days of storage.
Over the last 25 years, water restrictions have been imposed only twice with only one relating to water shortage (the other related to water quality issues). Given the close to average summer rainfall outlook, the infrequent previous water restrictions and calculations in the recently developed Urban Water Strategy, the likelihood of water restrictions in the next 12 months would normally be rated as “rare” (1 to 4%) using the DELWP (2017) grading system. However, given the recent fires in the catchment area, the likelihood of water restrictions has been up-graded to “unlikely” (5 to 19%).
EAST GIPPPSLAND WATER ANNUAL WATER OUTLOOK: 2017-2018
Nov 2017 Version: Final 2 Page 33 of 40 EGW Doc Ref: DOC/17/46815
10 Bemm River
10.1 CURRENT WATER POSITION
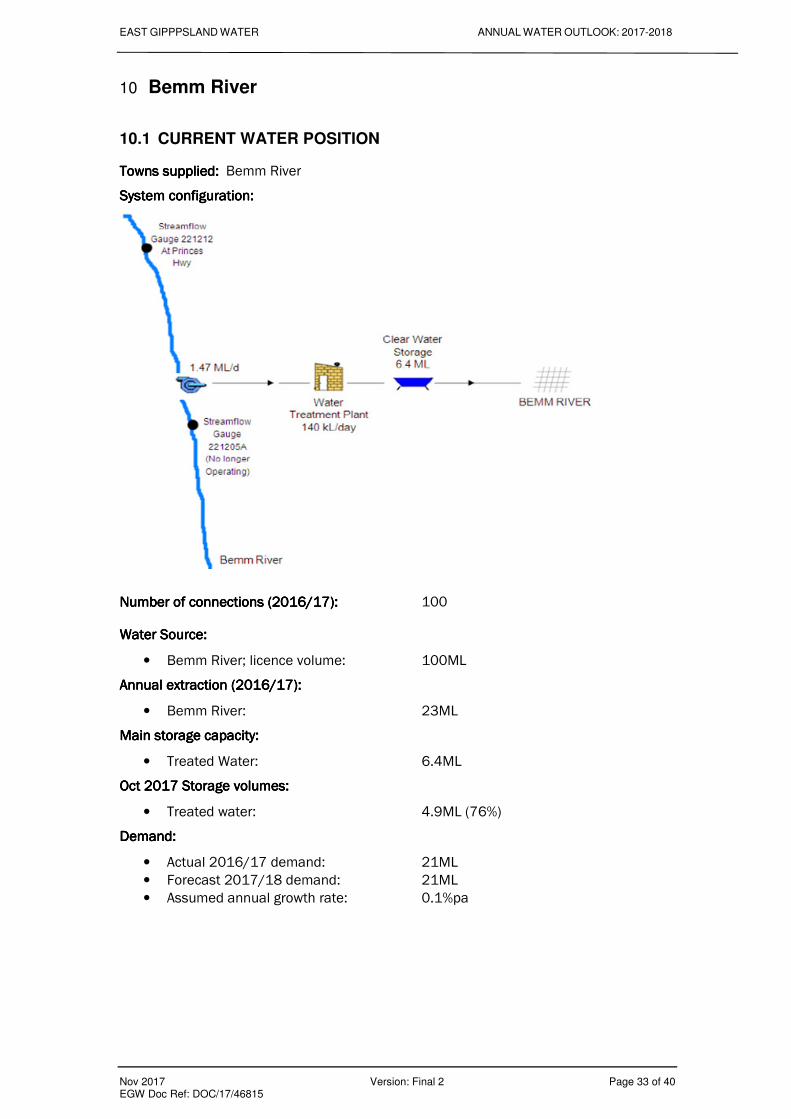
Towns supplied: Towns supplied: Towns supplied: Towns supplied: Bemm River
System configuration:System configuration:System configuration:System configuration:
Number of connections (2016/17):Number of connections (2016/17):Number of connections (2016/17):Number of connections (2016/17): 100
Water Source: Water Source: Water Source: Water Source:
• Bemm River; licence volume: 100ML
Annual extraction (2016/17): Annual extraction (2016/17): Annual extraction (2016/17): Annual extraction (2016/17):
• Bemm River: 23ML
Main storage capacity:Main storage capacity:Main storage capacity:Main storage capacity:
• Treated Water: 6.4ML
Oct 2017 Storage volumes:Oct 2017 Storage volumes:Oct 2017 Storage volumes:Oct 2017 Storage volumes:
• Treated water: 4.9ML (76%)
Demand:Demand:Demand:Demand:
• Actual 2016/17 demand: 21ML
• Forecast 2017/18 demand: 21ML
• Assumed annual growth rate: 0.1%pa

EAST GIPPPSLAND WATER ANNUAL WATER OUTLOOK: 2017-2018
Nov 2017 Version: Final 2 Page 34 of 40 EGW Doc Ref: DOC/17/46815
10.2 FORWARD OUTLOOK
10.2.1 Short term strategy and 5 year plan
Plans are well advanced for the installation of a new 500KL treated water storage tank at Bemm River to reduce the contamination risk to the current 6.4ML open treated water storage. Once the tank is installed, the current 6.4ML treated water storage will be converted to a raw water storage. Construction of the new tank is likely to be complete by February 2018. Although the main driver of the change is water quality considerations, the additional total storage will also improve the security of supply. No other major augmentations are planned for the up-coming 5 year period.
10.2.2 Outlook
The Urban Water Strategy concluded that the current storage volumes, bulk entitlement and likely future river flow were sufficient to cater for current and future demands. The strategy concluded that the biggest risk to supply of potable water is the risk of an event such as bushfires which may temporarily render the quality of the water in Bemm River as unusable. However, the planned additional 500KL treated water storage tank and the conversion of the 6.4ML current treated water storage to a raw water storage will provide approximately a month of supply which is likely to be sufficient time to implement actions to address water quality risks such as high turbidity (e.g installation of ‘silt buster’ clarifiers).
Since the Bemm River water supply system was commissioned in 1984, there has been only one instance of voluntary water restrictions imposed (in 2003) and only then due to the threat of bushfire which didn’t eventuate. The system was able to cope with significantly lower flows in 1997/98 without restrictions.
Given the close to average summer rainfall outlook, the infrequent previous water restrictions, the calculations in the recently developed Urban Water Strategy and the additional storage to be added to the system, the likelihood of water restrictions in the next 12 months is rated as “rare” (1 to 4%) using the DELWP (2017) grading system.

EAST GIPPPSLAND WATER ANNUAL WATER OUTLOOK: 2017-2018
Nov 2017 Version: Final 2 Page 35 of 40 EGW Doc Ref: DOC/17/46815
11 Cann River
11.1 CURRENT WATER POSITION
Towns supTowns supTowns supTowns supplied: plied: plied: plied: Cann River
System configuration: System configuration: System configuration: System configuration:
Number of connections (2016/17):Number of connections (2016/17):Number of connections (2016/17):Number of connections (2016/17): 192
Water Source: Water Source: Water Source: Water Source:
• Cann River; licence volume: 192ML
Annual extraction (2016/17): Annual extraction (2016/17): Annual extraction (2016/17): Annual extraction (2016/17):
• Cann River: 36ML
Main storage capacity:Main storage capacity:Main storage capacity:Main storage capacity:
• Treated Water: 3.4ML
Oct Oct Oct Oct 2017 Storage volumes:2017 Storage volumes:2017 Storage volumes:2017 Storage volumes:
• Treated water: 2.9ML (87%)
Demand:Demand:Demand:Demand:
• Actual 2016/17 demand: 36ML
• Forecast 2017/18 demand: 36ML
• Assumed annual growth rate: 0%pa
EAST GIPPPSLAND WATER ANNUAL WATER OUTLOOK: 2017-2018
Nov 2017 Version: Final 2 Page 36 of 40 EGW Doc Ref: DOC/17/46815
11.2 FORWARD OUTLOOK
11.2.1 Short term strategy and 5 year plan
Plans are well advanced for the installation of a new 350KL treated water storage tank at Cann River to reduce the contamination risk to the current 3.4ML open treated water storage. The contamination risk was realised in early 2017 when a dead rabbit was found in the storage resulting in the temporary imposition of a boiled water notice. Once the tank is installed, the current 3.4ML treated water storage will be converted to a raw water storage. Construction of the new tank is likely to be complete by February 2018. Although the main driver of the change is water quality considerations, the additional total storage will also improve the security of supply. No other major augmentations are planned for the up-coming 5 year period.
11.2.2 Outlook
The recently completed Urban Water Strategy concluded that that the river flow has dropped below 1.04 ML/day bulk entitlement trigger for reduced pumping only 2% of the time and ceased to flow once (briefly) over the last 7 years, the risk of not be able to meet restricted demand is relatively low. In the unlikely event of an extreme short term water shortage, carting from adjacent areas such as Bemm River is a viable option.
Over the last 40 years, there have been no periods of water restrictions imposed at Cann River other than two brief periods of voluntary restrictions in 1998 and 2003.
Given the close to average summer rainfall outlook, the infrequent previous water restrictions, the calculations in the recently developed Urban Water Strategy and the additional storage to be added to the system, the likelihood of water restrictions in the next 12 months is rated as “rare” (1 to 4%) using the DELWP (2017) grading system.

EAST GIPPPSLAND WATER ANNUAL WATER OUTLOOK: 2017-2018
Nov 2017 Version: Final 2 Page 37 of 40 EGW Doc Ref: DOC/17/46815
12 Short term action plan
Table 12-1 shows the relevant actions from the Urban Water Strategy for the next 5 year period and progress towards implementation. Actions from this review have been added to the table. Actions over the longer term can be found in the Urban Water Strategy (East Gippsland Water, 2017)

EAST GIPPPSLAND WATER ANNUAL WATER OUTLOOK: 2017-2018
Nov 2017 Version: Final 2 Page 38 of 40 EGW Doc Ref: DOC/17/46815
Table 12Table 12Table 12Table 12----1: Short1: Short1: Short1: Short----term actions and progress towards implementation.term actions and progress towards implementation.term actions and progress towards implementation.term actions and progress towards implementation.
IssueIssueIssueIssue/ System/ System/ System/ System ActionActionActionAction TimingTimingTimingTiming Comments on implementationComments on implementationComments on implementationComments on implementation
Demand Management
Continue with current “Target Your Water Use” program of: permanent water saving rules, provision of water efficient trigger nozzles and showerheads, water efficiency education and information, schools education program, working with local government to increase water efficiency on their sites and encouraging water sensitive urban design.
Continue with “Community Rebate Program” providing plumbing services to vulnerable customers and customers under financial hardship (contingent on continued government funding
On-going In progress
Integrated Water Management
Continue to pursue recycled waste water opportunities identified in the Urban Water Strategy through collaboratively developing business cases and identifying investment partners.
On-going Discussions have commenced between East Gippsland Water, East Gippsland Shire Council and East Gippsland Catchment Management Authority on opportunities to use treated waste water. Currently in the process of developing a formal Integrated Water Management Forum for Gippsland to develop and implement such ideas.
Mitchell River Water Supply System
Continue to inject water into the ASR bores to a maximum of 200ML as allowed by groundwater licence and continue to fill the Woodglen storages to full capacity (both subject to meeting minimum passing flow requirements in the Mitchell River as determined by the Bulk Entitlement)
Before Summer 2017/18
In progress
Review options to replace Wy Yung 1 storage leaking liner and review options to increase output from Woodglen Water Treatment Plant
2017/18 In progress
Change the trigger for extraction from the ASR scheme to 85% of Woodglen capacity in the Spring and early Summer months (from the current 50% trigger)
2017 Trigger point changed
Undertaking a single quantitative analysis of the options to address the bulk storage and supply needs identified in the Urban Water Strategy and the clear water storage, main supply pipeline and water treatment plant capacity risks identified in the Mitchell River Water Master Plan (MWH, 2017).
2018 to 2023 Budget allocated in the 2018 to 2023 pricing submission period for this task
Confirm ownership and maintenance responsibilities for the six emergency water supply points in the Mitchell River water supply region and ensure they remain operational and their locations and operation are publicised.
2018 to 2023 Investigation into improving operation of emergency water supply points has commenced
Orbost Continue to maintain the Rocky River diversion and pipeline in the short term with a re-assessment of the relative merits of decommissioning, replacement or continued maintenance options once the following is known: o the preferred long-term configuration of the Mitchell River Water Supply System including whether a supply from Orbost to Lakes Entrance is recommended (see above recommendation for the Mitchell River system).
o additional energy cost and carbon offset requirements incurred if Rocky River pipeline is decommissioned.
2017+ An analysis of the options to supplement the Mitchell River Water Supply System is planned for the 2018 to 2023 Pricing Submission Period
Undertake an investigation into potential alternative sources of water for use in water shortage events. Consideration should be
given to developing a groundwater supply from the local Curlip Gravel Aquifer and/or using the current emergency water supply
bore located on the corner of Salisbury St and Livingstone St, Orbost
2018 to 2023 Yet to be actioned – to be considered in the 2018 to 2023 period
Dinner Plain Undertake a systematic program of leak detection and repair to reduce the relatively high water losses in the system down to
more acceptable levels. 2017+ In progress
Use regular monitoring of production bores and nearby observation bores to determine the impact of climate change and
climate variability on groundwater levels and determine impact on long term bore yields. Annually coinciding with reporting requirements to Goulburn-Murray Water
In progress

EAST GIPPPSLAND WATER ANNUAL WATER OUTLOOK: 2017-2018
Nov 2017 Version: Final 2 Page 39 of 40 EGW Doc Ref: DOC/17/46815
IssueIssueIssueIssue/ System/ System/ System/ System ActionActionActionAction TimingTimingTimingTiming Comments on implementationComments on implementationComments on implementationComments on implementation
Given that the 2 groundwater bores provide the sole water supply for Dinner Plain, it is recommended that down-hole
inspections of both bores be undertaken every 5 years to ensure early detection of any issues with bore integrity. The outcomes
of the condition assessment should inform a decision on the need to replace the current bores and the need for a third bore as
a contingency to failure of the current bores or pumps. Depending on the outcome of the bore condition assessment, drill and
construct a third bore as a contingency for failure of the pumps and/or bores in the current two production bores.
2017 and every 5 years after
Planned for 2018 to 2023 period
Continue discussions with the Mt Hotham Ski Company to:
• formalise the current trial arrangements for the supply of potable water for snow making at Dinner Plain including the mandating of days without snow making to ensure the groundwater levels recover; and,
• identify and pursue third party funding sources to supply either untreated groundwater or treated waste water for snow making purposes at Dinner Plain and/or Mt Hotham.
2017+ Planned before the 2018 ski season
Omeo Resolve water quality issues in the 10 ML raw water storage to allow the full capacity of the storage to be utilised. A solution of
floating balls or hexagon panels is being considered along with filtering. 2017/18 Task completed. A layer of floating discs has been added and is
operating successfully.
Additional 200KL treated water storage tank to provide greater security that peak day summer demand can be met 2017/18 Planning well advanced with 200KL tank likely to be constructed by
Jan/Feb 2018.
Attempt to purchase a small licence from the Mitta Mitta River to mitigate against more frequent occurrences of cease to flow
events in Butchers Creek. 2018 to 2023 Planned for 2018 to 2023 pricing submission period
Continue discussion with the East Gippsland Shire Council and the Omeo Recreational Reserve Committee of Management for
access to their groundwater bore during periods of water shortage. 2018 to 2023 Previous discussions to be reviewed
Mallacoota Undertake monitored and controlled pumping tests of the two production bores to determine the sustainable yield and optimal
pumping configuration. 2018 to 2023 Planned for 2018 to 2023 pricing submission period
Amalgamate the two existing groundwater licences to eliminate confusion on the conflicting conditions. 2017 Discussions with Southern Rural Water are continuing
Cann River Complete currently planned works including addition of a clear water storage tank, permanent spear point system in the creek
bed and conversion of current 3.4 ML clear water storage to a raw water storage. 2017/18 Planning well underway to construct a 350KL treated water storage
tank by Jan/Feb 2018. Current 3.4 ML treated water storage will then be converted to a raw water storage.
Swifts Creek Undertake a study to determine the viability of existing bores 95742 and 95744 for use as emergency water supplies for the
Swifts Creek township during periods of Tambo River low flow or poor quality and/or for use as an emergency water supply
public access point including confirming ownership and access arrangements.
2018 to 2023 Planned for 2018 to 2023 pricing submission period
Install a pump between the Swifts Creek Water Treatment Plant and the clear water storage to replace the current gravity
system to allow the full 414kL volume of the clear water storage tank to be used. 2017 Planned for 2017/18 financial year
Buchan Renewal of ageing clear water storage tanks. Construction of a new raw water storage tank to address potential turbidity
issues.
To commence in 2017/18 and to be completed during 2018 to 2023
Clear water tank investigation and options analysis is underway with preferred option to be implemented by end of June 2018. Budget allocated in 2018 to 2023 pricing submission for a 400KL raw water storage tank to be installed during 2022/23
Investigate alternative supplies to the Buchan River to increase the security of supply during drought conditions (including the
Murrindal River and groundwater) 2018 to 2023 In progress
Confirm ownership and maintenance responsibilities for the emergency water supply point located at the football oval on the
Buchan-Orbost Road and ensure there is sufficient information to customers on the location of the site and conditions of use
especially during drought conditions.
2018 to 2023 Study into operation of emergency water supply points currently underway
Bemm River Complete current plan to convert current 6.4 ML clear water storage to a raw water storage and addition of clear water storage
tank to reduce water quality risks. 2017/18 Construction of new 500KL treated water storage by Jan/Feb 2018.
The current 6.4ML treated water storage will then be converted to a raw water storage.

EAST GIPPPSLAND WATER ANNUAL WATER OUTLOOK: 2017-2018
Nov 2017 Version: Final 2 Page 40 of 40 EGW Doc Ref: DOC/17/46815
13 References
.ID (2017) http://forecast.id.com.au/east-gippsland/about-forecast-areas/?WebID=100. Viewed Oct 2017
Bureau of Meteorology (2017) http://www.bom.gov.au/climate/outlooks/#/rainfall/median/seasonal/0 Viewed Nov 2017
EGW (2017), Urban Water Strategy. March 2017. EGW Doc No.: DOC/16/18427
Stantec (2017). Mitchell River Water Network Master Plan. August 2017. EGW Doc No.: DOC/17/12248


![Christ Triumphant [Gender Neutral - See FOREWORD]centrowhite.org.br/files/ebooks/egw-english/devotionals/Christ Triumphant.pdfChrist Triumphant [Gender Neutral - See FOREWORD] ...](https://static.fdocuments.us/doc/165x107/611a253eb4cbc6510a35f7ab/christ-triumphant-gender-neutral-see-foreword-triumphantpdf-christ-triumphant.jpg)


