EGRM for Orissa - Vision Documentapps.ocac.in/uploadDocuments/Content/EGRM.pdf · 5.3 Strategy ......
56
e-Government Road Map for Orissa Vision Document
Transcript of EGRM for Orissa - Vision Documentapps.ocac.in/uploadDocuments/Content/EGRM.pdf · 5.3 Strategy ......
e-Government Road Map for Orissa
Vision Document
2
Table of Contents
1. Background & Methodology..................................................................................3
1.1 Background .................................................................................................. 3 1.2 Methodology................................................................................................. 5 1.3 Document Structure ....................................................................................... 8 1.4 Acknowledgements........................................................................................ 10
2. State Profile – Orissa........................................................................................ 11
2.1 Geography & Demography ............................................................................... 11 2.2 Resource Profile ........................................................................................... 13 2.3 State of Human Development...........................................................................18 2.4 Economy ....................................................................................................22 2.5 Physical Infrastructure ................................................................................... 24 2.6 State Finances ............................................................................................. 28
3. SWOT Analysis................................................................................................ 30
3.1 Strengths & Opportunities ............................................................................... 30 3.2 Weaknesses & Threats.................................................................................... 31
4. Stakeholders’ Needs & Expectations.................................................................... 34
4.1 Citizens......................................................................................................34 4.2 Businesses...................................................................................................35 4.3 Political Leadership....................................................................................... 36 4.4 Government Departments ............................................................................... 36 4.5 Educational Institutions .................................................................................. 37 4.6 Synthesis of Needs ........................................................................................ 38
5. Good Governance Vision & Agenda...................................................................... 40
5.1 Good Governance Vision ................................................................................. 40 5.2 Good Governance Agenda................................................................................ 41 5.3 Strategy .....................................................................................................42 5.4 Targets & Objectives ..................................................................................... 43 5.5 Transparency & Accountability .........................................................................48
6. e-Government Vision ....................................................................................... 50
6.2 Supporting Facts & Explanations .......................................................................50 6.3 Implications ................................................................................................ 50 6.4 Translation of Vision...................................................................................... 51
Annexure.......................................................................................................... 52
Annexure-1: Bibliography..................................................................................... 52 Annexure-2: Major Activities proposed under NeGP..................................................... 52 Annexure-3: Components of EGRM, CBRM & DPR......................................................... 52 Annexure-4: Task Force for EGRM & CBRM Preparation................................................. 53 Annexure-5: MMPs for Orissa................................................................................. 53 Annexure-6: Segmentation & Selection Matrix for State MMPs ........................................53 Annexure-7: List of Respondents............................................................................ 54 Annexure-8: MOM Template.................................................................................. 54 Annexure-9: Questionnaire – Department Visits.......................................................... 55 Annexure-10: Reforms under G-C ...........................................................................56

3
1. Background & Methodology
1.1 Background
National e-Governance Plan (NeGP) has been approved by the Government of India
for implementation during the years 2003-2007 to lay foundation and provide
impetus to e-Governance throughout the Country.
Analysis of various technology initiatives, which were undertaken prior to the
NeGP, made it evident to policymakers and strategists that Nation’s E-Governance
Plan needs to mature from creating islands of success to achieve widespread
adoption. Majority of investments made in terms of ICT had resulted in a
conglomerate of disconnected technologies operating in isolation to each other and
rather than layering capabilities on existing technology infrastructures, each new
technology created a self-contained island of data and functionality.
It was also established that agencies were evaluating their ICT endeavors according
to how well these served parent agency’s processes – not on how well would these
systems respond to citizens’ changing needs. Further, government corporations and
agencies were utilizing ICT to either automate or facilitate existing processes and
sub-processes, without analyzing or reengineering them.
The funding approach itself had to change and it was imperative to look for short-
cycled ROI and proven business-values before initiating any ICT project. The
policymakers were unanimous in their recommendations that precise goals be
established at outset of every e-Governance initiative and a step-by-step approach
to digitization should be adopted.
NeGP was formulated to address essential issues such as these and envisages that
government services be optimized and made available to citizens across the
Majority of ICT investments had resulted in technologies operating in isolation to each other
Focus was on simple digitization of processes and not reengineering them to effectively meet citizens’ aspirations
Funding approach had to change to look for short-cycled ROI and proven business-values

4
Country via a network of delivery centers to bring about efficiency, transparency
and reliability in governance and to meet the basic needs of common citizens.
The Plan advocates definition of institutional mechanisms and core policies for
managing e-governance initiatives across the Country in a cohesive manner and
entails that services, having high volume of citizen interactions, with major impact
on the national and regional economies or where the service-owners themselves
show readiness to optimize, be targeted as Mission Mode Projects (MMPs) at Center,
State and Integrated Service levels.
Further, by providing appropriate weightage to quality and speed of optimization
and by utilizing full potential of private sector involvement, NeGP aims at creating
a citizen-centric and business-centric environment for governance.
Formally stated, the NeGP Approach mandates:
§ Focus on Public Service Delivery and Outcomes
§ Process Re-engineering and Change Management are critical
§ Radically change the way government delivers services
§ Centralized Initiative but Decentralized Implementation
§ Standardize, Localize and Replicate
§ Effective Public-Private Partnership is crucial
§ Think Big, Start Small and Scale Fast
Major activities proposed in the National E-Governance Plan include formulation of
core policies, HRD & training need assessment and development of core
infrastructure & projects (see Annexure-2 for Major Activities under NeGP).
However, it was observed that most States were inadequately equipped in terms of
personnel and skill-sets needed to handle the host of issues involved in effective
implementation of NeGP.
NeGP seeks to create institutional mechanisms set up core policies and implement MMPs at various levels
“Ministry will implement a comprehensive programme to accelerate E-Governance at all levels of the government to improve efficiency, transparency and accountability at the Government-citizen interface…” - Hon'ble PM's Announcement on August 15, 2002
5
State Governments needed to provide for overall direction, standardization and
consistency across initiatives and at the same time, were to have resources and
flexibility to drive the Plan in the best-possible manner.
This was identified as the first gap that needed to be addressed at State levels and
it is for this reason that the Planning Commission in the current year (2004-05) has
allocated funds as Additional Central Assistance (ACA) to all the States for assessing
their respective capacity building needs and for preparing e-Governance and
Capacity Building Roadmaps.
The State Government of Orissa has initiated the preparation of its e-Governance
Roadmap and Capacity Building Roadmap (comprising of e-Government vision,
strategy & blueprint and assessment of AS-IS & TO-BE capacities) with assistance
from National Institute for Smart Government (NISG) and Wipro Infotech.
This document broadly states the core e-Governance Vision, Strategy & Blueprint
for Orissa (see Annexure-3 for major components of EGRM and CBRM documents).
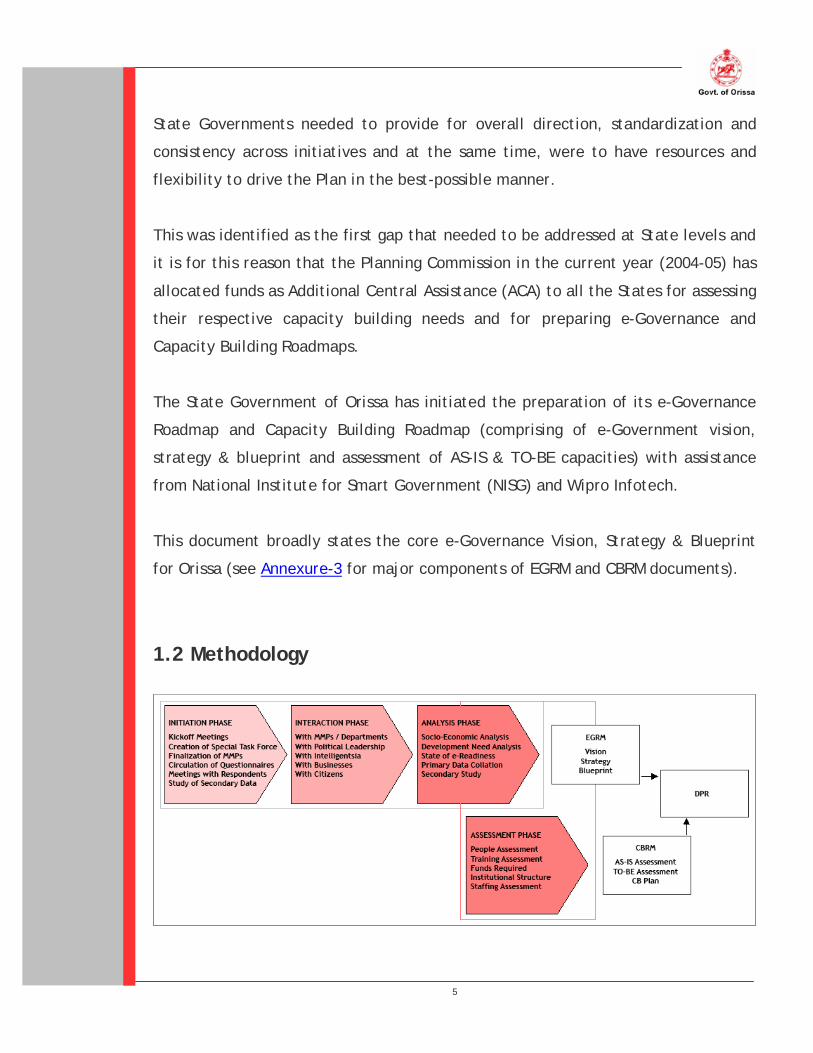
1.2 Methodology

6
Initiation Phase: This marked the formal beginning of the project and major
activities conducted during this stage included:
§ Kickoff Meetings: were held with Senior Officials of State Government to
explain the context and scope of the whole exercise, including an introduction
to NeGP. The aim of these meetings was to make all the stakeholders aware of
the purpose of the assignment and also to prepare the ground for future
interactions with the same. Further, a special Task Force was created to
facilitate and participate in the EGRM and CBRM preparation (see Annexure-4
for main members of this Task Force)
§ Finalization of MMPs: was done in consultation with the Senior Government
Officials and the Task Force. In addition to 10 Mission Mode Projects (MMPs) as
mandated by the NeGP, 12 State-specific MMPs were selected among various
departments (see Annexure-5 for final list of MMPs for Orissa). The selection of
these MMPs was done keeping in mind the guidelines as defined by the NeGP
and also by categorizing all the State Government Departments into four broad
segments (Regulatory, Infrastructure, Production and Welfare Subjects) and
selecting those departments which either have considerable impact on the
State’s economy or on its society and citizens as MMPs (see Annexure-6 for
detailed segmentation and selection matrix).
§ List of Respondents: was prepared to include people from various spheres of the
State. Respondents were selected from State’s political leadership (from Ruling
Parties as well as from Opposition Parties), from academicians and intelligentsia
(University VCs, Newspaper Editors, etc.), from business enterprises and among
common citizens of the State. In addition to these respondents, Senior Officials
from various Government Departments were also consulted to get their views on
“Where they wish to see Orissa in future and what should be done to achieve
that” (see Annexure-7 for list of respondents).
§ Customization of Questionnaires: which were to be utilized for collection of
relevant and necessary data from various respondents was also undertaken in
the first stage of the assignment. The template as utilized by Wipro Infotech
7
with respect to CB Projects was revised and an additional Questionnaire was
prepared for taking the minutes-of-meetings with various respondents (see
Annexure-8 and Annexure-9 for these Questionnaires).
§ Secondary Data: such as books, publications, gazettes, etc. pertaining to the
State were also collected from various sources (State Archival Department, CII,
etc.). These data-sources included State Human Development Reports, Budget
and Economic Survey Documents, etc. and were quite important for getting an
understanding of the State, its people and their aspirations.
Interaction Phase: On the basis of Lists of Respondents and MMPs as finalized in
the previous stage, meetings were planned with various officials, political leaders,
intellectuals and academicians, businesspersons and common citizens. Information
was collected from these respondents via Questionnaires as enclosed in Annexure-8
and Annexure-9, and thereafter this information was further enhanced by various
secondary data sources.
As a part of the same endeavor, extensive interactions were undertaken with
various government departments to:
§ Get an overview of their respective functions, infrastructure and hierarchy
§ Identifying the challenges faced in transacting their mandates efficiently
§ Understanding their perspective on how to improve their respective outputs
Analysis Phase: On the basis of the data collected from different respondents and
utilizing various secondary data sources, Orissa’s socio-economic and development-
need analyses were done to establish the Good Governance Objectives. These Good
Governance Objectives were used as an underlying theme to arrive at the e-
Government Vision for the State.
During the interactions proper care was taken to capture the e-readiness of the
Departments with data like present IT infrastructure of the Department,
connectivity issues, IT budget, IT initiatives already taken, present e-Governance

8
projects running in the Department & their performance and IT related future
plans, if any. The above given data was analyzed to ascertain the present capacity
of the Department and the potential improvements through ICT intervention. This
helped in emergence of the e-Government Architecture of the State.
A Gap analysis was performed with respect to the AS IS IT status of the State and
the Applications that need to be made operational towards realization of the e-
Government Vision. The completion of the phase saw the emergence of e-
Government Strategy and Blueprint for Orissa.
1.3 Document Structure
This Document comprises of 12 Main Sections:
§ Section 2 (State Profile): containing State’s geography & demography, its
resource profile, state of human development and its economy & finances. This
section has been constructed utilizing various sources of secondary data and via
data gathered during meetings with various Government Officials.
§ Section 3 (SWOT Analysis): containing a synopsis of Orissa’s strengths,
opportunities, weaknesses and threats. This section directly related to the
primary and secondary research and the socio-economic analysis of the State
and prepares the ground for subsequent sections, which would indicate how to
avail the opportunities and correct the imbalances as made visible herewith.
§ Section 4 (Stakeholders’ Needs & Expectations): containing the “wish-list” of
each of the five major stakeholders and process participants. Feedbacks have
been taken into account from the citizens, businesses, political leadership,
government departments and educational establishments and reflect what their
perception of current state-of-affairs is and what their aspirations are.
§ Section 5 (Good Governance Agenda): containing the primary goals that would
be facilitated via the means described within e-Governance and Capacity
Building Roadmaps. This section is directly derived from developmental goals as

9
set by Central and State Government Agencies (such as Planning Commission),
from targets as set at global levels (such as Millennium Development Goals),
from speeches and manifestos of various political parties of the state, and from
SWOT analysis and Stakeholders’ Needs as presented in the previous section.
§ Section 6 (e-Government Vision): containing the e-Governance Vision of the
State and its implications. The Vision is a derivative of the Good Governance
Agenda as stated in Section 5 and paves the way for the e-governance strategy
and blueprint of the State.
§ Section 7 (Realizing the Vision: State of e-Readiness): containing AS-IS Status
of e readiness in Orissa. This section includes details of IT infrastructure &
connectivity, applications running in the Government, IT education & training
programs offered in the State and various e-governance initiatives undertaken
so far. This section would ultimately be utilized to ascertain the gaps, which
might exist with respect to TO-BE status of e-readiness, as dictated by the
State’s e-governance vision and strategy.
§ Section 8 (e-Government Strategy): contains the detailed e-Government
Strategic Framework. The Sub-Sections are Institutional Framework, Policy &
Legal Framework, Capacity Building, Government Process Reengineering, Risk
Analysis, Funding Strategy (including PPP) and the State e-Governance
Architecture & Framework.
§ Section 9 (Sectoral Strategies): contains the detailed Sector-wise Analysis for
all the MMP Sectors of Orissa. The subsections are Sector Description, Goals &
Targets, Key Processes (with Corresponding Challenges), Current e-Readiness
Status and Proposed e-Government Strategy.
§ Section 10 (Services): contains the details of Government-to-Citizen (G2C),
Government-to-Business (G2B) and Government-to-Government (G2C) Services
proposed for the State of Orissa.
§ Section 11 (Applications): contains a number of applications proposed for the
State. These applications have been placed in 3 Categories, viz. Core
Applications, Sectoral Applications and Integrated Applications.
10
§ Section 12 (Infrastructure): contains the Infrastructure requirements
necessitated by the e-Government Strategy in terms of Connectivity (SWAN),
State Data Centers and Delivery Infrastructure (Citizen Service Centers, etc.)
§ Section 13 (e-Government Blueprint): containing the Big Picture of the
Architecture and Framework of e-Governance in Orissa highlighting the
Institutional and Policy Framework. Finally the Prioritization in Implementation
has been discussed.
1.4 Acknowledgements
The team thanks Government of Orissa for this opportunity to undertake this
exercise. The team places on record its appreciation of all senior Government
functionaries who shared their valuable views, opinions and information.
The team acknowledges with thanks the support and ideas provided by Shri S.N.
Tripathy, IAS, Secretary – Information Technology, Shri Vishal Dev, IAS, Director-
Orissa Computer Application Center, Shri Niten Chandra, IAS, Additional Secretary –
General Administration, Dr. P.K. Raut, OAS, OSD-OCAC and all NISG Officials for all
the support and guidance extended in carrying out this assignment.
The team also acknowledges with thanks opinion and ideas provided by common
citizens of the State with respect to what they envisage their government to be.

11
2. State Profile – Orissa
2.1 Geography & Demography
Orissa is a maritime State on the East coast of India, between 17 degrees 49
minutes north to twenty-two degrees thirty-four minutes North latitudes and 81
degrees 27 minutes east to 87 degrees 29 minutes East longitudes.
Morphologically, Orissa can be divided into five parts:
§ Coastal Plains: stretch from Subarnarekha in North to Rushikulya in South
§ Middle Mountainous Country: covers about three-fourths of the area of the State
§ Rolling Upland: rich in soil nutrients, are the products of continued river action
§ River Valleys: associated with Brahmani, Mahanadi and Vansadhara rivers
§ Subdued Plateau: monotony of orography is interrupted by the river valleys
Orissa is the tenth largest state (in terms of geographical area) in India and has
about 4% of India’s population. One of the poorest State of the Indian Union, with
more than 40% of the population below poverty line, Orissa has about 87% of its
population living in villages and about 38% of people in the State belong to the
socially-weak sections (62 tribes accounting for 22% and 93 castes for 16%).
Predominantly rural society with a large percentage of population belonging to socially and economically weaker sections
Geographic Indicators (Urban/rural Statistics)
Area (Sq.km) 2001 155707Number of
Subdivisions 58
No of districts 200130
Number of Tahasils 171
No of Blocks 1991314
Number of Gram
Panchayats 6234
Statutory towns102
Number of Tribal Blocks 118
Census towns22
Number of Municipal
Corporation 2
Inhabited46989
Number of Municipalities 34
Uninhabited4068
No of households ('000) 1991
5999
No of villages (1991)
Number of Notified Area
Councils 67
No of towns (1991)

12
Among the States in India, only Maharashtra has more number of districts but given
the size of the State, the number of Census Towns is considerably low when
compared to other States in India. This is supported by the fact that Orissa has the
highest number of villages among the states in India.
The State’s Infant Mortality Rate (IMR) of 97/1000 remains among the highest in
India. Further in terms of core infrastructure, Orissa is relatively impoverished with
regards to railways, telecommunication, literacy, and irrigation coverage. Only 20%
of the road network is paved and in rural areas more than 65% of the population
has no access to safe drinking water, around 96% do not have sanitation facilities,
over 82% of families do not have electricity and over 87% live in temporary houses.
To add to the aforesaid, Orissa faces frequent natural disasters such as cyclones,
floods, and droughts as a combination of both natural and man-made causes.
Population Density of Population (Per sq km)
Sex Ratio (Females per 1000 Males)
% SC population
% ST population
2001 2001 2001 2001 2001 2006 2011Andhra Pradesh 76210007 275 978 16.2 6.6 80.6 84.8Gujarat 50671017 258 920 7.1 14.8 52.5 56.1Karnataka 52850562 275 965 16.2 6.6 56.2 59.6Kerala 31841374 819 1058 9.8 1.1 34.2 35.6Maharashtra 96878627 314 922 10.2 8.9 97.3 102.6Orissa 36706920 203 972 16.5 22.1 37.8 39.5Punjab 24358999 482 876 28.9 0.0 25.3 26.7Tamil Nadu 62405679 478 987 19.0 1.0 65.0 67.6West Bengal 80176197 904 934 23.0 5.5 85.4 90.8
ALL INDIA 1028610328 324 933 16.2 8.2 1094.1 1178.9
Projected population (Mn.) States
Source: Statistical Abstract of India, 2003
The density of population is the lowest among the major states of India. Orissa
ranks high in terms of sex ratio (972 per 1000 males) and also the percentage of
Scheduled Tribe population in the State is one of the highest in India.
Greatly challenged in terms of core infrastructure and state of human development

13
Demographic Indicators (Urban/rural Statistics)
No. of VillagesAverage
Population per Village
No. of Towns Average Population per Town
Share of Urban population (%)
2001 2001 2001 2001 2001Andhra Pradesh 28123 1964 210 97636 7.2Gujarat 18544 1709 242 78097 6.6Karnataka 29483 1181 270 66370 6.3Kerala 1364 17281 159 51995 2.9Maharashtra 43722 1275 378 108518 14.4Orissa 51349 608 138 39828 1.9Punjab 12729 1260 157 52520 2.9Tamil Nadu 16317 2137 832 32742 9.5West Bengal 40793 1415 375 59964 7.9
ALL INDIA 638691 1161 5161 55291 27.8Source: www.censusindia.net
States
2.2 Resource Profile
Mineral Resources: Orissa occupies an important position in India’s mineral-map.
Reserves of major minerals like Chromite, Nickel, Bauxite, Iron-Ore and Coal in
Orissa were approximately 97%, 95%, 49%, 33% and 24% respectively of the total
deposits in India during 2003-04. Other minerals like China Clay, Fire Clay, Lime
Stone, Quartz, Precious and Semi-Precious Stones, Copper, Manganese, Graphite,
Titanium, Vanadium etc. are also available in the State. Total production of
minerals and ores in the State during 2003-04 has registered an increase of 23.95%
in quantity and 40.72% in value over 2002-03.
Source: Directorate of Mines, Orissa, Bhubaneswar
Minerals and related industries can significantly aid the process of development in the State

14
A number of mineral based industries have been set up in Orissa which include
Rourkela Steel Plant (RSP), Aluminium Plants by INDAL and National Aluminium
Company (NALCO), and Charge Chrome Plants by Orissa Mining Corporation (OMC),
Ferro Alloys Corporation (FACOR) and Indian Charge Chrome Ltd. (ICCL). The other
important mineral based industries established include Sponge Iron Plants in
Keonjhar district, Refractory in Dhenkanal district and Mineral Sands Separation
and Synthetic Rutile Plants in Ganjam district. Several Cement Plants have been set
up in the State and three Coal-based Thermal Power Plants also have been set up.
Although Orissa is endowed with rich mineral resources, it has been observed by
various studies that Rate of Exploitation, when compared to total reserves, is quite
low for most minerals due to resource-constraints. Efficient exploitation of mineral
resources also generates large-scale employment avenues. The need to attract
greater investment in this sector, so as to increase the rate of exploitation of
minerals leading to generation of further employment opportunity, has already
been identified.
Resource: Production of Minerals and Ores
All Minerals Fuel Metallic Non Metallic All minerals Fuels Metallic Non MetallicAndhra Pradesh 391 70 26 295 55476387 39394885 134506 2744667Gujarat 412 3 87 322 51769558 48289587 336073 1453059Karnataka 199 - 80 119 10580363 - 9072472 924533Kerala 34 - 3 31 1603807 - 2612 883302Maharashtra 139 50 21 68 28506851 23246427 951163 865355Orissa 234 22 136 76.0 33560914 20858173 11458832 795561Tamil Nadu 203 2 4 197 18321754 16121036 27322 1750424West Bengal 113 99 - 14 23932590 23529561 - 47093
ALL INDIASource: Statistical Abstract, India, 2003
Number of Reporting Mines Value (Rs. '000), 2002-03States
Agriculture Resources: Agriculture plays a dominant role in the economy of the
State like Orissa. Agriculture contributed more than 20% to the Net State Domestic
Product of the State in 2003-04 (Q) at 1993-94 prices and provided direct and
indirect employment to around 65 percent of the total work force of the State as
per the 2001 Census.
Recent liberalization policy seeks to expanded the possibilities for large-scale mineral exploration and establishment of mineral–based industries in the State
Low rate of utilization of mineral resources needs to be corrected by means such as attracting more external participation
Agriculture Sector contributes more that 20% to Orissa’s NSDP and provides employment to more than 60% of total workforce
15
However agriculture in Orissa continues to be characterized by low productivity
due to antiquated practices, insufficient capitals, inadequate irrigation facilities
and uneconomic size of holdings. Nearly 62% of the cultivable land is dependent on
Monsoon for irrigation and per-capita availability of cultivated land, which was 0.39
hectare in 1950-51, has declined to 0.15 hectare in 2003-04.
Rice is the principle Food Crop of the State. The average yield rate of rice in
Orissa, which was 7.59 quintal/hectare in 2002-03, increased to 14.96
quintal/hectare during 2003-04. The per capita availability of food grains per
annum that was 95 kg in 2002-03 has increased to 188 kg in 2003-04. The
contribution of Orissa to the food grain basket of the country, which was 2.07% in
2002-03, is estimated at about 3.42% in 2003-2004.
The “Integrated Cereal Development program – Rice” is being implemented in the
state since 1994-95 with the objective of augmenting paddy production and
enhancing productivity of rice through adoption of a package of scientific
practices. A major component of this programme is to increase coverage of area
under High Yielding Variety (HYV) seeds.
Despite inadequate irrigation facilities, shortage of HYV seeds, low use of
fertilizers and pesticides, there has been significant expansion of area under HYV
Crops in the State.
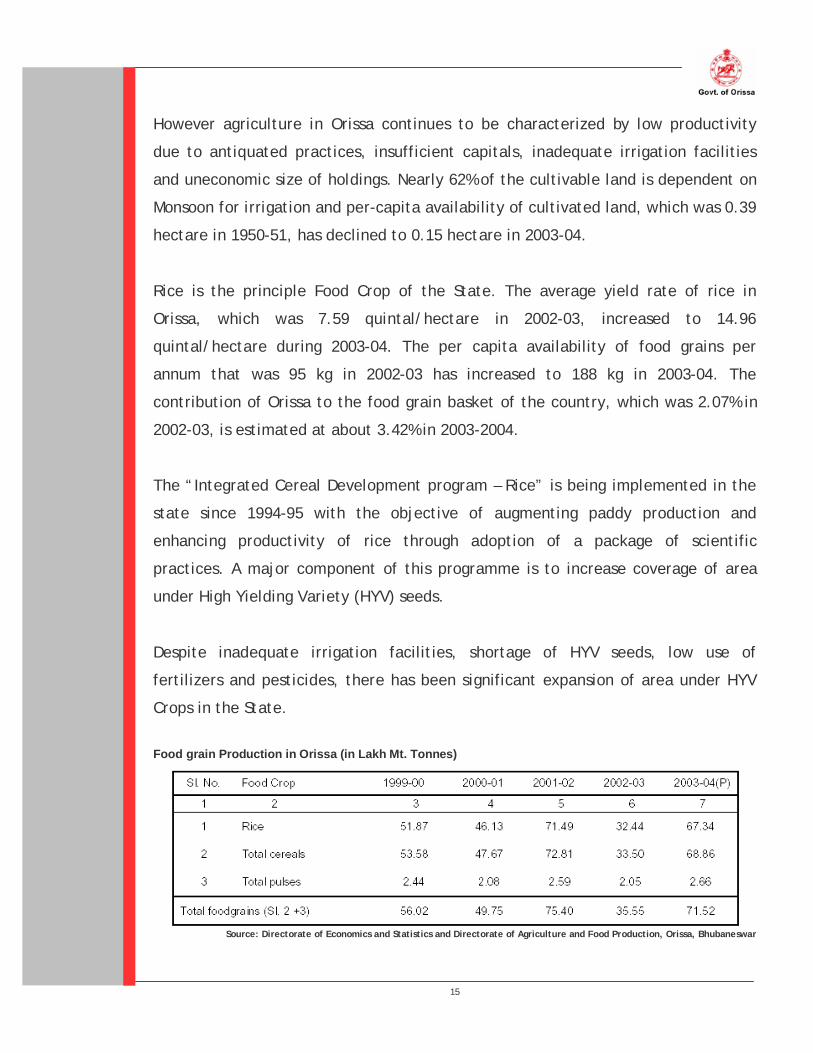
Food grain Production in Orissa (in Lakh Mt. Tonnes)
Source: Directorate of Economics and Statistics and Directorate of Agriculture and Food Production, Orissa, Bhubaneswar

16
Sector : Agriculture
Area under Food Grains (Rice)
('000' Hec) % Share of food grain production
Yield rate of food grains (qtl/hect.)
Production of Rice ('000'
Tonne)
Average Yield of
Rice (Qtls/Hec)
Cons of fertiliser per unit gross cropped
area(kg/hect)2002-2003 2001-02 2001-02 2002-2003 2002-2003 2001-02
Andhra Pradesh 2745 7.00 21.03 7195 26.2 143.46Gujarat 481 2.31 14.14 596 12.4 85.52Karnataka 1154 4.14 12.24 2237 19.4 101.48Kerala 314 0.34 21.40 700 22.3 60.72Maharashtra 1525 5.28 8.74 1849 12.1 78.24Orissa 4274 3.56 13.93 3244 7.6 40.84Punjab 2530 11.74 40.40 8880 35.1 173.38Tamil Nadu 1704 4.00 22.30 5709 33.5 141.55West Bengal 5842 7.78 24.24 14389 24.6 126.82
ALL INDIA 40279 100.00 17.40 72653 18 90.12Source C.M.I.E. Agriculture, February 2004
Statistical Abstract India, 2002, C.S. O.
States
The productivity of food grains in Orissa during 2003-04 was 1,327 kg per hectare,
which is much lower, compared to some of the more developed States like Andhra
Pradesh, Punjab, Haryana, Karnataka, West Bengal and Uttar Pradesh and also
below the National Average of 2,108 kg per hectare. The consumption of
fertilizers, of about 39 kg per hectare during 2003-04 is also much below the
national average of 84.82 kg per hectare.
There is substantial scope for raising agricultural productivity, particularly that of
food grains by adopting a multi pronged strategy including expansion of the area
under assured irrigation, application of recommended doses of fertilizers, use of
HYV seeds, and application of modern technology. Additionally, the varied agro-
climatic conditions of the State provide excellent scope for horticulture,
cultivation of vegetables, plantation crops, spices, flowers and medicinal herbs.
Suitable cropping patterns have to be developed taking into account the agro-
climatic conditions of different zones in the State, both for agricultural and
horticultural crops. Agro-based industries have to be set up to absorb unutilized
manpower from the agricultural sector and to reduce unemployment,
underemployment and disguised unemployment in rural areas.
Growth Rate in Agriculture needs to be increased to 4.5% in conformity with all-India Target as set forth by the Tenth Plan

17
Natural Resources: Coastal districts with higher population density are having
comparatively smaller areas of forest and high forest coverage is found in districts
of Kandhamal, Sundargarh, Mayurbhanj, Sambalpur, Malkangiri, Gajapati, Deogarh
and Keonjhar. National Forest Policy, 1988 has mandated that 33% of the
geographical area should be under forest cover, with 60% coverage in hilly tracts
and 20% in plains. Against this, the State has 31.4% forest cover according to the
Forest Survey of India and there is an need to accelerate efforts for afforestation
and regeneration of degraded forests to achieve the mandated 33% forest-covers.
Natural ResourcesTotal Forest Area
(Sq Km)% Forest
area
Total Livestock
('000)Poultry ('000) Production of Egg
(Cr.)Production of Milk
('000 tonnes)
2001 1999-00 1997 1997 2001-2002 2001-2002Andhra Pradesh 44637 - 36009 63396 1331.5 5814Gujarat 15152 9.91 19930 7236 37 5862Karnataka 36991 16.08 28526 21399 202.7 4747Kerala 15560 27.85 4292 18397 200.1 2718Maharashtra 47482 17.44 39630 35392 319.4 6094Orissa 48838 37.3 23338 18435 83.7 929Punjab 2432 6.06 9858 11022 334.6 8375Tamil Nadu 21482 16.43 24126 36511 422.4 4988West Bengal 10693 13.7 36997 33309 271 3515
ALL INDIA 675538 22.55 485385 347611 3906.9 84754Source C.M.I.E. Agriculture, February 2004
Statistical Abstract India, 2002, C.S. O.
States
Forests are an important source of non-tax revenue for the State Government.
During 2003-04, except the revenue collected from Bamboo, revenue collection
from all other sources has declined over 2002-03. The total revenue receipt from
forest products during 2003-04 has decreased by 60.50% over 2002-03.
Fisheries and Animal Husbandry: Fishery Sector has been gradually drawing
attention as an important area for employment and income generation in the
State. Orissa being abundant with water resources has enough scope and
potentialities for development of fisheries sector. Fishery resources and
potentialities have become more and more obvious with introduction of improved
technology and rising interest of the public in the fishing activities. Per capita
annual consumption of fish from domestic production in the State has increased
State has a forest cover of only 48,838 sq Km, which includes 219 sq Km of Mangrove, 5,782 sq Km of Scrub, 27,972 sq Km of Dense and 20,866 sq Km of Open forests
State is working towards increasing the scope and potential of the Fishery Sector and also aims at achieving the WHO Recommended Annual Per Capita Fish Consumption Level

18
from 7.71 kg in 2000-01 to 8.28 kg in 2003-04. State Government aims to raise the
per-capita annual consumption of fish in Orissa to WHO Recommended Annual Per
Capita Fish Consumption Level, by end of Tenth Plan.
Next to crop production, animal husbandry is the most important income
generating activity in rural households. Over 80% of the rural households in Orissa
keep livestock of one species or another. With a view to increasing fish production
in Orissa, the State Government has formulated the policy for Fishery Development
as a part of the Agriculture Policy, 1996, which emphasizes adoption of scientific
methods of Pisciculture, provision of assistance to fishermen, intensive fishing
operations in deep sea, imparting training to fishermen for culture and capture of
fish and for establishment of feed mills.
Poultry Sector in Orissa has made significant progress over the years and there is
vast scope for generation of employment in poultry farming. Leasing out of
departmental farms to private entrepreneurs is also under consideration. Animal
Husbandry and Dairy Development, being important rural oriented income-
generating sectors, offer ample opportunities for increased household incomes and
employment opportunities.
2.3 State of Human Development
States/Union Territories 1981 1991 2001 Andhra Pradesh 0.298 (9) 0.377 (9) 0.416 (10) Assam 0.272 (10) 0.348 (10) 0.386 (14) Bihar 0.237 (15) 0.308 (15) 0.367 (15) Gujrat 0.360 (4) 0.431 (6) 0.479 (6) Haryana 0.360 (5) 0.443 (5) 0.509 (5) Karnataka 0.346 (6) 0.412 (7) 0.478 (7) Kerala 0.500 (1) 0.591 (1) 0.638 (1) Madhya Pradesh 0.245 (14) 0.328 (13) 0.394 (12) Maharashtra 0.363 (3) 0.452 (4) 0.523 (4) Orissa 0.267 (11) 0.345 (12) 0.404 (11) Punjab 0.411 (2) 0.475 (2) 0.537 (2) Rajasthan 0.256 (12) 0.347 (11) 0.424 (9) Tamil Nadu 0.343 (7) 0.466 (3) 0.531 (3) Uttar Pradesh 0.255 (13) 0.314 (14) 0.388 (13)
State-level Fishery Policy has been formulated for adoption of scientific methods, assisting the fishermen and for imparting training in fish culture and capture
19
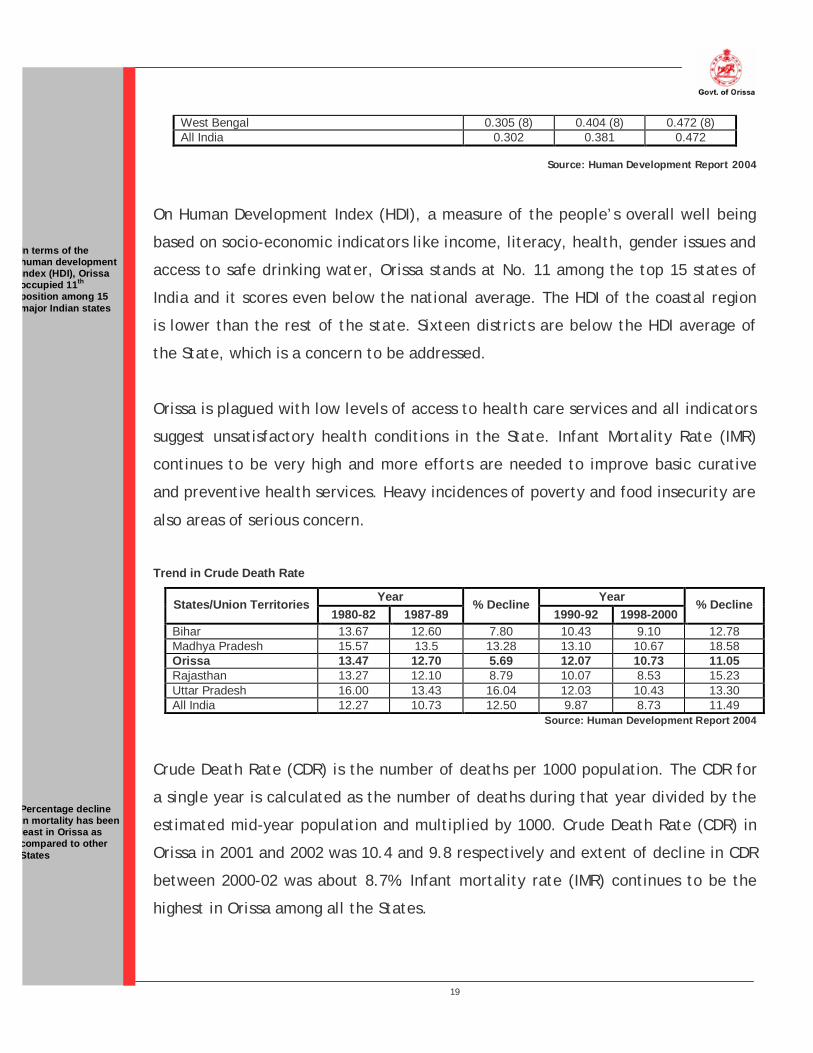
West Bengal 0.305 (8) 0.404 (8) 0.472 (8) All India 0.302 0.381 0.472
Source: Human Development Report 2004
On Human Development Index (HDI), a measure of the people’s overall well being
based on socio-economic indicators like income, literacy, health, gender issues and
access to safe drinking water, Orissa stands at No. 11 among the top 15 states of
India and it scores even below the national average. The HDI of the coastal region
is lower than the rest of the state. Sixteen districts are below the HDI average of
the State, which is a concern to be addressed.
Orissa is plagued with low levels of access to health care services and all indicators
suggest unsatisfactory health conditions in the State. Infant Mortality Rate (IMR)
continues to be very high and more efforts are needed to improve basic curative
and preventive health services. Heavy incidences of poverty and food insecurity are
also areas of serious concern.
Trend in Crude Death Rate
Year Year States/Union Territories 1980-82 1987-89
% Decline 1990-92 1998-2000
% Decline
Bihar 13.67 12.60 7.80 10.43 9.10 12.78 Madhya Pradesh 15.57 13.5 13.28 13.10 10.67 18.58 Orissa 13.47 12.70 5.69 12.07 10.73 11.05 Rajasthan 13.27 12.10 8.79 10.07 8.53 15.23 Uttar Pradesh 16.00 13.43 16.04 12.03 10.43 13.30 All India 12.27 10.73 12.50 9.87 8.73 11.49
Source: Human Development Report 2004
Crude Death Rate (CDR) is the number of deaths per 1000 population. The CDR for
a single year is calculated as the number of deaths during that year divided by the
estimated mid-year population and multiplied by 1000. Crude Death Rate (CDR) in
Orissa in 2001 and 2002 was 10.4 and 9.8 respectively and extent of decline in CDR
between 2000-02 was about 8.7%. Infant mortality rate (IMR) continues to be the
highest in Orissa among all the States.
In terms of the human development index (HDI), Orissa occupied 11th position among 15 major Indian states
Percentage decline in mortality has been least in Orissa as compared to other States

20
Low birth weight is the most important factor in contributing to the high IMR and
pre-maturity accounts for 38 percent of infant deaths. It is noteworthy that IMR has
come down to 91 (per ‘000 live births) in 2001 and further to 87 in 2002, which
implies annual decline of 5.2%.
Social Indicators (Mortality and Child Helath)
Rural Urban Total Rural Urban TotalAndhra Pradesh 74 39 66 62 21.3 19.6 20.8 20.6 8.0Gujarat 67 42 60 60 26.6 21.5 24.9 24.6 7.6Karnataka 69 27 58 55 23.6 19.0 22.2 22.0 7.2Kerala 12 9 11 10 17.4 16.6 17.2 16.8 6.4Maharashtra 55 27 45 45 21.0 20.1 20.6 20.2 7.3Orissa 94 60 90 87 23.9 19.6 23.4 23.1 9.8Punjab 55 37 51 51 22.1 18.7 21.2 20.8 7.1Tamil Nadu 54 35 49 44 19.6 17.8 19.0 18.5 7.7West Bengal 53 38 51 49 22.8 13.8 20.5 20.3 6.6
ALL INDIA 72 42 66 64 27.1 20.2 25.4 25.0 8.1(*) Based on Sample Registration System
States
Annual death rate (per 1000
live births), 2002
Birth Rate (per 1000), 2001 Annual Birth Rate (per
1000), 2002
Infant Mortality Rate (per 000), 2001 Annual Infant
Mortality Rate, 2002
Overall literacy rate in Orissa has increased by 15% between 1991 and 2001, from
49.09 per cent to 63.61 per cent. This increase is roughly the same for India and for
states with comparable levels of literacy in 1991. However, as per the 2001 Census,
Orissa still ranks a lowly 24th among 35 States/Union Territories.
There is also significant disparity between urban and rural literacy rates, evidently
due to better physical and economic access to education in urban areas. The
gender disparity is more prominent in the rural areas as compared to the urban
areas. Similarly, between the rural and urban areas, the disparity in literacy rate
amongst females is more as compared to males.
Areas Census Males (%) Females (%) All (%) Gender Disparity 1981 53.54 21.99 37.77 1.4347 1991 60.00 30.79 45.46 0.9487 Rural 2001 73.57 47.22 60.44 0.5580 1981 76.38 50.95 64.81 0.4991 1991 81.21 61.18 71.99 0.3274 Urban 2001 88.32 72.68 80.95 0.2152
All Areas 1981 56.45 25.14 40.97 1.2454
Significant disparity exists in Orissa between the rural and urban literacy rates

21
1991 63.09 34.68 49.09 0.8192 2001 75.95 50.97 63.61 0.4901
Rural-Urban Disparity 1981 0.4266 1.3170 0.7159 1991 0.3535 0.9870 0.5836 2001 0.2005 0.5392 0.3393
Source: Human Development Report 2004
Amongst different social groups, Literacy Rate in Orissa is the lowest in the case of
Scheduled Tribes and the highest among general castes. Furthermore, the gender
disparity in literacy is found to be the highest among the Scheduled Tribes, and
lowest in the case of general castes.
Human Development Indicators for Orissa
Indicators Year Unit Orissa All India Infant mortality Rate 2002 Per ‘000 live birth 87.0 63.0
Male 1992-1996 Years 59.2 63.8 Life Expectancy at Birth Female 1992-1996 Years 61.0 66.9 Death Rate 1998-2000 Per ‘000 population 10.7 8.7
Male 2001 Per cent 76.0 75.9 Female 2001 Per cent 51.0 54.2 Literacy Rate Person 2001 Per cent 63.0 65.4 Boys 2003-2004 Per cent 89.4 97.5 Girls 2003-2004 Per cent 89.8 93.0 Gross Enrolment Ratio
(6-14 years) Total 2003-2004 Per cent 89.6 95.4
Primary Schools 2000-2001 Per Lakh Population 115 63.4 Professional Institutes 2000-2001 Per Lakh Population 2.9 2.5
* Professional educational institutions include engineering, technology, architecture, medical and teacher training colleges
India’s Planning Commission has identified Orissa as having the highest overall
poverty ratio of any major Indian State, with around 45% of the people of the State
living below the Government of India poverty line. However, it is found that there
has been a steady decline in the poverty ratio in Orissa between 1977–78 and 1993–
94. Further, in second half of the 1990s, poverty ratio remained almost stationary.
Percentage of population below poverty line (1999-00)
Per capita Net State Domestic Product (2002-03)
State Rural Urban Combined At current prices (Rs.)
At constant prices (Rs.)
Orissa 48.0 42.8 47.2 10208 5665
INDIA 27.1 23.6 26.1 18912 10964
Poverty in Orissa is overwhelmingly a rural phenomenon with 48% of State’s rural population below poverty line

22
The per capita consumption of electricity of Orissa is lowest among the major
states in India. The state Government aims to electrify all villages by 2007. The
usage of various means of communication, such as television, is quite low
compared to the national average. Poverty is the primary reason for this kind of
situation and once this concern is taken care of, the flow of information to the
rural areas and the resultant awareness would be a direct benefit.
Social Indicators (Basic Amenities)
Per-capita Consumptio
n of Electricity
(KWH)
% of Villages
electrified
Pumpsets energised
('000')
No.of Newspapers
and Periodicals
T.V - Home
Viewers - Urban
T.V - Home
Viewers - Rural
ISM and H Doctors per
lakh of population
Population per
bank('000)
No. of post offices/lakh of
population
2002-2003 2001 2001 2002-2003 (in Million)
(in Million) 2002 2003 2001-02
Andhra Pradesh 673 100 2249894 2651 22.0 24.1 38.6 14.7 21Gujarat 1193 100 764564 2492 15.6 7.8 44.3 14.2 18Karnataka 611 99 1402209 2854 15.2 12.1 35.6 11.3 19Kerala 378 100 417640 1944 6.8 11.2 72.1 9.7 16Maharashtra 848 92 2417075 6415 40.2 22.4 86.0 15.8 13Orissa 470 75 74625 997 4.0 5.5 23.9 16.9 22Punjab 1227 100 835651 1271 7.1 9.6 138.1 9.5 16Tamil Nadu 815 100 1793948 3093 21.5 21.4 59.7 13.3 20West Bengal 366 78 112322 3906 17.8 13.9 56.4 18.5 11
ALL INDIA 355 87 13044 55780 229.3 207.0 67.3 15.9 15Source: Department of ISM & Homeopathy, New Delhi
Indian Systems of Medicine & Homoeopathy (ISM&H)Central Electricity Authority: Ministry of power
States
Beside other inferences, data contained in the table above indicates the absence of
a vibrant and growing Middle Class in the State, which is a prerequisite for the
long-term and all-round development of any contemporary society.
2.4 Economy
The economic state of affairs is not exactly encouraging. The State Per Capita
Income is way below the National Average. The difference between per capita
income at State and National levels for 2003-04 stood at Rs. 5,185 at 1993-94 prices
and difference at current prices has been Rs. 8474 for 2003-04. The difference
Relative rate of growth of Orissa’s economy has been quite slow in catching up with the National Average

23
between the per capita income between State and National level has gone up from
Rs 6139 (in 1999-00) to Rs. 8474 (in 2003-04) at current prices.
Economic indicators of the State
Indicators Year Unit Orissa All India Per capita NSDP at Constant (1993-94) prices 2002-03 Rs 5665 10964 SDP/GDP per capita 2002-03 Rs 24613 17822.8
Primary 2003-04 Percent 41.08 26.28 Secondary 2003-04 Percent 12.59 24.41 Tertiary 2003-04 Percent 20.89 - Composition of SDP/GDP
Service 2003-04 Percent 25.44 49.31 Rice 2003-04 Qtl per hector 14.96 19.01 Autumn Rice 2003-04 Qtl per hector 9.82 - Winter Rice 2003-04 Qtl per hector 15.81 -
Average yield of principal crops
Summer Rice 2003-04 Qtl per hector 21.12 - Cropping Intensity 2003-04 Percent 149 135 Consumption of fertilizers 2003-04 Kg per hector 39 89.8
Credit Deposit ratio 2004 Per Lakh Population 54.26 59.4
While the Gross State Domestic Product (GSDP) increased from Rs. 18,536.66 Crores
in 1993-94 to Rs. 28,685.68 Crores in 2003-04 at 1993-94 prices (registering a
compound annual growth rate of 4.46%), the Net State Domestic Product (NSDP)
increased from Rs. 16,184.88 Crores in 1993-94 to Rs. 24,613.00 Crores in 2003-04
at 1993-94 prices. The per capita income at 1993-94 prices increased from Rs.
4,896 to Rs. 6,487 during this period.
Economic Indicators : BudgetNet Domestic
Product (Rs Crores)
2000-01 Revenue Expenditure Receipts DisbursementsAndhra Pradesh 124443 25675 28157 9678 7263Gujarat 93601 18349 24165 10174 5060Karnataka 94635 18799 21404 6845 4295Kerala 69602 11976 13893 4283 1467Maharashtra 227893 35750 40152 10756 5326Orissa 30795 9603 11358 4562 2807Punjab 60890 12946 15964 5780 3214Tamil Nadu 130917 21318 26862 8870 3327West Bengal 128387 17905 25696 13270 5334
ALL INDIA N.A. 3069431 355166 118812 75768Source : Banking Statistics Quarterly Hand Out, March 2003
Sample Registration System Bulletin, Oct' 2003Budget estimates:2001-2002
StatesRevenue Budget (Rs Crores), 2000-01 Capital Budget (Rs Crores), 2000-01

24
Though share of Agricultural Sector in Orissa’s NSDP has declined from 38% in 1993-
94 to 25% in 2003-04 at 1993-94 prices, yet the sector continues to dominate State
economy. Agriculture provides employment to around 65% of workforce directly or
indirectly as per 2001 Census and since agriculture is mostly rain-fed, erratic
behaviors of the monsoons cause constant fluctuations in agricultural production.
The State has been experiencing serious fiscal stress for several years and is
currently facing a serious fiscal crisis. The burgeoning non-Plan expenditure arising
out of substantial increase in salaries and pensions and the widening gap between
non-Plan revenue expenditure and receipts have necessitated higher borrowing and
higher debt servicing liabilities. The increasing disequilibrium between revenue
receipts and expenditure needs to be effectively corrected, for the state to be in a
position to discharge the social and economic responsibilities.
2.5 Physical Infrastructure
Road Network: In absence of adequate internal rail linkages, roads are the major
means of transportation in the State. Total road length in State was only 2,38,006
km as on 31.03.2004 and it may be noted here that ensuring All-weather
Connectivity to every village is necessary for improving quality of life and economic
conditions, especially in a State like Orissa.
Rural connectivity has been identified as one of the basic minimum services for
development of agriculture and the rural economy and the State Government have
accorded high priority to this sector. Further, realizing the importance of rural
connectivity, the Govt. of India launched Pradhan Mantri Gram Sadak Yojana
(PMGSY) in the year 2000. The primary objective of the PMGSY is to provide
connectivity to all habitations with a population of 1000 persons and above in three
years (2000-03) and to all unconnected habitations with a population of 500
Orissa will have to raise its level of growth from 3.9% to 6.2% to be in line with State’s Poverty Reduction Target
State needs to rectify and manage increasing disequilibrium between revenue receipts and expenditures
Only 40% of villages in the State have all-weather connectivity
25
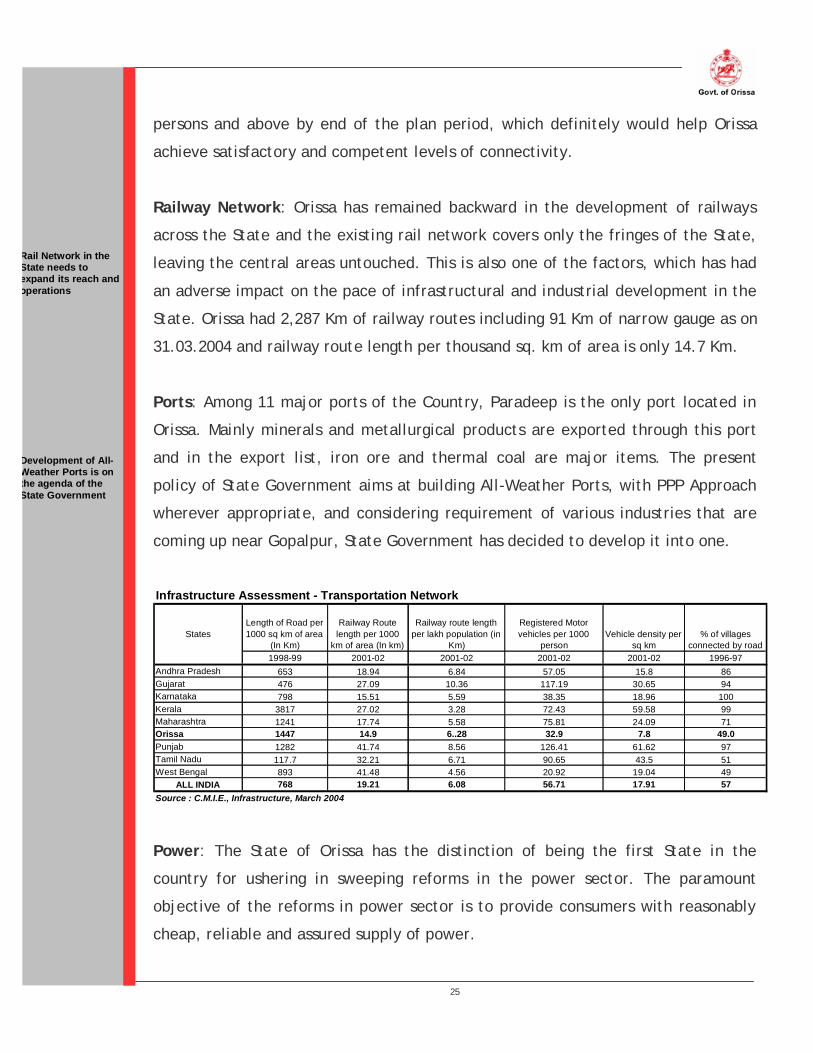
persons and above by end of the plan period, which definitely would help Orissa
achieve satisfactory and competent levels of connectivity.
Railway Network: Orissa has remained backward in the development of railways
across the State and the existing rail network covers only the fringes of the State,
leaving the central areas untouched. This is also one of the factors, which has had
an adverse impact on the pace of infrastructural and industrial development in the
State. Orissa had 2,287 Km of railway routes including 91 Km of narrow gauge as on
31.03.2004 and railway route length per thousand sq. km of area is only 14.7 Km.
Ports: Among 11 major ports of the Country, Paradeep is the only port located in
Orissa. Mainly minerals and metallurgical products are exported through this port
and in the export list, iron ore and thermal coal are major items. The present
policy of State Government aims at building All-Weather Ports, with PPP Approach
wherever appropriate, and considering requirement of various industries that are
coming up near Gopalpur, State Government has decided to develop it into one.
Infrastructure Assessment - Transportation Network
Length of Road per 1000 sq km of area
(In Km)
Railway Route length per 1000
km of area (In km)
Railway route length per lakh population (in
Km)
Registered Motor vehicles per 1000
personVehicle density per
sq km% of villages
connected by road1998-99 2001-02 2001-02 2001-02 2001-02 1996-97
Andhra Pradesh 653 18.94 6.84 57.05 15.8 86Gujarat 476 27.09 10.36 117.19 30.65 94Karnataka 798 15.51 5.59 38.35 18.96 100Kerala 3817 27.02 3.28 72.43 59.58 99Maharashtra 1241 17.74 5.58 75.81 24.09 71Orissa 1447 14.9 6..28 32.9 7.8 49.0Punjab 1282 41.74 8.56 126.41 61.62 97Tamil Nadu 117.7 32.21 6.71 90.65 43.5 51West Bengal 893 41.48 4.56 20.92 19.04 49
ALL INDIA 768 19.21 6.08 56.71 17.91 57Source : C.M.I.E., Infrastructure, March 2004
States
Power: The State of Orissa has the distinction of being the first State in the
country for ushering in sweeping reforms in the power sector. The paramount
objective of the reforms in power sector is to provide consumers with reasonably
cheap, reliable and assured supply of power.
Rail Network in the State needs to expand its reach and operations
Development of All-Weather Ports is on the agenda of the State Government
26
The existing transmission and distribution system is entrusted to GRID Corporation
of Orissa (GRIDCO) and all hydro power stations including projects under
construction are under Orissa Hydro Power Corporation (OHPC). The Orissa Power
Generation Corporation (OPGC), which was incorporated in 1984, is looking after
the thermal power projects in the State.
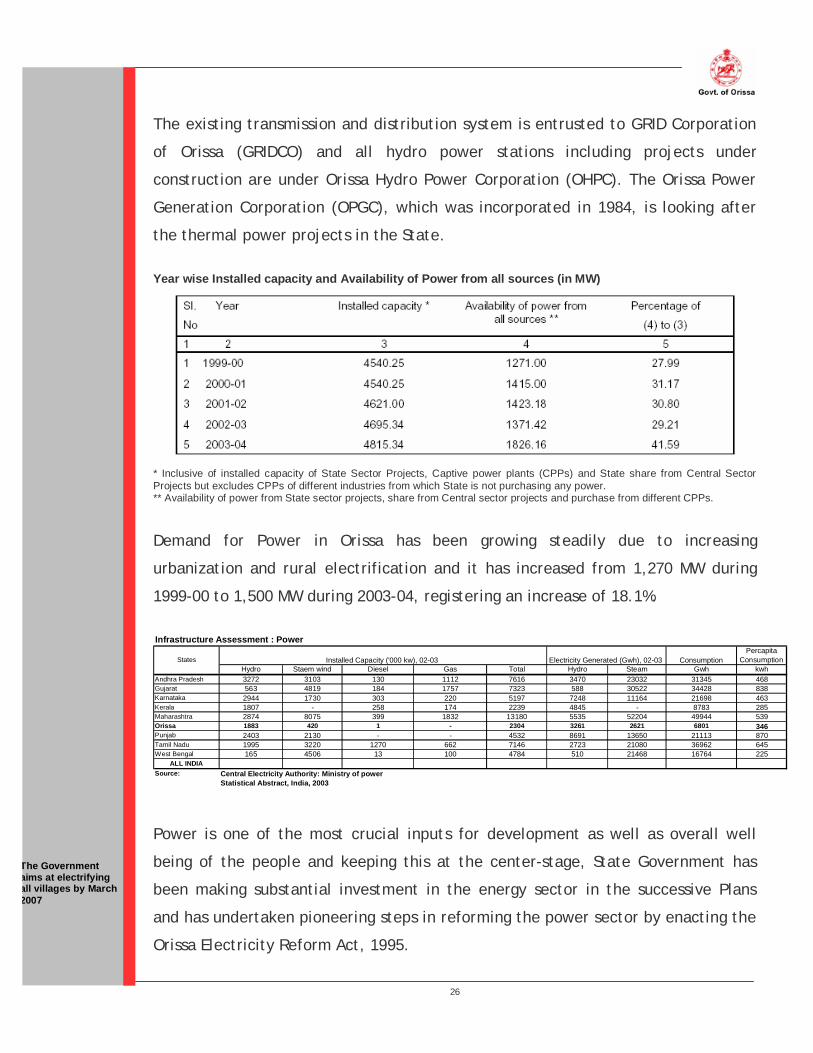
Year wise Installed capacity and Availability of Power from all sources (in MW)
* Inclusive of installed capacity of State Sector Projects, Captive power plants (CPPs) and State share from Central Sector Projects but excludes CPPs of different industries from which State is not purchasing any power. ** Availability of power from State sector projects, share from Central sector projects and purchase from different CPPs.
Demand for Power in Orissa has been growing steadily due to increasing
urbanization and rural electrification and it has increased from 1,270 MW during
1999-00 to 1,500 MW during 2003-04, registering an increase of 18.1%.
Infrastructure Assessment : Power
ConsumptionPercapita
Consumption Hydro Staem wind Diesel Gas Total Hydro Steam Gwh kwh
Andhra Pradesh 3272 3103 130 1112 7616 3470 23032 31345 468Gujarat 563 4819 184 1757 7323 588 30522 34428 838Karnataka 2944 1730 303 220 5197 7248 11164 21698 463Kerala 1807 - 258 174 2239 4845 - 8783 285Maharashtra 2874 8075 399 1832 13180 5535 52204 49944 539Orissa 1883 420 1 - 2304 3261 2621 6801 346Punjab 2403 2130 - - 4532 8691 13650 21113 870Tamil Nadu 1995 3220 1270 662 7146 2723 21080 36962 645West Bengal 165 4506 13 100 4784 510 21468 16764 225
ALL INDIASource: Central Electricity Authority: Ministry of power
Statistical Abstract, India, 2003
States Installed Capacity ('000 kw), 02-03 Electricity Generated (Gwh), 02-03
Power is one of the most crucial inputs for development as well as overall well
being of the people and keeping this at the center-stage, State Government has
been making substantial investment in the energy sector in the successive Plans
and has undertaken pioneering steps in reforming the power sector by enacting the
Orissa Electricity Reform Act, 1995.
The Government aims at electrifying all villages by March 2007
27
Private investment in power sector is also being encouraged and State Government
has been attaching considerable importance to tapping energy from the non-
conventional sources that are renewable and environment friendly.
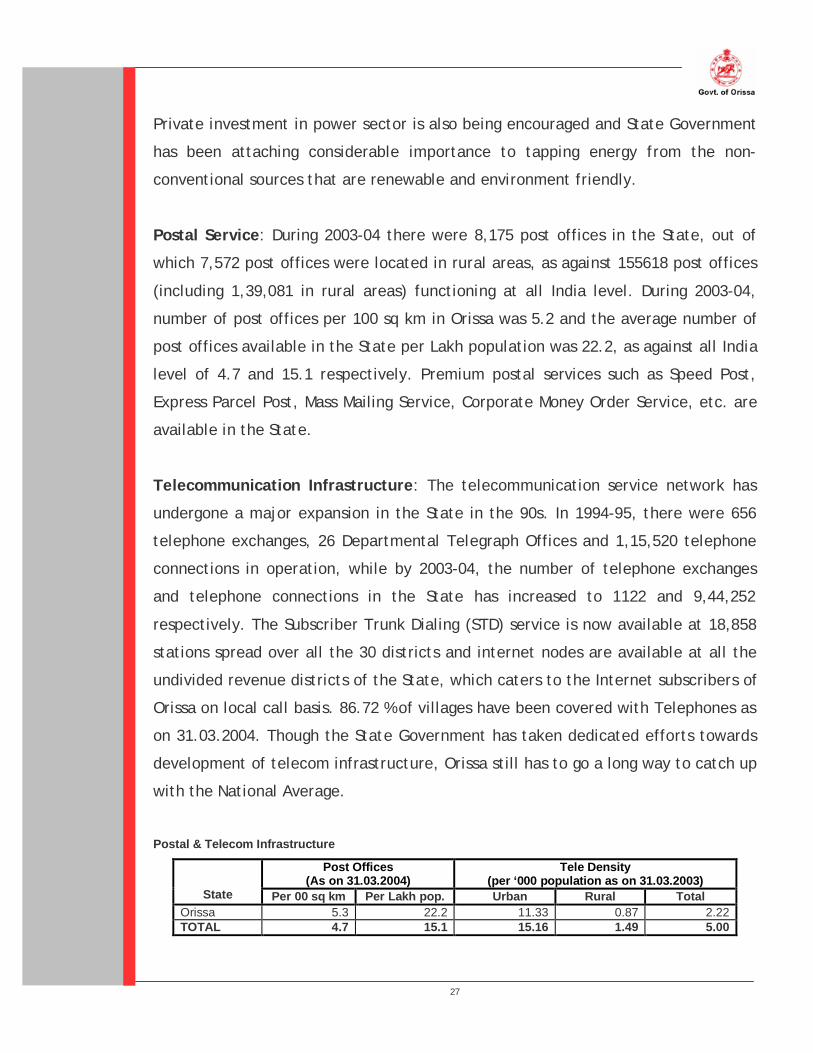
Postal Service: During 2003-04 there were 8,175 post offices in the State, out of
which 7,572 post offices were located in rural areas, as against 155618 post offices
(including 1,39,081 in rural areas) functioning at all India level. During 2003-04,
number of post offices per 100 sq km in Orissa was 5.2 and the average number of
post offices available in the State per Lakh population was 22.2, as against all India
level of 4.7 and 15.1 respectively. Premium postal services such as Speed Post,
Express Parcel Post, Mass Mailing Service, Corporate Money Order Service, etc. are
available in the State.
Telecommunication Infrastructure: The telecommunication service network has
undergone a major expansion in the State in the 90s. In 1994-95, there were 656
telephone exchanges, 26 Departmental Telegraph Offices and 1,15,520 telephone
connections in operation, while by 2003-04, the number of telephone exchanges
and telephone connections in the State has increased to 1122 and 9,44,252
respectively. The Subscriber Trunk Dialing (STD) service is now available at 18,858
stations spread over all the 30 districts and internet nodes are available at all the
undivided revenue districts of the State, which caters to the Internet subscribers of
Orissa on local call basis. 86.72 % of villages have been covered with Telephones as
on 31.03.2004. Though the State Government has taken dedicated efforts towards
development of telecom infrastructure, Orissa still has to go a long way to catch up
with the National Average.
Postal & Telecom Infrastructure
Post Offices (As on 31.03.2004)
Tele Density (per ‘000 population as on 31.03.2003)
State Per 00 sq km Per Lakh pop. Urban Rural Total Orissa 5.3 22.2 11.33 0.87 2.22 TOTAL 4.7 15.1 15.16 1.49 5.00
28
Only 5 States in India have Tele-Density lesser than Orissa and it may be noted here
that telephone network and tele-penetration have a direct bearing on ability of the
State to remain connected with its remotest parts, facilitating good governance.
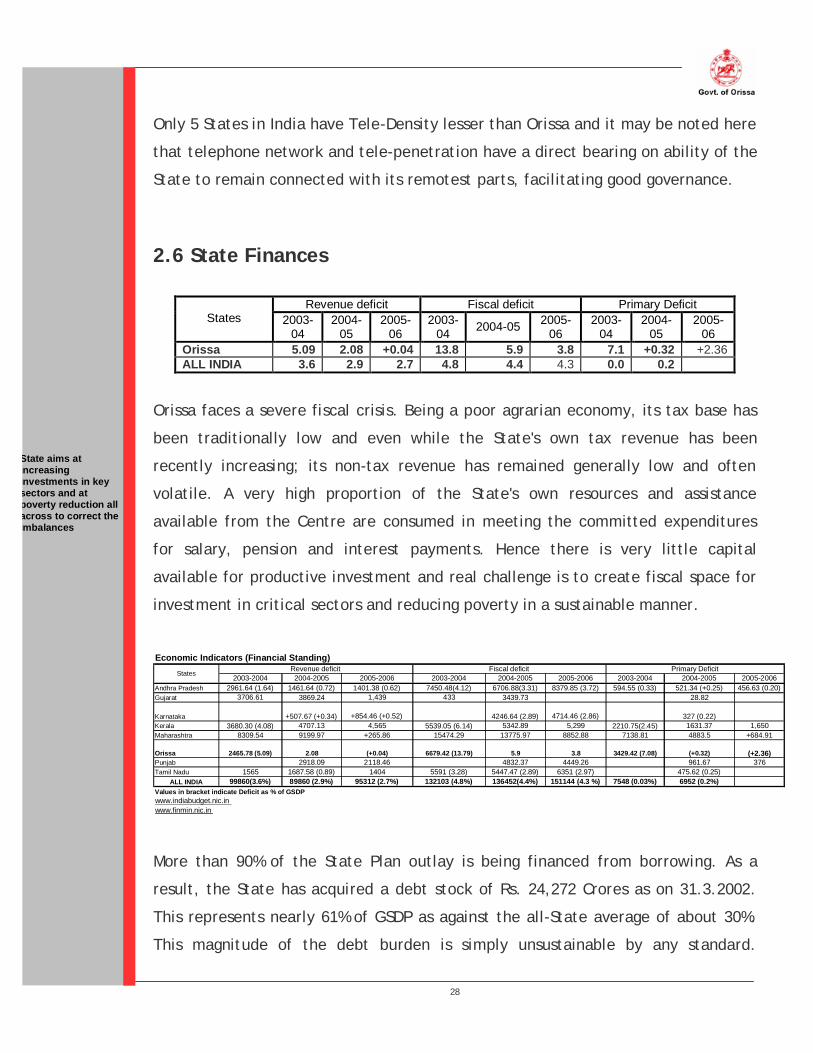
2.6 State Finances
Revenue deficit Fiscal deficit Primary Deficit States 2003-
04 2004-
05 2005-
06 2003-
04 2004-05 2005-06
2003-04
2004-05
2005-06
Orissa 5.09 2.08 +0.04 13.8 5.9 3.8 7.1 +0.32 +2.36 ALL INDIA 3.6 2.9 2.7 4.8 4.4 4.3 0.0 0.2
Orissa faces a severe fiscal crisis. Being a poor agrarian economy, its tax base has
been traditionally low and even while the State's own tax revenue has been
recently increasing; its non-tax revenue has remained generally low and often
volatile. A very high proportion of the State's own resources and assistance
available from the Centre are consumed in meeting the committed expenditures
for salary, pension and interest payments. Hence there is very little capital
available for productive investment and real challenge is to create fiscal space for
investment in critical sectors and reducing poverty in a sustainable manner.
Economic Indicators (Financial Standing)
2003-2004 2004-2005 2005-2006 2003-2004 2004-2005 2005-2006 2003-2004 2004-2005 2005-2006Andhra Pradesh 2961.64 (1.64) 1461.64 (0.72) 1401.38 (0.62) 7450.48(4.12) 6706.88(3.31) 8379.85 (3.72) 594.55 (0.33) 521.34 (+0.25) 456.63 (0.20)Gujarat 3706.61 3869.24 1,439 433 3439.73 28.82
Karnataka +507.67 (+0.34) +854.46 (+0.52) 4246.64 (2.89) 4714.46 (2.86) 327 (0.22)Kerala 3680.30 (4.08) 4707.13 4,565 5539.05 (6.14) 5342.89 5,299 2210.75(2.45) 1631.37 1,650Maharashtra 8309.54 9199.97 +265.86 15474.29 13775.97 8852.88 7138.81 4883.5 +684.91
Orissa 2465.78 (5.09) 2.08 (+0.04) 6679.42 (13.79) 5.9 3.8 3429.42 (7.08) (+0.32) (+2.36)Punjab 2918.09 2118.46 4832.37 4449.26 961.67 376Tamil Nadu 1565 1687.58 (0.89) 1404 5591 (3.28) 5447.47 (2.89) 6351 (2.97) 475.62 (0.25)
ALL INDIA 99860(3.6%) 89860 (2.9%) 95312 (2.7%) 132103 (4.8%) 136452(4.4%) 151144 (4.3 %) 7548 (0.03%) 6952 (0.2%)Values in bracket indicate Deficit as % of GSDPwww.indiabudget.nic.inwww.finmin.nic.in
Primary DeficitRevenue deficit Fiscal deficitStates
More than 90% of the State Plan outlay is being financed from borrowing. As a
result, the State has acquired a debt stock of Rs. 24,272 Crores as on 31.3.2002.
This represents nearly 61% of GSDP as against the all-State average of about 30%.
This magnitude of the debt burden is simply unsustainable by any standard.
State aims at increasing investments in key sectors and at poverty reduction all across to correct the imbalances

29
Because of persistent problem of debt overhang, the gap between Non-Plan receipt
and expenditure is growing wider and wider.
10th and 11th Finance Commission recommended the debt relief linked to fiscal
performance, but Orissa is not able to get any debt relief because of the very fact
that interest payment itself constitutes as high as 32% of total Non-plan revenue
expenditure and 24% of total revenue expenditure and this is rising each year.
Secondly, on the revenue side, there is a shortfall in shared taxes compared to the
estimates made by the Finance Commission. Further, royalty being a major source
of Non-tax revenue, non-revision of the rate of royalty on coal regularly has
adversely impacted collection of the State's non-tax revenue. The revisions of
royalty made on major minerals other than coal have not, contributed to any
significant increase in the Non tax revenue.
30
3. SWOT Analysis
3.1 Strengths & Opportunities
The biggest strength of Orissa is its diverse but cohesively interwoven social
infrastructure. At the time when democracies all across the World are trying to
evolve to next and more effective stage of governance by the means of localized,
decentralized but interlinked decision-making mechanisms, Orissa starts with
advantage of already having a rich legacy of autonomous but interoperable
coexistence among various ethnic groups, tribal sets and regional collections in a
predominantly rural society.
This implies that empowerment of institutions of local governance, as envisaged by
Government of India, would require considerably less social reengineering in Orissa
in comparison to most other regions of the Country. This also implies that in terms
of attracting active and long-term participation from various external entities in
different domains of its economic and social life, Orissa is among the Best.
Abundant mineral resources make a considerable contribution to Orissa’s set-of-
strengths and if utilized in an optimized manner (with active participation from the
private sector), these resources have the capability to fuel the State’s successful
transition to the next stage of governance and also aid in the optimization of
State’s basic infrastructure.
As agriculture contributes more that 20% to Orissa’s NSDP and provides employment
to more than 60% of total workforce in the State, it is necessary that the State
Government accords appropriate resources to this sector to facilitate a Growth
Rate of at least 4.5% in conformity with target as set forth by Tenth Plan.
Furthermore, Fisheries and Animal Husbandry have the potential to emerge as
important areas for employment and income generation in the State and although,
Cohesively interwoven social infrastructure with rich legacy of coexistence among various ethnic groups, tribal sets and regional collections
Abundant mineral resources can fuel the transition to next stage of governance and could aid in optimization of basic infrastructure

31
the Government has been making efforts in facilitating the development of these
sectors, it is necessary that a more focused approach be adopted.
State’s unique geographical location, climate and topology make it an ideal place
for setting up advanced weather monitoring, meteorological study and marine
sciences centers, which can attract participation (in terms of students, trained
manpower and funds) from all across South-East Asia and also can make Education
as one of primary revenue-sectors, which once achieved translates into a region
being categorized as truly developed in terms of its human capital.
Vibrant institutions of democracy also contribute to an entity’s set-of-strengths as
they help in establishing effective mechanisms of checks and balances. In Orissa’s
case, regionally and ideologically diverse aspirations mandate that micro
perspective be provided to decision-making whereas an institutionalized and
efficient administrative setup ensures that implementation is done within a
predefined macro framework. And this ensures that State’s different stakeholders
get their share in governance but in well-regulated manner.
3.2 Weaknesses & Threats
Orissa still has a lot of catching-up to do in quite of few areas. The current state of
basic infrastructure is not adequate enough to fulfill the needs and aspirations of
Orissa’s citizens and a significant portion of State’s population is still not having
sufficient access to many of the basic amenities such as education, healthcare,
roads, electricity, drinking water, sanitation, etc.
Orissa is least urbanized of all major States in India, with 85% of the population still
living in villages. Furthermore, it is important to note that considerable portion of
State’s population still lives below levels deemed appropriate by various
developmental indices/standards and this is a huge chasm that any future plan for
Orissa is ideal for setting up weather monitoring, meteorological study and marine sciences centers to attract participation from all across South-East Asia
Diverse political leadership mandates micro perspective to decision-making whereas institutionalized administrative setup ensures implementation within a predefined macro framework
Basic infrastructure not adequate enough to fulfill the needs & aspirations of citizens of the State
A considerable portion of State’s population is still below the levels deemed appropriate by Developmental Agencies
32
the State has to really focus upon. Need is to focus at earnest upon reducing
Mortality Rates (IMR as well as General), tackling poverty and food insecurity that
is prevailing across the State and other human development issues, which continue
to make Orissa one of least developed States in the Indian Union.
Orissa is vulnerable to natural disasters including flood, draught and cyclone. And
as such external shocks can threaten the overall development of the State, the
Government’s approach has rightly shifted from relief to long-term emphasis on
disaster risk reduction. Further, poverty varies significantly according to region,
social group and gender in Orissa. State’s high proportions of SC/ST people are
particularly likely to be among the long-term poor.
Gaps in planning have resulted in the State not utilizing and reinvesting its
Revenues and Resources in the best possible manner. Revisions and fine-tuning of
strategy and operating methodologies might be explored in key areas, such as
agriculture, rural development & employment generation, education & healthcare,
water resource management, consumer welfare, and urban development.
State Government’s efforts towards eradication of gender inequality and
empowerment of women is laudable but institutional reforms to establish equal
rights for men and women, for raising awareness and for female education need to
be even more emphasized.
Orissa has been categorized as one of the “severely food insecure regions”. Growth
process alone is not enough to ensure sustainable long-term food security and there
is an urgent need to strengthen Targeted PDS Schemes and Nutritional
Interventions, of empowering local communities to manage risks and uncertainties
of food-access (through grain-banks run by villagers and other devices), and
development of village-level resources like land, water and forests.
State is not utilizing and reinvesting its revenues and resources in best possible manner
Institutional reforms for gender-issues need to be more emphasized
Need is to empower local communities to manage uncertainty of food-access and self-sustenance at village-levels

33
Optimization of State’s human capital by creating diverse avenues for skill
acquisition and enhancement is another subject that needs immediate attention in
terms of plan and strategy. There is a definite need for realignment of State’s
human capital developmental strategies and focus needs to be on creating a self-
sustainable socio-economic infrastructure where the manpower is developed
keeping in mind the contribution they could bring to the State.
Orissa’s government has acknowledged it as the most heavily indebted of India’s
major States, and has stated that the fiscal crisis is incompatible with
development. Continued stagnation in Orissa’s economic growth rate could
threaten all development work in Orissa. However it is highly encouraging to
observe the Government’s commitment to “equity-oriented growth” - both to
accelerate economic growth, and to ensure that it offers opportunities to all.
Need for realignment of State’s human capital developmental strategies to have a pool of knowledge-workers
34
4. Stakeholders’ Needs & Expectations
During the process of drafting the vision of the State, needs and expectations of
five major stakeholders and process participants were taken into account. These
include citizens, businesses, political leadership, government departments and
related establishments, and educational institutions. In the subsequent paragraphs,
needs and expectations of these five have been highlighted.
4.1 Citizens
Common people of Orissa require the health services that are high quality, modern
and are accessible, available and affordable to all. They want the education to be
available to all, contemporary and skill-centric with strong linkages to changing
demands of the regional and global economies.
Citizens want the disaster management systems in the State to be prompt,
effective and active all across the State with inbuilt preemptory mechanisms.
Specific to State’s rich and diverse social fabric, people desire that issue of social
welfare be dealt via development plans based on contemporary socio-economic and
behavioral studies ensuring maintenance of local identities and autonomies.
People want more work opportunities and avenues, better work conditions and
adequate wages. Their assessment of State’s existing industrial infrastructure and
other businesses is not quite flattering and they would definitely like to have more
opportunities for employment available in every sphere.
Citizens are not quite satisfied with the existing performances in quite a few areas
of governance. They want better roadways across the State and want the public
transport system in the State to become stronger. They want a complete relook

35
into areas of water resources, civil supplies and urban development, and desire
increased involvement of private sector into operations of these domains.
4.2 Businesses
Industries and businesses desire the State Government to bring efficiency in its
functioning and create a more conducive environment for a competitive and
vibrant market in the State. As per representatives of business establishments,
State’s infrastructure is quite below par when compared to other states in the
Country. Improvement and optimization would be quite necessary in road & rail
network, energy and power sectors to ensure the growth of State’s Industrial
Infrastructure and until the State concentrates upon these areas in earnest, the
State would continue to be among last choices to start or operate of any business.
The representatives from business establishments would also like the State’s
Industrial Policy to become more contemporary in its ideology and approach, and
further would like State Government to bring transparency in all matters concerned
with industries. The general opinion with respect to role and approach of official
machinery in dealing with matters concerning the industries is not favorable and
representatives from businesses feel that speed at which matters are resolved in
various Government Offices is quite slow. Furthermore the procurement of state-
specific information and data from different sources in the government is a task
that the industries feel amounts to a lot of time and effort.
With respect to the available human capital in the State, the representatives from
businesses would like the State to take into consideration the skill-set required by
them (at that point of time and in future) while course contents for various
technical and semi-technical courses are defined so as to ensure continues supply
of manpower in accordance to needs of the industry.

36
4.3 Political Leadership
The political leadership in the State is quite unsatisfied with the quality of plan and
policy implementation across various sections of the Government. They feel that
the actual benefits and advantages of various plans and policies are not getting
across to the common citizens due to various lacuna and shortcomings in the
processes and sub-processes of implementation.
4.4 Government Departments
Government Departments and related establishments all across the board would
like to have access to contemporary and modern tools and technologies to aid in
the process of plan and policy implementation, management and monitoring.
As per majority of the respondents, the lack of manpower resources and modern
tools to transact the trades are hampering the government officers to effectively
manage their respective mandates and this is resulting in common citizens not
getting the benefits of various plans and policies.
As per the Government Officers, it is quite imperative that the State’s e-
Governance strategy provisions adequately for non-traditional ICT tools and that
the Government Officials from within different domains are themselves made
capable to select the most-appropriate ICT tools and means to transact their
respective mandates. This is quite opposite to the traditional top-down approach to
the proliferation of ICT tools within a specific domain and would help in ensuring
the active participation from more employees at the operational-levels.
Officers feel that majority of IT roadmaps and plans address purely technological
perspective of the whole issue of better governance and are not derived on the
basis of domain-specific needs and aspirations of the individual departments.

37
They feel that systems based propositional intelligence and operated on the basis
of incremental modernization would be better suited for a State like Orissa where
procedural reengineering is also important need for the Government and its various
organs and institutions.
4.5 Educational Institutions
Education Institutes desire that the Government collaborate with them to fully
understand and incorporate the State-specific context and content into the
curriculum and this not being done till now has resulted in quite a few students not
finding gainful and relevant employment opportunities within the State.
This existence and operability in complete disjoint with localized contextual
conditions has not helped the Educational Institutes in the State and any future
planning with respect to education needs to actively seek the participation of the
Education Institutes for the curriculum finalization activity.

38
4.6 Synthesis of Needs
In order to arrive at the Good Governance Agenda and Targets, it is necessary that
needs and requirements of the State are synthesized and evaluated on the basis of
SWOT analysis and Stakeholders’ expectations as described in Sections above.
In the following table, Sectoral Needs of the State have been stated as
necessitated by SWOT and also as aspired by various stakeholders.
Sector SWOT necessitates & Stakeholders aspire
Health
§ Increase Percentage Decline in Mortality and reduce IMR § Improve HDI Ranking § Improve Basic Curative and Preventive Health Services § Make health services high-quality, modern, accessible, available and affordable § Ensure coordination at inter-program, intra-department and inter-agency levels
Education
§ Improve literacy levels, especially in rural areas and among socially & economically weaker sections of society
§ Take into account localized contextual conditions during planning § Establish advanced meteorological study and marine sciences centers § Make education available to all, contemporary and skill-centric with strong linkages to
changing demands of the regional and global economies § Take industry-needs into consideration while finalizing course contents for various technical
and semi-technical courses § Promote education as one of the main Revenue earning sectors
Disaster Management
§ Shift in policy from relief to disaster management, planning and preparedness § Ensure prompt, effective and active disaster management system all across the State with
inbuilt preemptory mechanisms
SC & ST Development
§ Ensure coordination between various agencies, groups and plans § Improve literacy rate and gender disparity in literacy § Accelerate speed of social reengineering § Base development plans on contemporary socio-economic and behavioral studies to ensure
maintenance of local identities and autonomies
Labor & Employment
§ Create more opportunities in Mineral Sector § Reduce unemployment, underemployment and disguised unemployment in rural areas by
modernizing agriculture and setting-up agro-based industries § Facilitate income generation in rural households by developing fisheries & animal husbandry § Create more work opportunities and ensure better work conditions and adequate wages § Extend planning beyond the national perspective to acquire a more localized perspective
Revenue & Finance
§ Rectify and manage disequilibrium between revenue receipts and expenditure § Create fiscal space for investment in critical sectors § Reduce poverty in a sustainable manner
Agriculture
§ Raise productivity by farmer-facilitation, expansion of the area under assured irrigation, application of recommended doses of fertilizers, use of HYV seeds & modern technology
§ Actively participate in various schemes such as Integrated Cereal Development Program § Encourage horticulture, cultivation of vegetables, plantation crops, spices, flowers and
medicinal herbs § Account for agro-climatic conditions of different zones while developing cropping patterns § Develop agro-based industries § Facilitate a Growth Rate of at least 4.5% in conformity with the Tenth Plan

39
Rural Development
§ Empower institutions of local governance § Tackle poverty and food insecurity § Revive/develop village-level productive resources
Water Resources
§ Manage resources effectively to reduce the risk of droughts, etc. § Implement and monitor various National and State levels schemes
Steel & Mines § Attract greater investment and create more employment opportunities § Aid in the optimization of State’s basic infrastructure § Achieve better rate of exploitation of mineral resources
Transport & Communication
§ Expand the reach and operations of Road Network in the State § Ensure All-weather Connectivity to every village § Develop railway network across the State, especially in the central regions § Develop All-Weather Ports with effective PPPs § Enhance tele-communication infrastructure to match other States § Stronger public transport system
Energy & Power
§ Aim at increasing per capita consumption of electricity across the State § Electrify all the villages in the State by March 2007 § Provide consumers with reasonably cheap, reliable and assured supply of power § Encourage private investment in power sector § Tap energy from the non-conventional sources § Effectively meet the increasing power-demands of businesses and industries
Food & Civil Supplies
§ Act towards Food Insecurity of the people § Increase the involvement of private sector
Urban Development
§ Increase the rate of urbanization to effective levels § Launch mega housing projects and develop satellite township § Encourage participation from private sector § Empower Urban Local Bodies
Women & Child Development
§ Eradicate gender inequality and empower women through institutional reforms § Ensure coordination between various agencies, groups and plans § Encourage effective PPPs § Ensure coordination at inter-program, intra-department and inter-agency levels
Fisheries & Animal Resources
§ Adopt newer technologies and enhance general awareness among people § Encourage effective PPPs § Achieve WHO Recommended Annual Per Capita Fish Consumption Level
Industrial Development
§ Increase the rate of industrialization § Create a business climate conducive to accelerated investment in industry and infrastructure
projects § Optimize the processes to facilitate the end-users
40
5. Good Governance Vision & Agenda
5.1 Good Governance Vision
Good Governance Vision of Orissa is based on the Synthesis of Needs as done in the
previous chapter and has also been influenced by various theories and strategies
(such as Millennium Development Goals) as prepared by UNDP, Planning
Commission and other Developmental Agencies operating on national and
international levels.
Redefine, realign and revitalize State Government Institutions
to evolve to the Next Stage of Governance
where localized but interlinked decision-making and implementation
facilitate autonomous but interdependent growth amongst all Citizens.
The Government in Orissa needs to redefine, realign and revitalize its various
Organs and Institutions to evolve to the Next Stage of Governance, where:
§ Decision-making and implementation would be localized but would also be
completely interlinked via a well-defined framework to maintain an optimized
system of checks and balances
§ Growth among ethnic, tribal and regional collections would be autonomous to
fulfill the individual aspirations but a level of interdependency would be
maintained to ensure all-round growth of people of Orissa
State should aim at reducing situational and contextual gaps in planning and
implementation in the areas of disaster management, education and healthcare,
tribal development, water resource management, civil supplies and consumer
welfare and urban development, utilizing administrative reengineering wherever it
is required and necessary.

41
5.2 Good Governance Agenda
Good Governance Agenda addresses development of the State in 2 stages:
§ Initiation Stage: where key sectors of the State are redefined (in terms of
ideologies, principles, protocols and methodologies as per changed paradigms),
realigned (via strategies and plans for achieving targets as previously set and as
revised to meet newer challenges) and revitalized (by additional capital,
manpower, tool and technologies). This stage would last for 18 to 36 months
and would aim at creating optimized PPPs, Knowledge Workers and
localization/decentralization of powers of governance.
§ Reemergence Stage: Once the first stage is over, all the functions and organs
of State Government should be remodeled on the basis of guiding principals
such as Localized Decision Making, Interlinked Planning, Dynamic Goal Setting
and Adaptive Methodology to fulfill the needs and aspirations of the people.

42
5.3 Strategy
The government of Orissa has to play a critical role in implementing the agenda for
Good Governance, which shall be people -centric and growth-oriented.
Changing Role of Government in the era of “Good Governance”
From To
A major operator in many sectors of economy
A prudent facilitator in areas best operated by the private sectors, and provider of services for others
A regulator and controller of most economic decisions in many sectors
An enabler of market based development through conducive, deregulated policy environment
Direct top down administration and centralized decision making
Enabling, empowering and ensuring participation of local administration and decentralizing decision making
The government has to take care of the following aspects:
§ The Government has recognized the role of private sector; however, it has to be
appreciated that the private sector may not be interested to the desired extent
in certain areas such as Oceanography, etc where they consider the returns are
not immediate and adequate. The Government may continue to make
investments in such strategic sectors so that the gaps between the requirements
of the society as a whole and existing capacity are bridged.
§ The government to act as a facilitator and catalyst of growth and remain
sensitive to the need for social equity and well being
§ Decentralization of Governance with effective local-self government to ensure
that the people have a decisive say in local administration including delivery of
public services.
§ Introducing ‘Electronic Government’, i.e. use IT based services to de-mystify
procedures and improve the Government-Citizen interface
§ Becoming a SMART (Simple, Moral, Accountable, Responsive and Transparent)
Government
§ Enhancing its capabilities and encourage an ethos of public service to
strengthen policy making and performance
§ Taking a leadership role in regulatory and other reforms.
43
5.4 Targets & Objectives
The targets and objectives, which have been set forth in subsequent paragraphs,
have been derived from the already-defined visions of several key departments and
from the discussions that were held with various officials and other stakeholders of
the State. These targets have further been augmented for facilitating realization of
proposed Development Vision and Agenda of the State.
Agriculture: Recognizing the importance of this sector to the State’s economy, the
Government has come up with a comprehensive Agriculture Policy according
agriculture the status of an industry. The objectives of the above policy shall be
pursued vigorously during the Tenth Plan to make Agriculture sector one of the
growth engines for accelerating the pace of development of the State. Orissa has
vast potential for development of horticulture. The Tenth Plan proposals have been
formulated for promoting integrated development of horticulture through area
expansion of fruit crops, vegetables, spices, root and tuber crops and floriculture.
Emphasis has also been given for dissemination of technology by way of massive
training programmes, incentives for production of quality foundation and certified
vegetable cultivation.
Consumer Welfare (Food & Civil Supplies): An efficient Public Distribution System
should ensure availability of essential commodities to the weaker sections of the
society all across the state at reasonable prices and to provide insurance against
instability when inflationary pressures cannot be controlled. The aim of the State
Government is to computerize the accounting system and auditing systems and also
to deploy software to deal with the retailers but there is still a lot of work to be
done in this specific domain as Orissa still ranks low as compared to other States.
Economy: As against the Tenth Plan target growth rate of 6.2%, the growth rates
during 2002-03(P) and 2003-04(Q) were respectively (-) 0.07 percent and 14.40
44
percent. The growth rate during 2002-03 was negative due to drastic fall in
agriculture production in view of severe drought and growth rate during 2003-04
was abnormally high due to negative growth during 2002-03 and better
performance of all the sectors accompanied with record production of food grain.
Education: MDG 2 mandates that universal Primary Education be achieved by 2015
and in this respect, major components already envisaged include ‘Early Childhood
Care Education’, universalization of elementary education, considerably reducing
school dropout rate, and Sarbasiksha Abhiyan. But in Orissa, planning with respect
to higher education needs to extend beyond the national perspective as provided
by various GoI schemes and needs to acquire a more localized perspective in terms
of its context and content – with stress on making Education as one of the primary
revenue-sectors of State’s economy utilizing contemporary strategies, theories and
tools wherever required.
Labor & Employment: Amelioration of poverty and reduction in unemployment
continue to be the prime objectives of development planning in the Country. In
order to achieve these twin objectives, self-employment and wage-employment
programmes have been launched both in rural and urban areas to benefit
economically backward and socially vulnerable target groups. The major
components envisaged in the plan are eliminating gender bias in recruitment,
improving working condition for women employees, organizing women’s
associations in the form of societies and creating employment avenues for the
unskilled laborers of rural areas. However similar to the Education Sector, planning
with respect to labor and employment in the State needs to extend beyond the
national perspective as provided by various GoI schemes and needs to acquire a
more localized perspective. The scheme “Swarnjayanti Gram Swarozgar Yojana”
(SGSY) aims to bring every assisted poor family above the poverty line. Under a
new scheme “Self-employment through Kiosks” it has been targeted to construct
10,000 kiosks/ shopping units during the current plan period. The state has set a

45
target of generation of self-employment avenues for 10.07 Lakh persons during the
tenth pan period. And based on its performance for last 3 years, it needs to create
opportunities for 5.12 Lakh people in 2 years.
Health: As mandated by the Millennium Development Goal (MDG) 4, Child Mortality
Rate has to be reduced by two-thirds between 1990 and 2015. Further, MDG 5,
which deals with maternal health and MDG 6, which deals with prevention of
various diseases, also necessitate that State’s health infrastructure become more
efficient by additional capital inflow, effective PPPs, etc. Major components
already envisaged include controlling communicable and non-communicable
diseases, better distribution of health services and effective partnerships with
private-providers in comprehensive healthcare delivery through a balance of
facilitation and regulation. Besides some special activities in KBK districts are
undertaken under Revised Long Term Action Plan (RLTAP). Under this plan, 16
Urban Water Supply schemes in 7 KBK districts in the State have been approved
with a Project cost of Rs.56.76 Crores.
Fisheries & Animal Resources: Orissa being abundant with water resources has
enough scope and potentialities for development of fisheries sector. The State
Government has formulated a Policy for Fishery Development which envisages
increasing fish production by adopting contemporary methods, assisting fishermen
in more efficient fishing, boosting fishing operations in deep sea, transmitting
technology for culture and capture, establishing fish feed mills, etc. The State
Government aims to increase the per capita annual consumption of fish from 8.28
kg in 2003-04 to 11kg which is the W.H.O. recommended annual per capita fish
consumption level by the end of Tenth Plan. It is targeted to produce 950 TMT of
milk with availability of 72 Gm. of milk per day / per head by the end of 2004-05.
Also it has been targeted to develop 1,000 hectares of brackish water area and to
train 1,050 fish farmers during Tenth Plan period. However, level of digitization is
at a nascent stage and the Department aims towards increasing the general

46
awareness level about computerization and make its employees suitable to harness
potential of ICT tools, which assumes all the more significance keeping in mind the
targets as set by the Fishery Policy.
Transport & Communication: Development of railways, roadways and waterways
transportation to make each and every part of the State accessible remains the
primary objective of this department. In the same context roping in the private
sector is what the State should look for at present. The state government needs to
address the issue of spreading the railway network to the central region. The
ongoing economic reforms attach high priority to development of transport and
communication infrastructure. One of the direct offshoots of a well-networked
transportation infrastructure is timely marketing of agricultural products. However
in spite of the imperative need for accelerated developments and rapid
urbanization, due importance should be attached to the environmental needs. The
urban-rural divide so far Tele-density is concerned is staggering and with an overall
Tele-density of 2.22, Orissa is way behind the National Average of 5.00. As a
footnote – the target as set by New Telecom Policy (NTP) is to achieve the Tele-
density of 15 by 2010 at the National Level.
Women & Child Development: Millennium Development Goal 3 aims to promote
gender equality and empower women but unfortunately, the socio-economic status
of women in Orissa is characterized by low literacy rate, distressing health &
nutritional deficiencies, low proportion of women employees in the organized
sector and declining proportion of the females in the total population. In order to
mitigate these problems, women development has already been given a prominent
place in the agendas as put forth by various development strategies of the State.
Several missions aimed towards women empowerment have been undertaken in
last few years through Women’s Self Help Groups (WSHG). However there is a need
to reexamine basic operative structure to bring more transparency and to manage
resources efficiently.

47
SC & ST Development: Presently 21 Integrated Tribal Development Agencies
(ITDAs), 17 Micro Projects for Primitive Tribal Groups, 46 Modified Area
Development Approach (MADA) pockets and 14 Cluster Pockets are functioning in
the State, with financial support mainly from State Plan (SP) and also from Special
Central Assistance (SCA), in the field of SC/ST development. In addition, there is
quite considerable participation from the private sector in this specific domain.
However as there are a number of issues (insufficient, uncorroborated and unlinked
data, etc.) that hamper effective management of these entities and schemes from
a macro perspective, need is to reexamine the basic operative structure specific to
this domain to bring more transparency to the whole system and to manage funds,
infrastructure and other resources in a more professional manner. Efforts have
been made by the State Government to provide land to SC, ST and other poor
families for agricultural purpose as well as for construction of dwelling houses.
Government land up to 0.04 acre is being provided to homestead-less persons for
house site and target is to provide house-sites to 25,000 families during 2004-05.
Water Resources: It is a paradox that Orissa is ravaged by occurrence of drought at
regular intervals despite its abundant water resources. This needs to be addressed
on priority-basis via river-linking plans, etc. Management of all these schemes also
assumes considerable importance for the State Government. It has been targeted
to create 4.65 Lakh hectares irrigation potential through major and medium
irrigation during the Tenth Plan period. Further, to tackle the problem of soil
erosion, Soil Conservation Organization is implementing various anti-erosion
measures through different schemes funded by the State and Central Government.
Power: The primary objectives in this sector are optimum utilization of the power
generated, substantial reduction of transmission and distribution losses,
maximizing generation from the existing capacity and further addition of units to
generate more power for meeting the increasing demand for power over the
coming years. Government of Orissa has to be committed to successfully complete

48
all these essential objectives and should also aim to electrify all the villages in the
State by March 2007 (as per the MOU signed with Government of India) via
appropriate programmes of Rural Electrification.
Industry: With its abundant mineral resources, long coastline, plentiful inland
waters and diverse forest wealth, Orissa has the potential to become an industry-
rich State. The State Government has reaffirmed its commitment for transforming
Orissa into a vibrant industrial State and has reformulated the Industrial Policy
which envisages creating a business climate conducive to accelerate investment in
industry and infrastructure projects, raising income and employment levels in the
State, reducing regional disparities in economic development and ensuring balance
utilization of State’s natural resources for sustainable development, and successful
implementation of this policy should be primary agenda of the State.
Steel & Mines: Abundance of mineral deposits has earned Orissa a prominent place
in the country as a mineral rich state. Based on the large resources of Metallurgical
grade Iron ore and bauxite, it has been planned to set up a number of iron and
steel plants and aluminum complexes. The resources of coal have also invited many
industrial houses to set up Thermal Power Projects to cater to the need of
electricity for industrial projects. A well-defined and transparent "Mineral Policy of
Orissa" is being formulated which will provide a foundation for sustainable
development of minerals based on transparency and consistency. Though rich in
minerals, Rate of Exploitation is very poor and needs to be improved.
5.5 Transparency & Accountability
It is quite imperative that the State Government enhances the levels of
transparency and accountability all across to facilitate the achievement of all the
targets and objectives that were set forth in previous paragraphs.

49
In this respect, the State has rightfully realized that the issues of transparency and
accountability cannot be ignored or put to the backburner and has taken dedicated
efforts to address them explicitly rather than implicitly via an empowered vigilance
infrastructure, which needs to be further augmented in terms of capital and plans,
and via focused strategies (such as the 9 x 9 Programme), which are taking
transparency and accountability as “pre-requisites” to target at efficient delivery
of services to citizens across the State.
Further, policies and acts such as RTI (which has been operational in the State
since October 2005) can also prove to be an important step towards enhancing the
transparency in government functioning.
But all these structures and policies can only “facilitate” the enhancement of
transparency and effective public participation is a prerequisite for the success of
all such endeavors. And the state of human development in Orissa being what it is
at present, there is a definite need for the State Policymakers to address this issue
anew and aim towards capacity-building of people to enable them to actively
participate in these initiatives (also see Annexure-10 for Reforms under G-C).

50
6. e-Government Vision
Establishing a Networked Government for greater transparency and
accountability in delivery of public services to facilitate
moral and material progress of all citizens.
6.2 Supporting Facts & Explanations
The Good Governance Vision of Orissa aims at remodeling all the functions and
organs of State Government on the basis of guiding principals such as localized
decision-making, interlinked planning, dynamic goal-setting and adaptive
methodology to fulfill all the needs and aspirations of the citizens. And this is what
is being reiterated via the e-Government Vision of the State.
The e-Government Vision aims at establishing a truly networked Government that
would create all the four pillars of e-Governance in the State, namely:
§ e-Management
§ e-Service
§ e-Democracy
§ e-Commerce
6.3 Implications
§ Core infrastructure, which delivers services to the Third Tier of Governance, has
to be developed and deployed throughout the State as both, decision-making
and implementation, need to be localized in their perspective
§ State should emphasize on managing ICT initiatives as “capital investments”
which can be evaluated in terms of pre-defined goals and measurable targets as
every rupee spent should directly translate into welfare of Orissa’s people

51
§ Stakeholders (including State Government departments) should be made
capable of conceptualizing, developing and managing e-Governance tools
themselves, as they collectively would form the envisaged structure.
§ State should aim at service-oriented approach of Governance through necessary
administrative and procedural reengineering as efficiency is the key ingredient
as per the e-Government Vision
§ An integrated, modular and scalable framework to inherit all existing systems
and also to provide scope for future expansions needs to be created as the State
needs to become more adaptive with respect to Stakeholders’ needs
§ To bring about transparency in various government functions, the State should
utilize policies, structures and frameworks, such as 9 x 9 Program, RTI and
empowered Vigilance Department
6.4 Translation of Vision
The Vision and all its implied ramifications have to be translated via a consolidated
plan or strategy. This Strategy should detail the necessary Strategic Framework,
including the institutional, policy & legal, capacity building, process reengineering,
risk analysis, funding strategy and architecture frameworks.
This Strategic Framework would lay down the fundamental principles that would
govern e-Government strategies in the National context and would also give
directions to the State on implementing its e-Government Vision. Further a Sector-
wise analysis and detailing of various Services (G2C, G2B and G2G), Applications
(Core, Integrated and Sectoral) and Infrastructure (SWAN, State Data Centers,
Delivery Infrastructure and e-Governance Resource Centers) should also be done via
this strategy. The ultimate aim of e-Government Strategy has to be devising ways
and means of achieving the e-Government Vision, that is – reinforcing good
governance and thereby contributing to the realization of economic and human
development objectives of the State of Orissa.

52
Annexure Annexure-1: Bibliography § Human Development Report 2003, UNDP § India Development Report 2002 § Economic Survey 2004-2005, Government of Orissa § Orissa Budget 2005-2006, Finance Department, Orissa § Human Development Report 2004, Government of Orissa § The Orissa Government Rules of Business § Proceedings of 8th National e-Governance Conference, Bhubaneswar, 2005 § Official Website of State Government of Orissa (www.orissagov.nic.in)
Annexure-2: Major Activities proposed under NeGP
Source: DIT, Govt of India
Annexure-3: Components of EGRM, CBRM & DPR EGRM comprises of: § Vision, Mission and Objectives of E-Government § E-Government Strategy § E-Governance Blueprint CBRM comprises of: § Assessment of existing capacities (AS-IS) § Assessment of capacity needs in tune with State e-Governance Plan (TO-BE) § Concrete plans for undertaking CB initiatives in sustainable manner § Strategies and methodologies for implementation of CB plan Detail Project Report (DPR) comprises of: § Assessment of resource available including external aid for CB program § Assessment of financial requirement from DIT under ACA for implementation of CB Plan

53
Annexure-4: Task Force for EGRM & CBRM Preparation § Shri Niten Chandra, IAS, Additional Secretary – GAD § Shri Vishal Dev, IAS, Director-OCAC
Annexure-5: MMPs for Orissa
Mandated by NeGP State-Specific
Transport Education (Mass Education & Higher Education)
Agriculture Health
Home (Police) Consumer Welfare (Food & Civil Supplies)
Finance (Treasury & Commercial Tax) Women & Child Development
Revenue (Property Registration & Land Records) SC & ST Development
Panchayati Raj Fisheries & Animal Resource Development
Urban Development (Municipalities) Tourism
Labor & Employment
Annexure-6: Segmentation & Selection Matrix for State MMPs
Regulatory Subjects Infrastructure Subjects
Revenue & Finance * Public Works (Bridges & Roads)
Law Energy & Power
GAD Water Resources (Irrigation) *
Excise * Water Supply & Public Health *
Transport * Urban Development *
Home (Police) * Science & Technology
Forest IT
Labor & Employment * Welfare Subjects
Parliamentary Affairs Social Welfare (SC/ST) *
Production Subjects Panchayati Raj *
Agriculture * Women & Child Development *
FARD * Food Supplies & Consumer Welfare *
Textile & Handlooms PGPA
Tourism * Education (Mass & Higher) *
Public Enterprises Health *
Steel & Mines Sports & Youth Affairs
Industry Minorities
Note 1: The segmentation as done above is on a high-level only and in quite a few cases the functions of a department were overlapping more than one category or all four categories Note 2: A number of subjects, as described above, comprise of more than one department of the State Government functioning with each other and if a subject is selected as a MMP, all associated departments are also considered MMPs Note 3: As per discussions held, all the starred subjects ( * ) were considered to have high impact on either the State’s economy or on its citizens, or on both

54
Annexure-7: List of Respondents
Political Leadership Academician & Intelligentsia
Shri J.B. Pattanaik, Ex-CM * Shri S.R. Pattanaik, Ex-MP (Sambad Newspaper)
Shri S.N. Naik, Agriculture Minister * Shri Tathagata Satpathi, MP (Dharitri Newspaper)
Shri P.C. Ghadai, Finance Minister * Shri B. Mahatab, MP (Prajatantra Newspaper)
Shri S.N. Patra, IT Minister * Shri A. Samant (KITT, Bhubaneswar)
Shri Arun Dey, MLA * Shri A.S. Sarangi (Gobandhan Academy of Administration)
Smt. Pramila Mallik, WCD Minister * Vice Chancellor, BPUT (Bhubaneswar)
Shri R.N. Nanda, Science & Tech Minister * Shri G.C. Mitra (IIT-K Extension Center, Bhubaneswar) *
Shri Nalini Mohanty (Congress-I) Senior Government Officials
Shri Joel Oram (BJP) Chief Secretary
Shri Dharmendra Pradhan (BJP) Secretary – Information Technology *
Shri Kalpataru Das (BJD) Secretary – General Administration *
Shri Ranendra Pratap Singh (BJD) Director-Orissa Computer Application Center *
Shri Sudam Marandi (JMM) Secretaries & Officers of MMPs * Note: Meetings have already been held with all the person with Star ( * )
Annexure-8: MOM Template
Meeting with….……………………….....…as held on.…………………………at………………………………
General Discussion Points
Current State-of-Affairs in Orissa
Problem-Areas of State (with Corresponding Reasons)
What can be done?
Challenges Ahead
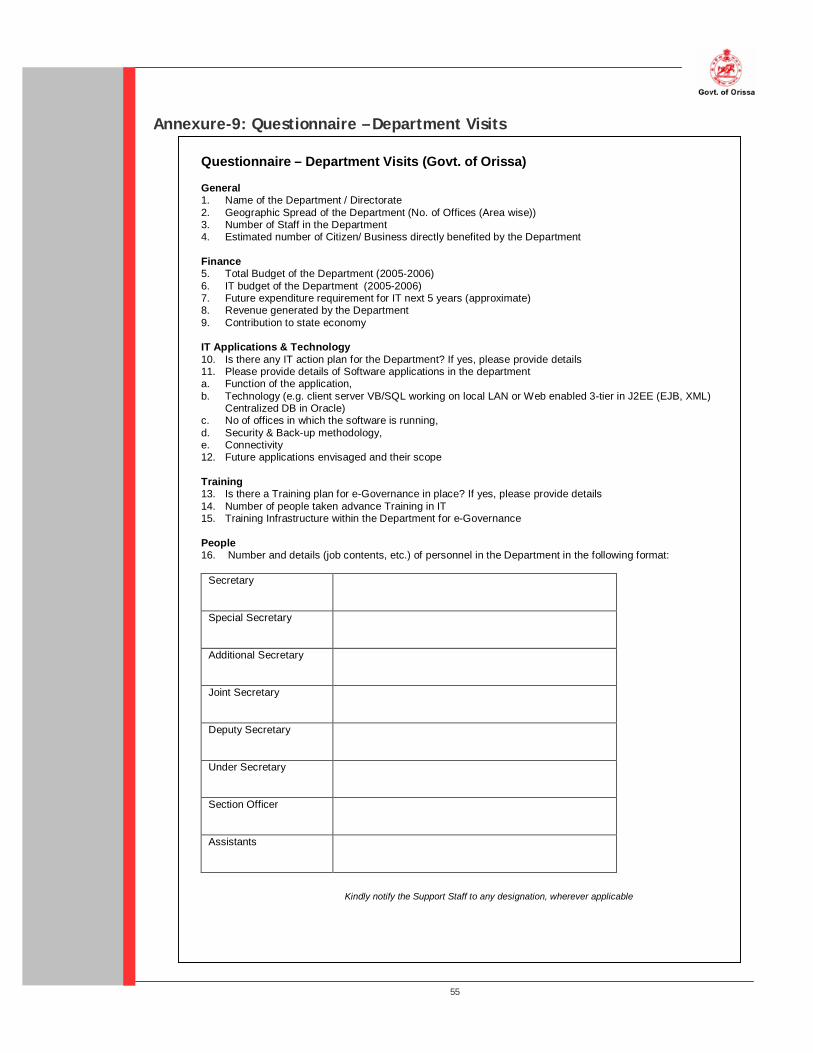
55
Annexure-9: Questionnaire – Department Visits
Questionnaire – Department Visits (Govt. of Orissa) General 1. Name of the Department / Directorate 2. Geographic Spread of the Department (No. of Offices (Area wise)) 3. Number of Staff in the Department 4. Estimated number of Citizen/ Business directly benefited by the Department
Finance 5. Total Budget of the Department (2005-2006) 6. IT budget of the Department (2005-2006) 7. Future expenditure requirement for IT next 5 years (approximate) 8. Revenue generated by the Department 9. Contribution to state economy
IT Applications & Technology 10. Is there any IT action plan for the Department? If yes, please provide details 11. Please provide details of Software applications in the department a. Function of the application, b. Technology (e.g. client server VB/SQL working on local LAN or Web enabled 3-tier in J2EE (EJB, XML)
Centralized DB in Oracle) c. No of offices in which the software is running, d. Security & Back-up methodology, e. Connectivity 12. Future applications envisaged and their scope
Training 13. Is there a Training plan for e-Governance in place? If yes, please provide details 14. Number of people taken advance Training in IT 15. Training Infrastructure within the Department for e-Governance
People 16. Number and details (job contents, etc.) of personnel in the Department in the following format:
Secretary
Special Secretary
Additional Secretary
Joint Secretary
Deputy Secretary
Under Secretary
Section Officer
Assistants
Kindly notify the Support Staff to any designation, wherever applicable
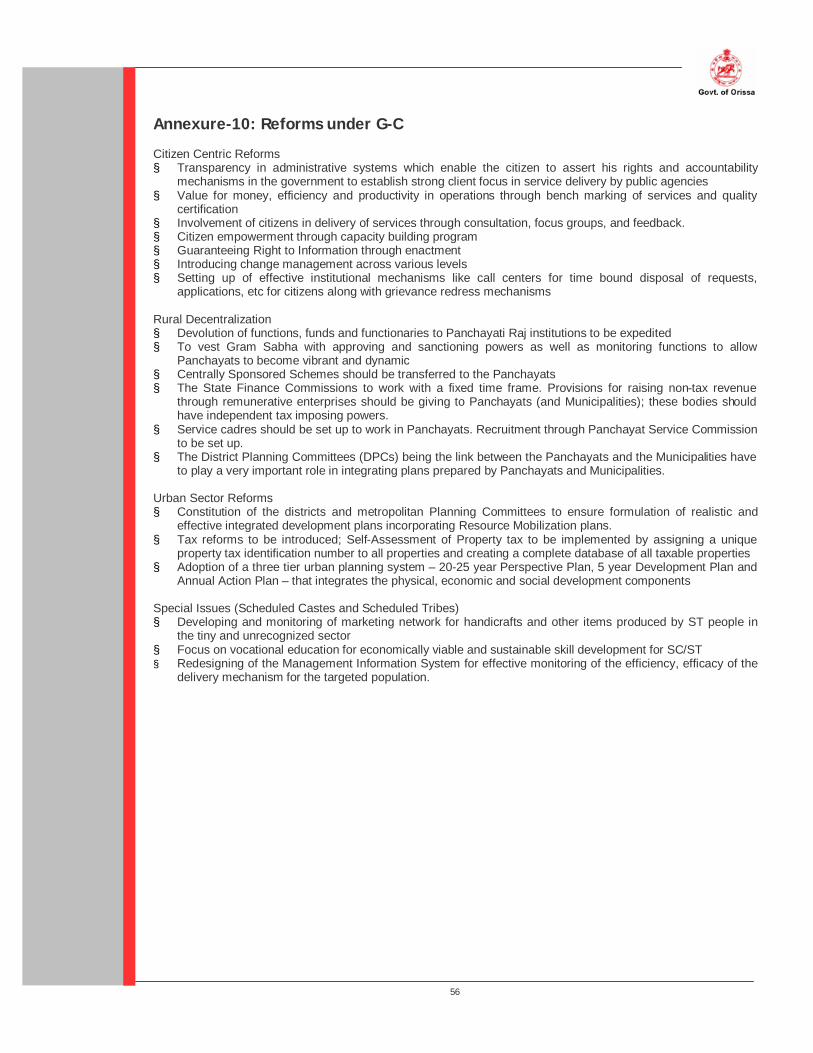
56
Annexure-10: Reforms under G-C Citizen Centric Reforms § Transparency in administrative systems which enable the citizen to assert his rights and accountability
mechanisms in the government to establish strong client focus in service delivery by public agencies § Value for money, efficiency and productivity in operations through bench marking of services and quality
certification § Involvement of citizens in delivery of services through consultation, focus groups, and feedback. § Citizen empowerment through capacity building program § Guaranteeing Right to Information through enactment § Introducing change management across various levels § Setting up of effective institutional mechanisms like call centers for time bound disposal of requests,
applications, etc for citizens along with grievance redress mechanisms Rural Decentralization § Devolution of functions, funds and functionaries to Panchayati Raj institutions to be expedited § To vest Gram Sabha with approving and sanctioning powers as well as monitoring functions to allow
Panchayats to become vibrant and dynamic § Centrally Sponsored Schemes should be transferred to the Panchayats § The State Finance Commissions to work with a fixed time frame. Provisions for raising non-tax revenue
through remunerative enterprises should be giving to Panchayats (and Municipalities); these bodies should have independent tax imposing powers.
§ Service cadres should be set up to work in Panchayats. Recruitment through Panchayat Service Commission to be set up.
§ The District Planning Committees (DPCs) being the link between the Panchayats and the Municipalities have to play a very important role in integrating plans prepared by Panchayats and Municipalities.
Urban Sector Reforms § Constitution of the districts and metropolitan Planning Committees to ensure formulation of realistic and
effective integrated development plans incorporating Resource Mobilization plans. § Tax reforms to be introduced; Self-Assessment of Property tax to be implemented by assigning a unique
property tax identification number to all properties and creating a complete database of all taxable properties § Adoption of a three tier urban planning system – 20-25 year Perspective Plan, 5 year Development Plan and
Annual Action Plan – that integrates the physical, economic and social development components Special Issues (Scheduled Castes and Scheduled Tribes) § Developing and monitoring of marketing network for handicrafts and other items produced by ST people in
the tiny and unrecognized sector § Focus on vocational education for economically viable and sustainable skill development for SC/ST § Redesigning of the Management Information System for effective monitoring of the efficiency, efficacy of the
delivery mechanism for the targeted population.