
eGiving in Canada - OSI | Welcomedev.orgwise.ca/sites/osi.ocasi.org.stage/files/resources...David...
36
Transcript of eGiving in Canada - OSI | Welcomedev.orgwise.ca/sites/osi.ocasi.org.stage/files/resources...David...


ACKNOWLEDGEMENTSThe Institute for Nonprofi t Studies would like to express its appreciation to theanonymous donor who has generously funded this fi ve-year student research internship program. In addition, many thanks to copy editor Jill Ries and report designer and layout artist extraordinaire Crystal Cochrane who both continue to work their magic.
Peter R. Elson, PhDSenior Research Associate
I would like to express my sincere gratitude to those who made this research possible.
Dr. Peter Elson, and other individuals with the Institute for Nonprofi t Studies at Mount Royal University, have generously shared their knowledge and provided much guidance and patience throughout this process.
Owen Charters, Kirstin Beardsley, and Dina Bilenkis of CanadaHelps, and Katherine Winchester of the Mobile Giving Foundation, offered their knowledge (and data) to support this study. David Lasby of Imagine Canada provided guidance in the development of CRA and ICNPO classifi cations compatibility.
Very helpful leaders in the charitable sector contributed their experiences to aid in informing the landscape outlined below. Very helpful professors at Mount Royal University contributed their knowledge to aid in the data analysis.
I would especially like to acknowledge the anonymous donor who made possible my internship with the Institute for Nonprofi t Studies.
Kim Warnke Student Research Intern, 2010 - 2011
© Kim Warnke, 2011

Introduction ...........................................................................................................1
Canada’s Nonprofi t Sector ....................................................................................1
e-Commerce Trends in Canada .............................................................................3
International e-Giving ...........................................................................................4
e-Giving in Canada ...............................................................................................5
Trust, Security, and Purpose .................................................................................7
e-Giving Supply Chains ........................................................................................9
Classifi cation of Charitable Organizations .........................................................10
International Classifi cation of Nonprofi t Organizations (ICNPO) .....................11
Methodology .......................................................................................................12 • Data Gathering and Analysis ...............................................................13
Findings ..............................................................................................................14 • Size Matters ..........................................................................................14 • Number of Participating Organizations ...............................................17 • Donation Frequency .............................................................................20 • Donation Amounts ................................................................................22
Summary of Trends and Policy Implications ......................................................26
Further Opportunities for Exploration ................................................................31
TABLE OF CONTENTS


INTRODUCTION
CANADA’S NONPROFIT SECTOR
1 Marc-Elie Scott, Strategic Drivers of Alberta’s Nonprofi t Sector: what we know, what we don’t know, and what we’re missing,(2010) P. 162 Michael H. Hall, Cathy W. Barr, M. Easwaramoorthy, S. Wojciech Sokolowski, and Lester M. Salamon, The Canadian Nonprofi t and Voluntary Sector in Comparative Perspective, (2005), p.8. 3 Ibid, p.15.4 Cliff Spyker, There Is No Accounting for Landscape, (2011), p.32.5 Canada Revenue Agency T3010 data disk (2009). 6 Statistics Canada, National Survey of Giving, Volunteering, and Participating, (1997).
Every nonprofi t and charitable organization in Canada relies on external supporters, volunteers, donors, or funders, to achieve their mission. These supporters are instrumental in providing resources to ensure the ongoing success of the organization. A trend associated with nonprofi t organizations, and charities in particular, is a growing reliance on external funding in the form of either fees-for services or donations.1 Although charities have always utilized a variety of fundraising options, new avenues appeared in recent years with the advancement of new technology. The aim of this study is to determine discernable trends in the nature of e-Giving to charities in Canada. Charities have been selected, rather than all nonprofi ts, because: a central registry exists of Canadian charities; donations are reported to the Canada Revenue Agency (CRA) by both charities and donors; and, there are online giving portals dedicated to charity donations. E-Giving in Canada has yet to be analyzed. Numerous questions could have been posed related to e-Giving, but it seemed prudent to clarify the types of charities involved in e-giving; how charities are involved in e-Giving; and how donation trends could provide insight into both the history and the future of e-Giving. It is anticipated that this research will be an important baseline of analysis and a tool for others to be able to further develop this research.
The nonprofi t sector in Canada, and specifi cally the charitable subsector, has a large impact on societal wellbeing. These organizations often fi ll the gap in community services created by the absence of government service provision or by lack of incentives for private sector engagement. Despite the importance of the charitable sector, little was known until recently about the contribution of Canadians to volunteering, giving and participating. The contribution of the nonprofi t sector to the Canadian economy hovers at approximately10% of our GDP.2 While nonprofi ts depend on government revenues and fee-for-services for the majority of their funding, private donations account for at least 10% of their total revenue.3 Between 2000 and 2008, there was a 4% increase in private gifts to the nonprofi t sector as a whole, and as of 2008 these gifts comprised 14% of the charitable sector’s total revenues.4
There are approximately 84,000 registered charities in Canada. The Canada RevenueAgency classifi es charities into three types: Public Foundations, Private Foundations, and Charitable Organizations. Charitable Organizations represent the bulk of these, with 73,916 organizations fi ling returns in the 2009 tax year.5 In 1997, the fi rst tri-annualcomprehensive survey of volunteering, giving, and participating was completed, and published by Statistics Canada. The survey outlined the landscape of volunteering and giving in Canada.6 The National Survey of Giving, Volunteering, and Participating (NSGVP) is both a baseline and a framework, and reveals the evolution of these three
1
7 NSGVP 2007, p.19.8 Statistics Canada, National Survey of Giving, Volunteering, and Participating, (1997), p.9.9 Canada Revenue Agency, Registered Charity Information Return T3010
“If there are e-Givingtrends in
Canada, whatare they?”
dimensions of the nonprofi t sector. The most recent NSGVP in 2007 reveals between 71% and 88% of Canadians gave to charities. The lowest percentages were attributed to the youngest citizens (15-24 years of age), and the highest percentages were attributed tothose citizens older than 45 years of age.7
According to the 2007 NSGVP, the number of donations has decreased even as the total dollar amount of donations has increased. This trend could suggest a growing disconnect between organizations’ method of fundraising and donors’ comfort level with traditional donation methods. Indeed, the same survey revealed that the Canadian population “did not like the way in which requests for donations were made”.8
All Canadian charitable entities are required by law to fi le T3010 income tax returns to retain charitable status. Much of the analysis of charitable giving in the past has been based on the information found within these forms. These income tax returns identify revenue by source but there is no requirement for charities to provide a breakdown of the donations.9 For example, the charities must declare the total amount of tax-receipted revenue received, but not whether the funds were received through direct mail campaigns, door-to-door solicitation, or, electronic/mass appeal. They are also not required to differentiate cash, cheques, shares, or electronic fund transfers. In Canada, electronic transfers include donations committed: directly through a charity’s website; via an online portal; and, via short message service (SMS, or text messaging). These transfers will collectively be referred to as “e-Giving”. The purpose of this study is to clarify the role of e-Giving in the Canadian charitable sector and to identify emergent trends in the interaction between charitable organizations and these new fundraising mechanisms.
The broad research question I posit is, “Are there trends in e-Giving in Canada?” and the complementary question of “If there are e-Giving trends in Canada, what are they?” To respond to these two questions, I gathered data from two relatively new organizations that facilitate two types of e-Giving in Canada; these organizations were the Mobile Giving Foundation and CanadaHelps. Both organizations will be described in detail below.
“Are there trends in
e-Giving in Canada?”
2

10 PayPal.com, History of PayPal, 2009.11 Statistics Canada The Daily: Canadian Internet Use Survey Results. (2010)Table 2.12 Bank of International Settlements, Top 5 Countries in Debit Use: Transactions Per Inhabitant, (2007).13 McKinsey and Company, McKinsey Quarterly: Why trends matter, (2010), p.1.
e-COMMERCE TRENDS IN CANADA
e-Giving cannot be fully explored without a reference to the overall growth of e-commerce in Canada, of which e-Giving could technically be considered a part. The arrival of Portal Giving on the charitable fundraising landscape in Canada coincided with the debut of another electronic fund transfer option for consumers, PayPal. PayPal came online in 1999, and was subsequently acquired by e-Bay in 2002.10 This electronic transfer option provided a new, more secure way to transfer funds. Its acquisition by E-Bay catapulted the concept of facilitating third-party payment to the forefront of e-commerce demands for Canadians. The result was an increased appreciation for the convenience of electronic fund transactions. The Canadian Internet Use Survey, published by Statistics Canada, notes a growth of internet banking and online bill-paying from 55% in 2005 to 67% in 2010.11 A study by the Bank of International Settlements has also shown that by 2007, Canadians ranked second as the most frequent users of direct debit cards in the world, behind Sweden.12
This trend implies that Canadians have a high degree of comfort with electronic fund transfers for general commerce transactions. It also indicates a corresponding cultural shift away from the use of cheques and cash. Since large donations to charitable organizations have traditionally been in cheque format, and smaller donations have traditionally been in cash, the recent adoption of e-Giving technologies by charitable organizations could potentially increase charitable donations and/or a donor base by providing a better “fi t” between donors and charities. This would demonstrate that charitable organizations are responding to a changing environment, which is one of the most important indicators for continued success in the corporate world. There is every reason to believe this organizational survival strategy would be the same with charities.13
Canadianshave a highdegree of
comfort withelectronic
fund transfers.
3
INTERNATIONAL e-GIVING
14 Ken Johnson and Graeme Johanson, Donations over the web: Collecting for Australian nonprofi t organizations. (2005), p. 21.15 The Convio Online, Nonprofi t Benchmark Study 2010, (2010), p.4. 16 2008 donorCentrics’, Internet Giving Benchmarking Analysis, (2009), p.6.17 2011 donorCentrics’, Internet and Multichannel Giving Benchmarking Report, (2011), p.518 Angus Reid, Two in Five Britons Reduced Their Charitable Donations in 2010,(2010), p.4.19 Angus Reid, Nearly Half of Americans Report Giving Less to Charity in 2010,p.3.20 Angus Reid, Charitable Giving Declines as Canadians Face Financial Woes (Press Release),(2010)p.4
There is currently very little information concerning e-Giving in Canada. However there are a few recent user surveys in Canada, and a number of international studies based in countries with similar consumer habits and social welfare sectors. An Australian study released in 2005 revealed that smaller organizations (based on revenue) were much less likely to be able to receive online funds, and that even larger organizations were often challenged in the implementation of successful web-based donation systems.14 An American study by an e-Giving industry leader found that smaller organizations with the capacity to accept online donations were able to increase their donation revenues by more than 25%, despite the 2008 recession.15
Another American industry study revealed high online giving rates among youth. Thesame study found that the average online donation tended to be larger than the averageoff-line gift.16 A 2011follow-up study indicated that fi rst-time donors who had chosen online donation methods had nearly doubled in three years, from 9% in 2007 to 16% in 2010.17 Public opinion polls conducted by Angus Reid in 2010 showed a substantial number of donors embracing online donation methods despite an overall drop in donation amounts and frequency in the United Kingdom (30%), the United States (24%), andCanada (30%). A far lower percentage reported donating via the newer avenue of text giving: 6% (United Kingdom), 4% (United States), and 2% (Canada), respectively.18,19,20
These observations demonstrate the growing importance of e-Giving to the charitable sector, and suggest a number of necessary research studies to more completely understand the impact of these new technologies in Canada. This report will focus on the aforementioned identifi cation of trends in e-Giving in Canada through three avenues: Portal Giving, Text Giving, and Direct Online Giving (i.e., donations received through the organization’s own website). Portal Giving refers to donations directed by a donor to a charity via an independent “hosting” website. The host website acts as a ‘one stop shop’ from which the donor can access multiple charities, all of which have met the host website’s requirements.
Portal Giving refers to
donations directed
by a donorto a charity
via an independent “hosting” website.
4

Although TextGiving is the least time consuming for donors, the funds take the longest time to reach the charity once the donation is made. The funds must be collected by the donor’s wireless provider on their next monthly bill, meaning a possible delay of 90 days before the charity can actually use the funds. Portal Giving demands more investment in energy and time. The donor must fi rst make the decision to donate, fi nd the charity, and then fi ll out a series of short forms in order to commit the funds. However, once the funds have been committed they are electronically transferred to the charity from the portal organization at the end of that same month. Charities employing Direct Online Giving receive the funds in their own bank accounts as soon as their processing site clears the transaction.
A direct way to compare the cultures of charitable organizations and their environment is to listen to what the donors are saying about their relationships with charities. In Talking About Charities 2008, the Muttart Foundation found that 90% of Canadians agree that “more attention should be paid to the amount of money charities spend on program
Spare Direct Direct Automatic Direct Portal Text change cash cheque cash online Giving Giving giving donations giving withdrawals giving to charity
OFF-LINE GIVING ONLINE GIVING
Table 1: Range of possible giving methods, from most direct to least direct.
21 Author’s Personal Communication with Katherine Winchester of the Mobile Giving Foundation, (2011).
e-GIVING IN CANADA
In Canada, there are two large hosting websites, CanadaHelps and Canada Gives. For the purposes of this study, only donations made via CanadaHelps will be analyzed. Canada Gives functions more as a private foundation for donors who wish to self-direct funds as opposed to the individual or repeated donations facilitated by CanadaHelps. The Mobile Giving Foundation provides the Text Giving platform in Canada. Text Giving via the Mobile Giving Foundation is a new venue for online giving to Canadian charities. The Canadian organization was inspired by an American counterpart, but they operate with different parameters due to varying wireless carriers and taxation schedules for charities. All Text Giving in Canada is funneled through the Mobile Giving Foundation, in cooperation with the Canadian wireless providers for mobile phones and data devices. Text Giving refers to the process by which a donor can commit funds to an organization via their mobile phone. The donor simply sends an SMS (text) message to a special phone number, known as a “short code”. The text message contains only a single word (a “keyword”) which identifi es the charity and the charity’s specifi c campaign if multiple campaigns for that charity exist. Currently, donations via text messaging are limited to denominations of fi ve or ten dollars, with an upper limit of 30 dollars per donor, per month. Higher donation limits are currently being considered.21 Table 1 illustrates some various donation methods refl ecting the length of time between donation and the receipt of funds by a charity.
Text Giving refers to the process by
which a donor can commit funds to an
organization via their
mobile phone.
5

activities”, with over half of those respondents strongly agreeing.22 There are increasing pressures on charities to fi nd alternatives to government for funding. In 2011, “a third of [nonprofi t] organizations [in Alberta] reported that they have experienced a decrease in government funding” in previous years.23 e-Giving is one of many avenues available to charities to increase both overall revenues and the level of discretionary funds. Many government grants are directed to a particular program or purpose, leaving some charitiesin the predicament of having money but not being able to spend it where it is most required. In addition to being discretionary, e-Giving funds also facilitate charities to realize substantial returns on fundraising investment. A small investment in time to register with Canada Gives, for example, allows a charity ongoing benefi t from donations with few additional inputs, if at all.
Since charities and their donors look to derive the greatest benefi t from donations, e-Giving makes sense…and cents. As Seaman and Young explain, an increase in an organization’s average costs due to fundraising expenditures must be offset by a much larger increase in donations, or there is little point in undertaking fundraising in the fi rst place.24 The three technological innovations examined increase the average operating costs for charities more than others, which, if the frequency of donations across technologies is similar, would be expected to have an impact upon the recommended fundraising type. For example, CanadaHelps captures a portion of each donation to help address administrative costs: 3.9% of the donation if the charitable organization has registered with CanadaHelps, and 4.9% of the donation if the organization has not registered. The percentage differential is due to increased processing costs to forward the donations of unregistered organizations. The Mobile Giving Foundation charges more for its services. Depending on the service package that the organization chooses, the cost of implementing a Text Giving campaign averages $5,600 per year, depending on the Approved Service Provider and the package chosen by the charity, and a $350 application fee to cover administrative costs.25
22 Ipsos Reid Public Affairs, The Muttart Foundation, Talking About Charities 2008: Canadians’ Opinions on Charities and Issues Affecting Charities, (2008), Edmonton.23 Calgary Chamber of Voluntary Organizations, Points of Light: The state of the Alberta nonprofi t sector, (2011).24 Seaman, Bruce A. and Dennis R..Young, eds., Handbook of Research on Nonprofi t Economics and Management. (2010), Cheltenham, U.K., p. 87.25 Personal Communication, Katherine Winchester, Mobile Giving Foundation, (2011).
Average Cost of Portal Fundraising
Quantity of Service Provided
Average Cost of Text Fundraising
Average Organizational Operational Cost
Marginal Cost
Cost of Service Provision
Average Cost of Direct Website Fundraising
Figure 1: Marginal Cost Curve of Fundraising Options and Related Average Costs.
Source: Adapted from Bruce A. Seaman and Dennis R. Young, eds., (2010) Handbook of Research on Nonprofi t Economics and Management
6

TRUST, SECURITY, AND PURPOSE
This section explores three factors that infl uence the positive relationship or “fi t” between a charity and the environment in which they function. I am seeking to understand how a population of charities and their donors adapt to technological changes in the donation environment. Specifi cally, I will examine trust, security and purpose within the donation environment. ”Fit”, in this instance, is concerned with the relationship between the donor and a charity’s fundraising strategy, and how trust and security facilitates the relationship. This analysis draws on organizational ecology theory which seeks to explain how “processes of change in organizational populations parallel processes of change in biotic populations”.26
Just as an organization’s fundraising strategies must fi t with the habits and culture of the donor population, the organization’s habits and culture must fi t with the requirements of a given fundraising method. The number and type of qualifi cations a charity must meet in order to establish an e-Giving program varies. For example, CanadaHelps will accept any organization registered as a charity with the CRA. The Mobile Giving Foundation, however, requires that additional criteria are met. These criteria include a review of a charity’s governance practices, previous ability to generate revenue through donations, and operational transparency. The Mobile Giving Foundation uses as a guide an entry threshold of $250,000 in donations raised by the charity in previous years and examines the organization as a whole for its ability to create and to maintain a comprehensive marketing strategy for a Text Giving campaign. If a charity is able to share more information and supporting documents (such as fi nancial statements and third party endorsements), donor trust is more likely to increase.
TRUST: As more and more nonprofi t organizations qualify for charitable status under the CRA’s defi nition of a charitable purpose, it becomes more diffi cult for individuals to assess the organizations most deserving of their donation dollars. The percentage of a donation spent on fundraising as opposed to program spending, for example, can have an impact on a donor’s willingness to donate.27 The validity of an organization claiming to be a registered charity and other sources of fraud have also been cited as deterrents to donating, especially online.28 Electronic technology can assist charities to communicate with donors, reduce the marginal cost of each transaction and allow for a greater percentage of funds to reach their intended purpose.29 The amount of information available to prospective donors also has an impact on where the funds are directed.30 According to the same 2010 Angus Reid polls mentioned above, donors in Canada (24%), the United Kingdom (17%), and the United States (16%) were in agreement that “having a better understanding of
26 Singh, Jitendra V. and Lumsden, Charles J. ,Theory and Research in Organizational Ecology,(1990), p. 162.27 The Muttart Foundation, “Talking about Charities”, (2008).28 Kini, Anil D. and Choobineh, Joobin , An Empirical Evaluation of the Factors Affecting Trust in Web Banking Systems, Americas Conference on Information System, (2001), p. 187.29 Lee, Ted E., Chen, Jim Q. and Zhang, Ruidong , “Utilizing the Internet as a Competitive Tool for Nonprofi t Organizations”, (2001).30 Sloan, Margaret, The Effects of Nonprofi t Accountability Ratings on Donor Behavior, (2008), p.233.
The number and type of
qualifi cations a charity must meet in order to establish an e-Giving
programvaries.
The amount ofinformation available to prospective donors also
has an impact on where
the funds are directed.
7

what the organizations do to actually help people” would translate into increased levels of donation.31,32,33 Traditional fundraising avenues pursued by charitable organizations provide little opportunity for comprehensive information transfer to the donors. For example, direct mail offers much less space than that of a website to educate donors regarding a charity’s mission, accountability and projects.
SECURITY: Consumer awareness of internet scams, identity theft, and possible fund re-directing through a bogus payment apparatus is a possible deterrence to electronic donations. This tendency might be more prevalent among certain groups, such as inexperienced users of electronic payment formats.34 Secure donation methods, i.e., a third-party (e.g., PayPal) payment structure, have been introduced to deliberately increase electronic transaction security.35
PURPOSE: The purpose (broad or narrow) or urgency (immediate or long-term) for which the funds are needed may infl uence e-Giving patterns. The ability for a donor to identify the intended use of their funds, and the ease with which a donor is able to commit funds may have an effect on the use of a particular donation technology.
31 Angus Reid, Charitable Giving Declines as Canadians Face Financial Woes (Press Release), p.6.32 Angus Reid, Two in Five Britons Reduced Their Charitable Donations in 2010, p.5.33 Angus Reid, Nearly Half of Americans Report Giving Less to Charity in 2010, p.5.34 Garain, Swapan, “Changing Face of Giving: NGOs Accessing Individual Giving in the Cyberspace” (2008), p.15. 35 Grubbs Hoy, Mariea and Phelps, Joseph,“Online Privacy and Security Practices of the 100 Largest U.S. Nonprofi t Organizations”, (2008).
8

e-GIVING SUPPLY CHAINS
The obstacles and risk factors inherent in each donation method combine to create an opportunity matrix within which the donor assesses the comfort level to donate. The supply chains through which the donated funds travel contribute to a signifi cant proportion of the opportunity matrix and are depicted below.
Intuitively, the supply chain with the fewest steps (direct online giving) would make the most sense for hassle-free donating. However, due to the nature of e-Giving, there is a greater risk than there would be with a donation by cash, or even by cheque. The increased risk emanates from the nature of electronic fund transfers. In order to verify the availability of the funds and the actual existence of the donor, personal information has to be supplied. With Portal Giving, trust is increased due to: the security measures taken by the receipt-issuing organization (e.g., CanadaHelps); its high public profi le; and, its extensive e-giving. Not only does the average donor not have to be concerned about their favorite small charity lacking the resources to maintain a secure website, but, the organizations themselves have demonstrated trust in the portal’s operations by opting to register with CanadaHelps. Since the portal is the issuing organization on the donor’s tax receipt, the donor is only obligated to reveal sensitive information to that one party, but may donate to any number of charities.. Text Giving offers the most secure fund transfer method for e-giving. The donor simply pays a monthly telephone bill, and offers no sensitive identity or fi nancial information to the charity thus limiting the risk of identity theft among other common concerns. Security and effi ciency of the transaction is likely to affect the frequency with which a donor uses a particular donation method.
Charity’s ownwebsite Canada
Helps’website
PayPalsite
Bank site
Charityof
Choice
Charityof
ChoiceASP Provider Wireless
Provider
MobileGiving
Foundation
Donor
Charity’s ownwebsite
Charityof
ChoiceDonor
Donor
Donor
Third Party Payment
Processing SiteDIRECT WEBSITE GIVING
PORTAL GIVING
TEXT GIVING
9

CLASSIFICATION OF CHARITABLE ORGANIZATIONS
The Canada Revenue Agency classifi es charities by Public Foundation, Private Foundation, and Charitable Organization. They further classify the three groups into fi ve types (welfare, health, education, religion, and other benefi ts to the community) which are then segmented into one of 55 sub-categories. An example of this CRA classifi cation is shown below.
Only the registered charities considered “Charitable Organizations” were analyzed in this study. The inclusion of Public and Private Foundations would have skewed the results and the analysis of trends in e-Giving to Charitable Organizations. Statistics on Canadian Charities are segmented by the above CRA classifi cations through information fi led with T3010 tax returns, which are mandatory for all registered charities in Canada.
There are however, limitations to the T3010 data. Type of charity categories in the T3010 forms do not correspond neatly with the international classifi cation system discussed below, a problem when the intent is to compare Canadian data with international trends. In the Basic Information Sheet of the CRA, charities indicate their top three programs by expenditure, which are then grouped into sub-categories. The completion of the Basic Information Sheet is not mandatory and as a consequence as many as 6,000 charities per year, approximately 18% of all registered charities, fail to complete the form. Although this form may become mandatory in the future those charities are excluded from the classifi cation analysis in this study.
Beginning with the National Survey of Giving, Volunteering and Participating in 1997, an alternate classifi cation was employed by Statistics Canada and other researchers, including Imagine Canada. This classifi cation system was derived from an initiative by the Johns Hopkins Center for Civil Society Studies in 1996, and subsequently adopted by the United Nations in their Handbook on Nonprofi t Institutions in the System of National Accounts. The International Classifi cation System of Nonprofi t Organizations (ICNPO) assigns nonprofi ts to twelve groups, with various subgroups, according to their primary program or purpose.36 The categories are similar, but more detailed, than the classifi cation system employed by the Canada Revenue Agency.
Category: Charitable OrganizationCharity Type: Other benefi ts to the community Sub-Category: Recreation, Playgrounds and Vacation CampsName: Alberta Ballet Company
36 United Nations Department of Economics and Social Affairs, Statistics Division, Handbook of National Accounting: Handbook on Nonprofi t Institutions in the System of National Accounts, New York, (2003), p.27.
10
CRA and ICNPO
Classifi cations.
INTERNATIONAL CLASSIFICATION OF NONPROFIT ORGANIZATIONS (ICNPO)37
The ICNPO identifi es twelve distinct classifi cation categories based on the primary activity of the organization, with each containing several sub-categories. The twelve categories, along with the acronyms used throughout this report, are:
1. Culture and Recreation (Arts/Cul)2. Education and Research (Ed) or (Uni)3. Health (Health) or (Hosp)4. Social Services (Soc. Ser)5. Environment (Enviro)6. Development and Housing (Dev/Hous)7. Law, Advocacy, and Politics (Legal)8. Philanthropic Intermediaries and Voluntarism Promotion (Phil/Vol)9. International (Int’l)10. Religion (Relig)11. Business and Professional Associations, Unions (not applicable)12. Not Elsewhere Classifi ed (N.E.C.)
For the purposes of this study, we grouped charities into the 12 general categories only, with two exceptions; Education and Research, and Health. Both have been split into core and non-core components to more accurately refl ect the realities of the Canadian charitable sector. “Education” will hereafter signify organizations whose primary purpose is general education and research within the community, and “Universities” will signify those educational organizations which lack the required level of independence from the Canadian state to qualify as core charitable organizations. Similarly, “Health” will refer to organizations acting with signifi cant independence from governmental controls and budgetary funding, and “Hospitals” will refer to those organizations not considered to be independent of government. Category 11 is not relevant to organizations with charitable status in Canada.
The Basic Information Sheet provided by the CRA also allows Canadian Charitable Organizations to self-select as “Not Elsewhere Classifi ed” (N.E.C.). Given the differences between the two classifi cation systems, the organizations classifi ed as N.E.C. within the Canadian system (N.E.C.C.) cannot be automatically grouped into the N.E.C. category within the ICNPO. Therefore, to enable a clear landscape to emerge, the two groups have been identifi ed as N.E.C. and N.E.C.C. with the fi rst acronym identifying the international classifi cation and the second referring to the CRA classifi cation. These categories reveal little about the type of charities but are included in this study as they represent a signifi cant portion of e-giving participants.
37 Statistics Canada, Satellite Account of Nonprofi t Institutions and Volunteering: Sources and Methods, p.42.
11

METHODOLOGY
Data for this study was extracted from the T3010 Basic Information Sheets for the years 2002-2009 with corresponding data fi elds provided from the T3010 form itself. The charity’s size (determined by revenue), and the percentage of total organizations participating in e-Giving, were analyzed after the charities were segmented into their respective ICNPO categories. The data fi elds were then checked for inconsistencies, such as duplicate entries, and then sorted by the charities’ business numbers (BNs). The results created a baseline for comparison against subsequent data received from Portal Giving (provided by CanadaHelps) and Text Giving ( provided by The Mobile Giving Foundation).
CanadaHelps (www.canadahelps.org) came online in 2001 and has accumulated a signifi cant amount of data during the past ten years. Thanks to the generosity of CanadaHelps, data was made available to compare the incidences of portal givingbetween ICNPO categories, as well as portal giving over a period of time. The totalnumber of organizations participating by 2010 produced a clear picture of trends for a portal-giving venue.
Because the Mobile Giving Foundation (www.mobilegiving.ca) commenced operations in late 2009, only one complete year of data is available for analysis purposes. Due to the small number of charity organizations that have chosen to register and participate in this type of e-Giving to date, some data categories have been grouped in order to protect the identities of the organizations involved.
In some instances, as mentioned in the classifi cation schematic, there is adifferentiation between two types of charitable organizations, generally identifi ed as“core” and “non-core”. Included in the “core” are all registered charities with theexception of MUSH (municipalities, universities, schools, and hospitals) organizations.These charities are treated separately because of disproportional size in relation to other charities and substantial reliance on government funding (Figure 2 - on the next page). Thus, the “all ICNPO” category, for the purposes of this study, includes MUSH charitable organizations in addition to the core organizations. In most cases, regardless of classifi cation, outliers in a particular trend will be isolated.
12
Canada Helps and
Mobile Giving Foundation
data was analyzed.

DATA GATHERING AND ANALYSIS
In order to ascertain organizational privacy, CanadaHelps provided a list of the BNs of all registered organizations, which were then sorted into respective ICNPO categories and the list subsequently returned to CanadaHelps. The requested fi elds were then assigned to a non-identifying charity marker and the identifying information deleted before the data sets were returned to the researcher. The data for the charities were obtained from this e-Giving Portal for: location; year of registration; total number of donations; and, total dollar amount of donations received. Data were also collected for those organizations maintaining their own website. However, verifi cation of independently hosted payment options is was too time consuming to be included in this analysis. Statistical analyses followed to create the trends presented below. All data sets were cleaned to eliminate incomplete data fi elds subsequent to the receipt of the data and verifi cation of its completeness. Totals, means, standard deviations, and percentile measures were then performed across all data sets. The Text-Giving data, graciously provided by the Mobile Giving Foundation, was also segmented according to ICNPO categories using the BNs of the registered charities. They were subsequently returned to the Mobile Giving Foundation to obtain donation information in an anonymous manner in aggregate data format by month and ICNPO category.
Figure 2: Illustration of the size differential of ‘core’ and ‘non-core’ charitable organizations using ‘mean revenue’ as proxy for size.
1
10
100
1000
10000
100000
1000000
10000000
100000000
All Canadian Charitable
Organizations
Core Only Non-Core Only
First Quartile Median Third Quartile
13

FINDINGS
SIZE MATTERS
The relative size of charitable organizations using e-Giving to receive donations was assessed using total 2009 organizational revenue as a proxy for size. Revenues were divided into small, medium, large, and extra-large, dependent upon the revenue quartiles of all Canadian charities (Figure 3). The bulk of the organizations are represented in boxes in Figure 4. The mean revenue is bookended by the respective fi rst and third quartile cutoff for organizations participating in that particular type of e-Giving. Figure 3 demonstrates the concentration of individual charities within the revenue quartiles Canadian charitable organizations overall. Figures 6 and 7 represent the charities’ success generating revenue relative to their participation rate. Clearly, while the charities participating in Portal Giving tend to be larger, representation is evident from every organizational size category.
However, this trend is not indicated for those charities participating in Text Giving. Signifi cantly, the size of these charities is more likely to be in the extra-large category (the top 25% of earners) which may indicate a response to higher start-up costs for this type of fundraising. It may also indicate a greater propensity to experiment: larger organizations are likely able to absorb lost investment on unproven fundraising techniques should they prove unsuccessful. They also tend to be more diverse in their fundraising strategies and may view embracing a new opportunity not only for potential funds, but also as part of a broader marketing strategy.
Figure 3: Percent of Total Participating Charities in Each e-Giving Type, by Size
100%
50%
60%
70%
80%
90%
100%
0%
10%
20%
30%
40%
50%
60%
Percent of Overall Participating
Organizations
0%
10%
Small Medium Large Extra Large
Mobile Giving Foundation Canada Helps
$1-29,100 $29,100-109,102 $109,102-361,198 $361,198-3,299,421,785
14
Charities engaged in
Portal Giving tend to
be larger.
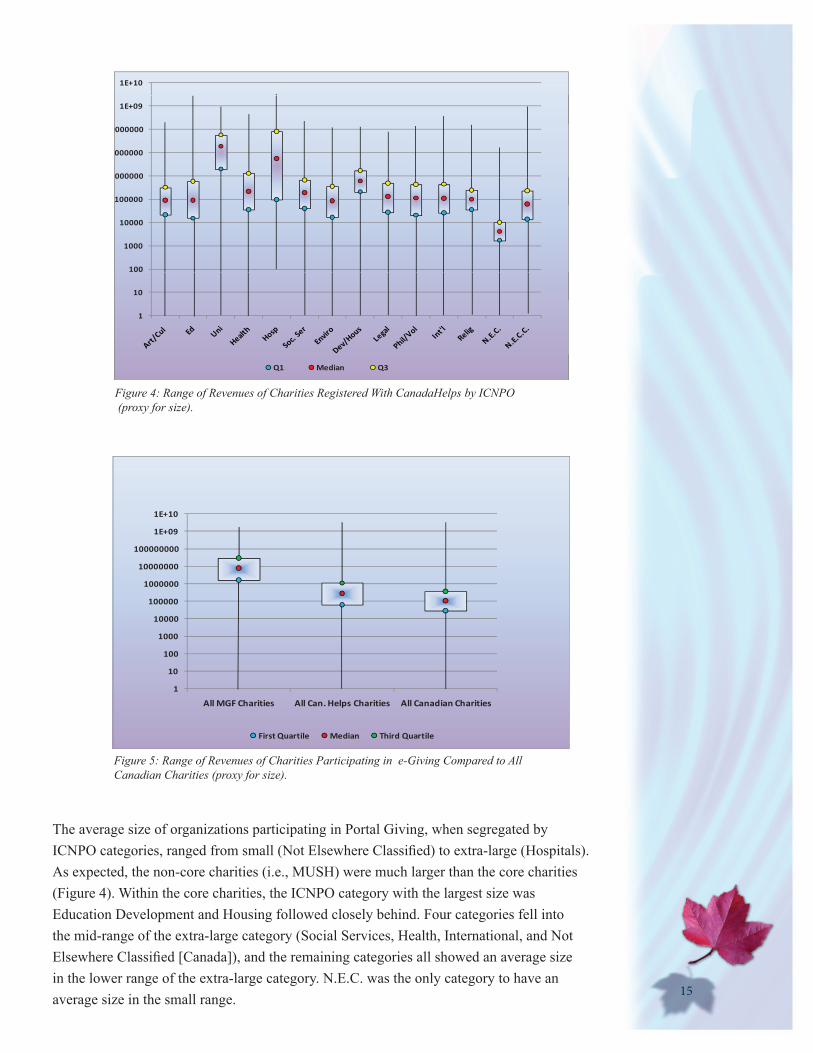
Figure 4: Range of Revenues of Charities Registered With CanadaHelps by ICNPO (proxy for size).
Figure 5: Range of Revenues of Charities Participating in e-Giving Compared to All Canadian Charities (proxy for size).
The average size of organizations participating in Portal Giving, when segregated by ICNPO categories, ranged from small (Not Elsewhere Classifi ed) to extra-large (Hospitals). As expected, the non-core charities (i.e., MUSH) were much larger than the core charities (Figure 4). Within the core charities, the ICNPO category with the largest size was Education Development and Housing followed closely behind. Four categories fell into the mid-range of the extra-large category (Social Services, Health, International, and Not Elsewhere Classifi ed [Canada]), and the remaining categories all showed an average size in the lower range of the extra-large category. N.E.C. was the only category to have an average size in the small range.
1E+09
1E+10
100000
000000
000000
0000000
1E+09
10
100
1000
10000
100000
000000
1
10
Q1 Median Q3Q1 Median Q3
1
10
100
1000
10000
100000
1000000
10000000
100000000
1E+09
1E+10
All MGF Charities All Can. Helps Charities All Canadian Charities
First Quartile Median Third Quartile
15

The average size of charitable organizations participating in Text Giving in addition to other avenues of e-Giving was larger than those organizations that used only Portal Giving. This is not surprising given the aforementioned guideline threshold of $250,000 in donation revenues of the previous year. Although organizations belonged exclusively to the extra-large quartile, much room for growth remains in Text Giving. The extra-large organizations, therefore, appear to be the most comfortable with adopting this technology. This would suggest additional studies might reveal the size of the earliest adopters of Portal Giving to ascertain trends in adoption rates of new technologies based on organizational size and the experience of CanadaHelps.
Across all ICNPO categories, organizations that used Text Giving tend to be largerthan those utilizing Portal Giving. Within the Hospital category, smaller hospitalsappear to utilize Text Giving to a greater degree than larger hospitals, which tend tofavour Portal Giving.
Figure 6: Relative Size and Revenue Raised of Charities Participating in Text Giving.
Figure 7: Relative Size and Revenue Raised of Charities Participating in Portal Giving.
70%
80%
90%
100%
30%
40%
50%
60%
70%
80%
0%
10%
20%
30%
40%
$29,100.00 $109,102.00 $361,198.00 $3,299,421,785.00
% of Total Charities Registered with MGF
% of Total Revenue Generated by Text Giving
% of Total Charities Registered with MGF
% of Total Revenue Generated by Text Giving
25%
30%
10%
15%
20%
25%
Percent of Revenue of
Total Charities
percent of total revenue
percent of total charities registered with CanadaHelps
0%
5%
10%
Revenue of Total Charities
percent of total charities registered with CanadaHelps
16

NUMBER OF PARTICIPATING ORGANIZATIONS
In the ten years CanadaHelps has operated as a donation portal, the ratio of registered organizations utilizing Portal Giving to all Canadian charitable organizations has steadily increased from 1% of total Canadian charities in 2002 to 9% of total Canadian charities in 2009 (Figure 8). The rate of adoption of Portal Giving within each ICNPO category also grew substantially during the period 2000 to 2010, particularly among non-core charities. By 2009, 31% of all environment related charities and 27% of all international related charities had registered with CanadaHelps. Universities (23%) were the only non-core category to exceed the 20% registration rate.. The second-highest adoption range was between 10% and 20%. Arts and Culture (16%), Health (18.5%), Legal (14%), and Social Services (11.5%) all fell within this range. The remaining charities that joined CanadaHelps did so at a rate of less than 10%.
Figure 8: Percent of All Canadian Charities Participating in Portal Giving.
50000
60000
70000
80000
N b f
0
10000
20000
30000
40000
50000
60000
1 2 3 4 5 6 7 8 9 0
Number of Organizations
0
10000
2001
2002
2003
2004
2005
2006
2007
2008
2009
2010
Year
Total Charitable Organizations in CanadaTotal Charitable Organizations Registered with Canada …
17
There has been a steady
increase in Portal Giving.
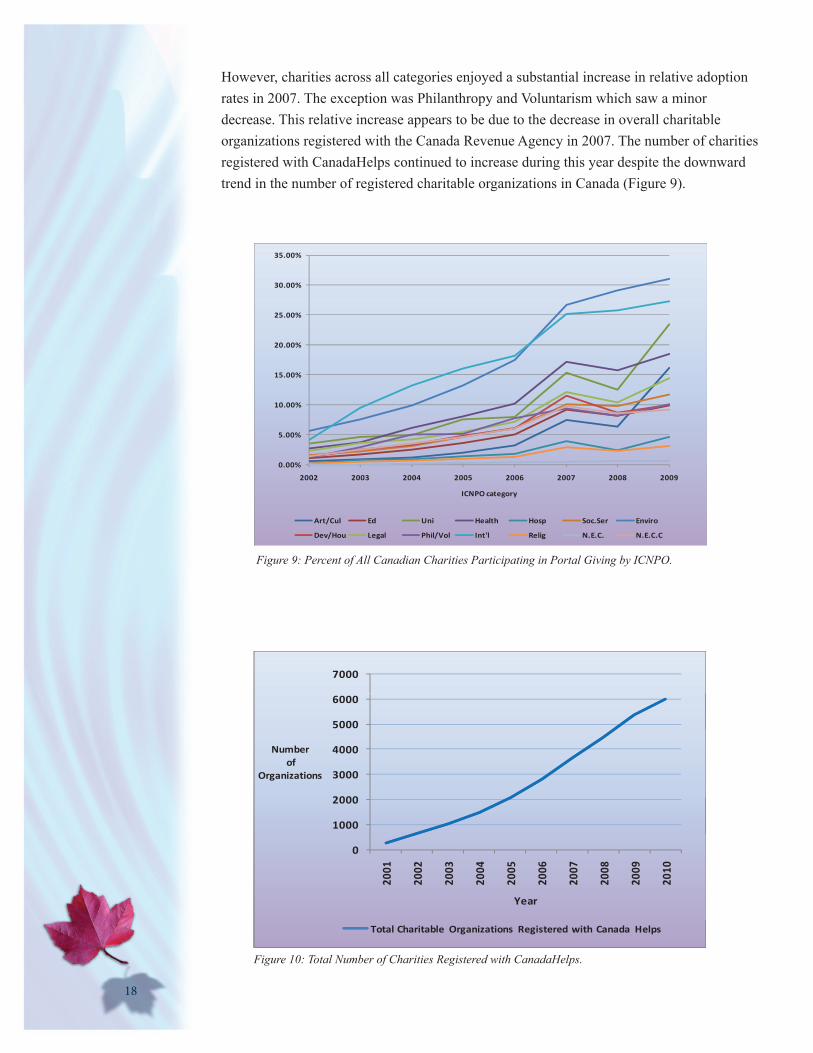
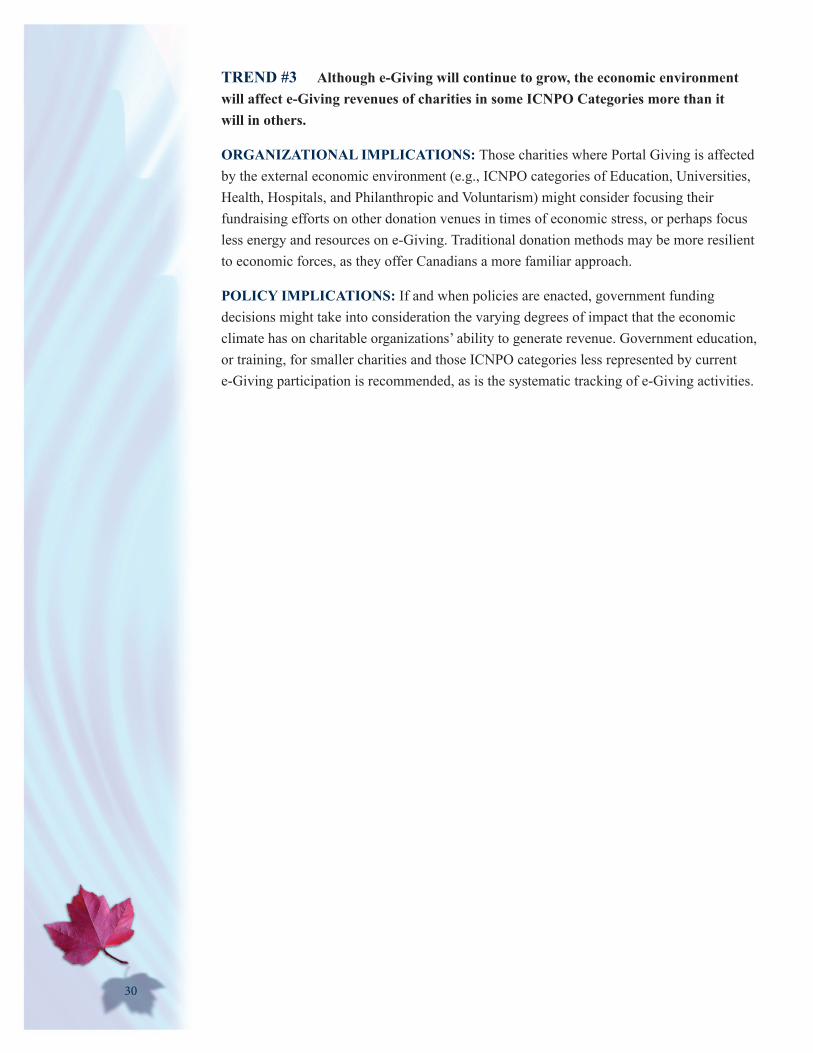
However, charities across all categories enjoyed a substantial increase in relative adoption rates in 2007. The exception was Philanthropy and Voluntarism which saw a minor decrease. This relative increase appears to be due to the decrease in overall charitable organizations registered with the Canada Revenue Agency in 2007. The number of charities registered with CanadaHelps continued to increase during this year despite the downward trend in the number of registered charitable organizations in Canada (Figure 9).
Figure 10: Total Number of Charities Registered with CanadaHelps.
5000
6000
7000
1000
2000
3000
4000
5000
6000
Numberof
Organizations
0
1000
2000
2001
2002
2003
2004
2005
2006
2007
2008
2009
2010
Year
Total Charitable Organizations Registered with Canada HelpsTotal Charitable Organizations Registered with Canada Helps
Figure 9: Percent of All Canadian Charities Participating in Portal Giving by ICNPO.
18
25.00%
30.00%
35.00%
10.00%
15.00%
20.00%
25.00%
0.00%
5.00%
10.00%
2002 2003 2004 2005 2006 2007 2008 2009
ICNPO categoryICNPO category
Art/Cul Ed Uni Health Hosp Soc.Ser Enviro
Dev/Hou Legal Phil/Vol Int'l Relig N.E.C. N.E.C.C

The number of charities registered with CanadaHelps currently ranges from 9 (N.E.C) to 1363 (Social Services) depending on the category. The Social Services charities were by far the largest number of early adoptorsadopters and have continued to lead the pack. By 2010, fi ve ICNPO categories broke the 500-charity mark: Arts and Culture (701), Education (606), Health (710), Religion (999), and N.E.C.C. (523). The remaining categories showed a much lower number registered for Portal Giving. Four categories had 50 or fewer registrants (Universities, Hospitals, Legal, and N.E.C.) (Figure 11).
The Mobile Giving Foundation had substantially fewer registrants (Table 2). This is to be expected in the fi rst year of operation, but the adoption rate for Text Giving might also be affected by the fi nancial commitment demanded of charitable organizations at the time of registration. Only two categories exceeded more than ten registrants, Social Services (27) and International (15). Four categories had only one registrant (Arts and Culture, Housing and Development, Legal, and Philanthropic and Voluntarism). Due to the confi dentiality concerns involved in identifying the revenues generated by a single organization, these last four categories have been grouped together in a category labeled “combined”, and are thus neither statistically relevant nor categorically helpful in identifying trends at the current time. In the future, as these groups expand, their contribution to the overall trends within Text Giving is expected to increase.
Table 2: Number of organizations registered with the Mobile Giving Foundation by ICNPO category.
4 7 2 7 2 27 7 15 3 0 5
Combined Education University Health Hospital Social Services
Environmental Legal Religion N.E.C N.E.C.C
Figure 11: Number of Charities Registered With CanadaHelps by ICNPO.
1200
1400
1600
600
800
1000
1200
0
200
400
600
2001 2002 2003 2004 2005 2006 2007 2008 2009 2010
Art/Cul Ed Uni Health Hosp Soc.Ser Enviro
Dev/Hou Legal Phil/Vol Int'l Relig N.E.C. N.E.C.C
Art/Cul Ed Uni Health Hosp Soc.Ser Enviro
Dev/Hou Legal Phil/Vol Int'l Relig N.E.C. N.E.C.C
19

DONATION FREQUENCY
The overall frequency of e-Giving donations to charitable organizations registered with CanadaHelps has also increased during the past ten years. In 2001, the average donation frequency was 1.9 donations per charity. By 2010, the average donation frequency had increased to 48 donations per charity (Figure 12).
Figure 12: Average number of donations to each charity registered with CanadaHelps.
50
60
20
30
40
Number of Donations
0
10
20
YearYear
Average Number of Donations Per Charity
20
The frequency of e-giving in Canada has increased.

Within the ICNPO categories, the average donation frequency in the International category, far outpaced the other categories. In fact, the donation frequency in 2010 to International charities was double that of the next highest category; 119 donations per organization compared to 65 donations for Environmental charities (Figure 13). This pattern differs from the overall frequency pattern observed by the 2007 National Survey of Giving, Volunteering, and Participating which revealed a diminished donation frequency across all avenues of giving. The fact that donation frequency, per organization, to Portal Giving is increasing refl ects a positive correlation between this method of fundraising and the expectations of the Canadian population. It appears to support the hypothesis that charitable organizations are adapting to their changing environment. The term ‘appears’ is used due to the relatively small sample size of the populations we are working with and their inherent lack of representation of the overall population. As mentioned previously, not all charities fi ll in Revenue Canada’s Basic Information Sheet, which leaves a portion of our available population beyond the scope of the study. There were also two participants that had yet to fi le an initial tax return. At this time, it is not possible to accurately identify the frequency with which donations are directed to individual organizations using Text-Giving due to confi dentiality issues. However, a general framework can be established for the possible donation frequency based on the total dollar amount of funds raised and based on current allowable donation amounts of fi ve and ten dollars.
Figure 13: Average number of donations to each charity registered with CanadaHelps by ICNPO.
100
120
140
60
80
100
Mean Number of Donations
0
20
40
60
2001 2002 2003 2004 2005 2006 2007 2008 2009 2010
Year
0
2001 2002 2003 2004 2005 2006 2007 2008 2009 2010
Year
Art/Cul Ed Uni Health HospSoc. Ser Enviro Dev/Hou Legal Phil/VolInt'l Relig N.E.C. N.E.C.C.
21

DONATION AMOUNT
In the last ten years, the mean dollar amount of each donation to organizations registered with CanadaHelps has remained relatively stable. The mean dollar donation has varied between 15 and 17 dollars per donation. One outlying average in 2007 of 19 dollars could perhaps be explained by the support Canadians demonstrated for the Asian tsunami relief effort. Although there have been signifi cant international disasters in subsequent years (Haiti, Japan), the Canadian federal government pledged to match donations of citizens dollar for dollar for the tsunami relief effort, which may have resulted in higher than average donations (Figures 14 and 15).38
Figure 14: Average Donation Amount to Charities Registered With CanadaHelps by ICNPO.
Figure 15: Average Number of Donations Received by All Charities Registered WithCanadaHelps by Year.
200000
250000
300000
50000
100000
150000
200000
0
50000
Number of DonationsNumber of Donations
38 CBC News Online, How to help tsunami victims: donating money or time, Jan. 19, 2005.
22
0
5
10
15
20
25
2001 2002 2003 2004 2005 2006 2007 2008 2009 2010
Mean Donation Amount
(thousands of dollars)
Year
Art/Cul Ed Uni Health HospSoc. Ser Enviro Dev/Hou Legal Phil/VolInt'l Relig N.E.C. N.E.C.C.

There were three sub-trends among the ICNPO categories that became apparent within the overall pattern of increasing donation amounts. The FIRST DONATION SUB-TREND was a continual increase in mean donation amount until 2004 at which point the mean donation amount grew to its highest over 2006/07. This is exhibited in the fi elds of Health and Education and includes both core and non-core components of each fi eld. This sub-trend is also exhibited in the Philanthropic and Voluntarism fi eld. In all fi elds, there is a slight dip in 2008, with a return to the previous high levels of 2009/10. It would suggest that the online donation amount in these categories is responsive to economic pressures, as the drop in donation revenue corresponds with the 2008 recessionary period. However, more information would be required to establish causation.
Figure 16: Sub-trend 1 [Charity Categories Apparently Affected by Economic Environment].
7
8
9
10
3
4
5
6
7
8
MeanDonationAmount
(thousands of dollars)
0
1
2
3
4
2001 2002 2003 2004 2005 2006 2007 2008 2009 2010
(thousands of dollars)
Year
2001 2002 2003 2004 2005 2006 2007 2008 2009 2010
Year
Ed Uni Health Hosp Phil/Vol
A continual increase in
mean donation amount.
Responsive toeconomic pressures.
23

THE SECOND SUB-TREND is a slow and steady increase in donation revenue and appears to be unaffected by exterior economic factors. Further investigation of the underlying common characteristics of the organizations comprising these groups would be informative but lies beyond the scope of this study. It is not immediately apparent why such diverse categories such as Arts and Culture, Social Services, Legal, and the Environment would appear to be resistant to outside economic pressures. Perhaps an accompanying decrease in governmental expenditures in these areas, or an increase inthe marketability of these categories, will be found in subsequent studies.
7
8
9
10
3
4
5
6
7
MeanDonation Amount
(thousands of dollars)
0
1
2
3
4
2001 2002 2003 2004 2005 2006 2007 2008 2009 2010
(thousands of dollars)
Year
/
2001 2002 2003 2004 2005 2006 2007 2008 2009 2010
Year
Art/Cul Soc. Ser Enviro Legal N.E.C. N.E.C.C.
Figure 17: Sub-trend 2: [Charity Categories Not Apparently Affected by Economic Environment].
Arts and Culture, Social
Services, Legal, and the Environment
appear to be resistant to outside economic pressures.
24

THE THIRD SUB-TREND is a mean donation amount which is signifi cantly higher than the overall mean. It consists of charities within three categories (International, Religion, and Development and Housing) whose donation revenues greatly exceed the overall trend line. Development and Housing had, by 2010, reached mean revenue levels above $9,000 and Religion had reached nearly $11,000. The International category more than doubles these numbers with average revenues reaching nearly $22,000 per charitable organization by 2010. The overall average for these groups, over the ten years, is $15,516, three times higher than either of the other two trend groups, neither of which exceeds $5300.
Figure 18: Sub-trend 3: [Charity Categories Capturing Donation Revenues Greatly ExceedingOther ICNPO Categories].
15
20
25
M
5
10
15Mean
Donation Amount
(thousandsof dollars)
Maximum donation amount for other ICNPO categories
0
5
2001 2002 2003 2004 2005 2006 2007 2008 2009 2010
)
Year
Dev/Hou Int'l Relig
amount for other ICNPO categories
International, Religion,
and Developmentand Housing
revenuesgreatly exceed
the overall trend line.
25

SUMMARY OF TRENDS AND POLICY IMPLICATIONS
As is shown in Figure 19, the absolute contribution of Portal Giving to the Canadian charitable sector has increased over time. Although the contribution of Text Giving is not as signifi cant in 2010, it is, however, similar in magnitude to the funds generated by CanadaHelps in its fi rst year of operations. If the Mobile Giving Foundation continues to follow the trajectory established by Portal Giving during the last ten years, a substantial increase can be expected in Text Giving in the generation of funds for the Canadian charitable sector.
Given the increased mean frequency of donations per organization registered with CanadaHelps, e-Giving, it could be suggested, is a good fi t for charitable fundraising in Canada. When technology is used, however, to connect charitable organizations with their donors, it is imperative that both ends of the bridge fi t their respective shorelines Canadian donors have embraced electronic fund transfers in many aspects of their lives and charitable organizations’ electronic participation is greatly aided by pre-existing frameworks in both online and wireless worlds. Intermediaries that assume some of the administrative burden of fundraising for charities has allowed more organizations to embrace technological change. Thus, to continue with the analogy, both shorelines have accepted the bridge, and charities and donors need only cross the bridge to reach the other. The positive growth in Portal Giving attests to its success to date, and it is anticipated that Text Giving will be equally successful.
Trends are prevalent in the patterns of e-Giving in Canada. The last segment of this report will address their implications on policies and practices.
Figure 19: Comparative Success in e-Giving by ICNPO, Mobile Giving Foundationand CanadaHelps.
20000
25000
10000
15000DonationsReceived
(hundreds of dollars)
0
5000
10000of dollars)
ICNPO CategoriesICNPO Categories
MGF 2010 CH 2010 CH 2005 CH 2001
26

TREND #1 The mean revenues, in both the core and non-core categories, ofthose organizations using e-Giving tends to be higher than the mean revenuesof all Canadian charitable organizations.
ORGANIZATIONAL IMPLICATIONS: To date, charities participating in e-Giving are benefi ting from their experiences and continue to appeal to donors. This report demonstrates a positive correlation between e-Giving participation and increased revenues. I would suggest that more charitable organizations, especially those with lower revenue levels, would benefi t by implementing these technologies. The combination of increases in both the frequency and the size of donations per charity per year registered with CanadaHelps indicates a new technology that Canadians are accepting as a viabledonation option.
Figure 20: Mean size of participating organizations, in millions of dollars.
350
400
450
500
150
200
250
300
350
400
Core
Non core
Combined
0
50
100
150
Canada Helps Mobile Giving Foundation
All Canadian Charitable
Organizations
Non core
Combined
Foundation Charitable Organizations
27

POLICY IMPLICATIONS: Policy makers in the charitable sector should acknowledge that Canadians wish to support the sector and will be more likely to do so if effi ciency, security, purpose, and familiarity is present for ease of donating. The numbers remain small for the Text Giving option. Even though the security measures are proportionately higher for Text Giving, the transmission rate of funds is much slower than the time delays involved in Portal Giving.. Text Giving is the most effi cient means of donation, but it is currently limited in two ways: the limited dollar amount per donation, and the delay for a donation receipt. Although Portal Giving delivers funds to the fi nal destination more quickly, there remains a signifi cant time differential for the donor compared to Text Giving. Strategically, both options are benefi cial because they might capture a larger portion of the market if used together. When backed by a third party, all types of e-Giving are fairly secure. The least secure way to donate online would appear to be through a charity’s own website due to fears of false transaction pages and identity theft. These fears would be partially alleviated if changes in the charitable sector’s security and effi ciency were made apparent to the public. Part of this transparency should be worked sector and government agreements and also be blended with a plan to move more charitable organizations toward increased interactions with trusted third-party facilitators. At a time when all levels of government are engaging in deliberate relationships with the charitable sector, so should the attention be on how these mutually benefi cial evolving relations (i.e., government to fund less and charities to raise more)39
39 Carter, Susan and Paula Speevak Sladowski, Deliberate relationships Between Governments and the Nonprofi t/Voluntary Sector: an unfolding picture, 2008.
28

TREND #2 Relative levels of participation tend to be similar within ICNPO categories regardless of the method of e-Giving used and over time.
ORGANIZATIONAL IMPLICATIONS: Due to the success charities in e-Giving have experienced, those charities in ICNPO categories with lower participation rates might benefi t from encouraging their charitable sector companions to adopt e-Giving. An increased level of participation would benefi t both the avenues of e-Giving (i.e.,CanadaHelps and the Mobile Giving Foundation) and the organizations due to the cross-marketing phenomenon. The more that donors visit portal sites and the more that they use Text Giving option, then e-Giving will continue to evolve as part of the Canadian philanthropic culture.
POLICY IMPLICATIONS: Given the lower rates of youth donation in Canada, a donation avenue which ameliorates the fi t between young Canadians and charities should be embraced by policy makers interested in continuing Canada’s impressive record in the charitable sector.
Figure 21: Participation Rates Over Time.
1000
1200
1400
1600
400
600
800
1000
1200
Number of
Charities
2001
Portal
0
200
4002001
2005
2010
Portal
1 7 2 7 2 27 7 1 1 1 15 3 --- 5 Text
29
TREND #3 Although e-Giving will continue to grow, the economic environment will affect e-Giving revenues of charities in some ICNPO Categories more than itwill in others.
ORGANIZATIONAL IMPLICATIONS: Those charities where Portal Giving is affected by the external economic environment (e.g., ICNPO categories of Education, Universities, Health, Hospitals, and Philanthropic and Voluntarism) might consider focusing their fundraising efforts on other donation venues in times of economic stress, or perhaps focus less energy and resources on e-Giving. Traditional donation methods may be more resilient to economic forces, as they offer Canadians a more familiar approach.
POLICY IMPLICATIONS: If and when policies are enacted, government funding decisions might take into consideration the varying degrees of impact that the economic climate has on charitable organizations’ ability to generate revenue. Government education, or training, for smaller charities and those ICNPO categories less represented by current e-Giving participation is recommended, as is the systematic tracking of e-Giving activities.
30

FURTHER OPPORTUNITIES FOR EXPLORATION
Throughout this report, there have been several opportunities for further analysisidentifi ed. Information may be currently unavailable or statistically unrepresentative;or the analysis may simply be beyond the scope of this study. Two specifi c opportunitiesare worthy of mention:
1. In conjunction with the Canadian Revenue Agency, the nonprofi t sector in general, and the charitable sector in particular, should endeavor to ameliorate the process of trend analysis in fund generation. Specifi cally, analysis would be greatly aided if organizations were required to state: a) their primary purpose within the ICNPO categories; and, b) the method of donation collection. The fi rst requirement could be facilitated by implementing the classifi cation system recommended by the Economic Statistics Branch of the United Nations and the Johns Hopkins University Center for Civil Society Studies. The ICNPO indicators could be applied to the Canada Revenue Agency’s Basic Information Sheet for the identifi cation of primary purposes of charitable organizations. and as a requirement for continued charitable status. The second requirement could be facilitated by adding to the CRA T3010 Income Tax form a subset of what is currently line 4500 (total tax-receipted revenues), which would allow the charity to identify the method of donation.
2. Philanthropic intermediaries, such as CanadaHelps (individual donations), Canada Gives (personal foundations), and the Mobile Giving Foundation should be encouraged to keep their records in a format compatible with analysis on an international level. The organizations contributing to this study were both extremely helpful and accommodating. However, it is too onerous to ask organizations, which are already maximizing their resources, to mine for data on a continual basis. A standardized categorization framework, in conjunction with mandatory statements of primary purpose by the organizations, would make record keeping a much easier prospect for these intermediaries.
31
The future of e-Giving research.

Institute for Nonprofi t StudiesMount Royal University
4825 Mount Royal Gate SW, Calgary, Alberta
http://www.mtroyal.ca/nonprofitinstitute