EGIONAL CONTEXT FOR INTERCITY PASSENGER … A REGIONAL CONTEXT FOR INTERCITY PASSENGER RAIL...
15
http://www.coneg.org AREGIONAL CONTEXT FOR INTERCITY PASSENGER RAIL IMPROVEMENTS IN THE NORTHEAST AUGUST 24, 2009 Prepared For: CONEG Policy Research Center, Inc. By: Matthew Coogan, Consultant in Transportation, in Association with Resource Systems Group, Inc., and SmartMobility, Inc.
-
Upload
hoangtuyen -
Category
Documents
-
view
231 -
download
1
Transcript of EGIONAL CONTEXT FOR INTERCITY PASSENGER … A REGIONAL CONTEXT FOR INTERCITY PASSENGER RAIL...
http://www.coneg.org
A REGIONAL CONTEXT FOR INTERCITY PASSENGER RAILIMPROVEMENTS IN THE NORTHEAST
AUGUST 24, 2009
Prepared For:CONEG Policy Research Center, Inc.
By:Matthew Coogan, Consultant in Transportation, in Association with ResourceSystems Group, Inc., and SmartMobility, Inc.
CONEG Policy Research Center, Inc.
The CONEG Policy Research Center, Inc., the staff arm to the Coalition of Northeastern Governors (CONEG),encourages intergovernmental cooperation in the Northeast through joint consideration of common issuesrelating to the economic, environmental and social well-being of the Northeast states.
The Center wishes to thank Matthew Coogan, Consultant in Transportation in association with ResourceSystems Group, Inc. and SmartMobility, Inc. for preparing this document.
This paper does not necessarily express the views of the Coalition of Northeastern Governors or the CONEG PolicyResearch Center, Inc.
1
A REGIONAL CONTEXT FOR INTERCITY PASSENGER RAILIMPROVEMENTS IN THE NORTHEAST
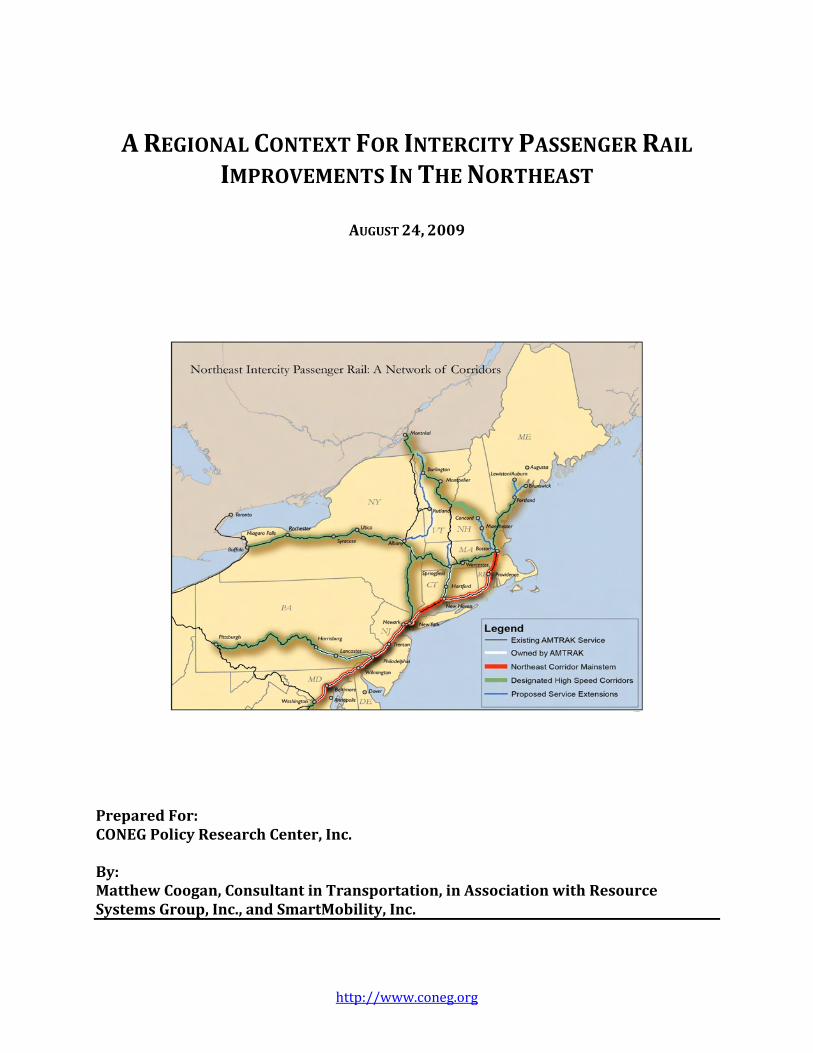
The Northeast region of the United States – the 11 states between Maine and Maryland and theDistrict of Columbia – is uniquely positioned to become the American showcase for the applicationof advanced intercity rail systems which incorporate high speed segments and improvedconnectivity. This region has the population density, the proximity of major travel sheds, theeconomic markets and existing rail corridors to support higher speed, integrated intercity railsystems.
The Northeast has a population density over three times that of the nation as a whole, withover 90 percent of the population living within 50 miles of an existing or proposed intercitypassenger rail corridor.
The Northeast states have a high level of economic interdependence and travelconnectivity, as reflected in the tens of millions of medium distance (100± mile) trips by allmodes that currently cross state lines and the 200 million such trips projected by 2025.
The Northeast has the nation’s primary high speed rail corridor, the Northeast Corridor(NEC), as well as a network of existing intercity corridors that, with appropriateinfrastructure investment and service coordination, have the potential to serve moreintercity travel markets, thereby diverting a significant level of trips from congestedairports and highways.
No region of the country is better suited to support the higher speed intercity rail systems that arethe objective of the nation’s high speed intercity rail vision and investment program.
Northeast Demographics Are Supportive of Intercity Rail Service
The Northeast is home to more than 60 million people. It represents approximately six percent ofthe nation’s land mass, and more than 20 percent of its population. The region’s overall density ofpopulation is about 3.5 times the density of the country as whole – a greater level of populationdensity than that of any of the potential rail corridors in the nation.
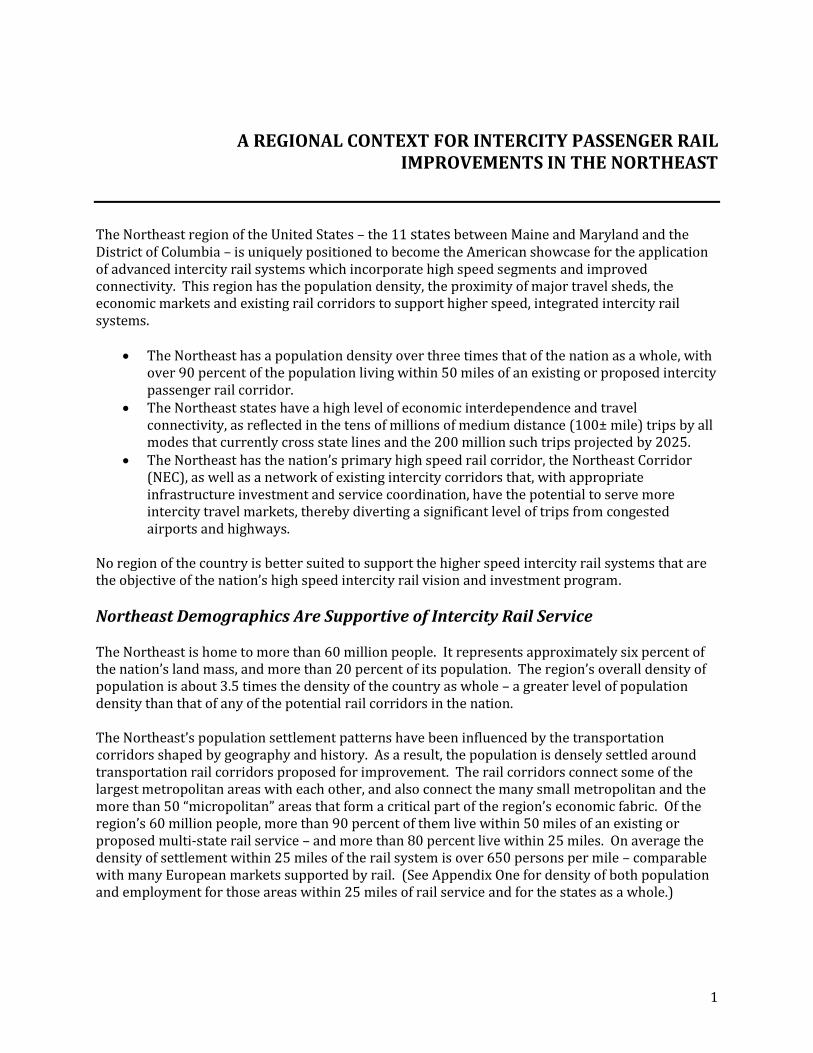
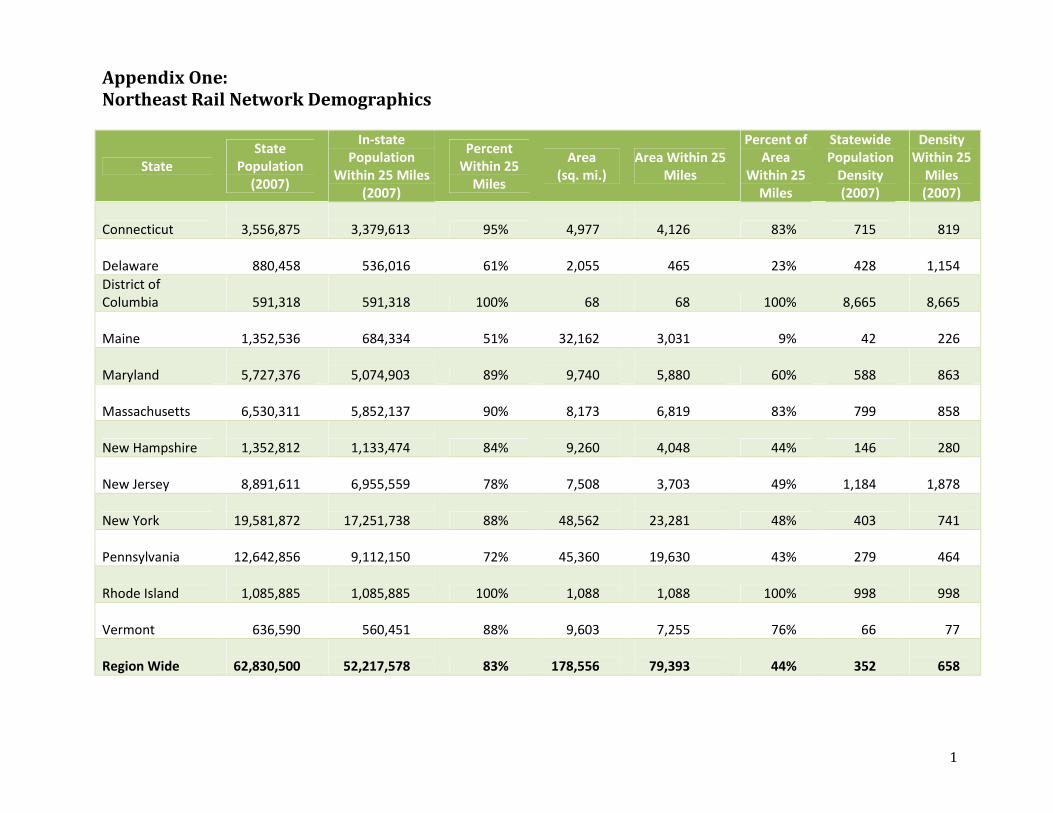
The Northeast’s population settlement patterns have been influenced by the transportationcorridors shaped by geography and history. As a result, the population is densely settled aroundtransportation rail corridors proposed for improvement. The rail corridors connect some of thelargest metropolitan areas with each other, and also connect the many small metropolitan and themore than 50 “micropolitan” areas that form a critical part of the region’s economic fabric. Of theregion’s 60 million people, more than 90 percent of them live within 50 miles of an existing orproposed multi-state rail service – and more than 80 percent live within 25 miles. On average thedensity of settlement within 25 miles of the rail system is over 650 persons per mile – comparablewith many European markets supported by rail. (See Appendix One for density of both populationand employment for those areas within 25 miles of rail service and for the states as a whole.)
2
Figure 1 - More than 80 percent of the population of the Northeast resides within 25 miles of the rail networkSource: SmartMobility, Inc. for CONEG Policy Research Center, Inc.
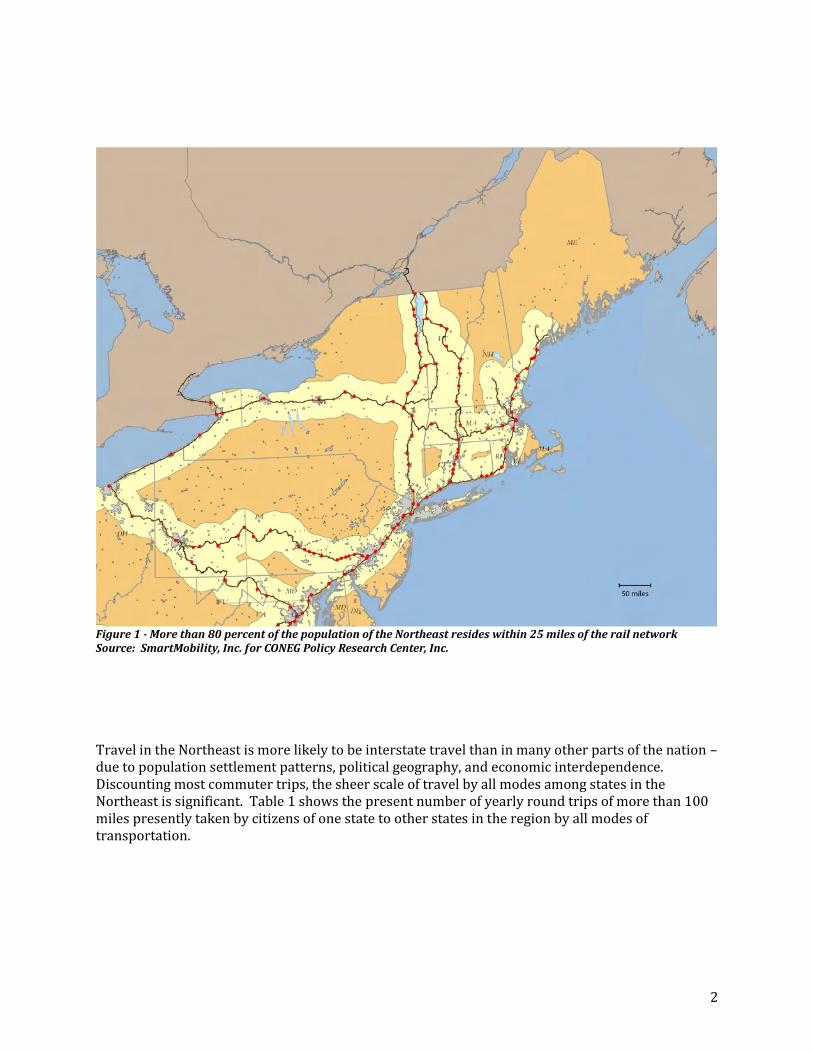
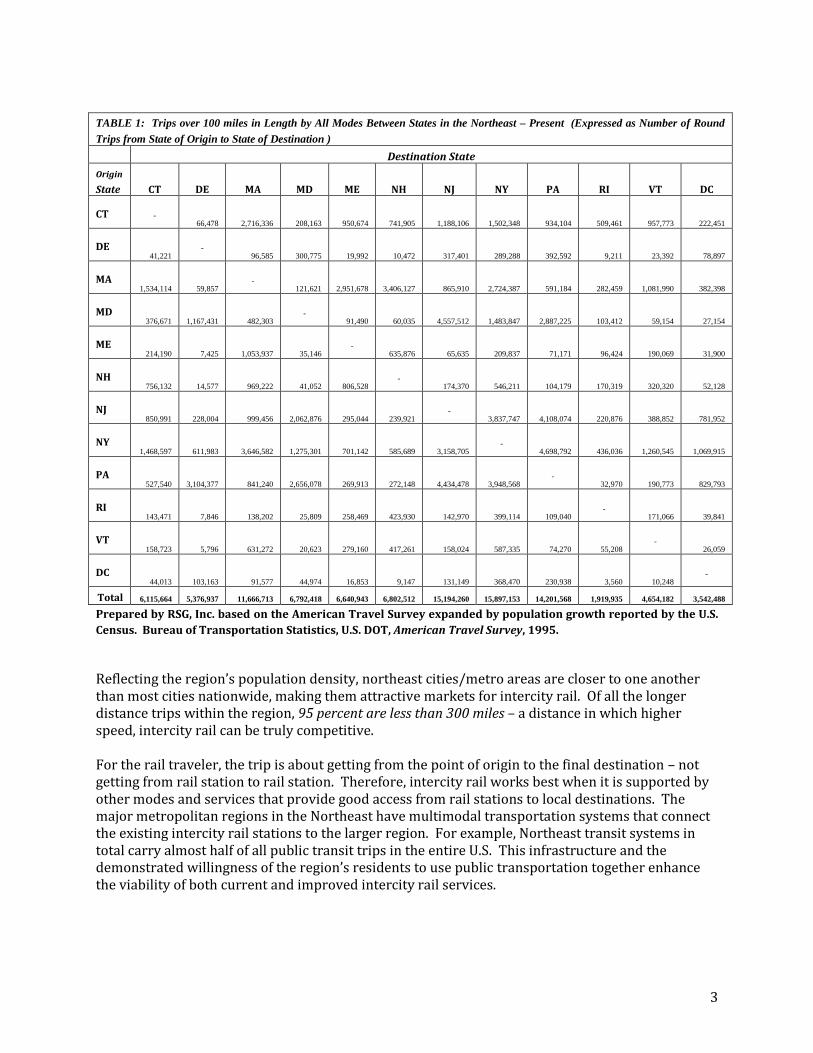
Travel in the Northeast is more likely to be interstate travel than in many other parts of the nation –due to population settlement patterns, political geography, and economic interdependence.Discounting most commuter trips, the sheer scale of travel by all modes among states in theNortheast is significant. Table 1 shows the present number of yearly round trips of more than 100miles presently taken by citizens of one state to other states in the region by all modes oftransportation.
3
TABLE 1: Trips over 100 miles in Length by All Modes Between States in the Northeast – Present (Expressed as Number of RoundTrips from State of Origin to State of Destination )
Destination StateOrigin
State CT DE MA MD ME NH NJ NY PA RI VT DC
CT -66,478 2,716,336 208,163 950,674 741,905 1,188,106 1,502,348 934,104 509,461 957,773 222,451
DE41,221
-96,585 300,775 19,992 10,472 317,401 289,288 392,592 9,211 23,392 78,897
MA1,534,114 59,857
-121,621 2,951,678 3,406,127 865,910 2,724,387 591,184 282,459 1,081,990 382,398
MD376,671 1,167,431 482,303
-91,490 60,035 4,557,512 1,483,847 2,887,225 103,412 59,154 27,154
ME214,190 7,425 1,053,937 35,146
-635,876 65,635 209,837 71,171 96,424 190,069 31,900
NH756,132 14,577 969,222 41,052 806,528
-174,370 546,211 104,179 170,319 320,320 52,128
NJ850,991 228,004 999,456 2,062,876 295,044 239,921
-3,837,747 4,108,074 220,876 388,852 781,952
NY1,468,597 611,983 3,646,582 1,275,301 701,142 585,689 3,158,705
-4,698,792 436,036 1,260,545 1,069,915
PA527,540 3,104,377 841,240 2,656,078 269,913 272,148 4,434,478 3,948,568
-32,970 190,773 829,793
RI143,471 7,846 138,202 25,809 258,469 423,930 142,970 399,114 109,040
-171,066 39,841
VT158,723 5,796 631,272 20,623 279,160 417,261 158,024 587,335 74,270 55,208
-26,059
DC44,013 103,163 91,577 44,974 16,853 9,147 131,149 368,470 230,938 3,560 10,248
-
Total 6,115,664 5,376,937 11,666,713 6,792,418 6,640,943 6,802,512 15,194,260 15,897,153 14,201,568 1,919,935 4,654,182 3,542,488
Prepared by RSG, Inc. based on the American Travel Survey expanded by population growth reported by the U.S.Census. Bureau of Transportation Statistics, U.S. DOT, American Travel Survey, 1995.
Reflecting the region’s population density, northeast cities/metro areas are closer to one anotherthan most cities nationwide, making them attractive markets for intercity rail. Of all the longerdistance trips within the region, 95 percent are less than 300 miles – a distance in which higherspeed, intercity rail can be truly competitive.
For the rail traveler, the trip is about getting from the point of origin to the final destination – notgetting from rail station to rail station. Therefore, intercity rail works best when it is supported byother modes and services that provide good access from rail stations to local destinations. Themajor metropolitan regions in the Northeast have multimodal transportation systems that connectthe existing intercity rail stations to the larger region. For example, Northeast transit systems intotal carry almost half of all public transit trips in the entire U.S. This infrastructure and thedemonstrated willingness of the region’s residents to use public transportation together enhancethe viability of both current and improved intercity rail services.
4
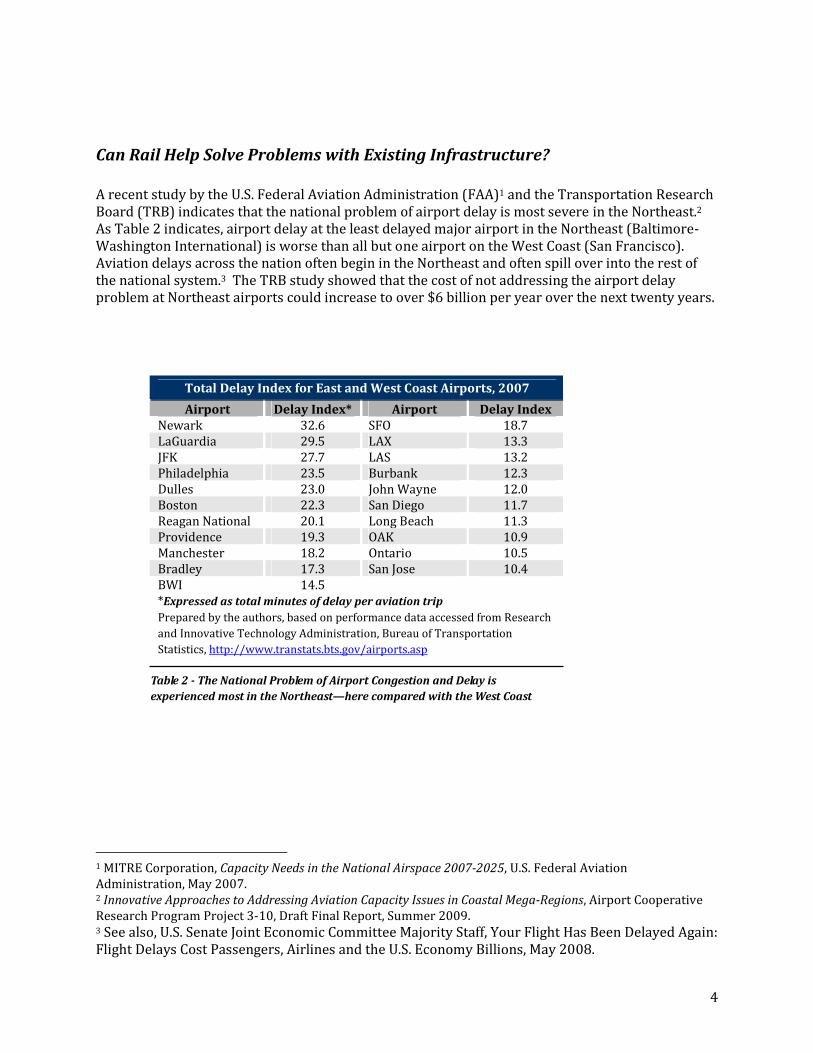
Total Delay Index for East and West Coast Airports, 2007
Airport Delay Index* Airport Delay IndexNewark 32.6 SFO 18.7LaGuardia 29.5 LAX 13.3JFK 27.7 LAS 13.2Philadelphia 23.5 Burbank 12.3Dulles 23.0 John Wayne 12.0Boston 22.3 San Diego 11.7Reagan National 20.1 Long Beach 11.3Providence 19.3 OAK 10.9Manchester 18.2 Ontario 10.5Bradley 17.3 San Jose 10.4BWI 14.5*Expressed as total minutes of delay per aviation tripPrepared by the authors, based on performance data accessed from Researchand Innovative Technology Administration, Bureau of TransportationStatistics, http://www.transtats.bts.gov/airports.asp
Table 2 - The National Problem of Airport Congestion and Delay isexperienced most in the Northeast—here compared with the West Coast
Can Rail Help Solve Problems with Existing Infrastructure?
A recent study by the U.S. Federal Aviation Administration (FAA)1 and the Transportation ResearchBoard (TRB) indicates that the national problem of airport delay is most severe in the Northeast.2As Table 2 indicates, airport delay at the least delayed major airport in the Northeast (Baltimore-Washington International) is worse than all but one airport on the West Coast (San Francisco).Aviation delays across the nation often begin in the Northeast and often spill over into the rest ofthe national system.3 The TRB study showed that the cost of not addressing the airport delayproblem at Northeast airports could increase to over $6 billion per year over the next twenty years.
1 MITRE Corporation, Capacity Needs in the National Airspace 2007-2025, U.S. Federal AviationAdministration, May 2007.2 Innovative Approaches to Addressing Aviation Capacity Issues in Coastal Mega-Regions, Airport CooperativeResearch Program Project 3-10, Draft Final Report, Summer 2009.3 See also, U.S. Senate Joint Economic Committee Majority Staff, Your Flight Has Been Delayed Again:Flight Delays Cost Passengers, Airlines and the U.S. Economy Billions, May 2008.
5
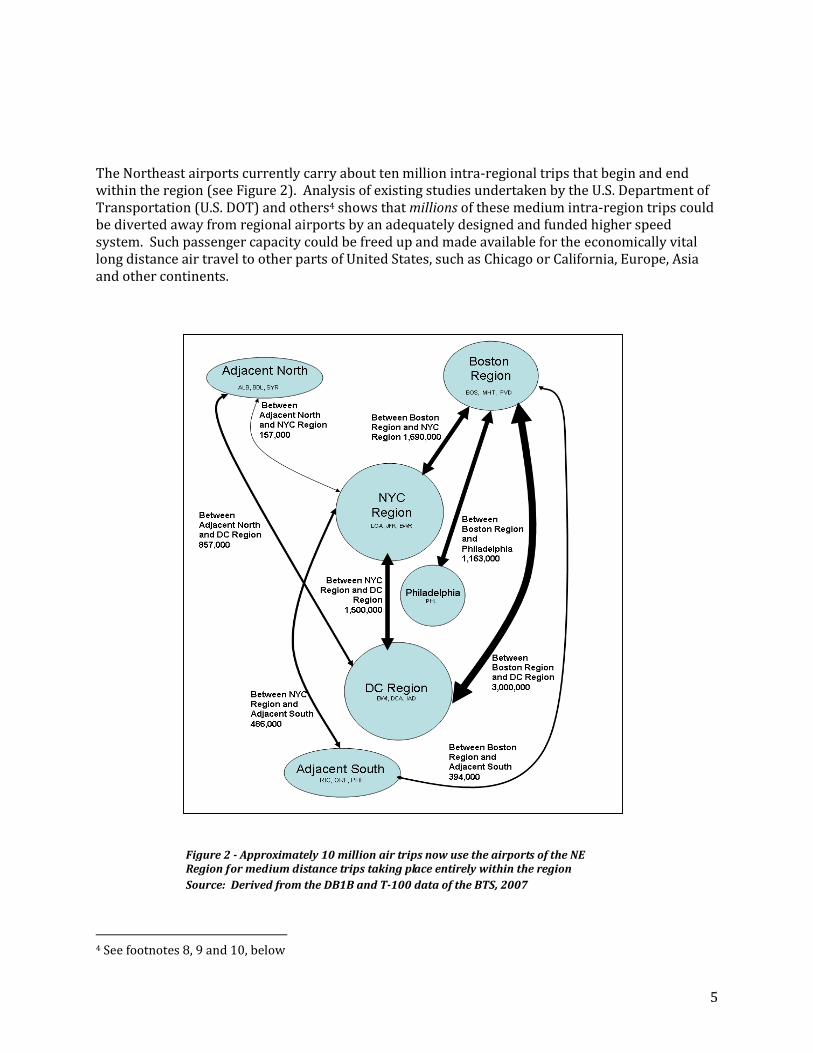
The Northeast airports currently carry about ten million intra-regional trips that begin and endwithin the region (see Figure 2). Analysis of existing studies undertaken by the U.S. Department ofTransportation (U.S. DOT) and others4 shows that millions of these medium intra-region trips couldbe diverted away from regional airports by an adequately designed and funded higher speedsystem. Such passenger capacity could be freed up and made available for the economically vitallong distance air travel to other parts of United States, such as Chicago or California, Europe, Asiaand other continents.
4 See footnotes 8, 9 and 10, below
Figure 2 - Approximately 10 million air trips now use the airports of the NERegion for medium distance trips taking place entirely within the regionSource: Derived from the DB1B and T-100 data of the BTS, 2007
6
Projected Growth in Multi-state Medium Distance Trips
As previously noted, the Northeast region already has a high level of medium distance (greater than100 miles) trips that cross state borders. States have developed highly sophisticated transportationplanning programs for travel within metropolitan areas. The national aviation system canaccommodate the long distance trips in which air is the most efficient and environmentally-appropriate answer. However, adequate planning has not been completed to deal with these“medium distance” interstate trips.
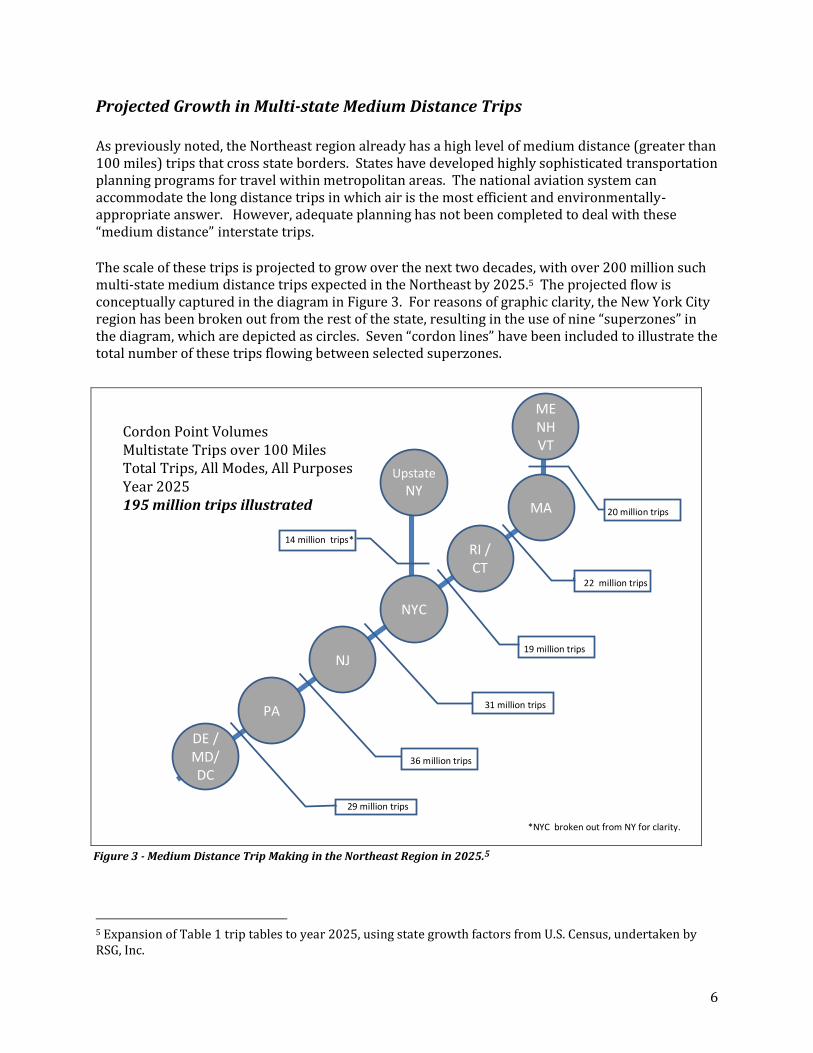
The scale of these trips is projected to grow over the next two decades, with over 200 million suchmulti-state medium distance trips expected in the Northeast by 2025.5 The projected flow isconceptually captured in the diagram in Figure 3. For reasons of graphic clarity, the New York Cityregion has been broken out from the rest of the state, resulting in the use of nine “superzones” inthe diagram, which are depicted as circles. Seven “cordon lines” have been included to illustrate thetotal number of these trips flowing between selected superzones.
5 Expansion of Table 1 trip tables to year 2025, using state growth factors from U.S. Census, undertaken byRSG, Inc.
PA
MENHVT
MA
RI /CT
NYC
NJ
DE /MD/DC
UpstateNY
Cordon Point VolumesMultistate Trips over 100 MilesTotal Trips, All Modes, All PurposesYear 2025195 million trips illustrated
*NYC broken out from NY for clarity.
20 million trips
22 million trips
19 million trips
31 million trips
36 million trips
29 million trips
14 million trips*
Figure 3 - Medium Distance Trip Making in the Northeast Region in 2025.5
7
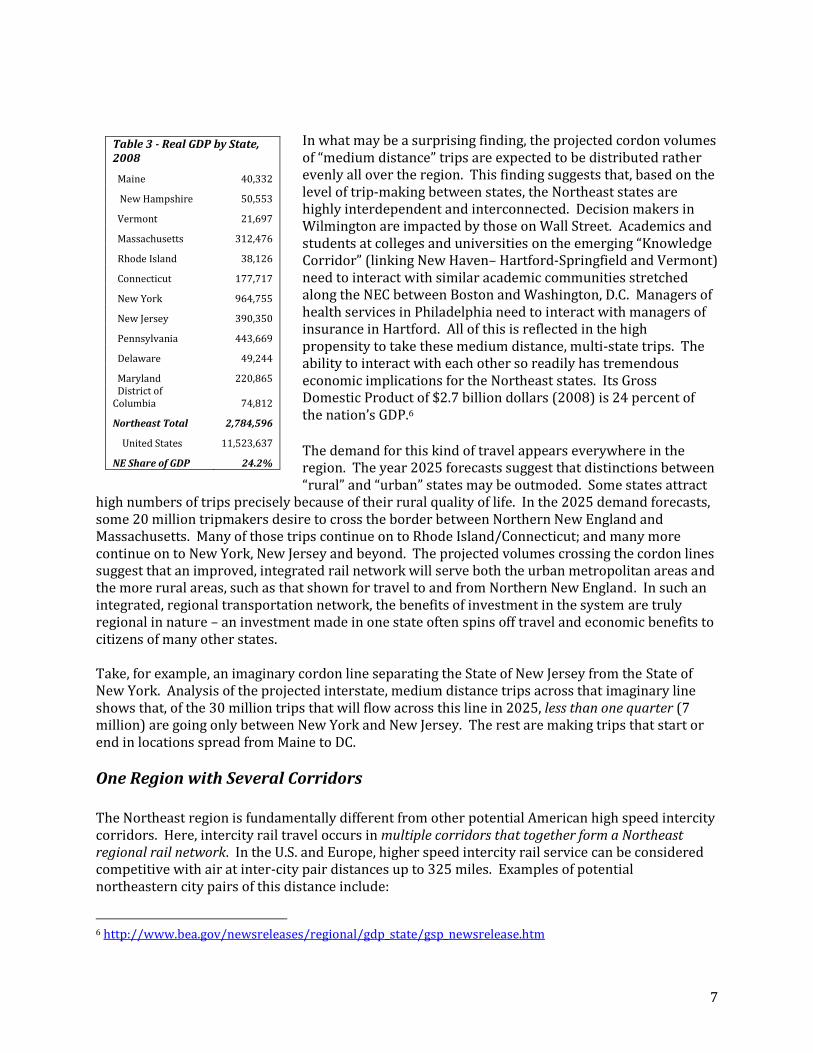
In what may be a surprising finding, the projected cordon volumesof “medium distance” trips are expected to be distributed ratherevenly all over the region. This finding suggests that, based on thelevel of trip-making between states, the Northeast states arehighly interdependent and interconnected. Decision makers inWilmington are impacted by those on Wall Street. Academics andstudents at colleges and universities on the emerging “KnowledgeCorridor” (linking New Haven– Hartford-Springfield and Vermont)need to interact with similar academic communities stretchedalong the NEC between Boston and Washington, D.C. Managers ofhealth services in Philadelphia need to interact with managers ofinsurance in Hartford. All of this is reflected in the highpropensity to take these medium distance, multi-state trips. Theability to interact with each other so readily has tremendouseconomic implications for the Northeast states. Its GrossDomestic Product of $2.7 billion dollars (2008) is 24 percent ofthe nation’s GDP.6
The demand for this kind of travel appears everywhere in theregion. The year 2025 forecasts suggest that distinctions between“rural” and “urban” states may be outmoded. Some states attract
high numbers of trips precisely because of their rural quality of life. In the 2025 demand forecasts,some 20 million tripmakers desire to cross the border between Northern New England andMassachusetts. Many of those trips continue on to Rhode Island/Connecticut; and many morecontinue on to New York, New Jersey and beyond. The projected volumes crossing the cordon linessuggest that an improved, integrated rail network will serve both the urban metropolitan areas andthe more rural areas, such as that shown for travel to and from Northern New England. In such anintegrated, regional transportation network, the benefits of investment in the system are trulyregional in nature – an investment made in one state often spins off travel and economic benefits tocitizens of many other states.
Take, for example, an imaginary cordon line separating the State of New Jersey from the State ofNew York. Analysis of the projected interstate, medium distance trips across that imaginary lineshows that, of the 30 million trips that will flow across this line in 2025, less than one quarter (7million) are going only between New York and New Jersey. The rest are making trips that start orend in locations spread from Maine to DC.
One Region with Several Corridors
The Northeast region is fundamentally different from other potential American high speed intercitycorridors. Here, intercity rail travel occurs in multiple corridors that together form a Northeastregional rail network. In the U.S. and Europe, higher speed intercity rail service can be consideredcompetitive with air at inter-city pair distances up to 325 miles. Examples of potentialnortheastern city pairs of this distance include:
6 http://www.bea.gov/newsreleases/regional/gdp_state/gsp_newsrelease.htm
Table 3 - Real GDP by State,2008
Maine 40,332
New Hampshire 50,553
Vermont 21,697
Massachusetts 312,476
Rhode Island 38,126
Connecticut 177,717
New York 964,755
New Jersey 390,350
Pennsylvania 443,669
Delaware 49,244
Maryland 220,865District of
Columbia 74,812
Northeast Total 2,784,596
United States 11,523,637
NE Share of GDP 24.2%
8
Washington, DC to Albany, NY Brattleboro, VT to Wilmington, DE Syracuse, NY to Philadelphia, PA Boston, MA to Wilmington, DE Harrisburg, PA to Springfield, MA Hartford, CT to Washington, DC Atlantic City, NJ to Providence, RI Bennington, VT to Baltimore, MD
Not considering size of population, each of the above travel markets reflects a geographic scale (adistance from origin to destination) that is served by high speed rail service in Europe and Asia. Inthe Northeast, these patterns of intercity travel demand rely upon rail infrastructure at the centerof the network – the Northeast Corridor – that serves not just one set of travelers (one ‘market’),but a core system that serves many separate markets cumulatively as they overlap with theNortheast Corridor. These multiple, inter-related travel flows make the Northeast a unique andfundamentally strong candidate for developing a more closely integrated network of intercity,higher speed passenger rail corridors.
Understanding the Potential for High Speed Rail in the Northeast
A review of previous research concerning the future of higher speed rail services in the Northeastwas undertaken in the preparation of this document.7 This continuing effort suggests that, basedon conclusions developed for the FRA and others, intercity higher speed ridership in 2025 couldrange from around 8 million annual passengers to well over 10 million – depending, of course, onthe kind of the investments made over the next two decades. A more exact level of intercitypassenger rail travel projected for the Northeast network cannot be known until specific serviceplans and engineering designs are drawn to determine the type of improvements and investmentsneeded for the network of corridors to achieve trip time and service goals. However, the potentialmarkets for more reliable, frequent and trip-time competitive rail services in the Northeast can beassessed. The original source material, undertaken by FRA in the 1990’s,8 has been more recentlyupdated for the Boston to Washington9 and the Empire10 Corridors. Each of the original studiesexamines a variety of capital investments, and a variety of door to door travel times made possibleby those investments.
7 Previous U.S. Department of Transportation research uses a market-driven, performance-based definition of“high speed” focused on trip times that are competitive with air and/or auto travel for markets in the 100-500 mile range. A technological option for high speed that is competitive in a medium distance corridor maynot be considered “high speed” in a longer corridor. Top speed is only one of several ways to reduce tip time.See U.S. Federal Railroad Administration, High Speed Ground Transportation for America, 1997. Under currentlaw, high speed rail is defined as intercity rail service that is reasonably expected to reach speeds at least 110mph. (Title 49, Subtitle V, Part D, Chapter 261, Section 26106(a)(4).8 U.S. Federal Railroad Administration, High Speed Ground Transportation for America. 1997. Ridershipforecasts developed by CRA International for Volpe National Transportation Systems Center.9 U.S. Department of Transportation, Analysis of the Benefits of High-Speed Rail on the Northeast Corridor,Office of the Inspector General, Office of the Secretary, Information Memorandum, June 16, 2008. Ridershipforecasts developed by CRA International.10 New York State Senate High Speed Rail Task Force Action Program, 2008; Chapter Three, pp. 3–8. Ridershipforecasts developed by CRA International.
9
Based on the previous work, diversion rates from other modes were developed for trips assumingconsiderably higher rail speeds than today, and with travel times comparable to a variety of presentEuropean systems. These diversion rates have been applied throughout the region, assuming thatmajor improvements are made on the Northeast Corridor, the Empire Corridor, and the KeystoneCorridor and on corridors into northern New England. The results discussed here are based onnew growth factors for longer distance travel between now and 2025, as developed by the MITRECorporation for the FAA in its definitive FACT-2 study of the future of aviation demand in theUnited States.11
As previously noted, northeast airports are presently supporting over ten million intra-regionaltrips. That consumer aviation capacity might be used for longer distance national and internationaltrips for which rail is not a reasonable alternative. According to the market potential studiesundertaken, (based on diversion rates developed for the U.S. DOT and others) high speed railservices could divert more than three million air trips within the region in 2025. Similarly, highspeed rail services could divert another one million trips off of the region’s highways – under theassumption of the improved travel times incorporated into the original U.S. DOT studies. Thisdiversion calculation makes no assumptions about specific rail improvements or the related costs.
The Environmental Impact of Success in the High Speed Rail Market
The studies of high speed rail potential markets suggest a range of futures – depending on theactual systems proposed, funded and built. Assuming that the future rail trip increases rangebetween the moderate and high, a future improved intercity rail system has the potential to attractsomewhere between eight million and more than ten million trips.
Looking only at the lower ridership assumption of approximately eight million trips, the scale of theenvironmental impact can be approximated. Of these trips, an estimated one million would bediverted from the roadway system. If the average length of the trip diverted to high speed intercityrail is 175 miles, an estimated 175 million person miles per year would be diverted from theroadway system. If each diverted trip carries an average of 2.4 persons per car, some 75 millionVehicle Miles of Travel (VMT) could be replaced as a result of investment in the region’s railnetwork. At current fuel efficiency levels, a reduction of 75 million VMTs would be associated witha savings of four million gallons of gasoline and a reduction of more than 30,000 metric tons ofcarbon dioxide equivalent greenhouse gases. If the average vehicle fuel efficiency were to rise to 30mph by 2025, the fuel used by auto drivers would decrease by more than two million gallonsannually.
Mobility and Travel Time Savings
An integrated regional rail system can enhance intra-regional mobility. Travelers who divert frompresent modes to another mode will do so when they perceive their travel times can be faster andmore reliable. With highway congestion projected to increase over the next 20 years (especiallywhen the medium distance trip must use roadway segments that experience peak periodcommuter-based congestion), it is not presently possible to estimate the exact travel times for theauto trip between 150 and 300 miles in length – the length of trip for which reliable, frequent and
11 MITRE Corporation, Capacity Needs in the National Airspace 2007-2025, U.S. Federal AviationAdministration, May 2007.
10
trip-time intercity passenger rail can attract travelers from other modes. However, certainassumptions can be made about a realistic sense of scale of benefit, particularly for a mediumdistance intercity rail trip. Assuming that the total rail system improvements over the next twodecades result in an average savings of one hour per trip, the potential mobility improvements canbe approximated.12 As a general observation, trips on corridors which have not yet been upgradedmight experience improvement of more than one hour while trips on segments which already havebeen upgraded might experience somewhat less than one hour improvement.
Reductions in intercity trip time also offer economic value to the traveler and the economy. TheU.S. DOT (FAA) values a savings of one hour in long distance intercity travel at $38 per hour incurrent dollars.13 If a fully integrated intercity regional rail system that offers frequent andcompetitive trip times attracted eight million passengers who perceived that their trip time wasimproved by only one hour, the perceived economic benefit from improved travel time/reliabilitywould exceed $300 million per year.
The Ability of the Northeast Region to Support Higher Quality Rail Service
A good example of the potential for the Northeast region to provide a market capable of supportingsuperior rail services is a recent study on the benefits of high speed rail on the Northeast Corridorby the U.S. DOT Inspector General. 14 This study focuses on the Boston-Washington, D.C. corridor(NEC) which, as previously noted, is the core segment of a network of corridors whose travelersfrequently overlap on the NEC. This study of the potential for improved intercity passenger rail inthe Northeast examined an option (“scenario 1”) in which travel times were improved by one halfhour on both north and south segments of the full NEC. In such a scenario, the benefits…
“would exceed the expenditures required to implement it. We found that achieving passengerrail travel times of 3-hours between Boston and New York and 2 1/2-hours between New Yorkand Washington (scenario 1) would produce a net present value benefit of $16.3 billion in2006 dollars. …These benefits are composed of $11.9 billion in increased rail revenues, $4.1billion in gains in consumer surplus, and $0.3 billion in congestion relief.”
The U.S. DOT OIG concluded that additional investment could bring additional market support inthe Northeast.
“Benefits from HSR would grow at an increasing rate with each further reduction in traveltime. Scenario 2, with its travel time reduced by an additional 1/2-hour from scenario 1 onboth the north and south ends of the NEC, would produce net present value benefits of $36.0billion. This is more than double those in scenario 1. Our evaluation showed that each further
12 The actual amount of savings per trip will depend on the present state of the infrastructure. Boston to NewYork has already improved from a five hour trip to about 3 ½ hours. The ridership analysis undertaken bythe Inspector General includes both an assumption of a one half hour improvement, and the assumption of aone hour improvement for each segment.13 Value of time updated to present from: APO Bulletin “APO-03-1—Treatment of Values of Travel Time inEconomic Analysis,” FAA Office of Aviation Policy and Plans, March, 2003, and “Revised DepartmentalGuidance—Valuation of Travel Time in Economic Analysis,” Office of the Secretary of TransportationMemorandum, February 11, 2003.14 U.S. DOT-OIG “Analysis of the Benefits of High-Speed Rail on the Northeast Corridor” (2008).
11
1/2-hour reduction in travel time would generate benefits at a greater rate as travel timedecreased.”
Since the NEC is the core segment of the regional network of rail corridors, it is reasonable toassume that the benefits described by the U.S. DOT OIG would accrue not only the rider whose tripbegins and ends on the NEC, but also those travelers whose trip involves one of the connectingcorridors.
In summary, the Northeast rail network offers a series of interrelated markets for superior intercitypassenger rail. The Northeast has a set of demographic and travel patterns that make it uniquelysuited for developing a more closely integrated network of intercity, higher speed passenger railcorridors. The current and planned network of corridors will readily reach more than 80 percent ofthe 60 million people residing in the Northeast. With quality service, this network could link anumber of new potential city pairs that span the NEC spine and its connectors. Northeasterners arealready making the medium distance, interstate trips for which higher speed intercity service canbe competitive. The future demand for such trips by all modes is only expected to growsignificantly over the next two decades. The ability of an integrated, higher speed intercity railsystem to attract an increasing number of these travelers from other modes – particularly fromintra-regional air travel – could help address the national problem of airport delay. In short, theNortheast region is a fundamentally strong candidate to support the higher speed intercity railsystems that are the objective of the nation’s high speed intercity vision and investment program.
1
Appendix One:Northeast Rail Network Demographics
StateState
Population(2007)
In-statePopulation
Within 25 Miles(2007)
PercentWithin 25
Miles
Area(sq. mi.)
Area Within 25Miles
Percent ofArea
Within 25Miles
StatewidePopulation
Density(2007)
DensityWithin 25
Miles(2007)
Connecticut 3,556,875 3,379,613 95% 4,977 4,126 83% 715 819
Delaware 880,458 536,016 61% 2,055 465 23% 428 1,154District ofColumbia 591,318 591,318 100% 68 68 100% 8,665 8,665
Maine 1,352,536 684,334 51% 32,162 3,031 9% 42 226
Maryland 5,727,376 5,074,903 89% 9,740 5,880 60% 588 863
Massachusetts 6,530,311 5,852,137 90% 8,173 6,819 83% 799 858
New Hampshire 1,352,812 1,133,474 84% 9,260 4,048 44% 146 280
New Jersey 8,891,611 6,955,559 78% 7,508 3,703 49% 1,184 1,878
New York 19,581,872 17,251,738 88% 48,562 23,281 48% 403 741
Pennsylvania 12,642,856 9,112,150 72% 45,360 19,630 43% 279 464
Rhode Island 1,085,885 1,085,885 100% 1,088 1,088 100% 998 998
Vermont 636,590 560,451 88% 9,603 7,255 76% 66 77
Region Wide 62,830,500 52,217,578 83% 178,556 79,393 44% 352 658

2
StateTotal
Employment(2007)
In-stateEmployment
Within 25 Miles
PercentEmployment
Within 25Miles
StatewideEmployment
Density(Jobs/sq. mi.)
EmploymentDensity
Within 25Miles
DensityRatio
Connecticut 1,688,122 1,572,836 93% 339 381 1.12
Delaware 423,412 283,231 67% 206 609 2.96
District of Columbia 678,119 678,119 100% 9,937 9,937 1.00
Maine 602,321 306,496 51% 18 101 5.40
Maryland 2,547,351 1,899,992 75% 261 323 1.24
Massachusetts 3,234,357 2,911,002 90% 395 426 1.08
New Hampshire 630,204 530,019 84% 68 130 1.92
New Jersey 3,961,341 3,351,111 85% 527 904 1.72
New York 8,554,012 7,230,625 85% 176 310 1.76
Pennsylvania 5,652,547 4,014,767 71% 124 204 1.64
Rhode Island 480,132 480,132 100% 441 441 1.00
Vermont 303,448 273,241 90% 31 37 1.19
Region Wide 28,755,366 23,531,571 82% 161 296 1.84