Efforts to Improve Homeownership Opportunities for Hispanics
110
U.S. Department of Housing and Urban Development Office of Policy Development and Research Efforts to Improve Homeownership Opportunities for Hispanics Case Studies of Three Market Areas
Transcript of Efforts to Improve Homeownership Opportunities for Hispanics
U.S. Department of Housing and Urban Development Office of Policy Development and Research
Efforts to Improve HomeownershipOpportunities for Hispanics
Case Studies of Three Market Areas
Efforts to Improve Homeownership Opportunities for Hispanics:
Case Studies of Three Market Areas
Prepared for U.S. Department of Housing and Urban Development Office of Policy Development and Research
Prepared by Alvaro Cortes Erin Wilson Christopher E. Herbert Pedram Mahdavi
Abt Associates Inc.Cambridge, MA
March 2006

The contents of this report are the views of the contractor and do not necessarily reflect the views or policies of the U.S. Department of Housing and Urban Development or the U.S. Government.
Table of Contents
Executive Summary ............................................................................................................................iii
Chapter One – Introduction ................................................................................................................ 11.1 Overview of National Trends ............................................................................................ 21.2 Site Selection ..................................................................................................................... 41.3 Identifying Key Organizations and Respondents .............................................................. 41.4 Content and Structure of the Case Studies ........................................................................ 5
Chapter Two – Orlando, FL Case Study............................................................................................ 72.1 Hispanics, Homeownership Rates, and Service Providers in Orlando, FL ....................... 72.2 Homeownership Barriers................................................................................................. 192.3 Homeownership Services in Orlando, FL ....................................................................... 222.4 Conclusions ..................................................................................................................... 34
Chapter Three – San Antonio, TX Case Study................................................................................ 373.1 Hispanics, Homeownership Rates, and Service Providers in San Antonio ..................... 373.2 Homeownership Barriers................................................................................................. 483.3 Homeownership Services in San Antonio ....................................................................... 503.4 Conclusions ..................................................................................................................... 61
Chapter Four – Washington DC Case Study................................................................................... 634.1 Hispanics, Homeownership Rates, and Service Providers in Washington DC ............... 634.2 Homeownership Barriers................................................................................................. 754.3 Homeownership Services in Washington DC ................................................................. 784.4 Conclusions ..................................................................................................................... 89
Chapter Five – Conclusion ................................................................................................................ 91
References ........................................................................................................................................... 99
Table of Contents i

Table of Contents ii
Executive Summary
This report is part of a multi-phased research project undertaken by the U.S. Department of Housing and Urban Development to understand better the factors that influence Hispanic homeownership rates and the reasons why Hispanic rates are lower than those of non-Hispanic whites. The research project also focuses on identifying policy approaches that may help close the homeownership gap between Hispanics and non-Hispanic whites. The first phase of the project combined a review of the existing literature with analysis of decennial census data to produce a national picture of Hispanic homeownership rates and gaps, as well as what we know about the causes of these gaps (Cortes, et al., 2006). In addition, the national report also identified existing strategies being implemented around the country to help overcome barriers to Hispanic homeownership.
This report complements the national report by focusing on each of these issues from a local perspective. The findings presented in this report are based on interviews with key organizations located in three metropolitan areas: Orlando (FL), San Antonio (TX), and Washington DC. For each market, the report provides an in-depth analysis of Hispanic homeownership rates and gaps and the efforts to address these gaps by exploring:
• The demographic profile of the Hispanic population;
• Hispanic homeownership rates and gaps in comparison to national trends and to non-Hispanic whites;
• Major barriers to Hispanic homeownership, including lack of information about the homebuying or mortgage qualification process, as well as barriers in the housing and mortgage markets;
• The services offered by providers to improve Hispanics’ access to homeownership opportunities; and
• The scale of, and demand for, homeownership services, as well as approaches to marketing and coordinating services.
The report is based on analysis of data from the decennial census and in-depth interviews that were conducted onsite with staff from a range of service providers, including housing counselors, affordable housing developers, mortgage lenders and loan officers, and real estate agents. Each of these industry representatives provides an important perspective about the barriers confronting Hispanics and about the ability of service providers to address these challenges. Overall, the interviews highlight six main themes.
Hispanic homeownership rates and gaps are shaped by the demographic and socioeconomic characteristics of Hispanics. The three case studies highlight the different barriers faced by the three predominant Hispanic groups represented in these communities: Puerto Ricans, Mexicans, and Central Americans. Puerto Ricans are legal citizens, and their legal status grants them access to mortgage products that are not available to undocumented Hispanics. By contrast, proper documentation among Mexican and Central American immigrants is a problem in both San Antonio and Washington DC.
Executive Summary iii
In Orlando, migration patterns play an important role in understanding homeownership rates and barriers. Hispanics from the North (e.g., Boston and Chicago) and from Miami are moving to Central Florida and these Hispanics generally are better off financially and are able to purchase homes in Central Florida. Census 2000 data suggests that 69 percent of Hispanics in the Orlando metropolitan area were in a different house in 1995, and among these Hispanics, 26 percent came from a different state (more than half of them from the Northeast). These Hispanics are potentially responsible for driving the higher Hispanic homeownership rates in Orlando when compared to those of other metropolitan areas.
Hispanics comprise a large share of the total population in San Antonio (45 percent in 2000), and service providers repeatedly indicate that this explains in part why Hispanic homeownership rates are higher in San Antonio than in most other metropolitan areas. The demand for homeownership services among Hispanics grows as the Hispanic population grows, which, in turn, prompts more service providers to offer targeted services to Hispanics.
Also, the Washington DC case study demonstrates that Hispanic homeownership gaps do not always narrow as household income increases. This finding counters the prevailing association between income and homeownership rates that has been established in the literature. Although Hispanic homeownership rates increase steadily as income levels increase, gaps do not show any pattern of increase or decrease as income increases; rather they fluctuate between 19 percent and 28 percent across all income levels. The fluctuations in gaps in Washington DC may be attributable to the transient professional, diplomatic, and other international representatives that tend to rent for short periods of time and then return to their home country.
In addition to these market-specific phenomenon, the case studies highlight several barriers that are common across all markets. For example, service providers suggest that income, English proficiency, and country of origin are important characteristics that contribute to a Hispanic’s likelihood of becoming a homeowner. A disproportionate share of Hispanic households are low-income, which is related to the fact that a high share of Hispanics work in the service industry. English proficiency among Hispanics is another important factor, because language skills affect their ability to understand the homebuying and mortgage qualification process—e.g., to understand critical documents such as credit reports, tax forms, and mortgage applications. Without this understanding Hispanics are less willing to consider pursuing homeownership opportunities or less likely to successfully complete the homebuying process.
The most commonly identified barriers to homeownership among Hispanics are lack of information about the homebuying and mortgage qualification process, lack of affordable housing, and lack of credit or poor credit histories. Many Hispanics, particularly immigrants, are uninformed about the homebuying process and are unfamiliar with the roles played by different portions of the real estate and finance industries during the process. This lack of knowledge is attributable to their disengagement from mainstream financial institutions and poor English-speaking skills. However, service providers said that this attitude may be changing among younger Hispanics who are more assimilated into the American culture. In addition, some Hispanics harbor misconceptions about the mortgage qualification process and typically overestimate the requirements to qualify for a mortgage—for example, they assume that large downpayments and perfect credit are required to buy a home. These misconceptions discourage many Hispanics from pursuing homeownership opportunities, undermine their confidence in completing the process, and leave them vulnerable to
Executive Summary iv
predatory lending practices. On the other hand, other Hispanics underestimate the mortgage qualification requirements by assuming that anyone with a history of bankruptcies, poor credit, and insufficient savings can qualify for a loan. This underestimation leads some Hispanics to believe that credit and savings are not important factors to becoming a homeowner. According to some service providers, these misconceptions are fostered and reinforced by advertisements from questionable lenders. These Hispanics are susceptible to predatory lending practices.
Service providers consistently cite the lack of affordable housing as a primary barrier to Hispanic homeownership. This lack is associated with rising housing prices combined with stagnant incomes; escalating costs of land, infrastructure, and construction materials that limit opportunities to develop new affordable homes for low-income populations; and the concentration of the affordable housing stock in distressed neighborhoods or in neighborhoods that are predominantly African-American or white. A few service providers report that some Hispanics would rather rent in a predominantly Hispanic neighborhood than become a homeowner in a predominantly African American or white neighborhood, or in some cases, a neighborhood identified with a different Hispanic community. This limits the availability of affordable housing to the extent that Hispanics limit their housing search to a small number of communities with a fraction of the metropolitan area’s affordable housing stock.
Finally, lack of credit or poor credit severely limits the ability of some Hispanics to qualify for mortgage products. Some Hispanics do not believe in using credit to make purchases and may not have a savings or checking account, because of the lack of information, poor financial literacy skills, a general mistrust of the U.S. banking system, and poor English-speaking skills. Interestingly, Hispanics’ financial status may differ between first- and second-generation Hispanic households. First generation households may distrust and avoid financial systems in the United States even after being in the country for several years, while second generation households are more likely to become overly indebted, resulting in poor credit histories.
The housing financing process is made easier by the growing use of flexible mortgage products and downpayment assistance programs, but the efficacy of these financing packages is limited by a community’s housing market characteristics and by the targeting of certain Hispanic households for services. The case studies suggest that there are an increasing number of flexible mortgage products capable of addressing credit and other financial barriers to mortgage financing. Some of these products de-emphasize underwriting guidelines that have traditionally served as barriers to qualifying for a loan (e.g., documenting income and employment), feature low fixed interest rates, and offer second mortgages that can be forgiven over time. A pilot program in the Washington DC area allows applicants to use an Individual Tax Identification Number in lieu of a Social Security Number. In addition, providers are relying on a variety of downpayment assistance programs to help Hispanics overcome the initial costs of becoming a homeowner. These programs are offered by all levels of government and are particularly effective at helping Hispanic clients with insufficient savings or wealth to afford the initial costs associated with homebuying.
However, the impact of these financing packages on overall Hispanic homeownership rates is questionable. The availability of products that use an ITIN in lieu of SSN is very limited, and the amount of downpayment assistance is small relative to the rising costs of housing. Also, because service providers and downpayment assistance program target households earning 50 to 80 percent of area median incomes (AMI), moderate-income households earning 80 to 120 percent of AMI are ineligible for services or financial support. These households are nearly ready for homeownership
Executive Summary v
and, although some may need services similar to their low-income counterparts, they are largely overlooked and left to their own devices.
The majority of Hispanic clients need most, if not all, of the available services, but clients are typically required to cobble these services together from multiple providers in order to overcome the barriers to homeownership. Service providers offer a wide-range of services to help Hispanics overcome barriers to homeownership, including: homebuyer education counseling, financial literacy classes, housing search assistance, development of affordable housing, assistance with the mortgage qualification process, access to mortgage products, wealth building opportunities, immigration services, downpayment assistance, guidance through the closing process, post-purchase counseling, and referrals to other service providers. Although a few providers have the capacity to function as a “one-stop-shop” for services by providing many of these services in-house, service providers typically offer only some of these services as part of their formal service package and routinely make referrals to other service providers to supplement their services. These breaks in the chain of service provision may result in incomplete homebuying processes if some Hispanic households fail to follow through with the referrals.
Housing counseling agencies offer the most comprehensive package of services and they use three service delivery models: group seminars, one-on-one sessions, or informal counseling. Most clients receive services through all three service models as they progress through the agency’s program. Clients start by attending group seminars, which are typically designed to provide a broad, introductory overview of the homebuying and mortgage qualification process in a relatively short amount of time. The client then schedules one-on-one counseling sessions. The one-on-one counseling sessions typically focus on the financial barriers to homeownership and include a thorough review of each client’s credit report, the development of a budget and financial action plan, and an assessment of the client’s ability to qualify for a mortgage. Clients continue to receive one-on-one counseling until they are ready for homeownership. Informal counseling includes the ad hoc guidance that is provided along with the formal provision of services throughout the homebuying process.
Service providers operate within their preferred network of providers; service coordination is fragmented across metropolitan areas. Despite a few efforts to better coordinate services metropolitan-area-wide, homeownership agencies in the study rely almost exclusively on their trusted network of referral organizations to supplement their services. That is, the network of organizations used by one agency is likely to be different from the network of organizations used by another agency within the same metropolitan area. These networks are often particular to each agency and tend to be small (3 to 6 partners). These networks are developed and maintained based on trust and past experience. The agency-specific networks also tend to be highly coordinated, comprehensive, and based on long-standing relationships. In addition, the network of trusted partners has increasingly expanded to include other types of organizations that are not part of the housing and mortgage market industry, e.g., churches or neighborhood organizations.
This collection of agency-specific networks suggests that service coordination is fragmented across metropolitan areas. Agencies will only use referral organizations that are part of their network— mostly because they do not trust other organizations with their clients—and only a few large organizations are found on multiple agency-specific networks. In addition, some agencies in the study indicate that the Hispanic community lacks a centralized leadership that can serve as a fulcrum for better service coordination metropolitan-wide.
Executive Summary vi
Interviewed organizations report that there is strong demand for homeownership services among Hispanics, but also that their capacity to serve these clients is increasingly strained. Demand for homeownership services is large and expected to grow as the Hispanic population increases in each of these communities. In all three communities we studied, the potential pool of Hispanic renters that could benefit from these services is large. Most service providers interviewed for the case studies serve Hispanics earning between 50 to 80 percent of AMI, which typically represents about 25 percent of all Hispanic renters in these communities. A similar proportion of Hispanic renters in these communities earn 80 to 120 percent of AMI. These renters often do not qualify for downpayment assistance programs and may not qualify for services from some of the service providers interviewed in these communities. Thus, there is a large group of Hispanic renters that are in a good position to purchase a home but may not receive services or financial support they would need to complete the process.
Nearly all service providers interviewed currently are operating at full capacity, and most do not have additional resources to add staff or serve new clients. Service providers were unable to quantify the precise demand for services, but offered examples of how their marketing activities, although limited, resulted in an overwhelming request for their services. Few providers engage in systematic marketing of their services, but most conduct some form of marketing through grassroots community engagements or housing fairs. According to some housing counseling agencies, their agency confronts a “marketing gap” because, unlike realtors and lenders, housing counseling agencies are not well branded in the industry.
Overall, these case studies highlight both the common barriers to Hispanic homeownership and the important differences across the U.S. housing markets in which Hispanics live. Service providers in each of the communities studied are working very hard to open homeownership opportunities to Hispanics, and overall, homeownership assistance is available to address most barriers. However, a few key concerns remain. It is unclear whether the scale of these efforts will continue to meet the demand for these services; service effectiveness may be undermined by the lack of coordination across service providers and across stages of the homebuying process; and the lack of any real attention to households in the 80 to 120 income group (or higher) overlooks a large segment of Hispanics who may need help. These concerns may suggest that government’s efforts to promote homeownership among Hispanics (and other low-income households) should be mindful of each community’s service capacity and degree of service coordination, and also account for service gaps in either the stages of the homebuying process or in the types of income groups served.
Executive Summary vii

Executive Summary viii
Chapter One Introduction
The report is part of a multi-phased research project undertaken by the U.S. Department of Housing and Urban Development to better understand the reasons why Hispanic homeownership rates are much lower than those of non-Hispanic whites and to identify policy approaches that may be most effective in closing the gap between the Hispanic and white rates. The first phase of the project combined a thorough review of the existing literature with analysis of data from the decennial census to produce a national picture of trends in Hispanic homeownership rates and gaps and what we know about the causes of these gaps (Cortes, et al., 2006). In addition, the national report also identified existing strategies being implemented around the country to help overcome barriers to Hispanic homeownership.
This report is intended to complement the national report by focusing on each of these issues from a local perspective. The findings presented in this report are based on interviews with key organizations located in three metropolitan areas: Orlando (FL), San Antonio (TX), and Washington DC. For each market, the report provides an in-depth analysis of Hispanic homeownership rates and gaps by exploring:
• The demographic profile of the Hispanic population;
• Hispanic homeownership rates and gaps in comparison to national trends and to non-Hispanic whites;
• Major barriers to Hispanic homeownership, including lack of information about the homebuying or mortgage qualification process, as well as barriers in the housing and mortgage markets;
• The range of services offered by local providers to improve Hispanics’ access to homeownership opportunities; and
• The scale of, and demand for, homeownership services, as well as approaches to marketing and coordinating services.
The organizations selected in these case studies play critical roles throughout the homebuying process and include housing counseling agencies, affordable housing development organizations, mortgage companies, and real estate agencies. Also, each of these service providers offer an array of services that help promote homeownership opportunities among Hispanics. Thus, this report presents a comprehensive look at Hispanic homeownership rates and gaps within three markets.
The rest of this introductory chapter places the three case studies within a larger context by providing a general overview of national trends. The introductory chapter also provides a summary of how the three metropolitan areas were selected, and how key organizations within each metropolitan area were identified.
Chapter 1. Introduction 1
1.1 Overview of National Trends
Using decennial census data and a review of the existing literature, Cortes et al. (2006) present a profile of Hispanics in the U.S. and analyze how national homeownership rates and gaps vary by demographic and socioeconomic characteristics. By 2000, Hispanic homeownership rates (45.6 percent) lagged far behind those of non-Hispanic whites (72.5 percent), and were somewhat lower than those of other racial minorities, including non-Hispanic Blacks (46.6 percent), and Asian or Pacific Islanders (53.1 percent). Hispanic households had the largest gap in homeownership rates among all minority groups.
The review by Cortes, et al. also finds that age, income, level of education, net worth, household type, nativity, country of origin, degree of social integration (citizenship status and years in the U.S.), and place of residence all were important factors that contributed to the gap in homeownership rates between Hispanics and non-Hispanic whites. The data presented demonstrate that Hispanic homeownership rates increase and gaps decrease with age, income, wealth, and educational status. Marriage is also a strong determinant of homeownership, with married couples displaying much higher rates of homeownership than other household types. Among the immigrant-related characteristics, country of origin, citizenship status, and years in the U.S. are found to be important correlates of Hispanic homeownership. Homeownership rates increase with citizenship and length of stay in the U.S., although homeownership rates of more recent immigrant groups have not risen as much over time as the rates of earlier immigrant cohorts. Lastly, Cortes et al. suggest that the concentration of Hispanics in high cost housing markets also contributes to the national gap in homeownership rates between Hispanics and whites.
As Cortes et al. describe, each of these factors has clear affects on Hispanic homeownership rates and gaps, but determining which of the factors affect rates and gaps more heavily than others is challenging. There is a growing literature that uses statistical techniques to control for this broad range of contributing factors to identify the relative importance of each. Among the first studies to examine Hispanic homeownership rates, Wachter and Megbolugbe (1992) conclude that income is the most important factor in explaining the Hispanic-white gap in homeownership rates, followed by martial status and gender. Masnick (1998) employs a detailed set of cross tabulations and concludes that immigrant status, younger age structures, and higher fertility rates explain much of the Hispanic homeownership gap with whites. Still others emphasize the importance of the distribution of Hispanics in relatively high-cost metropolitan areas (Coulson 1999) or the concentration of Hispanics in ethnic enclaves (Krivo 1995) rather than personal characteristics.
Overall, these statistical models can explain most of the gap between Hispanics and non-Hispanic whites, but a large part of the gap remains unexplained. In part, the unexplained gap reflects the fact that these models inevitably cannot capture all relevant variables, most notably individuals’ credit history and wealth. Other factors that are believed to affect Hispanic homeownership propensities that are not easily quantified in statistical models include a lack of information about the homebuying and mortgage qualification process, limitations on access to housing that is affordable, of good quality, and in desirable neighborhoods, and challenges in meeting mortgage market underwriting requirements. Of course, a final factor that may contribute to the observed differences in homeownership rates for Hispanics that these models cannot capture is discriminatory treatment in housing and mortgage markets. Cortes et al. (2006) provide a summary of the literature on this topic as well.
Chapter 1. Introduction 2
Among potential Hispanic homebuyers, the decision to pursue homeownership is influenced both by their faith in homeownership as a desirable investment and a source of personal satisfaction, and also by their level of understanding of the homebuying process. As past research demonstrates, Hispanics have extraordinary faith in homeownership, but they are less likely to have accurate information about the homeownership process compared to other populations (Cortes, et al., 2006; Lee, Tornatzky, and Torres, 2004; Fannie Mae, 2003). These studies suggest that the level of understanding about the homebuying process, including the importance of good personal credit and the steps entailed in the mortgage qualification process is considerably lower among Hispanics, especially Spanish-speaking Hispanics, than in the general population. As a result, many Hispanics are dissuaded from considering homeownership and are less confident about completing the homebuying process.
A lack of decent and affordable housing in appealing neighborhoods is particularly important to Hispanics. Many Hispanics are concentrated in gateway cities that tend to be high cost housing markets, yet Cortes et al. (2006) demonstrate that Hispanic incomes lag far behind the national median household income. In addition, many Hispanic households are concentrated in ethnic enclaves (or barrios), which, given the rapid growth in the Hispanic population, may restrict available housing options. Overall, these factors can chill interest in pursuing homeownership both by making the housing search more difficult and by putting homeownership out of reach for many Hispanic households.
The literature also suggests that poor credit histories, low wealth and income, and lack of proper documentation all make it difficult to qualify for mortgage financing and thus represent major barriers to Hispanic homeownership. Poor credit can depress homeownership rates by delaying access to homeownership opportunities through more extensive lender reviews or by pushing Latinos into higher cost subprime mortgages that make homeownership unaffordable. Hispanics also are dissuaded from pursuing homeownership or prevented from owning a home by the large proportion of households with extremely low (and even negative) net worth, which is associated with low or seasonal incomes and by large remittance flows to relatives living in Latin America or the Caribbean. Lenders justifiably reject applicants that have very little (or no) capacity to repay the loan. The immigration status of some Hispanic households further deters Hispanics from obtaining a mortgage. Undocumented immigrants cannot obtain valid Social Security Numbers (SSN), which, in turn, prevents them from applying for most mortgage loans as well as for federally funded homeownership assistance programs.
One important observation that emerges from the national review of Hispanic homeownership rates is that the U.S. Latino population is extremely diverse. Hispanics have immigrated to the U.S. from a broad range of countries, with a correspondingly broad range of cultural and economic legacies. Hispanics also differ greatly in the length of time they have lived in the U.S. In some markets, a large share of Hispanics are recent immigrants, while in other areas Hispanics have lived in the U.S. for many generations. Given the diversity of the Hispanic population across U.S. market areas, reviews of this issue at the national level, such as Cortes et al. (2006), may not characterize accurately the key the challenges to increasing Hispanic homeownership in different market contexts. The purpose of this study is to focus specifically on a few market areas chosen to reflect key aspects of the diversity of the U.S. Hispanic population in order to explore how barriers to Hispanic homeownership vary at the metropolitan level. The next section describes how and why the market areas selected for this study were chosen.
Chapter 1. Introduction 3
1.2 Site Selection
The primary factors that influenced the selection of sites were:
• The distribution of Hispanics by country of origin and immigrant status;
• The level of housing prices; and
• The size of the Hispanic homeownership gap.
In selecting candidate markets for the case studies, we also chose to avoid the largest metropolitan areas, as it was felt it would be too difficult to obtain a fairly complete understanding of efforts aimed at increasing Hispanic homeownership in these markets. Once a preliminary group of sites was selected, short interviews were conducted with national researchers and industry experts who work on Hispanic homeownership issues. The national experts included representatives from national intermediaries for community-based organizations (e.g., Neighborhoodworks and the Enterprise Foundation), Hispanic real estate professional groups (e.g., the National Council of La Raza), and foundations providing support for efforts to promote Hispanic homeownership (e.g., the Ford Foundation). The purpose of the interviews was to obtain input on the proposed sites and to review the main barriers to Hispanic homeownership that were discovered in the literature review and data analysis. Researchers also solicited contacts for local programs that successfully move Hispanics into homeownership in the selected communities.
Orlando, San Antonio, and Washington, DC were ultimately selected because the sites offered considerable variation across several key dimensions among Hispanic households, especially country of origin, share of citizens and non-citizens, and proportion of total population. These sites also included a mix of high-priced and more affordable housing markets and provided variation in the size of the Hispanic homeownership gap. The Hispanic population in Orlando is predominantly Puerto Rican, the Hispanic homeownership rate is higher than the national average, and the Hispanic homeownership gap is lower. Although Orlando remains more affordable than Washington DC, the median house price has increased over the last few years. The Washington DC case study presents a picture of Hispanic homeownership in a high-cost housing market with a large proportion of Central American, immigrant households. Hispanic homeownership rates in the Washington area are slightly below the national average, and the gap is larger. In San Antonio, the Hispanic homeownership rate is high compared to the national average, the gap is lower, and the housing market is relatively affordable. In addition, the Hispanic population consists of a very large proportion of Mexicans and other Hispanics who are natives and U.S. citizens.
After selecting the three sites for the case studies, it was important to identify a broad range of organizations within each site to participate in the interviews.
1.3 Identifying Key Organizations and Respondents
Several approaches were used to identify key organizations and interview respondents within each site. First, a sample of HUD-approved housing counseling agencies, local government homeownership program offices, and local contacts provided by the national homeownership and Hispanic organizations (e.g., the National Council of La Raza) were contacted. The purpose of these contacts was to identify a group of local homeownership counseling programs and community
Chapter 1. Introduction 4
development organizations that predominantly assist Latinos and are experienced with Hispanic homeownership issues. Researchers also wanted to identify different types of service providers, including housing counseling agencies, housing developers, realtors, lenders, and other relevant financial or professional service providers. It was also important to identify service providers that operate in different geographic locations throughout the metropolitan area. In addition to preliminary discussions with local informants, an Internet search was conducted to identify additional organizations involved in promoting Hispanic homeownership in the housing market areas selected for the case studies.
Based this information, representatives from key agencies in each site were contacted to schedule one- to two-hour onsite interviews for the case studies. Interviews were completed with representatives from three to four organizations in each market. An important component of each interview was to identify partners that the agency worked with to provide homeownership services to their clients. Respondents provided contact information for these key partners and researchers solicited telephone interviews with these organizations as necessary. This approach provided a more complete picture of the network of service providers that help expand homeownership opportunities to Hispanics in each metropolitan area.
1.4 Content and Structure of the Case Studies
Chapters Two through Four of this report present case studies for each of the selected markets. Each case study consists of three sections. First, the case studies present a demographic profile of the Hispanic population in the metropolitan area and a picture of Hispanic homeownership rates and gaps in comparison to national trends and to non-Hispanic whites in the metropolitan region. The section also provides an overview of each service provider interviewed for the case study. Second, the case studies review the key barriers to homeownership that were identified by interview participants, including lack of information about the homebuying or mortgage qualification process and barriers in the local housing market and mortgage market. Lastly, a description of the various services offered by these organizations is provided. For each organization, the section describes:
• The nature of services and service delivery models;
• The scale of services;
• The types of partnerships that are forged to supplement services;
• Marketing activities; and
• The demand for homeownership services.
Assessing the scale and demand for services is complicated. A homeownership program can be measured by the total number of clients served monthly or annually, for example, but this measure is meaningful only when coupled with an assessment of the total demand for services. The scale of services in relation to the demand for services provides a measure of the service gap, or the unmet needs for homeownership services in a community. The unmet need for services may suggest how many households could become new homeowners if service were expanded. Service providers were asked to gauge the demand for services in their community by estimating the percentage of Hispanic renters that would be interested in homeownership and, within that segment, the percentage that would be eligible for services and ready or able to be prepared for homeownership.
Chapter 1. Introduction 5

Chapter Two explores Hispanic homeownership in Orlando; Chapter Three in San Antonio; and Chapter Four in Washington, DC. The final chapter presents the conclusions drawn from a cross-site analysis.
Chapter 1. Introduction 6
Chapter Two Orlando, FL Case Study
This chapter reviews some of the main efforts to improving homeownership opportunities among Hispanic households in the Orlando metropolitan area. The chapter proceeds in four sections. The following section describes the demographic characteristics of Hispanics in the Orlando metropolitan area and presents their homeownership rates and gaps. The section also provides an overview of the service providers interviewed for the case study. Section 2 reviews the key barriers to homeownership that were identified by interview participants, and Section 3 describes the services offered by the interviewed organizations. The concluding section summarizes the main themes brought out by the Orlando case study.
2.1 Hispanics, Homeownership Rates, and Service Providers in Orlando, FL
Hispanic Profile
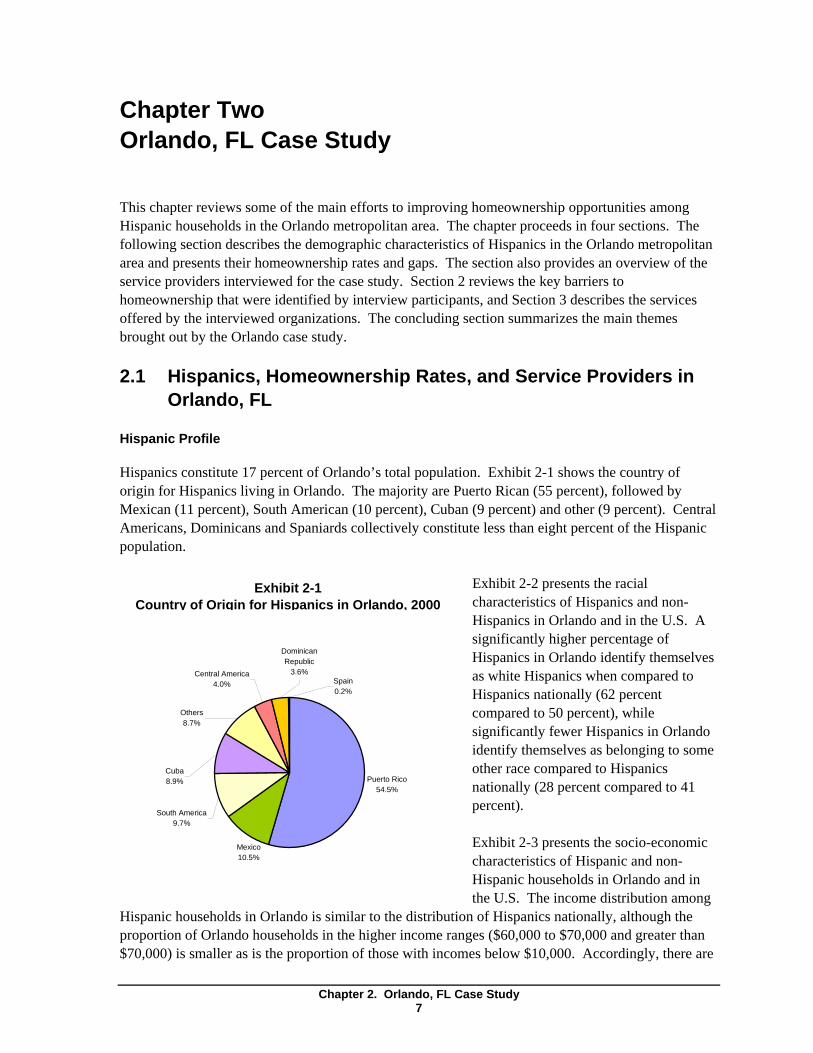
Hispanics constitute 17 percent of Orlando’s total population. Exhibit 2-1 shows the country of origin for Hispanics living in Orlando. The majority are Puerto Rican (55 percent), followed by Mexican (11 percent), South American (10 percent), Cuban (9 percent) and other (9 percent). Central Americans, Dominicans and Spaniards collectively constitute less than eight percent of the Hispanic population.
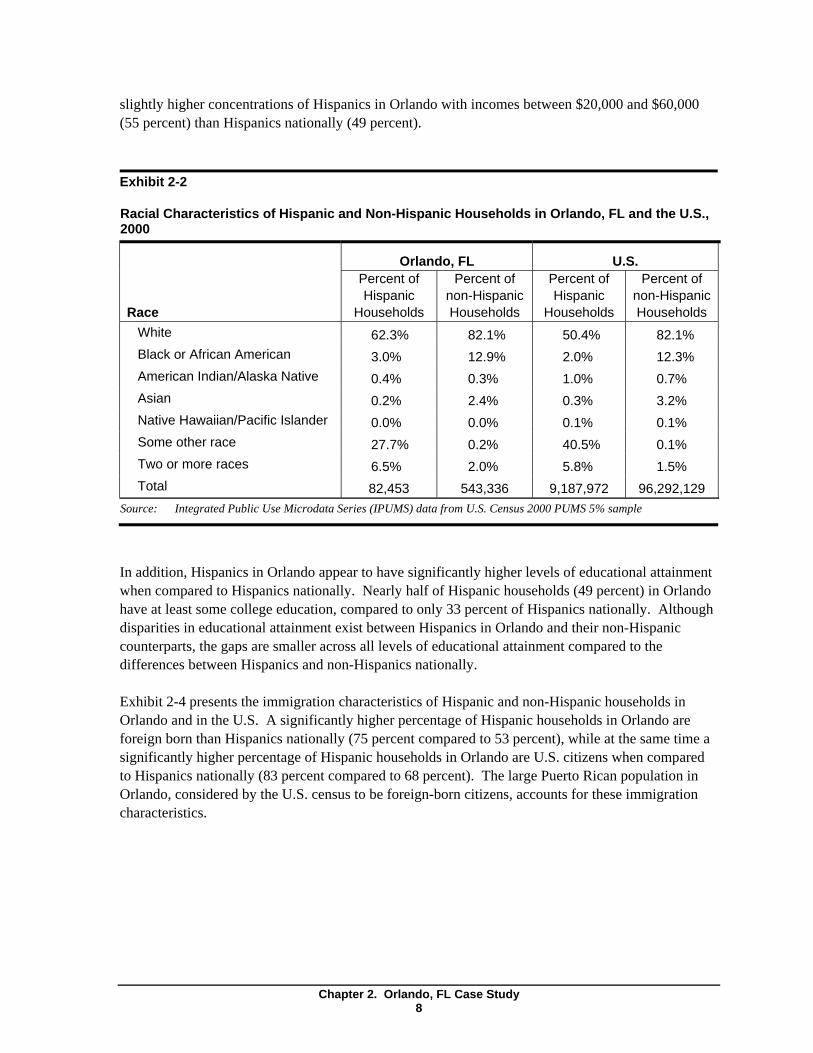
Exhibit 2-1 Exhibit 2-2 presents the racial Country of Origin for Hispanics in Orlando, 2000 characteristics of Hispanics and non-
Hispanics in Orlando and in the U.S. A significantly higher percentage of
Dominican Republic Hispanics in Orlando identify themselves
Central America
Mexico 10.5%
3.6% Spain as white Hispanics when compared to
4.0% 0.2% Hispanics nationally (62 percent
Others compared to 50 percent), while 8.7%
significantly fewer Hispanics in Orlando identify themselves as belonging to some other race compared to Hispanics Cuba
Puerto Rico 54.5% nationally (28 percent compared to 41
percent).
8.9%
South America9.7%
Exhibit 2-3 presents the socio-economic characteristics of Hispanic and non-Hispanic households in Orlando and in the U.S. The income distribution among
Hispanic households in Orlando is similar to the distribution of Hispanics nationally, although the proportion of Orlando households in the higher income ranges ($60,000 to $70,000 and greater than $70,000) is smaller as is the proportion of those with incomes below $10,000. Accordingly, there are
Chapter 2. Orlando, FL Case Study 7
2000
slightly higher concentrations of Hispanics in Orlando with incomes between $20,000 and $60,000 (55 percent) than Hispanics nationally (49 percent).
Exhibit 2-2
Racial Characteristics of Hispanic and Non-Hispanic Households in Orlando, FL and the U.S.,
Race White Black or African American American Indian/Alaska Native Asian Native Hawaiian/Pacific Islander Some other race Two or more races Total
Orlando, FL Percent of Hispanic
Households
Percent of non-Hispanic Households
62.3% 82.1% 3.0% 12.9% 0.4% 0.3% 0.2% 2.4% 0.0% 0.0% 27.7% 0.2% 6.5% 2.0% 82,453 543,336
U.S. Percent of Hispanic
Households
Percent of non-Hispanic Households
50.4% 82.1% 2.0% 12.3% 1.0% 0.7% 0.3% 3.2% 0.1% 0.1% 40.5% 0.1% 5.8% 1.5%
9,187,972 96,292,129 Source: Integrated Public Use Microdata Series (IPUMS) data from U.S. Census 2000 PUMS 5% sample
In addition, Hispanics in Orlando appear to have significantly higher levels of educational attainment when compared to Hispanics nationally. Nearly half of Hispanic households (49 percent) in Orlando have at least some college education, compared to only 33 percent of Hispanics nationally. Although disparities in educational attainment exist between Hispanics in Orlando and their non-Hispanic counterparts, the gaps are smaller across all levels of educational attainment compared to the differences between Hispanics and non-Hispanics nationally.
Exhibit 2-4 presents the immigration characteristics of Hispanic and non-Hispanic households in Orlando and in the U.S. A significantly higher percentage of Hispanic households in Orlando are foreign born than Hispanics nationally (75 percent compared to 53 percent), while at the same time a significantly higher percentage of Hispanic households in Orlando are U.S. citizens when compared to Hispanics nationally (83 percent compared to 68 percent). The large Puerto Rican population in Orlando, considered by the U.S. census to be foreign-born citizens, accounts for these immigration characteristics.
Chapter 2. Orlando, FL Case Study 8
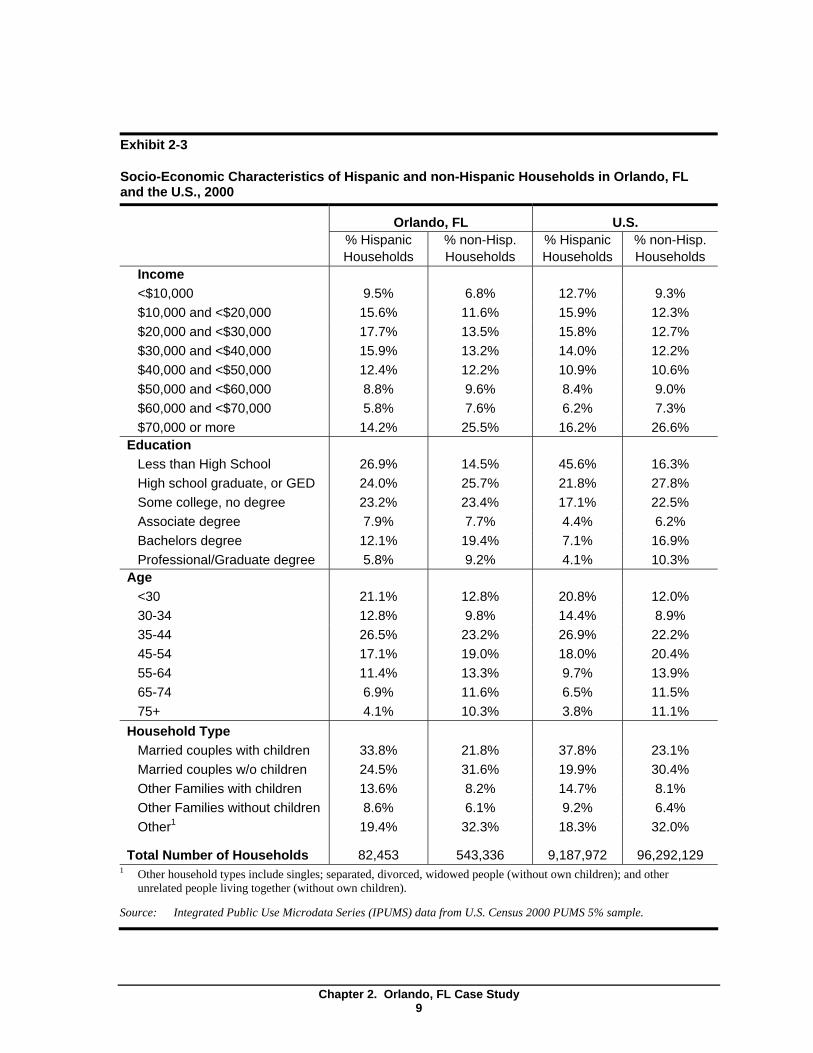
Exhibit 2-3
Socio-Economic Characteristics of Hispanic and non-Hispanic Households in Orlando, FL and the U.S., 2000
Orlando, FL U.S. % Hispanic Households
% non-Hisp. Households
% Hispanic Households
% non-Hisp. Households
Income <$10,000 $10,000 and <$20,000 $20,000 and <$30,000 $30,000 and <$40,000 $40,000 and <$50,000 $50,000 and <$60,000 $60,000 and <$70,000 $70,000 or more
9.5% 15.6%17.7%15.9%12.4%8.8%5.8%14.2%
6.8% 11.6% 13.5% 13.2% 12.2% 9.6% 7.6%
25.5%
12.7% 15.9% 15.8% 14.0% 10.9% 8.4% 6.2% 16.2%
9.3% 12.3% 12.7% 12.2% 10.6% 9.0% 7.3%
26.6% Education
Less than High School High school graduate, or GED Some college, no degree Associate degree Bachelors degree Professional/Graduate degree
26.9% 24.0% 23.2% 7.9%12.1%5.8%
14.5% 25.7% 23.4% 7.7%
19.4% 9.2%
45.6% 21.8% 17.1% 4.4% 7.1% 4.1%
16.3% 27.8% 22.5% 6.2%
16.9% 10.3%
Age <30 30-3435-4445-5455-6465-7475+
21.1% 12.8% 26.5% 17.1% 11.4% 6.9% 4.1%
12.8% 9.8%
23.2% 19.0% 13.3% 11.6% 10.3%
20.8% 14.4% 26.9% 18.0% 9.7% 6.5% 3.8%
12.0% 8.9%
22.2% 20.4% 13.9% 11.5% 11.1%
Household Type Married couples with children Married couples w/o children Other Families with children Other Families without children Other1
Total Number of Households
33.8% 24.5% 13.6% 8.6% 19.4%
82,453
21.8% 31.6% 8.2% 6.1%
32.3%
543,336
37.8% 19.9% 14.7% 9.2% 18.3%
9,187,972
23.1% 30.4% 8.1% 6.4%
32.0%
96,292,129 Other household types include singles; separated, divorced, widowed people (without own children); and other unrelated people living together (without own children).
Source: Integrated Public Use Microdata Series (IPUMS) data from U.S. Census 2000 PUMS 5% sample.
Chapter 2. Orlando, FL Case Study 9
1
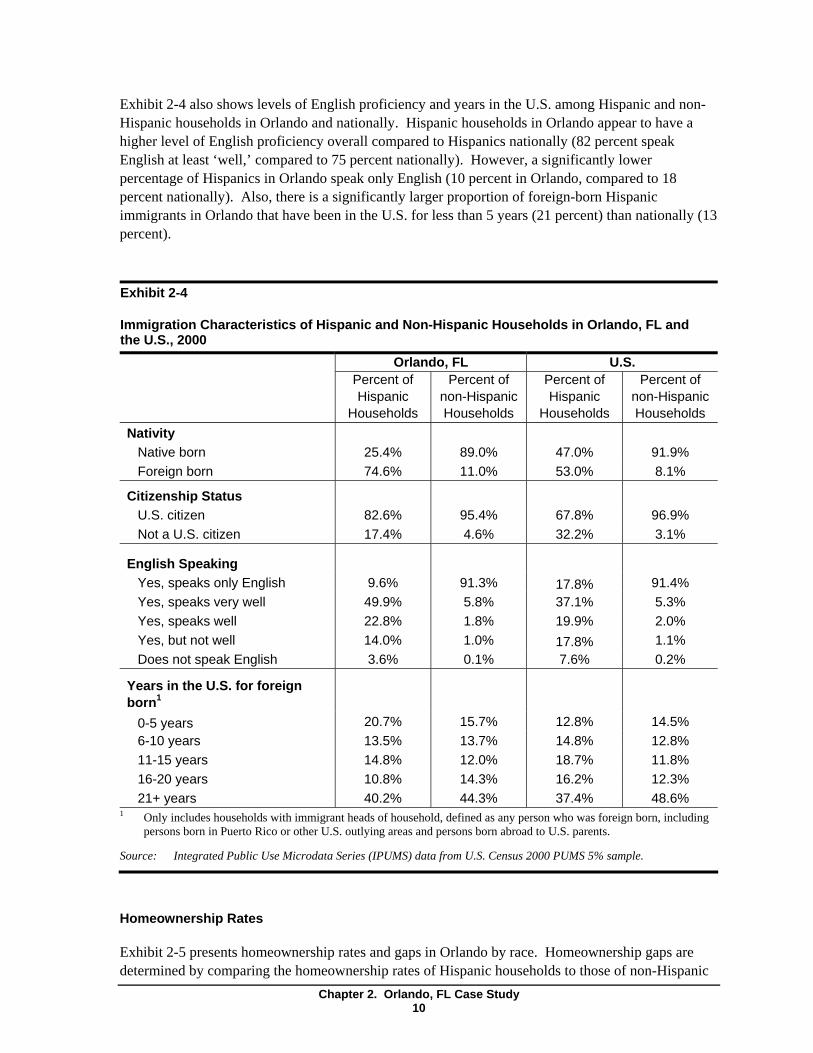
Exhibit 2-4 also shows levels of English proficiency and years in the U.S. among Hispanic and non-Hispanic households in Orlando and nationally. Hispanic households in Orlando appear to have a higher level of English proficiency overall compared to Hispanics nationally (82 percent speak English at least ‘well,’ compared to 75 percent nationally). However, a significantly lower percentage of Hispanics in Orlando speak only English (10 percent in Orlando, compared to 18 percent nationally). Also, there is a significantly larger proportion of foreign-born Hispanic immigrants in Orlando that have been in the U.S. for less than 5 years (21 percent) than nationally (13 percent).
Exhibit 2-4
Immigration Characteristics of Hispanic and Non-Hispanic Households in Orlando, FL and the U.S., 2000 Orlando, FL U.S.
Percent of Hispanic
Households
Percent of non-Hispanic Households
Percent of Hispanic
Households
Percent of non-Hispanic Households
Nativity Native born Foreign born
25.4% 74.6%
89.0% 11.0%
47.0% 53.0%
91.9% 8.1%
Citizenship Status U.S. citizen Not a U.S. citizen
82.6% 17.4%
95.4% 4.6%
67.8% 32.2%
96.9% 3.1%
English Speaking Yes, speaks only English Yes, speaks very well Yes, speaks well Yes, but not well Does not speak English
9.6% 49.9% 22.8%14.0% 3.6%
91.3% 5.8% 1.8% 1.0% 0.1%
17.8% 37.1% 19.9% 17.8% 7.6%
91.4% 5.3% 2.0% 1.1% 0.2%
Years in the U.S. for foreign born1
0-5 years 6-10 years 11-15 years 16-20 years 21+ years
20.7% 13.5% 14.8% 10.8% 40.2%
15.7% 13.7% 12.0% 14.3% 44.3%
12.8% 14.8% 18.7% 16.2% 37.4%
14.5% 12.8% 11.8% 12.3% 48.6%
Only includes households with immigrant heads of household, defined as any person who was foreign born, including persons born in Puerto Rico or other U.S. outlying areas and persons born abroad to U.S. parents.
Source: Integrated Public Use Microdata Series (IPUMS) data from U.S. Census 2000 PUMS 5% sample.
Homeownership Rates
Exhibit 2-5 presents homeownership rates and gaps in Orlando by race. Homeownership gaps are determined by comparing the homeownership rates of Hispanic households to those of non-Hispanic
Chapter 2. Orlando, FL Case Study 10
1
1
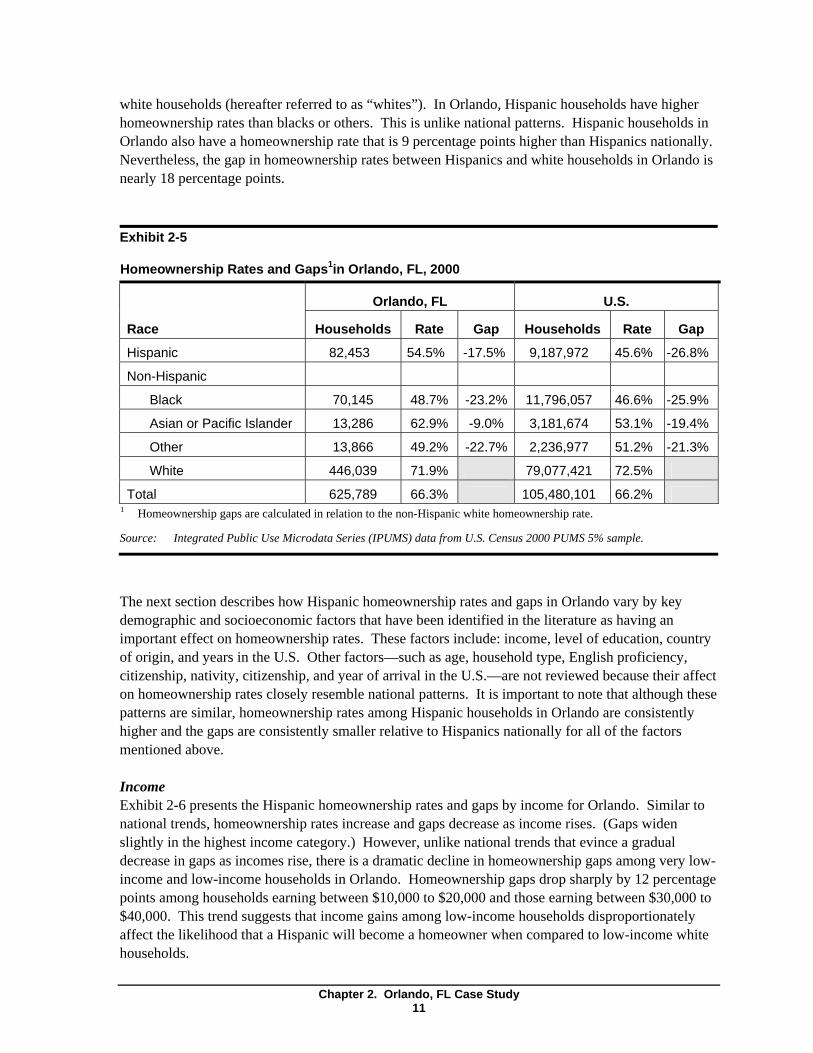
white households (hereafter referred to as “whites”). In Orlando, Hispanic households have higher homeownership rates than blacks or others. This is unlike national patterns. Hispanic households in Orlando also have a homeownership rate that is 9 percentage points higher than Hispanics nationally. Nevertheless, the gap in homeownership rates between Hispanics and white households in Orlando is nearly 18 percentage points.
Exhibit 2-5
Homeownership Rates and Gaps1in Orlando, FL, 2000
Race
Hispanic
Non-Hispanic
Black
Asian or Pacific Islander
Other
White
Total
Orlando, FL U.S.
Households Rate Gap Households Rate Gap
82,453 54.5% -17.5% 9,187,972 45.6% -26.8%
70,145 48.7% -23.2% 11,796,057 46.6% -25.9%
13,286 62.9% -9.0% 3,181,674 53.1% -19.4%
13,866 49.2% -22.7% 2,236,977 51.2% -21.3%
446,039 71.9% 79,077,421 72.5%
625,789 66.3% 105,480,101 66.2% Homeownership gaps are calculated in relation to the non-Hispanic white homeownership rate.
Source: Integrated Public Use Microdata Series (IPUMS) data from U.S. Census 2000 PUMS 5% sample.
The next section describes how Hispanic homeownership rates and gaps in Orlando vary by key demographic and socioeconomic factors that have been identified in the literature as having an important effect on homeownership rates. These factors include: income, level of education, country of origin, and years in the U.S. Other factors—such as age, household type, English proficiency, citizenship, nativity, citizenship, and year of arrival in the U.S.—are not reviewed because their affect on homeownership rates closely resemble national patterns. It is important to note that although these patterns are similar, homeownership rates among Hispanic households in Orlando are consistently higher and the gaps are consistently smaller relative to Hispanics nationally for all of the factors mentioned above.
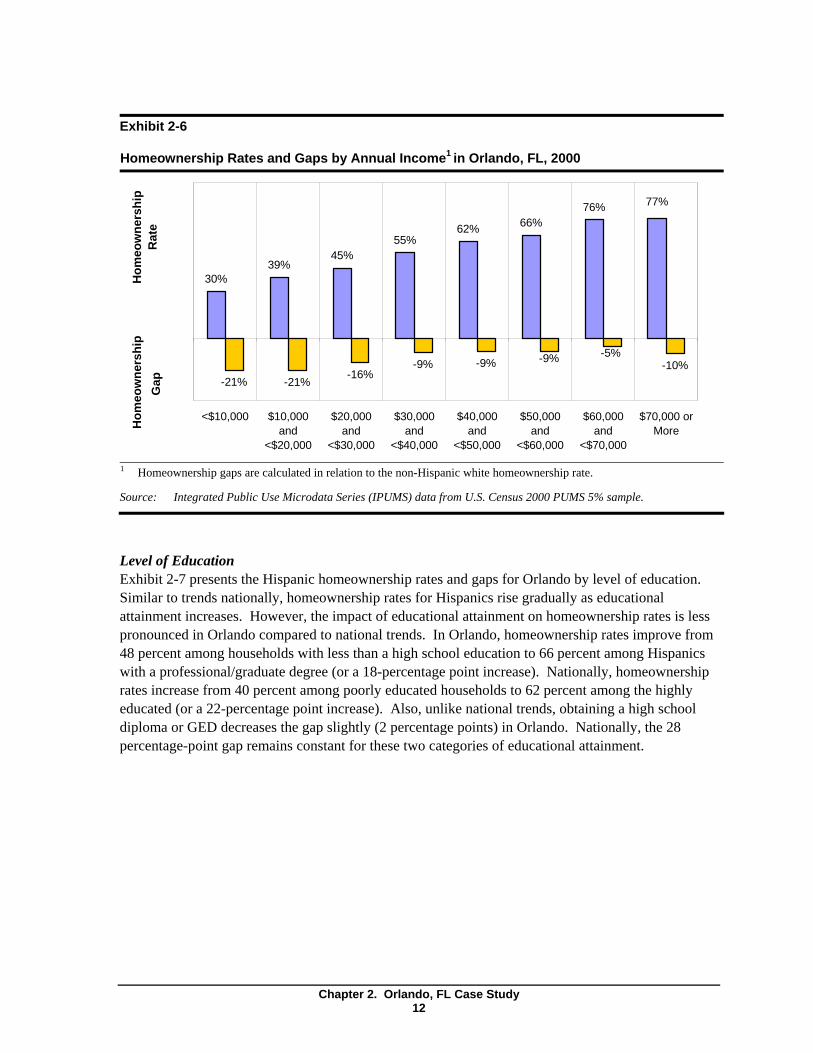
Income Exhibit 2-6 presents the Hispanic homeownership rates and gaps by income for Orlando. Similar to national trends, homeownership rates increase and gaps decrease as income rises. (Gaps widen slightly in the highest income category.) However, unlike national trends that evince a gradual decrease in gaps as incomes rise, there is a dramatic decline in homeownership gaps among very low-income and low-income households in Orlando. Homeownership gaps drop sharply by 12 percentage points among households earning between $10,000 to $20,000 and those earning between $30,000 to $40,000. This trend suggests that income gains among low-income households disproportionately affect the likelihood that a Hispanic will become a homeowner when compared to low-income white households.
Chapter 2. Orlando, FL Case Study 11
1
Exhibit 2-6
Homeownership Rates and Gaps by Annual Income1 in Orlando, FL, 2000 H
omeo
wne
rshi
p R
ate
Hom
eow
ners
hip
Gap
30% 39%
45% 55%
62% 66% 76%
-21% -21% -16%
-9% -9% -10%
77%
-9% -5%
<$10,000 $10,000 $20,000 $30,000 $40,000 $50,000 $60,000 $70,000 or and and and and and and More
<$20,000 <$30,000 <$40,000 <$50,000 <$60,000 <$70,000
Homeownership gaps are calculated in relation to the non-Hispanic white homeownership rate.
Source: Integrated Public Use Microdata Series (IPUMS) data from U.S. Census 2000 PUMS 5% sample.
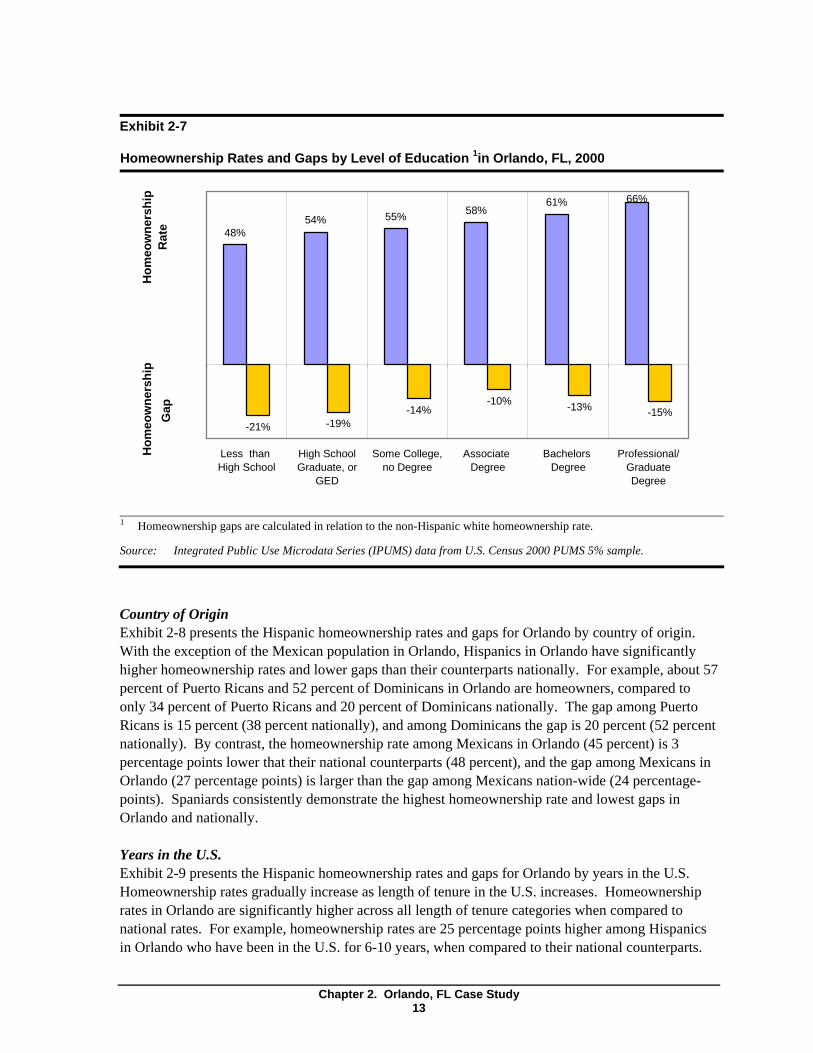
Level of Education Exhibit 2-7 presents the Hispanic homeownership rates and gaps for Orlando by level of education. Similar to trends nationally, homeownership rates for Hispanics rise gradually as educational attainment increases. However, the impact of educational attainment on homeownership rates is less pronounced in Orlando compared to national trends. In Orlando, homeownership rates improve from 48 percent among households with less than a high school education to 66 percent among Hispanics with a professional/graduate degree (or a 18-percentage point increase). Nationally, homeownership rates increase from 40 percent among poorly educated households to 62 percent among the highly educated (or a 22-percentage point increase). Also, unlike national trends, obtaining a high school diploma or GED decreases the gap slightly (2 percentage points) in Orlando. Nationally, the 28 percentage-point gap remains constant for these two categories of educational attainment.
Chapter 2. Orlando, FL Case Study 12
1
Exhibit 2-7
Homeownership Rates and Gaps by Level of Education 1in Orlando, FL, 2000 H
omeo
wne
rshi
p R
ate
Hom
eow
ners
hip
Gap
48% 54% 55% 58%
61%
-21% -19% -14%
-10% -13% -15%
66%
Less than High School Some College, Associate Bachelors Professional/ High School Graduate, or no Degree Degree Degree Graduate
GED Degree
Homeownership gaps are calculated in relation to the non-Hispanic white homeownership rate.
Source: Integrated Public Use Microdata Series (IPUMS) data from U.S. Census 2000 PUMS 5% sample.
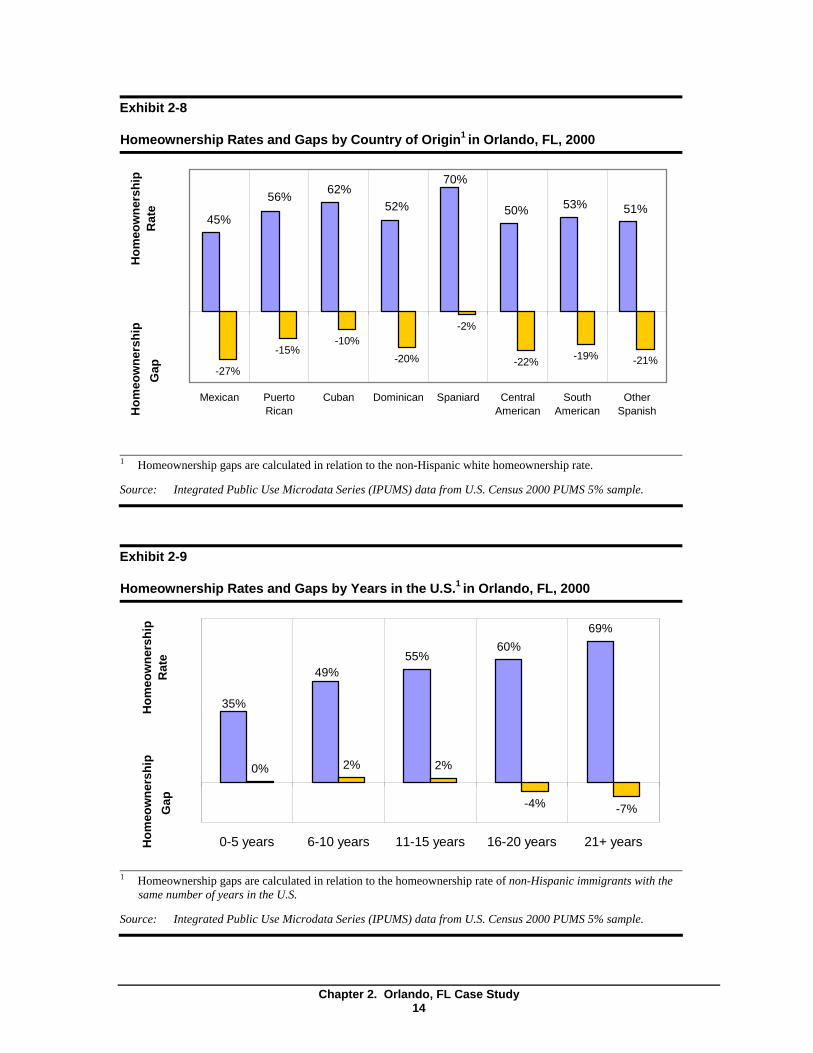
Country of Origin Exhibit 2-8 presents the Hispanic homeownership rates and gaps for Orlando by country of origin. With the exception of the Mexican population in Orlando, Hispanics in Orlando have significantly higher homeownership rates and lower gaps than their counterparts nationally. For example, about 57 percent of Puerto Ricans and 52 percent of Dominicans in Orlando are homeowners, compared to only 34 percent of Puerto Ricans and 20 percent of Dominicans nationally. The gap among Puerto Ricans is 15 percent (38 percent nationally), and among Dominicans the gap is 20 percent (52 percent nationally). By contrast, the homeownership rate among Mexicans in Orlando (45 percent) is 3 percentage points lower that their national counterparts (48 percent), and the gap among Mexicans in Orlando (27 percentage points) is larger than the gap among Mexicans nation-wide (24 percentage-points). Spaniards consistently demonstrate the highest homeownership rate and lowest gaps in Orlando and nationally.
Years in the U.S. Exhibit 2-9 presents the Hispanic homeownership rates and gaps for Orlando by years in the U.S. Homeownership rates gradually increase as length of tenure in the U.S. increases. Homeownership rates in Orlando are significantly higher across all length of tenure categories when compared to national rates. For example, homeownership rates are 25 percentage points higher among Hispanics in Orlando who have been in the U.S. for 6-10 years, when compared to their national counterparts.
Chapter 2. Orlando, FL Case Study 13
1
Exhibit 2-8
Homeownership Rates and Gaps by Country of Origin1 in Orlando, FL, 2000 H
omeo
wne
rshi
p R
ate
Hom
eow
ners
hip
Gap -27%
-15% -10%
-20%
-2%
-22% -19% -21%
70%
50% 53% 51% 62%56%
52% 45%
Mexican Puerto Cuban Dominican Spaniard Central South Other Rican American American Spanish
Homeownership gaps are calculated in relation to the non-Hispanic white homeownership rate.
Source: Integrated Public Use Microdata Series (IPUMS) data from U.S. Census 2000 PUMS 5% sample.
Exhibit 2-9
Homeownership Rates and Gaps by Years in the U.S.1 in Orlando, FL, 2000
Hom
eow
ners
hip
Rat
e H
omeo
wne
rshi
p G
ap
55% 60%
69%
0% 2% 2%
-4% -7%
35%
49%
0-5 years 6-10 years 11-15 years 16-20 years 21+ years
Homeownership gaps are calculated in relation to the homeownership rate of non-Hispanic immigrants with the same number of years in the U.S.
Source: Integrated Public Use Microdata Series (IPUMS) data from U.S. Census 2000 PUMS 5% sample.
Chapter 2. Orlando, FL Case Study 14
1
Accordingly, homeownership gaps between Hispanic and non-Hispanic immigrant households in Orlando are significantly smaller than gaps nationally. In fact, for the periods of 6-10 and 11-15 years, Hispanics in Orlando are more successful at becoming homeowners than their non-Hispanic immigrant counterparts. For each of these two periods, the homeownership rate among Hispanic immigrants is 2 percentage points higher than non-Hispanics immigrants. By contrast, homeownership rates among Hispanic immigrants nationally lag behind non-Hispanic immigrants by 13 and 15 percentage points in these two periods.
Organizations Interviewed in the Orlando area
The remainder of this case study is based on interviews with representatives from four agencies in the Orlando metropolitan area.
Association of Community Organizations for Reform Now (ACORN) Housing ACORN Housing is a national non-profit organization that has been providing housing counseling services to low- and moderate-income homebuyers since 1987. ACORN Housing is a HUD-certified housing counseling agency that provides one-on-one mortgage loan counseling and first-time homebuyer classes, which help clients obtain affordable mortgages through the organization’s lending partnerships. The organization staffs two-Spanish speaking housing counselors. The organization’s primary mission is to promote homeownership through education and credit counseling. The ACORN Housing program in Orlando started in 2005.
ACORN Housing in Orlando has an income cap of $55,100 for eligibility for the agency’s programs. ACORN also requires that clients with previous bankruptcies wait at least two years after the bankruptcy discharge date to be eligible for services and that clients with previous foreclosures wait at least three years after the foreclosure date. The organization’s client profile is a mix of minorities and non-Hispanic whites, usually low-income, young (2545), and single parents (especially mothers). ACORN Housing clients live throughout Central Florida. Hispanics tend to be Puerto Ricans, followed by Colombians, Dominicans, some Venezuelans and Cubans, and a few Mexicans. According to ACORN Housing staff, Mexicans are a particularly difficult Hispanic population to serve because many are undocumented, unlike Colombians and other South Americans. A large portion of Hispanics served by the program do not speak English or speak English poorly, especially the older clients.
Housing and Neighborhood Development (HANDS) HANDS is a non-profit organization that was incorporated in 1989 and is both a HUD-certified housing counseling organizations and a community housing development organization. HANDS owns over 880 multifamily units for low- and moderate-income households, builds about 10 single-family homes each year, and maintains an extensive database of affordable apartments. The organization has two Spanish-speaking staff members; one staff member provides one-on-one counseling and conducts classroom style seminars, and another conducts the intake with each client. The primary mission of HANDS is to promote homeownership and affordable housing by educating clients on how to become homeowners, helping clients repair credit issues, and developing affordable housing.
Chapter 2. Orlando, FL Case Study 15
HANDS focuses on serving very low- and low-income households (typically less than $18,000 annually), and many of their clients are in their program for 2 to 3 years. The agency’s services are free for eligible clients. Approximately 37 percent of clients are very low income (below 50 percent of AMI), 36 percent are low income (between 51 and 80 percent of AMI), 21 percent are moderate income (between 80 and 100 percent of AMI), and the remaining proportion are either above 100 percent of AMI or have no income. About three-fifths of clients are between 20-39 years old, one-third are married, and more than half are 1 or 2 person households.
Hispanic clients represent 35 percent of the total clientele, and the Hispanic demographic profile differs from the total client-base in a few important ways. Hispanics are more likely to belong to large families that are headed by married couples. Approximately 80 percent of clients are Spanish-speaking only. Most work in the service industry and thus belong to the very low- or low-income categories. The majority of Hispanics are Puerto Ricans, with the balance consisting of Cubans, Mexicans, and South Americans.
Metro Orlando Urban League (MOUL) The mission of MOUL is to assist disadvantaged persons in Central Florida by promoting their economic self-reliance, empowerment and civil rights. The organization focuses on persons with severe needs and serves people of all races and ethnicities. The Orlando chapter is a HUD-approved housing counseling agency with 22 staff members, including four English-speaking housing counselors and one Spanish-speaking counselor. A key part of the organization’s mission is to promote economic self-sufficiency and build financial capacity through homeownership and fiscal responsibility. These goals form the foundation for the homeowner education courses and credit counseling classes.
About 26 percent of MOUL’s clients are Hispanic, and African Americans constitute the largest minority group (about 50 percent) served by the organization. The majority of clients (58 percent) are female. Approximately three-fifths of clients are married couples, and almost half of these households have children. Among the unmarried clients, 63 percent are female-headed households and nearly all of these single female-headed households have children (88 percent). The majority of MOUL’s clients are 20-54 years old (51 percent), and about 6 percent are 65 years or older. About 80 percent of the clients earn less than $20,000 annually, and 40 percent earn less than $10,000 yearly. About one in every ten clients earns $30,000 or more annually. One-third of clients are employed, and almost one-fifth are retired.
National Association of Hispanic Real Estate Professionals (NAHREP) The mission of NAHREP is to increase the Hispanic homeownership rate by empowering real estate professionals that serve Hispanic consumers. The association accomplishes this task by creating a forum where information can be exchanged and where educational tools that help members understand and effectively handle the cultural distinctions of their clients are distributed and discussed. The association also has a political action committee that supports the legislative interests of Hispanic real estate professionals. The Orlando chapter is particularly focused on educating real estate professionals about the variety of mortgage products and fair real estate practices, as well as on promoting awareness of important difference between the various Hispanic cultures. The Orlando chapter was founded in 2004 and includes real estate agents, home inspectors, representatives from title and insurance
Chapter 2. Orlando, FL Case Study 16
companies, and mortgage lenders. We interviewed the president of the NAHREP Orlando chapter who is a real estate professional.
NAHREP members serve any client who needs assistance with the homebuying process, and many of their clients are Hispanic. According to the NAHREP representative, most of the clients are Puerto Ricans, followed by Mexicans, and then other South Americans. Also, the majority of their Hispanics clients work in Orlando’s service industry and are low-skilled, low-paid workers. Most clients are married couples with children, although there is a large proportion of single-female headed families with children. Most are 30-40 years old, and most speak English but feel more comfortable speaking Spanish.
The list of HUD-approved counseling agencies identifies five agencies providing homeownership counseling in Orlando.1 Of these, three were interviewed for this study (HANDS, the Urban League, and ACORN). Based on data on the number of counseling clients served by HUD-approved agencies in 2004, the interviewed agencies accounted for roughly two-thirds of both Hispanic housing counseling clients and all pre-purchase homeownership workshop attendees in the market area.
Exhibit 2-10 displays the geographic location of these service providers within the immediate Orlando metropolitan area and also shows the neighborhoods with the highest concentration of Hispanic renters.2 As the exhibit suggests, most of the service providers interviewed for this case study are located in areas with many Hispanic renters and thus are well situated to engage prospective Hispanic homebuyers. HANDS and NAHREP’s offices are located in neighborhoods that have the highest quartile of concentration of Hispanic renters. ACORN Housing and MOUL are located in areas with an above median concentration of Hispanic renters.
The exhibit also shows the distribution of Hispanic renters in proportion to all households throughout the immediate Orlando vicinity. There are large concentrations of Hispanic renters within the city’s southeast and southwest areas.
1 The list of HUD-approved counseling agencies was obtained from the HUD Web site (www.hud.gov/offices/hsg/sfh/hcc/hccprof14.cfm).
2 Neighborhoods are represented by census tracts. In the map, tracts are divided into quartiles based on Hispanic renters’ share of all households. The quartiles are defined as follows: tracts in the lowest quartile have between 0 and 1.4 percent Hispanic renters, the second quartile tracts have between 1.4 and 3.8 percent Hispanic renters; the third quartile tracts have between 3.8 and 7.9 percent Hispanic renters, and the top quartile tracts have more than 7.9 percent Hispanic renters.
Chapter 2. Orlando, FL Case Study 17
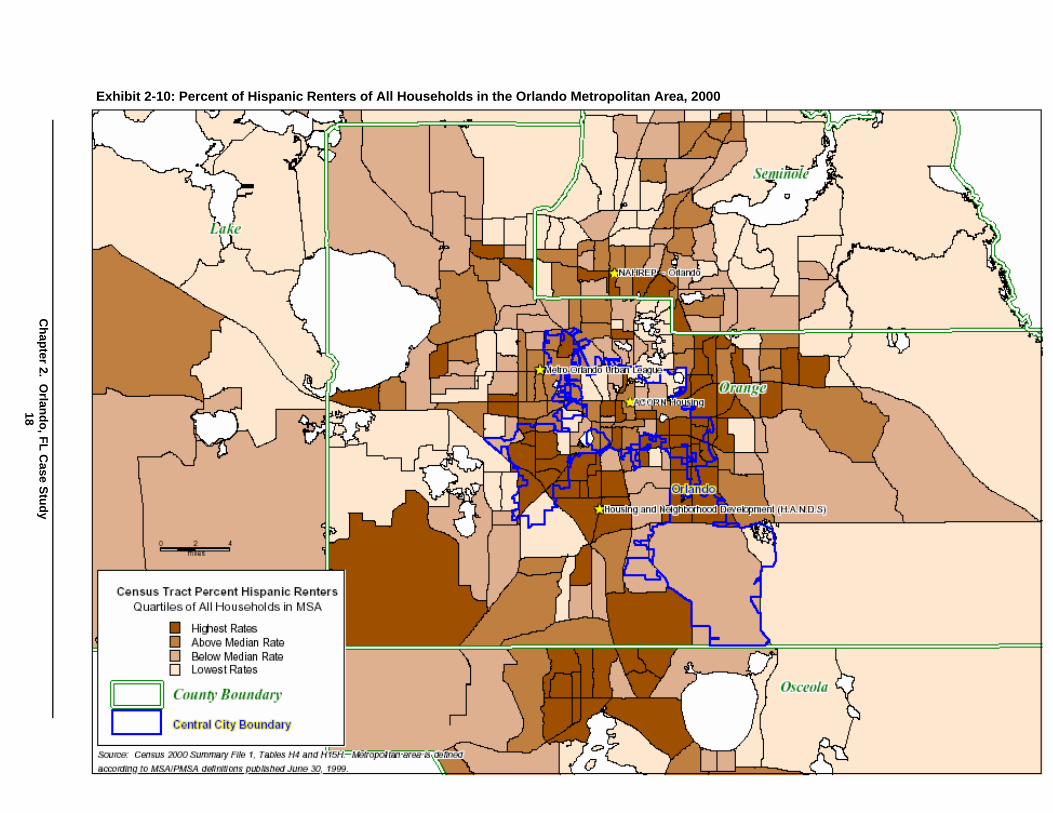
Exhibit 2-10: Percent of Hispanic Renters of All Households in the Orlando Metropolitan Area, 2000
Chapter 2. O
rlando, FL Case Study
18
2.2 Homeownership Barriers
This section briefly reviews the key barriers to homeownership that were identified by interviewees in Orlando. Overall, respondents identified many of the barriers that are highlighted in the homeownership literature, including lack of information, lack of affordable housing, and questionable practices in the housing and mortgage market industry (see Cortes et al. 2006). Staff from these service providers identified other factors that are less pronounced in the literature, including the interaction between the neighborhood preferences of prospective Hispanic homebuyers and the availability of affordable homes.
Lack of Information
According to service providers in Orlando, Hispanics often:
• Do not understand the overall home purchase process or the responsibility of being a homeowner. It is not uncommon for Hispanic renters to be uninformed about the homebuying process and unfamiliar with the roles played by different stakeholders throughout the process. The lack of knowledge discourages many Hispanics from pursuing homeownership opportunities and undermines their confidence in completing the homebuying process. Also, some prospective Hispanic homebuyers do not understand what it means to become a homeowner. For example, some Hispanics do not understand that as a homeowner they do not have a landlord to contact for repairs.
• Have incorrect perceptions about the mortgage qualification process. Service providers described two forms of misconceptions about the mortgage qualification process. On the one hand, some Hispanics overestimate the mortgage qualification requirements by assuming that large downpayments and perfect credit are required to buy a home. These Hispanics are typically unaware of mortgage products that are flexible and are designed to help low- and moderate-income households qualify for a loan. Hispanics with these perceptions of the mortgage qualification process typically self-select out of pursuing homeownership. On the other hand, other Hispanics underestimate the mortgage qualification requirements by assuming that anyone with a history of bankruptcies, poor credit, and insufficient savings can qualify for a loan. This underestimation leads some Hispanics to believe that credit and savings are not important factors to becoming a homeowner. According to service providers, these misconceptions are fostered and reinforced by advertisements from questionable lenders. These Hispanics are susceptible to predatory lending practices.
• Do not understand the importance of establishing and maintaining good credit. Several providers indicated that some of their clients Hispanics do not believe in using credit and may not have a savings or checking account. Staff from several service providers describe this barrier as a cultural phenomenon, and one staff member described it as follows: “The Hispanic way of thinking is that if your don’t have the cash to purchase something, then you don’t get it.” Overall, service providers believe this attitude stems from a general mistrust of the banking system that was developed in their country of origin, and may have resulted from a bad experience or from the general financial instability that exists in some countries. However, service providers said that this attitude may be changing among younger Hispanics who are more assimilated into the American culture.
Chapter 2. Orlando, FL Case Study 19
In general, respondents report that a lack of knowledge about the homebuying and mortgage qualification process is the most significant barrier to homeownership among Hispanics in Orlando. Knowledge gaps are attributed to several important factors. First, Hispanics’ disconnect from mainstream financial institutions deprives them of opportunities to learn about how the U.S. financial system functions and thus undermines their financial literacy (e.g., how to create a budget, write a check, or develop a credit history). Service providers note that some Hispanics are unaccustomed to having a savings or checking account and typically handle all their purchases with cash. Some Hispanics are unaware that they must file taxes yearly and that mortgage lenders require this information to qualify for a loan.
Respondents also reported that the knowledge gap among Hispanics is associated with their experiences in their country of origin. For example, a housing counselor comments that in Puerto Rico households can build a home relatively easily without obtaining building permits or documenting their financial history with an industry representative. By contrast, the homebuying process in the United States is heavily regulated and requires documentation regarding their wealth, income, and previous employment history. This process may appear intimidating and too complicated for some Hispanics, which may discourage them from pursuing homeownership at all or from finishing the homebuying process once begun. According to several service providers, cultural incongruities between Hispanic immigrants and the U.S. homebuying process are particularly acute among older Hispanics.
Another barrier identified by respondents is poor English-speaking skills that prevent some Hispanics from interacting with industry professionals and may make them afraid to take the first steps towards homeownership. Having Spanish-speaking professionals on staff helps bridge the language and information gap, but according to several providers, some Hispanics will never contact a housing counseling agency for fear that no one speaks Spanish.
Lastly, respondents noted that knowledge gaps are exacerbated by the interaction between Hispanics’ lack of information, particularly the importance of credit and establishing a good credit history, and questionable industry practices. The lack of information is exploited by industry actors who place advertisements that claim to provide homeownership opportunities with “no money down” to people with previous bankruptcies and bad credit. These advertisements mislead Hispanics (and other prospective homebuyers) by implying that establishing good credit is not very important because even the worst financial scenarios will not prevent them from becoming homeowners. Hispanics who use these services are typically offered adjustable, high-interest rate loans that are unsustainable in the long-term. These prospective Hispanic homebuyers are told not to worry because they can either refinance when needed or file for bankruptcy. However, service providers suspect that most of these loans result in foreclosure, which further damages the homebuyers’ credit histories. Thus, staff describe a vicious chain of events that begins with a lack of information about the homebuying and mortgage qualification process among many Hispanics, leading to their exploitation by industry actors, which in turn, results in further damage to Hispanics’ credit history.
The confluence of these factors creates significant fears of rejection among Hispanics, which many service providers believe can be addressed with proper education and guidance. Myths about the homebuying process often reinforce preconceptions that homeownership is an unattainable goal.
Chapter 2. Orlando, FL Case Study 20
Housing Market Barriers
The diminishing supply of affordable housing in the Orlando metropolitan area is the primary housing market barrier to Hispanic homeownership. According to the executive director of HANDS, the housing affordability problem in Orlando results from both rapidly appreciating land values and the low wages that are associated with the tourism industry. According to data from the National Association of Realtors®, the median sales price of an existing single family home increased sharply from $145,100 in 2003 to $243,600 in 2005 – an increase of 68 percent in just two years. The executive director estimates that housing values appreciate by about 4 percent annually, but wages in the tourism industry lag behind and appreciate by only 2 percent yearly. The affordable housing stock in the downtown Orlando area is further constricted by the conversion of existing affordable apartments into higher-end condominiums for retiring seniors and other households from outside of Florida who purchase a summer home in Central Florida. Indeed, the lack of affordable housing is repeatedly cited as the most important barrier in follow-up surveys that HANDS conducts with clients 120 days after completing their homeownership education program.
The executive director at HANDS also suggests that many Hispanics are unwilling to move into neighborhoods where they are not the predominant racial/ethnic group. Most Hispanics prefer to move into neighborhoods where their friends and families live and where people share their traditions. Yet, many Hispanics can only qualify for homes that cost around $150,000, and such homes tend to be located in predominantly African-American neighborhoods. These preferences have also made the organization’s housing development work more difficult because many of their land acquisitions are located in these same inexpensive neighborhoods. The executive director suggests that Hispanics would prefer to rent an apartment in a neighborhood that is predominantly Hispanic rather than own a home in a neighborhood that is predominantly African-American or white. Thus, the neighborhood preferences of Hispanics limits the neighborhoods where Hispanics are willing to look for homeownership opportunities.
This view is further supported by the president of the NAHREP Orlando chapter who also acknowledges that some Hispanics limit their housing opportunities by refusing to live in neighborhoods that are either predominantly African-American or predominantly occupied by a different Hispanic group. For example, some Cubans would rather live with other Cubans, and if given a choice to buy a home in a neighborhood that is predominantly African-American or Mexican, they will chose to remain renters in a majority Cuban neighborhood. Yet, there are very few affordable homes available in neighborhoods that also satisfy Hispanics neighborhood preferences.
Mortgage Market Barriers
The most important mortgage market barrier is the lack of credit or poor credit. As part of their services, housing counseling agencies pull a client’s credit reports. They often find that clients have open collections on their credit report that must be paid, disputed, or otherwise addressed. Younger Hispanics are especially overloaded with debt, and several providers note that it is common to have a young Hispanic with $13,000 or more in debt. The most common forms of debt include: car loans, credit cards, gym memberships, and payday loans. Older Hispanics are increasingly confronting large medical collections. Payday loans are especially pernicious, because these establishments often target Hispanic neighborhoods and charge exorbitant interest rates. Service providers said that some debt is “good debt” because Hispanics who are able to demonstrate a capacity to carry and pay their
Chapter 2. Orlando, FL Case Study 21
debt are able to develop a good credit history. However, excessive debt can be detrimental to their chances of becoming homeowners; some Hispanics are “simply way over their head in debt.”
Service providers also suggest that Hispanics are suspicious about the mortgage qualification process, and providers attribute this apprehension to the increasing number of unscrupulous mortgage brokers in Central Florida. According to several service providers, the number of mortgage brokers has exploded throughout Central Florida over the past several years, and the number of scams and dishonest practices has also increased. They feel that Hispanics have been targeted by these mortgage brokers because they are viewed as particularly vulnerable. As a result, many clients that access these service providers have preconceived fears about being taken advantage of and often ask staff: “what do you get out of this?” According to the ACORN Housing counselor, many clients come to them after “they’ve been burned” by a mortgage broker and many are leery about the integrity of the homeownership process and the various industry stakeholders.
Despite these challenges, staff believe that some traditional barriers within the mortgage market industry are being adequately addressed, especially in terms of the availability of mortgage products that are tailored to low-income households. For example, the NAHREP real estate agent has witnessed an increase in the use of “no doc” products that rely mostly on an applicant’s credit score, cash reserves, and demonstrated ability to pay bills on time to be eligible for these products. These products de-emphasize underwriting guidelines that have traditionally served as barriers to qualifying for a loan (e.g., documenting income and employment) among Hispanics that change jobs frequently. The president of the NAHREP Orlando chapter also believes that an increase in the use of multiple co-signers on a loan has contributed to higher homeownership rates among Hispanics and decreased the chances of defaulting on a loan. Many Hispanics have been able to sustain their tenure as homeowners because multiple family members live in the same house and contribute to the financial burden associated with owning a home. According to the NAHREP real estate agent, the Orlando metropolitan area may be somewhat unusual, because Orlando attracts family members and friends from across the country and from abroad to create extended families. This creates greater opportunities for Hispanics to live together, purchase a home, and maintain homeownership.
Indeed, migration patterns play an important role in understanding homeownership rates and barriers in Orlando. For example, staff from ACORN Housing believe that migration patterns explain why Orlando has relatively higher homeownership rates when compared to other Hispanics in the U.S. even though housing costs are fairly expensive. Hispanics from the North (e.g., Boston and Chicago) and from Miami are moving to Central Florida and these Hispanics generally are better off financially and are able to purchase homes in Central Florida. Indeed, Census 2000 data suggests that 69 percent of Hispanics in the Orlando metropolitan area were in a different house in 1995, and among these Hispanics, 26 percent came from a different state (more than half of them from the Northeast). According to the housing counselor, these Hispanics also tend to be more educated about the homebuying process because they were previously homeowners.
2.3 Homeownership Services in Orlando, FL
This section reviews the variety of services offered by organizations that were interviewed in Orlando. The section reviews the nature of these services and their ability to promote homeownership among Hispanics in the Orlando metropolitan area. Most of these service providers offer a comprehensive package of homeownership services—especially the housing counseling
Chapter 2. Orlando, FL Case Study 22
agencies—and have developed small networks among other service providers in Orlando to supplement their services, including lenders and real estate agents. These networks tend to be highly fragmented among the various service providers, although more formal and coordinated relationships have developed recently. Service providers develop their networks of partnering agencies based on an agency’s reputation for being professional and trustworthy. Also, all of the housing counseling agencies use a complementary approach to service delivery by offering both large group meetings and intensive one-on-one sessions. Few organizations have formal, systematic marketing initiatives, although most have fostered ties with neighborhood churches to market their services. However, most of these providers are operating at full capacity and have limited resources to serve additional clients.
Nature of Homeownership Services
Exhibit 2-11 describes a variety of services offered by organizations in the Orlando metropolitan area. The services are grouped into three categories, based on their relationship to the homebuying process: deciding to pursue homeownership, searching for and finding a suitable home, and obtaining mortgage financing. Homeownership counseling and financial education are the two primary services offered in Orlando that affect a potential Hispanic homebuyer’s decision to pursue homeownership. One organization also assists homebuyers directly in searching for a suitable home and another organization develops affordable housing. All of the HUD-certified housing counseling agencies help prospective homebuyers obtain mortgage financing by providing assistance with the mortgage qualification process. One agency offers post-purchase counseling. All of these organizations provide referrals to other service providers as needed.
Deciding to Pursue Homeownership Several organizations interviewed in the Orlando metropolitan area are providing services designed to bridge the homebuying information gap. ACORN Housing, HANDS, and MOUL all focus on expanding homeownership opportunities among Hispanics by providing formal homeownership counseling and financial education courses to the Hispanic community. The NAHREP real estate agent also helps to educate clients about the homebuying process, albeit informally and on a case-bycase basis.
Homeownership Counseling and Financial Education The core service among the three housing counseling agencies is to provide homeownership counseling and provide financial education. ACORN Housing’s education class is offered in both Spanish and English. All clients must attend a one-hour education seminar that provides an introduction to the ACORN Housing program, describes the organization’s eligibility guidelines, and explains the step-by-step process of purchasing a home. Clients also learn what types of information will be required to complete the process, what will be expected of them, and what clients can expect of ACORN Housing. Following the education seminar, clients meet with an intake counselor and learn about the requirements of the program. The intake class is offered twice a week, and clients are required to attend once. During the intake process, clients are asked to bring documents pertaining to their income and financial status:
• Completed program application and budget sheet;
• Copy of picture ID and Social Security Card;
• One month of current pay stubs for all employment;
Chapter 2. Orlando, FL Case Study 23
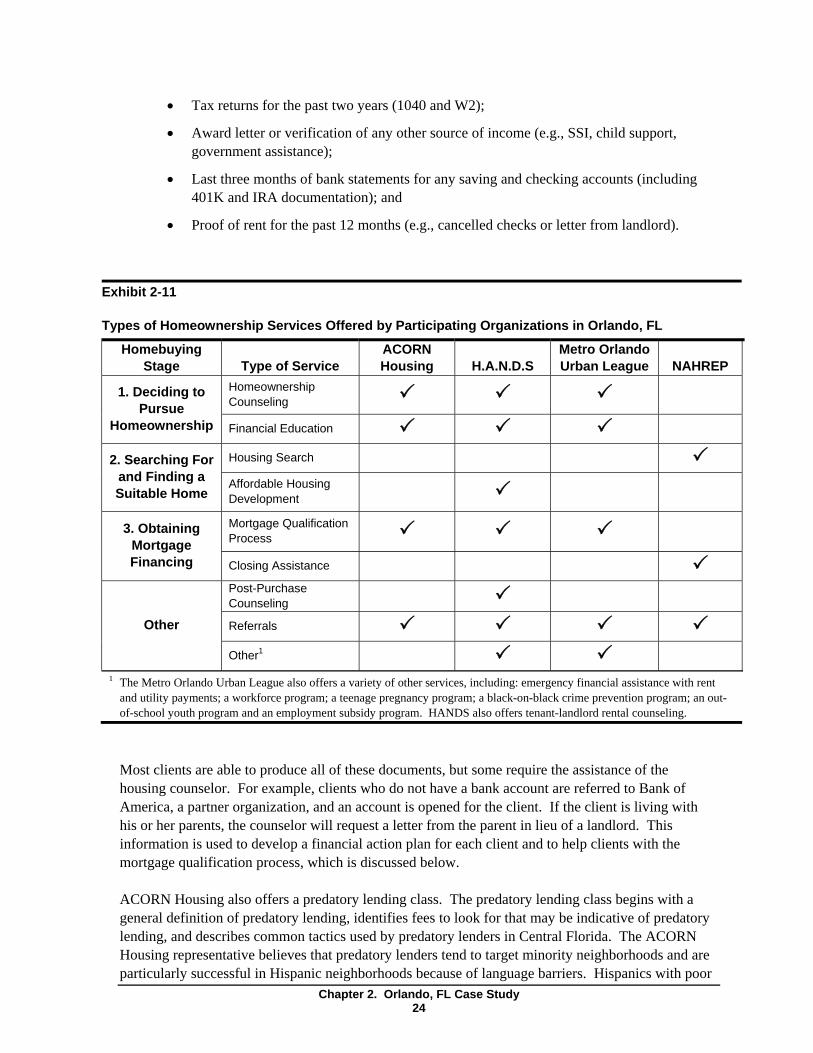
1
• Tax returns for the past two years (1040 and W2);
• Award letter or verification of any other source of income (e.g., SSI, child support, government assistance);
• Last three months of bank statements for any saving and checking accounts (including 401K and IRA documentation); and
• Proof of rent for the past 12 months (e.g., cancelled checks or letter from landlord).
Exhibit 2-11
Types of Homeownership Services Offered by Participating Organizations in Orlando, FL
Homebuying ACORN Metro Orlando Stage Type of Service H.A.N.D.S NAHREP Housing Urban League
Homeownership 1. Deciding to 3 3 3Counseling Pursue Homeownership Financial Education 3 3 3
Housing Search 32. Searching For and Finding a Affordable Housing 3Suitable Home Development
Mortgage Qualification 3. Obtaining 3 3 3ProcessMortgage Financing Closing Assistance 3
Post-Purchase 3Counseling
Other Referrals 3 3 3 3 Other1 3 3
The Metro Orlando Urban League also offers a variety of other services, including: emergency financial assistance with rent and utility payments; a workforce program; a teenage pregnancy program; a black-on-black crime prevention program; an out-of-school youth program and an employment subsidy program. HANDS also offers tenant-landlord rental counseling.
Most clients are able to produce all of these documents, but some require the assistance of the housing counselor. For example, clients who do not have a bank account are referred to Bank of America, a partner organization, and an account is opened for the client. If the client is living with his or her parents, the counselor will request a letter from the parent in lieu of a landlord. This information is used to develop a financial action plan for each client and to help clients with the mortgage qualification process, which is discussed below.
ACORN Housing also offers a predatory lending class. The predatory lending class begins with a general definition of predatory lending, identifies fees to look for that may be indicative of predatory lending, and describes common tactics used by predatory lenders in Central Florida. The ACORN Housing representative believes that predatory lenders tend to target minority neighborhoods and are particularly successful in Hispanic neighborhoods because of language barriers. Hispanics with poor
Chapter 2. Orlando, FL Case Study 24
English skills have trouble signing complicated mortgage financing documents and are especially susceptible to predatory lending practices during the execution of mortgage documents. During the predatory lending class, the housing counselor will distribute sample documents, and participants are asked to identify relevant sections and fees that may indicate whether the loan is considered predatory.
ACORN Housing recently became certified to conduct first-time homebuyer classes, which will be modeled on Fannie Mae’s first-time homebuyer program. The classes will cover many of the same topics that are discussed in their current education seminars, but will provide more details on the different roles and responsibilities of the mortgage lender, real estate agent, home inspector, title company, and other stakeholders in the homebuying process.
A similar process occurs at HANDS. A staff member conducts an intake with each client by phone, and the intake worker focuses on obtaining basic information about the client’s household composition, financial situation, and credit history. The intake is designed to pre-screen clients who may be eligible for an array of downpayment assistance programs offered by the City of Orlando, Osceola County, Orange County, Volusia County, and the Florida Housing Finance Corporation. Clients who are ineligible to receive downpayment assistance are either served by the organization’s rental search assistance program or referred to the area’s network of homeless shelters. Clients who are identified as potential homebuyers are scheduled for a 2.5 hour pre-purchase orientation program. The orientation program focuses on the eligibility requirements for receiving downpayment assistance. These requirements include:
• Minimum monthly income ($800);
• Decent credit/payment history (above 506 credit score);
• Minimum of $1,000 in savings;
• Reasonable debt ratio (33/40 or a maximum of 33 percent of monthly income spent on housing and 40 percent of monthly income spent on all debts); and
• Sales price cap ($211,500).
Clients who may qualify for a downpayment assistance program are scheduled for one-on-one credit counseling. The one-on-one counseling focuses on a variety of topics, depending on the needs of the client, and include developing an action plan (i.e., budget and savings plan), understanding how to establish and maintain good credit, and providing foreclosure prevention/loss mitigation counseling. The housing counselor pulls the client’s credit report, reviews the report with the client, and develops steps to resolve credit issues as needed. The housing counselor suggests that many of the clients are unaccustomed to living on a budget and tracking expenses, and thus many are unaware of how they spend their money and how to save. The one-on-one sessions are typically two hours in duration and the frequency of one-on-one counseling depends on the needs of clients. For example, clients who have a previous default on their credit report will be seen two or three times; clients who are receiving Section 8 rental assistance often have five or six counseling sessions; and others may need more intensive counseling to implement their action plan. Each housing counselor conducts about 20 to 30 one-on-one counseling session per month. Clients who satisfactorily resolve their credit issues and are in a position to qualify for downpayment assistance are then enrolled in the homebuyer education
Chapter 2. Orlando, FL Case Study 25
class. Also, clients who are pre-screened at intake and are ready to buy a home without needing individual counseling are scheduled for a homebuyer class.
The homebuyer education class is required by all the downpayment assistance programs for any client using these programs. The homebuyer education class is a 6.5 hour session that is offered twice monthly, once in Spanish and once in English. The class is conducted in a classroom setting. The classes are typically scheduled and filled over one month in advance. The class is designed to introduce attendees to the downpayment assistance programs and to review each step in the homebuying process. In particular, housing counselors review the mortgage loan application process, the types of documentation that will be required by the bank (e.g., proof of income and credit history), the housing search process, and the need to obtain homeowner’s insurance. HANDS invites a real estate agent and a title company representative to the homebuyer class to describe their roles during the homebuying process and to review a home contract.
HANDS also participates in Freddie Mac’s “Don’t Borrow Trouble” consumer awareness campaign, which combines public education and counseling services to help homeowners avoid predatory lending practices. HANDS receives $1,000 from Freddie Mac for every predatory lending session that is conducted in Spanish, but HANDS staff say that it is very difficult to convince owners to attend these seminars because there are few direct, tangible incentives.
The Metro Orlando Urban League provides an array of services, although most clients contact MOUL for emergency rental assistance. However, all clients are required to enroll in the agency’s credit and budgeting classes, because the organization considers that all clients, regardless of their immediate needs, can benefit from these classes. The 6-hour budget and credit counseling class is offered once monthly in a classroom setting and is based on Freddie Mac’s CreditSmart program. The program focuses on 11 key dimensions, all of which are relevant to the homebuying process: understanding credit and why it is important; managing money, setting budgeting goals, learning about banking services, establishing and maintaining good credit, understanding credit scoring, thinking like a lender, avoiding credit traps (e.g., predatory lending and internet scams), restoring poor credit, planning for the future, and becoming a homeowner. The bi-lingual CreditSmart curriculum provides practical worksheets that, according to the housing manager, are particularly effective for Hispanics. For example, the curriculum provides examples of how interest rates affect the true cost of a car loan or home mortgage; worksheets for calculating net monthly income and tracking expenditures; a sample checkbook register; credit report samples; and worksheets for calculating the debt-to-income ratio, mortgage affordability, and home maintenance and replacement costs.
In conjunction with Freddie Mac’s “Dispel the Myth” Initiative, MOUL has tailored the curriculum of its credit counseling to counter a number of common misconceptions about the homebuying process. The Orlando chapter of MOUL primarily focuses on recruiting Hispanic clients for this program, as the housing manger believes that Hispanics are particularly susceptible to unsupported myths about homeownership because of their language barriers. In particular, staff from MOUL address seven common myths about the homeownership process:
1. You need perfect credit.
2. You must work at the same job for at least three years.
3. Homeownership is just too risky—it’s not worth it.
Chapter 2. Orlando, FL Case Study 26
4. Lenders share your personal information.
5. You cannot buy a home if you’re not a U.S. citizen.
6. You need a downpayment as large as 20 percent.
7. You need to have a checking or savings account.
Each of these myths is addressed by MOUL staff during the first hour of the budget and credit counseling seminars. Staff debunk these common misconceptions about the homebuying process by providing more accurate information on what is required to buy a home. For example, staff will talk about the availability of mortgage products that do not require a downpayment or only require three percent of the total home value.
Searching For and Finding a Suitable Home Housing Search Providing housing search assistance is one of the core services provided by the NAHREP real estate agent, but several steps occur before the agent providers this service. The agent begins by interviewing the client to understand the household’s lifestyle (e.g., how many children do they have and what are their housing and neighborhood preferences), employment history, and financial situation. The NAHREP real estate agent emphasizes that there are important sub-cultural differences among Hispanics that shape their housing and neighborhood preferences. For example, Hispanics from Spain typically like Mediterranean-styled homes, whereas Mexican families tend to prefer more rural settings. Hispanics who migrate from northern states prefer the “Florida-looking” homes that are typically located in new gated-communities. By contrast, recent immigrants are more comfortable in older neighborhoods that are “less fancy” and may have less restrictive neighborhood ordinances. Some recent Hispanic immigrants are unaccustomed to living in highly regulated neighborhoods and thus look for neighborhoods that have flexible parking regulations and few property restrictions.
The information collected during the interview is then provided to a mortgage broker who pulls the client’s credit history and attempts to identify appropriate mortgage products. Once an appropriate product is identified and a maximum mortgage payment is calculated, the real estate agent assists the client with the housing search. The housing search is informed by the initial interview and the client’s housing and neighborhood preferences. According to the real estate agent, many Hispanics are looking for a home that conforms to an old Spanish adage: “bueno, bonito, y barato” or “good, nice, and cheap.” Many Hispanics are also concerned about a home’s proximity to work, but are less concerned with proximity to churches, schools, shopping centers or other neighborhood amenities.
ACORN Housing, H.A.N.D.S., and MOUL also provide some assistance with the housing search process, albeit less formally or directly. For example, ACORN Housing provides clients with a list of preferred real estate agents and encourages clients to use a professional real estate agent from their trusted list. None of these organizations assists clients with their housing search.
Affordable Housing Development Developing affordable housing and renovating existing rental apartment complexes are part of HANDS mission. The organization’s projects are financed through County bonds, state and federal grants, and conventional loans. The organization looks for buildings in poor condition, apartment complexes in foreclosure, or opportunities to purchase reasonably priced land on which they can build single-family homes for about $105,000 and sell them for $120,000 to $150,000. Last year, the
Chapter 2. Orlando, FL Case Study 27
organization built two single-family homes and rehabilitated 145 multifamily units, which is average for any given year. Recent developments include Silver Pines, a single-family community in West Orlando that features 80 three- and four-bedroom new homes. The organization has also renovated apartment complexes for rental housing, including Lancaster Apartments (145 units), Brentwood Park (254 units), and Green Gables (95 units). However, HANDS has found it increasingly difficult to find new construction opportunities because the price of land in the Orlando metropolitan area has appreciated greatly over the past few years.
Obtaining Mortgage Financing Mortgage Qualification Several organizations interviewed in the Orlando metropolitan area help Hispanic clients with the mortgage qualification process. ACORN Housing counselors engage each client with one-on-one counseling following the intake class. The counselor will pull each client’s credit report for a nominal fee ($20.00) prior to the one-on-one counseling session, and the housing counselor reviews the credit report with each client. Based on this review, the counselor and client develop an action plan that includes financial goals, describes the client’s financial needs, and determines whether the client may be eligible for a mortgage. The counselor uses a housing affordability worksheet that calculates a mortgage payment amount assuming that 38 percent of the client’s monthly gross income is devoted to housing costs, including mortgage payments and estimated taxes and homeowner’s insurance costs. Clients who have significant debt will receive more intensive counseling, which is designed to resolve or repair their credit issues and work on maintaining a budget. The frequency of one-on-one counseling depends on the needs of the client, but the average client receives two or three one-on-one counseling sessions.
After completing the one-on-one counseling, clients are awarded a pre-qualification letter from ACORN Housing that certifies the completion of the program and grants the client access to special mortgage products. For example, ACORN Housing partners with Bank of America to provide ACORN clients with a first-time homebuyer mortgage product. The product is a conventional 30year fixed mortgage with interest rates at ¾ percent below market rate and does not require private mortgage insurance. The product also offers flexible credit and income guidelines, 100 percent financing, and does not require minimum credit scores. After receipt of the pre-qualification letter, clients begin their search for housing.
A similar process occurs at HANDS. After completing the homebuyer education class, clients are given a certificate verifying the completion of the course, which clients can then use to negotiate with any mortgage lender. HANDS staff report that some counseling providers in Orlando retain the certificate on behalf of the client as a way to encourage clients to use a particular lender that partners with the organization. That is, clients are not given the certificate to verify that they have completed a certified homeownership-counseling program and thus are unable to “shop around” for mortgage products on their own. It is unclear whether this practice is intended to shield clients from predatory lenders, or whether this practice is motivated by less principled reasons. The HANDS certificate also grants access to a variety of downpayment assistance programs. For example, the agency regularly refers clients to Osceola and Orange Counties’ downpayment assistant programs, which offer differing amounts of downpayment assistance to very low-income households depending on their income and family size. However, both the executive director and a housing counselor at HANDS suggest that these programs are starting to fall short of the needed assistance as real estate prices continue to appreciate sharply.
Chapter 2. Orlando, FL Case Study 28
HANDS staff encourage all their clients to stay in contact with their housing counselor as they negotiate with different lenders, especially if a lender refuses to serve a client who has been approved for downpayment assistance. Staff are available to advise clients as needed. In addition, HANDS staff provide mortgage default counseling to clients who are at risk of defaulting on their loans, predatory lending classes, and counseling to seniors who are interested in reverse mortgages.
Clients at MOUL are given the option to sign up for additional one-on-one counseling following the conclusion of the budget and credit counseling class. The one-on-one counseling provides individualized service by addressing the specific financial or credit issues that confront clients. The housing counselor will develop a detailed budget with each client, obtain a copy of a client’s credit report, and review the credit report with the client. All clients receive an action plan that provides specific goals and recommended steps for resolving their financial or credit issues. Also, staff will help draft letters to creditors as needed to address issues on their credit report. For example, these letters are often developed to negotiate outstanding debt. Some clients may receive only one or two sessions of one-on-one counseling because they are nearly ready to purchase a home, but other clients have greater needs and may meet regularly for up to one year.
Closing Assistance Among the organizations interviewed, only the NAHREP real estate agent provides formal closing assistance. The agent will help the client with the negotiating process (e.g., negotiating the home price) and coordinating with the title and insurance companies to facilitate the final closing steps. Throughout this process, the representative educates the client by explaining what documents will be required, providing guidance on how to complete various forms, and answering questions as needed.
Staff from ACORN Housing, HANDS, and MOUL are also available as needed to answer questions throughout the closing process, but these organizations take a less active role at this stage in the homebuying process.
Service Provision and Outreach
This section describes the scale of services delivered by each organization, the level of service coordination among service providers in the metropolitan area, and the types of outreach that these organizations conduct to market their services. The section also discusses the perceived demand for their services.
Service Provision At ACORN Housing, most clients are referred to the organization either by mortgage lenders or through word-of-mouth from previous clients. In their first full year of operation ACORN Housing successfully placed 24 clients into homes out of 320 total clients (or approximately an 8 percent success rate) and most were Hispanic. ACRON Housing currently has approximately 300 active client cases, and the goal is to double the number of clients served in the coming year. The majority of pending cases have unresolved credit issues that require more intensive counseling and time to adequately address these issues.
According to the housing counselor, each service offered by ACORN Housing has advantages and disadvantages that vary depending on the needs of the client. For example, the one-hour education seminar provides a general overview of how to buy a home in the shortest amount of time. The first-time homebuyer class is particularly effective at helping clients understand their overall financial
Chapter 2. Orlando, FL Case Study 29
management goals and developing appropriate budgeting strategies to plan for homeownership. The predatory lending class is less useful as a preventive intervention strategy because most clients who attend this class have already been the victims of predatory lending. These clients must refinance out of their predatory loan, and ACORN Housing staff will assist clients throughout the refinancing process. Overall, the ACORN Housing counselor prefers the one-on-one counseling because it offers individualized counseling to meet the specific needs of each client and because it is more flexible to schedule than the classroom sessions. One-on-one counseling is labor intensive and viewed by staff as less efficient if there is a waiting list for services.
Similarly, most clients that receive housing counseling services through HANDS are referred either by real estate agents, mortgage companies, downpayment assistance programs or through word-ofmouth. Overall, HANDS served 4,126 clients in FY2004-2005, and 1,758 clients attended one of their homebuyer education classes. About 15 percent of these attendees successfully became homeowners, although many clients need more than 12 months to close on a property. The success rate declined from previous years’ rates, which typically range between 23 and33 percent, because of increasing affordability issues associated with rapidly escalating house prices in Central Florida. Staff from HANDS suggest that they need to work harder to build more affordable housing, but the organization is having difficulty identifying reasonably-priced properties to acquire. The organization is also having a difficult time finding a bi-lingual professional who can provide default and reverse mortgage counseling.
Most clients learn about MOUL either through word-of-mouth or through MOUL’s active role in neighborhood churches throughout Orlando. From July 2003 through June 2004, MOUL served 6,531 clients, and the organization is currently operating at full capacity. The homeownership success rate among Hispanics is unknown. However, the housing manager suspects that the rate is higher among Hispanics when compared to other groups because Hispanics are particularly committed to becoming homeowners once they enter the program. The housing manager was unable to explain why Hispanic clients are more committed to completing the homebuying process than other groups. Also, the housing manger believes that the one-on-one counseling is particularly effective because the individualized attention allows clients to ask questions that they would otherwise not ask in a public (or classroom) setting. Many clients have sensitive questions about their current financial status, previous credit issues, or about their personal situation that can be articulated and addressed only in a private, one-on-one counseling session.
The NAHREP real estate agent similarly relies on word-of-mouth for most of her clients. The Hispanic agent currently has 6 active client files and only 2 are in a position financially to purchase a home. The agent suspects that only 1 of these clients will close on a home in the near future and the client is Hispanic. Overall, the agent believes that homeownership counseling services must be viewed more broadly to include the educational needs of both clients and industry professionals. According to the real estate agent, the housing and mortgage market industry is increasingly aware of the educational needs of Hispanic clients, but the educational needs of real estate professionals are poorly understood. Real estate professionals, especially agents working in the Orlando metropolitan area, need cultural sensitivity training to appreciate the cultural differences between Hispanics and other populations, as well as the various subcultural nuances among different Hispanic nationalities.
Partnerships and Service Coordination Partnerships with other service providers in the Orlando area play an important role for all the providers in the case study. ACORN Housing relies on several formal partnerships with HUD,
Chapter 2. Orlando, FL Case Study 30
Fannie Mae, and Bank of America, as well as numerous informal partnerships with Metro Orlando Urban League, Latino Leadership, individual leaders in the religious community, industry leaders (e.g., title company and insurance representatives), and an affordable housing developer. ACORN Housing’s relationship with Bank of America has been ongoing for many years, and the housing counselor views their product as the most flexible in Orlando.
Similarly, HANDS partners formally and informally with many different organizations. HANDS participates in the local 211 program, serving as the designated housing agency. Local 211 programs typically serve as emergency hotlines that are available 24-hours a day and help coordinate the referral of services across the metropolitan area. As the main housing agency in the 211 program, HANDS receives over 120 calls monthly from clients seeking housing assistance. Clients are screened and eligible persons are provided with support, usually assistance with finding an affordable apartment. In 2004, HANDS completed over 500 searches for affordable apartments for low-income households. Clients with very low incomes (below $800 monthly) are ineligible for HANDS’ services and are referred to the area’s network of homeless shelters. As a result of their involvement in the 211 program, HANDS has developed partnerships with the Orlando’s Homeless Coalition, Catholic Charities, and any type of transitional shelter that has clients graduating from their programs and seeking affordable housing. However, staff suggest that few clients that access HANDS via the 211 system are Hispanic. Hispanics are much more likely to access HANDS for their housing counseling services rather than for their affordable housing search assistance. This may suggest that Hispanics have more community resources (e.g., family and friends) to rely on for emergency housing assistance and are thus less likely to seek assistance via the 211 system.
According to HANDS staff, the metropolitan-wide network of service providers is highly fragmented, but the HANDS’ network is highly coordinated. HANDS participates in a housing roundtable that meets monthly. The roundtable is composed of six to eight organizations interested in exchanging information about the housing needs of low-income households in the Orlando metropolitan area. HANDS limits their referrals to these providers because they are confident these providers will follow through with their clients. Trust in the quality of services and in the integrity of a service provider determines who is part of HANDS’ referral network. As a result, HANDS representatives believe their referral network is much different than another housing counseling agency’s referral network. This implies that the metropolitan-wide network of service providers is fragmented because providers do not trust one another to serve their clients professionally.
At MOUL, the housing manager focuses on cultivating relationship with churches in the Orlando area. For example, several months ago representatives from MOUL were invited to conduct a presentation at Faith World, a large interdenominational congregation in Central Florida, and about 1,100 people signed up for the agency’s budget and credit counseling seminar. MOUL purchased a few radio advertisements to market the collaboration with Faith World. Over the next three months, staff from MOUL conducted several seminars, and nearly 900 people received certificates for completing the education classes. Certificate-holders became eligible for a variety of downpayment assistance programs in the Orlando area, and an estimated 500 people became first-time homeowners.
MOUL also partners with the Orlando Housing Authority and several mortgage companies that have been approved by the city and the county. There are approximately 200 approved loan officers in the Orlando area. MOUL also partners with several real estate agents who are interviewed and selected by MOUL staff, as well as with home inspectors, title companies, and insurance companies that are referred by the lender. Each of these stakeholders are invited to participate in MOUL’s budget and
Chapter 2. Orlando, FL Case Study 31
credit counseling classes and to talk about their role in the homebuying process. Many of these stakeholders have been working with MOUL for many years.
The housing manager believes that the network of service providers in the Orlando metropolitan area has been fragmented in the past but is increasingly coordinated. MOUL participates in the Orlando homeownership counseling collaborative and the housing roundtable, which are two important venues that bring representatives from interested organizations together to discuss recent issues in the housing and mortgage markets. These venues are also an opportunity for service providers to vet the services provided by other providers throughout Orlando and thus formalize their network of trusted service providers.
Trust is also very important to the NAHREP real estate agent who prefers to work with a small group of service providers that have established reputations for being professional and ethical. Most of these providers are members of the Association. Among the agent’s most important relationships are several mortgage brokers who can “shop” clients to various mortgage lenders. According to the agent, shopping clients to lenders is more likely to result in an appropriate mortgage product with the best terms. The real estate agent believes, however, that trust among service providers is subjective and often secondary to the considerable competition that exists between Hispanic service providers in Orlando. The competition is mostly associated with “turf” issues, which limits the willingness of service providers to coordinate their services with other providers regardless of how trustworthy they may be. For example, NAHREP does not have any formal partnership or relationships with any housing counseling agency in the Orlando area despite attempts to contact these organizations. However, the agent also acknowledged that real estate professionals have not been very proactive in the past because they are focused on identifying clients that are ready to purchase immediately, rather than waiting six months for a client to successfully complete a certified housing counseling program. Also, clients that use these services typically cannot afford average- or moderately-priced homes, and the few homes that these clients can afford are either located in distressed neighborhoods or located along the fringes of the metropolitan area. Neither of these locations are appealing to prospective Hispanic homebuyers. Thus, the NAHREP real estate agent regrettably admits that some real estate professionals view these clients as a “waste of their time” and steer away from engaging them or the service providers that assist them.
Marketing Homeownership Services Few providers engage in systematic marketing of their services, and resources for marketing are limited among all the organizations in the case study. Nonetheless, each organization markets their services through ad hoc, grassroots organizing. For example, ACORN Housing began their outreach efforts in earnest last year and started by contacting bank managers and asking them for a list of community leaders. Pastors and other religious leaders were often identified by bank managers. ACORN Housing counselors subsequently conducted over 20 education classes in Orlando area churches over the past year. ACORN Housing counselors also participate in local housing fairs and distribute materials about their program. The organization has had some marketing successes recently, for example, a real estate agent that partners with the organization placed an ad in a local Spanish newspaper and an open house event at the ACRON Housing offices was featured in another local Spanish newspaper. These activities resulted in substantial increase in Hispanic clients.
However, the housing counselor said that non-profit organizations such as ACORN Housing must be creative about their marketing approach because there is very little money available for these types of activities. In addition, the decentralized Hispanic leadership in Orlando poses another obstacle to
Chapter 2. Orlando, FL Case Study 32
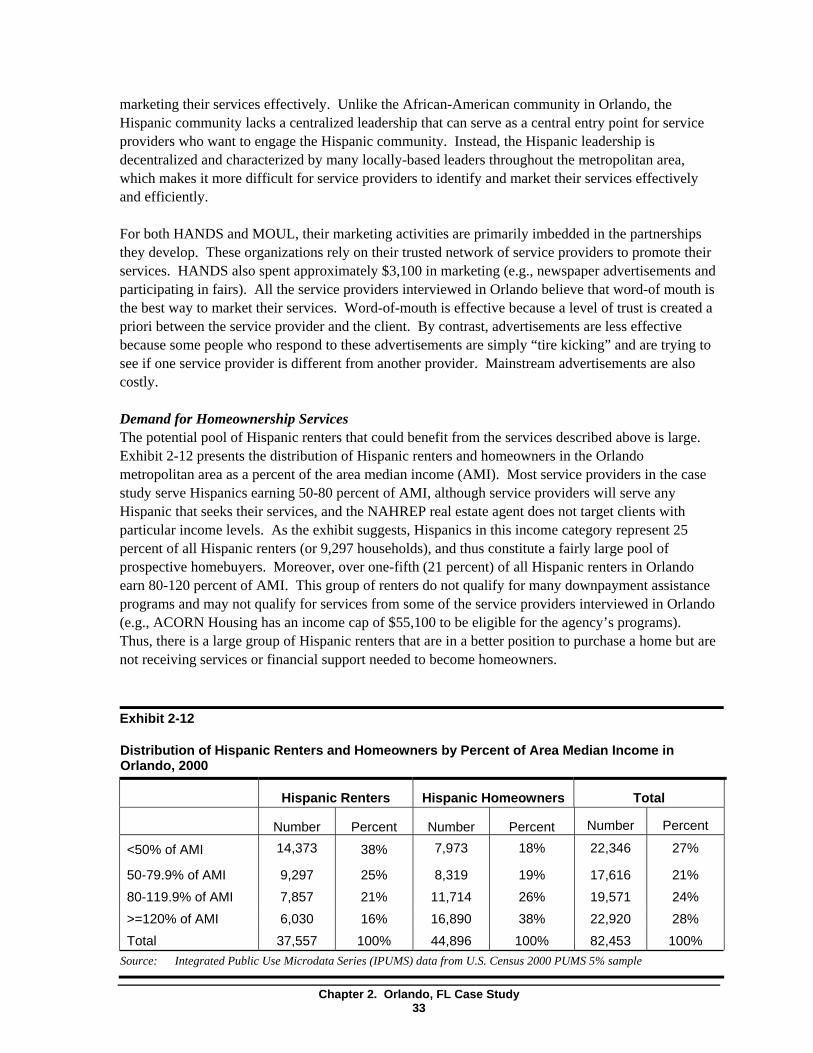
marketing their services effectively. Unlike the African-American community in Orlando, the Hispanic community lacks a centralized leadership that can serve as a central entry point for service providers who want to engage the Hispanic community. Instead, the Hispanic leadership is decentralized and characterized by many locally-based leaders throughout the metropolitan area, which makes it more difficult for service providers to identify and market their services effectively and efficiently.
For both HANDS and MOUL, their marketing activities are primarily imbedded in the partnerships they develop. These organizations rely on their trusted network of service providers to promote their services. HANDS also spent approximately $3,100 in marketing (e.g., newspaper advertisements and participating in fairs). All the service providers interviewed in Orlando believe that word-of mouth is the best way to market their services. Word-of-mouth is effective because a level of trust is created a priori between the service provider and the client. By contrast, advertisements are less effective because some people who respond to these advertisements are simply “tire kicking” and are trying to see if one service provider is different from another provider. Mainstream advertisements are also costly.
Demand for Homeownership Services The potential pool of Hispanic renters that could benefit from the services described above is large. Exhibit 2-12 presents the distribution of Hispanic renters and homeowners in the Orlando metropolitan area as a percent of the area median income (AMI). Most service providers in the case study serve Hispanics earning 50-80 percent of AMI, although service providers will serve any Hispanic that seeks their services, and the NAHREP real estate agent does not target clients with particular income levels. As the exhibit suggests, Hispanics in this income category represent 25 percent of all Hispanic renters (or 9,297 households), and thus constitute a fairly large pool of prospective homebuyers. Moreover, over one-fifth (21 percent) of all Hispanic renters in Orlando earn 80-120 percent of AMI. This group of renters do not qualify for many downpayment assistance programs and may not qualify for services from some of the service providers interviewed in Orlando (e.g., ACORN Housing has an income cap of $55,100 to be eligible for the agency’s programs). Thus, there is a large group of Hispanic renters that are in a better position to purchase a home but are not receiving services or financial support needed to become homeowners.
Exhibit 2-12
Distribution of Hispanic Renters and Homeowners by Percent of Area Median Income in Orlando, 2000
<50% of AMI
50-79.9% of AMI 80-119.9% of AMI >=120% of AMI Total
Hispanic Renters
Number Percent 14,373 38%
9,297 25% 7,857 21% 6,030 16% 37,557 100%
Hispanic Homeowners
Number Percent 7,973 18%
8,319 19% 11,714 26% 16,890 38% 44,896 100%
Total
Number Percent
22,346 27%
17,616 21% 19,571 24% 22,920 28% 82,453 100%
Source: Integrated Public Use Microdata Series (IPUMS) data from U.S. Census 2000 PUMS 5% sample
Chapter 2. Orlando, FL Case Study 33
Indeed, according to all the service providers interviewed in Orlando, the demand for services among Hispanics is growing. Although ACORN Housing expects to increase its client base in the coming year, the other two housing counseling agencies are operating at full capacity. Staff from both HANDS and MOUL state that they do not have enough resources to meet the growing demand. For example, the executive director of HANDS comments that the organization typically uses most of its HUD funding by June, even though it is intended to support the organization through September. The housing manager at MOUL continues to receive inquires from people who heard about the Faith World seminars, which occurred several months ago. Also, the Hispanic agent describes the demand for services by recalling an event sponsored by NAHREP about eight months earlier in partnership with Univision, a major Spanish television network nationally. The event was a television call-in program called “Linea Ayunda” or “Help Line.” The call-in show was set up in telethon format; in which people could call a 1-800 number and ask questions about the homebuying process. Telephone operators received over 1,000 phone calls during the 1-hour program. Staff at all of these service providers expect the number of Hispanic clients to increase considerably in the future as the Hispanic population in Central Florida continues to grow dramatically.
It is unclear whether the demand for homeownership services has created a service gap in Orlando because of the fragmented nature of the service delivery system in Orlando. Nonetheless, all of the service providers agree that their service networks are severely strained and the long-term capacity to serve the growing Hispanic population is questionable. Recent analyses of Census population estimates for 2004 suggest that the Orlando metropolitan area had the 12th-largest gain in Hispanics since 2000 and Hispanic growth accounts for 47 percent of the metropolitan area’s overall growth (Frey, 2006). This tremendous growth will likely impinge on the service system’s ability to adequately serve potential Hispanic homebuyers.
2.4 Conclusions
The interviews with several key organizations in the Orlando metropolitan area serving Hispanics highlight three main themes. First, homeownership rates and gaps are shaped by the demographic and socioeconomic characteristics of Hispanics living in Orlando. Although most Hispanics in Orlando fare better than their counterparts nationally, the homeownership rate among Puerto Ricans appears to be driving the significantly higher rates and smaller gaps in Orlando when compared to national trends. Puerto Ricans represent over half the total Hispanic population in Orlando and, unlike other Hispanic groups, all Puerto Ricans are legal citizens. Their legal status grants them access to mortgage products that are not available to undocumented Hispanics. Also, many Hispanics work in the tourism industry that may not pay enough for them to purchase a home on their own, but may pay enough to keep Hispanics eligible for low-income downpayment assistance programs. Indeed, compared to the national income distribution, the Hispanic income distribution in Orlando shows a larger share of low- and moderate-income Hispanic households and a lower share of very low- and high-income households.
Second, service providers operate within their preferred network of providers because of the lack of trust among providers metropolitan-wide. The large Hispanic population in Orlando has potentially created more opportunities for housing and mortgage market actors to take advantage of this population. Nearly all interviewed staff discussed the questionable practices of some mortgage brokers and real estate agents, which has caused many of them to recoil into their preferred network
Chapter 2. Orlando, FL Case Study 34
of providers. As a result, the broader network of service providers is fragmented and uncoordinated. However, recent efforts to bring interested agencies together to discuss the needs of low-income households (e.g., the homeownership counseling collaborative and the housing roundtable) are building trusting relationships and laying the foundation for improved service coordination.
Third, despite the best efforts of service providers in Orlando, Hispanic homeownership rates may continue to lag behind whites because of the interaction between housing affordability and Hispanics’ neighborhood preferences. Several interviewed staff mentioned that Hispanics prefer to move into neighborhoods where their friends and families live, and where neighbors share their traditions. Yet, the affordable housing stock is largely concentrated in neighborhoods that are predominantly populated by African-Americans or a different Hispanic group. As a result, Hispanic homeownership rates may continue to be depressed because Hispanics may opt to rent in a neighborhood that is predominantly their Hispanic group, rather than own a home in a neighborhood that is predominantly African-American or other Hispanic.
Chapter 2. Orlando, FL Case Study 35

Chapter 2. Orlando, FL Case Study 36
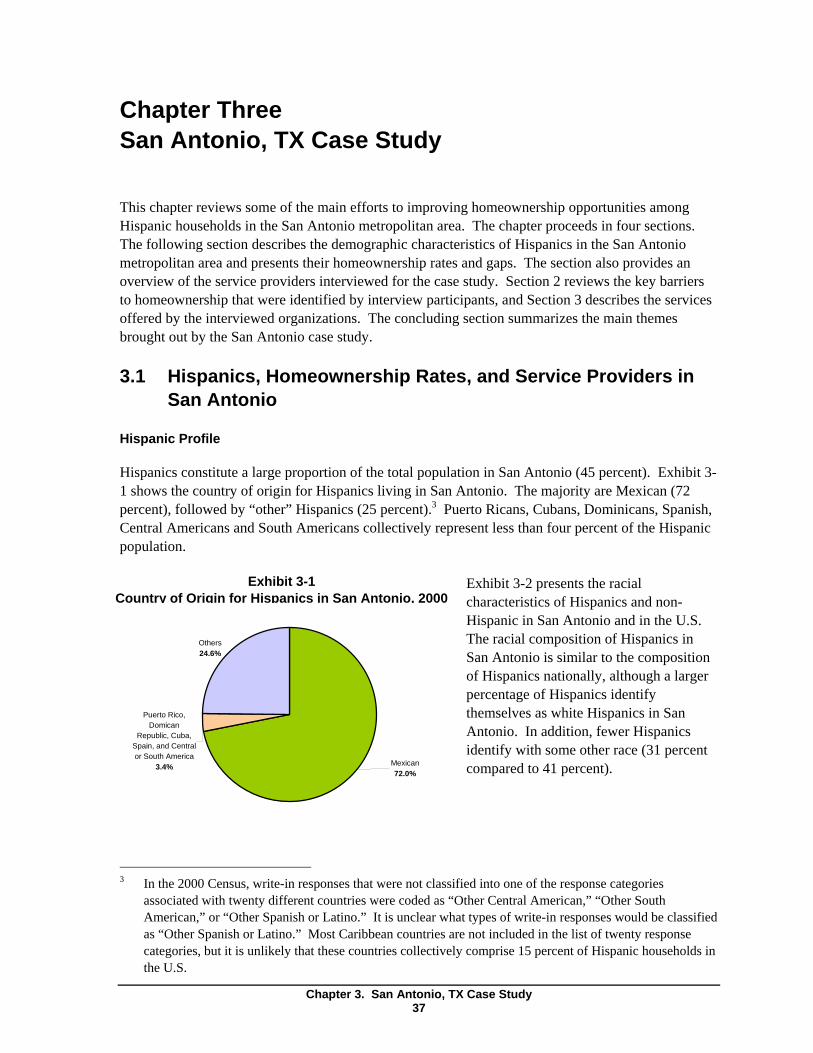
Chapter Three San Antonio, TX Case Study
This chapter reviews some of the main efforts to improving homeownership opportunities among Hispanic households in the San Antonio metropolitan area. The chapter proceeds in four sections. The following section describes the demographic characteristics of Hispanics in the San Antonio metropolitan area and presents their homeownership rates and gaps. The section also provides an overview of the service providers interviewed for the case study. Section 2 reviews the key barriers to homeownership that were identified by interview participants, and Section 3 describes the services offered by the interviewed organizations. The concluding section summarizes the main themes brought out by the San Antonio case study.
3.1 Hispanics, Homeownership Rates, and Service Providers in San Antonio
Hispanic Profile
Hispanics constitute a large proportion of the total population in San Antonio (45 percent). Exhibit 31 shows the country of origin for Hispanics living in San Antonio. The majority are Mexican (72 percent), followed by “other” Hispanics (25 percent).3 Puerto Ricans, Cubans, Dominicans, Spanish, Central Americans and South Americans collectively represent less than four percent of the Hispanic population.
Exhibit 3-1 Exhibit 3-2 presents the racial Country of Origin for Hispanics in San Antonio, 2000 characteristics of Hispanics and non-
Hispanic in San Antonio and in the U.S. Others The racial composition of Hispanics in 24.6% San Antonio is similar to the composition
of Hispanics nationally, although a larger percentage of Hispanics identify
Puerto Rico, themselves as white Hispanics in San Domican
Republic, Cuba, Antonio. In addition, fewer Hispanics Spain, and Central identify with some other race (31 percent or South America
Mexican3.4% compared to 41 percent). 72.0%
In the 2000 Census, write-in responses that were not classified into one of the response categories associated with twenty different countries were coded as “Other Central American,” “Other South American,” or “Other Spanish or Latino.” It is unclear what types of write-in responses would be classified as “Other Spanish or Latino.” Most Caribbean countries are not included in the list of twenty response categories, but it is unlikely that these countries collectively comprise 15 percent of Hispanic households in the U.S.
Chapter 3. San Antonio, TX Case Study 37
3
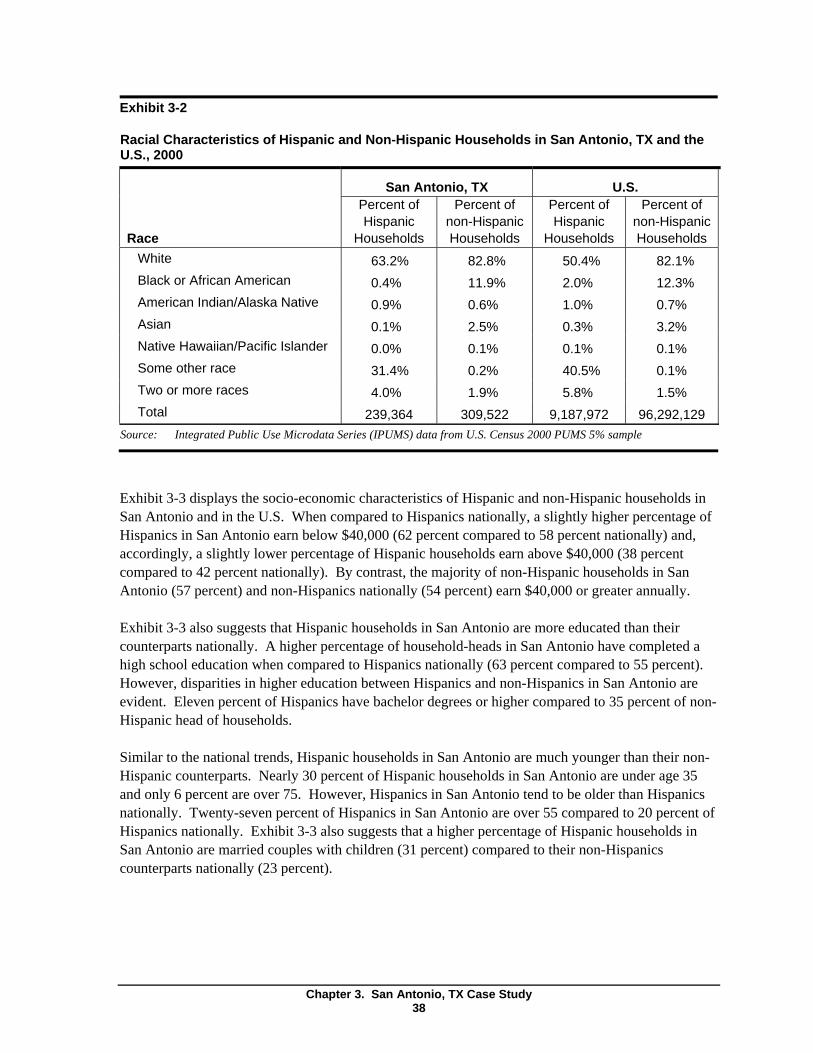
Exhibit 3-2
Racial Characteristics of Hispanic and Non-Hispanic Households in San Antonio, TX and the U.S., 2000
Race White Black or African American American Indian/Alaska Native Asian Native Hawaiian/Pacific Islander Some other race Two or more races Total
San Antonio, TX Percent of Hispanic
Households
Percent of non-Hispanic Households
63.2% 82.8% 0.4% 11.9% 0.9% 0.6% 0.1% 2.5% 0.0% 0.1% 31.4% 0.2% 4.0% 1.9%
239,364 309,522
U.S. Percent of Hispanic
Households
Percent of non-Hispanic Households
50.4% 82.1% 2.0% 12.3% 1.0% 0.7% 0.3% 3.2% 0.1% 0.1% 40.5% 0.1% 5.8% 1.5%
9,187,972 96,292,129 Source: Integrated Public Use Microdata Series (IPUMS) data from U.S. Census 2000 PUMS 5% sample
Exhibit 3-3 displays the socio-economic characteristics of Hispanic and non-Hispanic households in San Antonio and in the U.S. When compared to Hispanics nationally, a slightly higher percentage of Hispanics in San Antonio earn below $40,000 (62 percent compared to 58 percent nationally) and, accordingly, a slightly lower percentage of Hispanic households earn above $40,000 (38 percent compared to 42 percent nationally). By contrast, the majority of non-Hispanic households in San Antonio (57 percent) and non-Hispanics nationally (54 percent) earn $40,000 or greater annually.
Exhibit 3-3 also suggests that Hispanic households in San Antonio are more educated than their counterparts nationally. A higher percentage of household-heads in San Antonio have completed a high school education when compared to Hispanics nationally (63 percent compared to 55 percent). However, disparities in higher education between Hispanics and non-Hispanics in San Antonio are evident. Eleven percent of Hispanics have bachelor degrees or higher compared to 35 percent of non-Hispanic head of households.
Similar to the national trends, Hispanic households in San Antonio are much younger than their non-Hispanic counterparts. Nearly 30 percent of Hispanic households in San Antonio are under age 35 and only 6 percent are over 75. However, Hispanics in San Antonio tend to be older than Hispanics nationally. Twenty-seven percent of Hispanics in San Antonio are over 55 compared to 20 percent of Hispanics nationally. Exhibit 3-3 also suggests that a higher percentage of Hispanic households in San Antonio are married couples with children (31 percent) compared to their non-Hispanics counterparts nationally (23 percent).
Chapter 3. San Antonio, TX Case Study 38
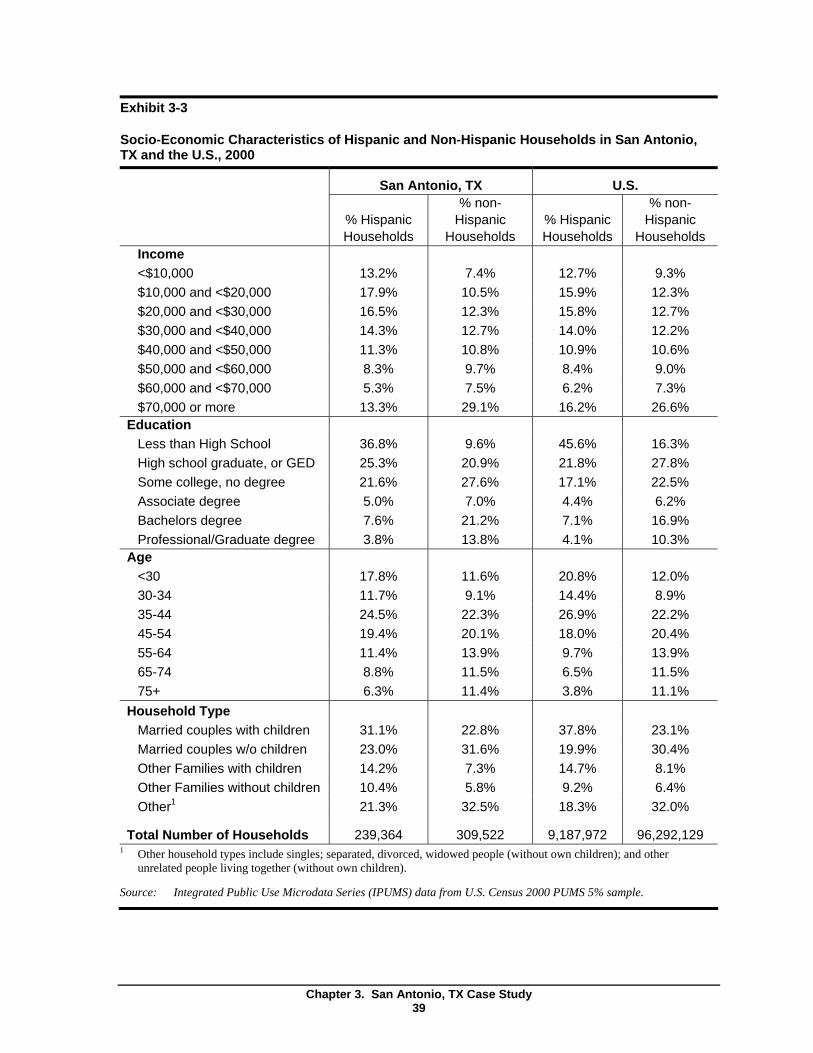
Exhibit 3-3
Socio-Economic Characteristics of Hispanic and Non-Hispanic Households in San Antonio, TX and the U.S., 2000
San Antonio, TX U.S.
% Hispanic Households
% non-Hispanic
Households % Hispanic Households
% non-Hispanic
Households Income <$10,000 $10,000 and <$20,000 $20,000 and <$30,000 $30,000 and <$40,000 $40,000 and <$50,000 $50,000 and <$60,000 $60,000 and <$70,000 $70,000 or more
13.2% 17.9%16.5%14.3%11.3%8.3%5.3%13.3%
7.4% 10.5% 12.3% 12.7% 10.8% 9.7% 7.5%
29.1%
12.7% 15.9% 15.8% 14.0% 10.9% 8.4% 6.2% 16.2%
9.3% 12.3% 12.7% 12.2% 10.6% 9.0% 7.3%
26.6% Education
Less than High School High school graduate, or GED Some college, no degree Associate degree Bachelors degree Professional/Graduate degree
36.8% 25.3% 21.6% 5.0%7.6%3.8%
9.6% 20.9% 27.6% 7.0%
21.2% 13.8%
45.6% 21.8% 17.1% 4.4% 7.1% 4.1%
16.3% 27.8% 22.5% 6.2%
16.9% 10.3%
Age <30 30-3435-4445-5455-6465-7475+
17.8% 11.7% 24.5% 19.4% 11.4% 8.8% 6.3%
11.6% 9.1%
22.3% 20.1% 13.9% 11.5% 11.4%
20.8% 14.4% 26.9% 18.0% 9.7% 6.5% 3.8%
12.0% 8.9%
22.2% 20.4% 13.9% 11.5% 11.1%
Household Type Married couples with children Married couples w/o children Other Families with children Other Families without children Other1
Total Number of Households
31.1% 23.0% 14.2% 10.4% 21.3%
239,364
22.8% 31.6% 7.3% 5.8%
32.5%
309,522
37.8% 19.9% 14.7% 9.2% 18.3%
9,187,972
23.1% 30.4% 8.1% 6.4%
32.0%
96,292,129 Other household types include singles; separated, divorced, widowed people (without own children); and other unrelated people living together (without own children).
Source: Integrated Public Use Microdata Series (IPUMS) data from U.S. Census 2000 PUMS 5% sample.
Chapter 3. San Antonio, TX Case Study 39
1
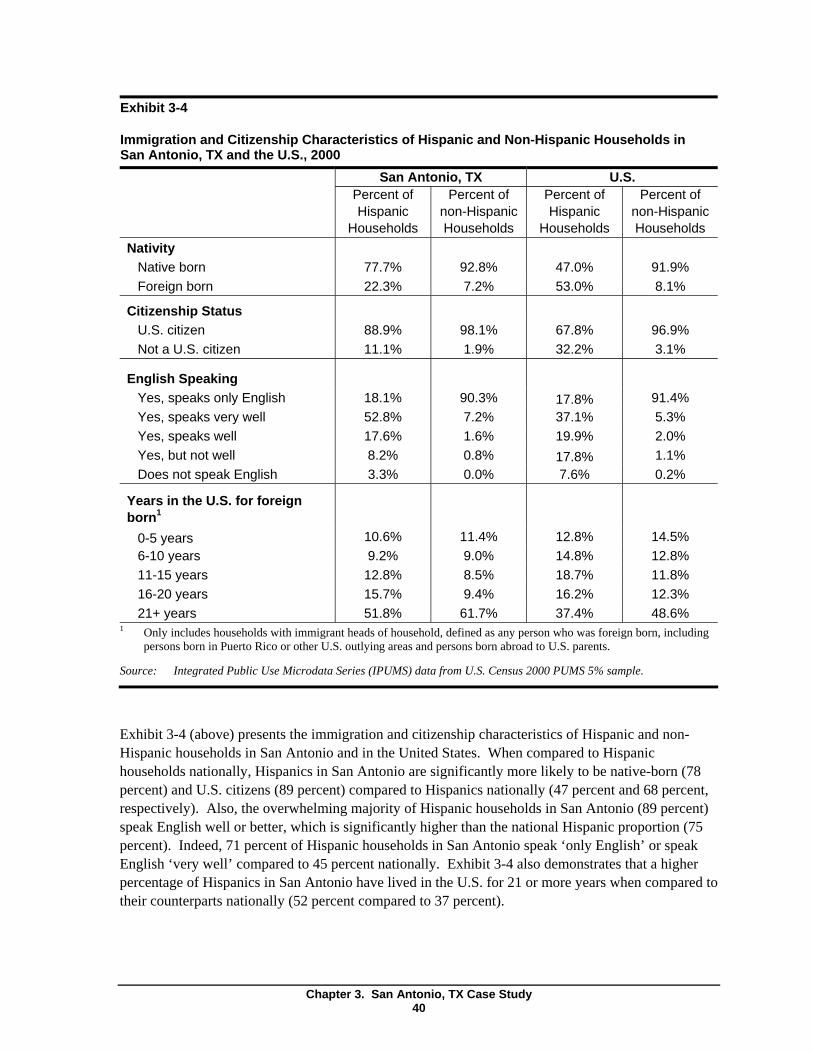
1
Exhibit 3-4
Immigration and Citizenship Characteristics of Hispanic and Non-Hispanic Households in San Antonio, TX and the U.S., 2000
San Antonio, TX U.S. Percent of Hispanic
Households
Percent of non-Hispanic Households
Percent of Hispanic
Households
Percent of non-Hispanic Households
Nativity Native born Foreign born
77.7% 22.3%
92.8% 7.2%
47.0% 53.0%
91.9% 8.1%
Citizenship Status U.S. citizen Not a U.S. citizen
88.9% 11.1%
98.1% 1.9%
67.8% 32.2%
96.9% 3.1%
English Speaking Yes, speaks only English Yes, speaks very well Yes, speaks well Yes, but not well Does not speak English
18.1% 52.8% 17.6%8.2% 3.3%
90.3% 7.2% 1.6% 0.8% 0.0%
17.8% 37.1% 19.9% 17.8% 7.6%
91.4% 5.3% 2.0% 1.1% 0.2%
Years in the U.S. for foreign born1
0-5 years 6-10 years 11-15 years 16-20 years 21+ years
10.6% 9.2% 12.8% 15.7% 51.8%
11.4% 9.0% 8.5% 9.4%
61.7%
12.8% 14.8% 18.7% 16.2% 37.4%
14.5% 12.8% 11.8% 12.3% 48.6%
Only includes households with immigrant heads of household, defined as any person who was foreign born, including persons born in Puerto Rico or other U.S. outlying areas and persons born abroad to U.S. parents.
Source: Integrated Public Use Microdata Series (IPUMS) data from U.S. Census 2000 PUMS 5% sample.
Exhibit 3-4 (above) presents the immigration and citizenship characteristics of Hispanic and non-Hispanic households in San Antonio and in the United States. When compared to Hispanic households nationally, Hispanics in San Antonio are significantly more likely to be native-born (78 percent) and U.S. citizens (89 percent) compared to Hispanics nationally (47 percent and 68 percent, respectively). Also, the overwhelming majority of Hispanic households in San Antonio (89 percent) speak English well or better, which is significantly higher than the national Hispanic proportion (75 percent). Indeed, 71 percent of Hispanic households in San Antonio speak ‘only English’ or speak English ‘very well’ compared to 45 percent nationally. Exhibit 3-4 also demonstrates that a higher percentage of Hispanics in San Antonio have lived in the U.S. for 21 or more years when compared to their counterparts nationally (52 percent compared to 37 percent).
Chapter 3. San Antonio, TX Case Study 40
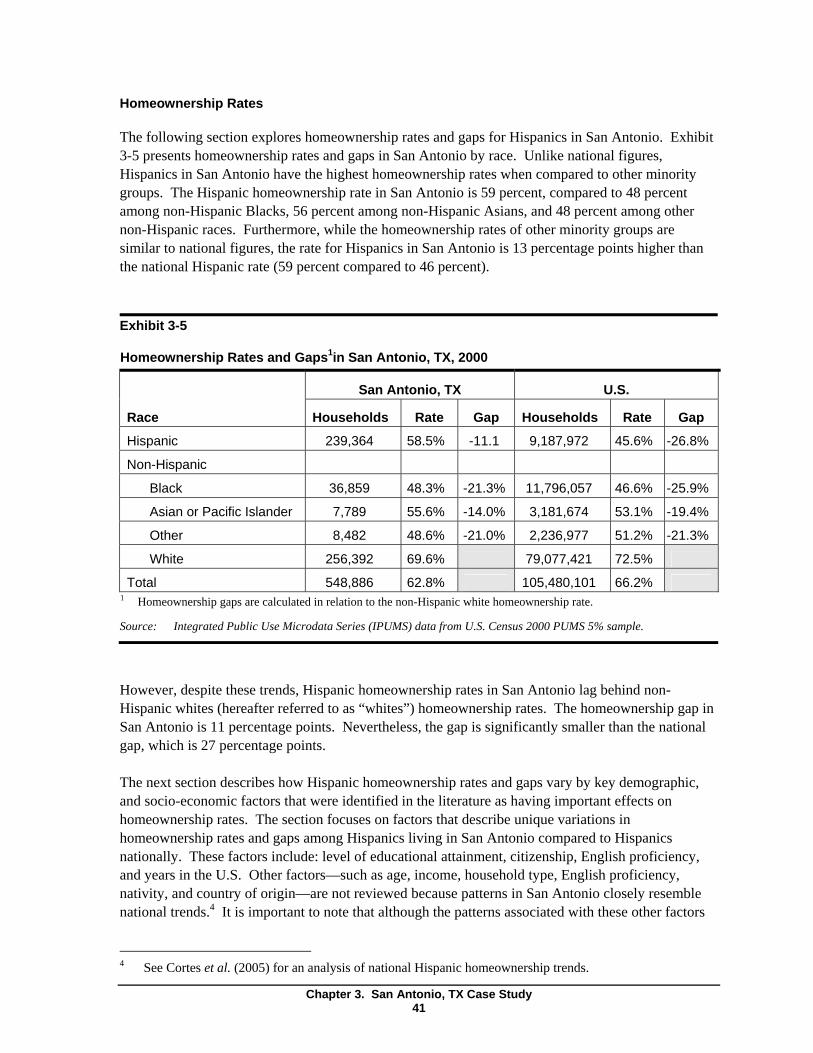
1
Homeownership Rates
The following section explores homeownership rates and gaps for Hispanics in San Antonio. Exhibit 3-5 presents homeownership rates and gaps in San Antonio by race. Unlike national figures, Hispanics in San Antonio have the highest homeownership rates when compared to other minority groups. The Hispanic homeownership rate in San Antonio is 59 percent, compared to 48 percent among non-Hispanic Blacks, 56 percent among non-Hispanic Asians, and 48 percent among other non-Hispanic races. Furthermore, while the homeownership rates of other minority groups are similar to national figures, the rate for Hispanics in San Antonio is 13 percentage points higher than the national Hispanic rate (59 percent compared to 46 percent).
Exhibit 3-5
Homeownership Rates and Gaps1in San Antonio, TX, 2000
Race
Hispanic
Non-Hispanic
Black
Asian or Pacific Islander
Other
White
Total
San Antonio, TX U.S.
Households Rate Gap Households Rate Gap
239,364 58.5% -11.1 9,187,972 45.6% -26.8%
36,859 48.3% -21.3% 11,796,057 46.6% -25.9%
7,789 55.6% -14.0% 3,181,674 53.1% -19.4%
8,482 48.6% -21.0% 2,236,977 51.2% -21.3%
256,392 69.6% 79,077,421 72.5%
548,886 62.8% 105,480,101 66.2% Homeownership gaps are calculated in relation to the non-Hispanic white homeownership rate.
Source: Integrated Public Use Microdata Series (IPUMS) data from U.S. Census 2000 PUMS 5% sample.
However, despite these trends, Hispanic homeownership rates in San Antonio lag behind non-Hispanic whites (hereafter referred to as “whites”) homeownership rates. The homeownership gap in San Antonio is 11 percentage points. Nevertheless, the gap is significantly smaller than the national gap, which is 27 percentage points.
The next section describes how Hispanic homeownership rates and gaps vary by key demographic, and socio-economic factors that were identified in the literature as having important effects on homeownership rates. The section focuses on factors that describe unique variations in homeownership rates and gaps among Hispanics living in San Antonio compared to Hispanics nationally. These factors include: level of educational attainment, citizenship, English proficiency, and years in the U.S. Other factors—such as age, income, household type, English proficiency, nativity, and country of origin—are not reviewed because patterns in San Antonio closely resemble national trends.4 It is important to note that although the patterns associated with these other factors
See Cortes et al. (2005) for an analysis of national Hispanic homeownership trends.
Chapter 3. San Antonio, TX Case Study 41
4
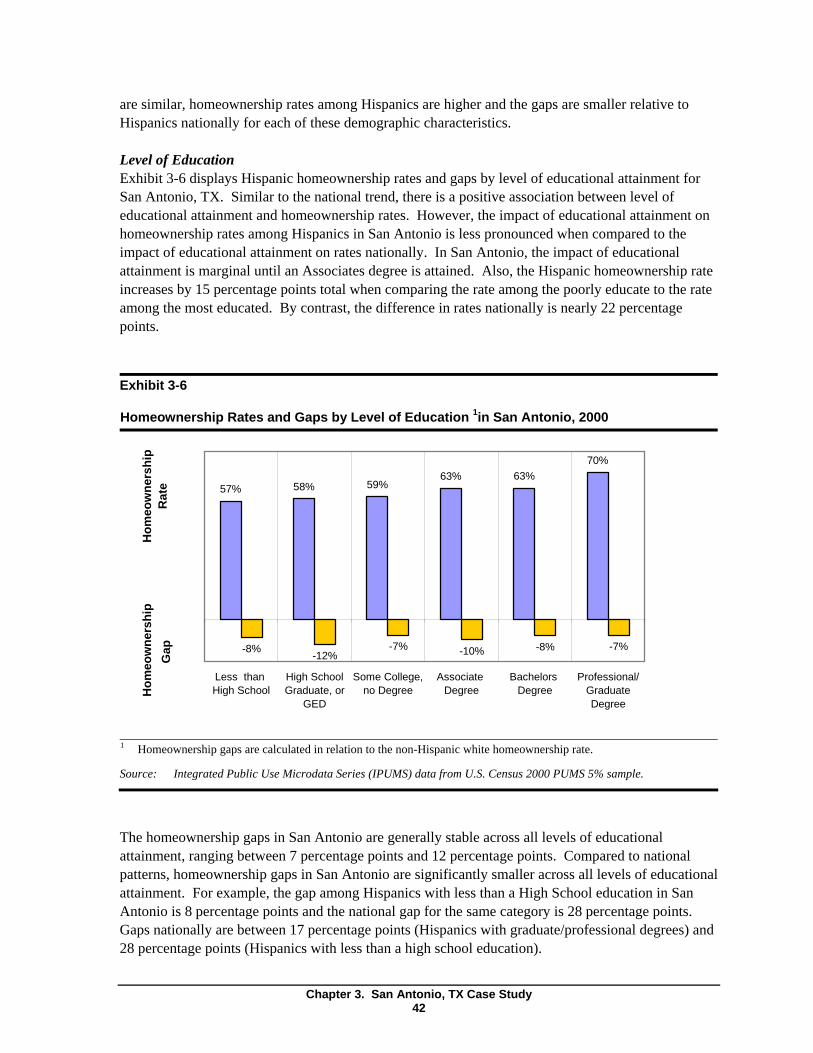
1
are similar, homeownership rates among Hispanics are higher and the gaps are smaller relative to Hispanics nationally for each of these demographic characteristics.
Level of Education Exhibit 3-6 displays Hispanic homeownership rates and gaps by level of educational attainment for San Antonio, TX. Similar to the national trend, there is a positive association between level of educational attainment and homeownership rates. However, the impact of educational attainment on homeownership rates among Hispanics in San Antonio is less pronounced when compared to the impact of educational attainment on rates nationally. In San Antonio, the impact of educational attainment is marginal until an Associates degree is attained. Also, the Hispanic homeownership rate increases by 15 percentage points total when comparing the rate among the poorly educate to the rate among the most educated. By contrast, the difference in rates nationally is nearly 22 percentage points.
Exhibit 3-6
Homeownership Rates and Gaps by Level of Education 1in San Antonio, 2000
Hom
eow
ners
hip
Rat
e H
omeo
wne
rshi
p G
ap
57% 58% 59% 63% 63%
70%
-8% -12% -7% -10% -8% -7%
Less than High School Some College, Associate Bachelors Professional/ High School Graduate, or no Degree Degree Degree Graduate
GED Degree
Homeownership gaps are calculated in relation to the non-Hispanic white homeownership rate.
Source: Integrated Public Use Microdata Series (IPUMS) data from U.S. Census 2000 PUMS 5% sample.
The homeownership gaps in San Antonio are generally stable across all levels of educational attainment, ranging between 7 percentage points and 12 percentage points. Compared to national patterns, homeownership gaps in San Antonio are significantly smaller across all levels of educational attainment. For example, the gap among Hispanics with less than a High School education in San Antonio is 8 percentage points and the national gap for the same category is 28 percentage points. Gaps nationally are between 17 percentage points (Hispanics with graduate/professional degrees) and 28 percentage points (Hispanics with less than a high school education).
Chapter 3. San Antonio, TX Case Study 42
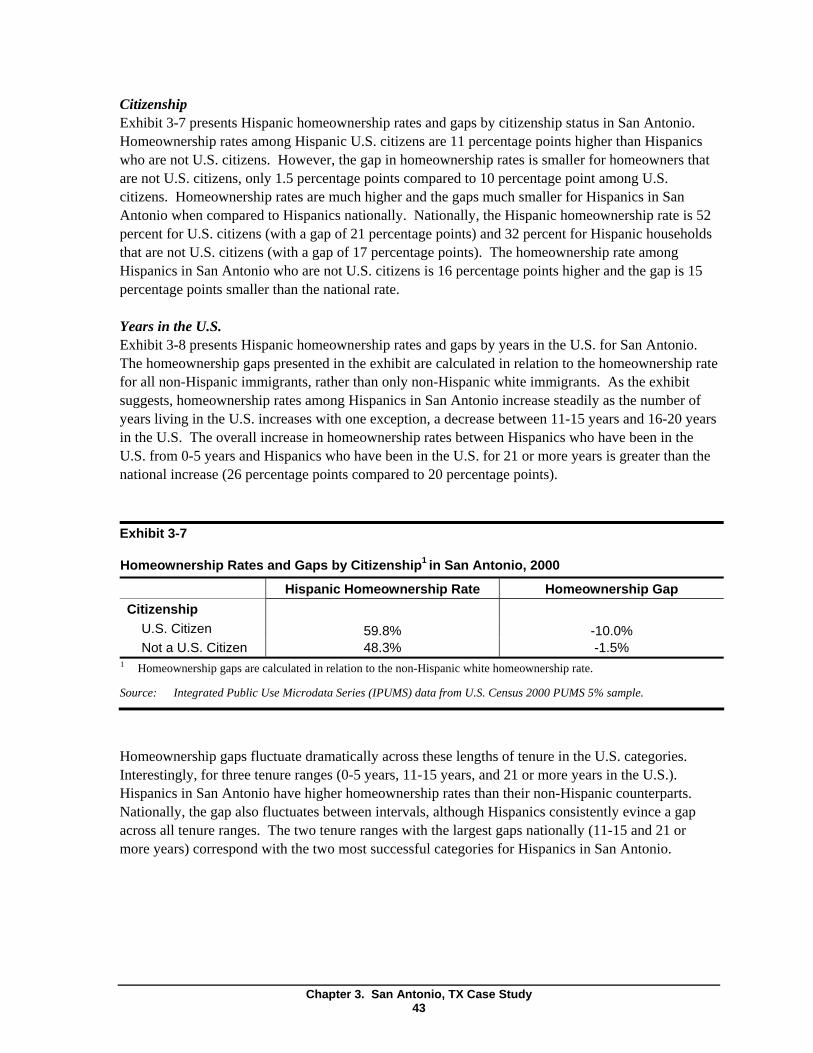
1
Citizenship Exhibit 3-7 presents Hispanic homeownership rates and gaps by citizenship status in San Antonio. Homeownership rates among Hispanic U.S. citizens are 11 percentage points higher than Hispanics who are not U.S. citizens. However, the gap in homeownership rates is smaller for homeowners that are not U.S. citizens, only 1.5 percentage points compared to 10 percentage point among U.S. citizens. Homeownership rates are much higher and the gaps much smaller for Hispanics in San Antonio when compared to Hispanics nationally. Nationally, the Hispanic homeownership rate is 52 percent for U.S. citizens (with a gap of 21 percentage points) and 32 percent for Hispanic households that are not U.S. citizens (with a gap of 17 percentage points). The homeownership rate among Hispanics in San Antonio who are not U.S. citizens is 16 percentage points higher and the gap is 15 percentage points smaller than the national rate.
Years in the U.S. Exhibit 3-8 presents Hispanic homeownership rates and gaps by years in the U.S. for San Antonio. The homeownership gaps presented in the exhibit are calculated in relation to the homeownership rate for all non-Hispanic immigrants, rather than only non-Hispanic white immigrants. As the exhibit suggests, homeownership rates among Hispanics in San Antonio increase steadily as the number of years living in the U.S. increases with one exception, a decrease between 11-15 years and 16-20 years in the U.S. The overall increase in homeownership rates between Hispanics who have been in the U.S. from 0-5 years and Hispanics who have been in the U.S. for 21 or more years is greater than the national increase (26 percentage points compared to 20 percentage points).
Exhibit 3-7
Homeownership Rates and Gaps by Citizenship1 in San Antonio, 2000
Hispanic Homeownership Rate Homeownership Gap Citizenship
U.S. Citizen 59.8% -10.0% Not a U.S. Citizen 48.3% -1.5%
Homeownership gaps are calculated in relation to the non-Hispanic white homeownership rate.
Source: Integrated Public Use Microdata Series (IPUMS) data from U.S. Census 2000 PUMS 5% sample.
Homeownership gaps fluctuate dramatically across these lengths of tenure in the U.S. categories. Interestingly, for three tenure ranges (0-5 years, 11-15 years, and 21 or more years in the U.S.). Hispanics in San Antonio have higher homeownership rates than their non-Hispanic counterparts. Nationally, the gap also fluctuates between intervals, although Hispanics consistently evince a gap across all tenure ranges. The two tenure ranges with the largest gaps nationally (11-15 and 21 or more years) correspond with the two most successful categories for Hispanics in San Antonio.
Chapter 3. San Antonio, TX Case Study 43
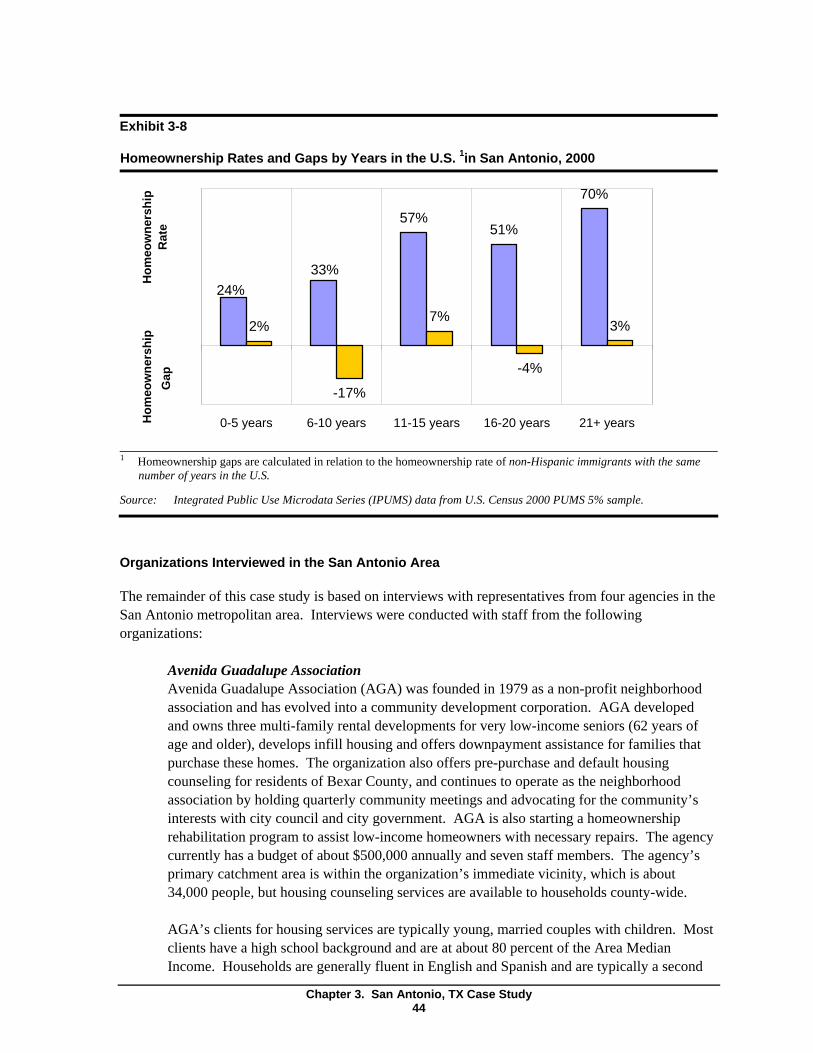
1
Exhibit 3-8
Homeownership Rates and Gaps by Years in the U.S. 1in San Antonio, 2000 H
omeo
wne
rshi
p R
ate
Hom
eow
ners
hip
Gap
57% 51%
70%
2%
-17%
7%
-4%
3%
33% 24%
0-5 years 6-10 years 11-15 years 16-20 years 21+ years
Homeownership gaps are calculated in relation to the homeownership rate of non-Hispanic immigrants with the same number of years in the U.S.
Source: Integrated Public Use Microdata Series (IPUMS) data from U.S. Census 2000 PUMS 5% sample.
Organizations Interviewed in the San Antonio Area
The remainder of this case study is based on interviews with representatives from four agencies in the San Antonio metropolitan area. Interviews were conducted with staff from the following organizations:
Avenida Guadalupe Association Avenida Guadalupe Association (AGA) was founded in 1979 as a non-profit neighborhood association and has evolved into a community development corporation. AGA developed and owns three multi-family rental developments for very low-income seniors (62 years of age and older), develops infill housing and offers downpayment assistance for families that purchase these homes. The organization also offers pre-purchase and default housing counseling for residents of Bexar County, and continues to operate as the neighborhood association by holding quarterly community meetings and advocating for the community’s interests with city council and city government. AGA is also starting a homeownership rehabilitation program to assist low-income homeowners with necessary repairs. The agency currently has a budget of about $500,000 annually and seven staff members. The agency’s primary catchment area is within the organization’s immediate vicinity, which is about 34,000 people, but housing counseling services are available to households county-wide.
AGA’s clients for housing services are typically young, married couples with children. Most clients have a high school background and are at about 80 percent of the Area Median Income. Households are generally fluent in English and Spanish and are typically a second
Chapter 3. San Antonio, TX Case Study 44
generation Mexican family. AGA’s service area also has a high rate of seniors who were first generation immigrants.
Neighborhood Housing Services of San Antonio Neighborhood Housing Services of San Antonio (NHSSA) is a non-profit organization that promotes homeownership through affordable housing development, loan servicing, housing counseling, and a small rehabilitation program for elderly and disabled homeowners. Clients may receive an array of homeownership services, including homeownership counseling, downpayment assistance, and post-purchase education for existing or newly constructed homes. NHSSA serves the City of San Antonio and Bexar County, but most clients who complete their program and successfully purchase a home are within the bounds of Interstate 410, or in the eastern, western, and southern areas of “inner city” San Antonio. The organization has a portfolio of over $13 million in loans, twelve staff, and an $850,000 annual budget.
NHSSA’s client population has shifted from being primarily African American to over 90 percent Hispanic over the past 20 years. NHSSA clients are typically: Hispanic families, just over half of which are single mothers and the remainder are mostly couples with children; U.S. citizens, and only 3 to 5 percent are permanent resident aliens; high school educated; low-income, or about 60 percent of AMI ($26,000 in annual income); fluent or somewhat fluent in English and Spanish; and hold hourly wage jobs. In addition, NHSSA has found that about one in five clients are illiterate.
National Association of Hispanic Real Estate Professionals (NAHREP) – San Antonio Chapter The San Antonio chapter of the National Association of Hispanic Real Estate Professionals (NAHREP) was founded in March 2003 and mirrors the mission of the national organization: “to increase the Hispanic homeownership rate by empowering the real estate professionals that service Hispanic consumers.” NAHREP San Antonio pursues this goal by holding regular association meetings, participating in homebuyers’ fairs and seminars, and providing an opportunity for real estate professionals to network. The organization seeks to provide members with the tools they need to effectively reach out to the Latino community of San Antonio. At the end of 2005, NAHREP San Antonio had about 125 members and the Association’s goal is to reach 200 members by the end of 2006. A NAHREP real estate agent and two loan officers participated in the interview. NAHREP is a volunteer organization and each of the three professionals work for different companies. The interview collected information about NAHREP’s services as an organization, as well as the services provided by each of these interview participants.
The real estate agent and loan officers representing NAHREP reported that about 60 to 70 percent of their clients are Hispanic households that are low- to moderate-income. The typical annual household income is around $40,000. These households are generally looking for homes priced in the $70,000 to $125,000 range and located in neighborhoods throughout the city and county. A majority of Hispanic households are Mexican and most are second generation immigrants who are U.S. citizens. About half are single mothers, while the remainder is comprised of couples with children and other single people.
Chapter 3. San Antonio, TX Case Study 45
Merced Housing Texas Merced Housing Texas is a non-profit organization that was founded in 1995 by eight congregations of Catholic Sisters “to create and strengthen healthy communities by providing quality, affordable, service-enriched housing for individuals and families who are economically poor.” Merced Housing has four program areas, including: eight multi-family rental properties (five of which are in San Antonio); social services for residents of the multifamily properties; a single-family homeownership program where deteriorating homes are acquired, renovated, and sold to low-income families; and an owner-occupied repair program for elderly and disabled homeowners. For the single-family homeownership program Merced Housing’s service area is typically within the Interstate 410 loop where the older housing stock is most in need of rehabilitation.
Merced Housing Texas typically serves low-income, Hispanic households with the single-family homeownership program. Households typically have incomes around $25,000 or 55 percent of AMI; are Mexican or Mexican-Americans; are U.S. citizens; are younger families with children; are high school educated; and are bi-lingual. Clients are typically employed in service-oriented or construction jobs which pay an hourly wage.
The list of HUD-approved counseling agencies identifies eight agencies providing homeownership counseling in San Antonio.5 Of these, two were interviewed for this study (NHSSA and AGA). Based on data on client volumes submitted to HUD, together these agencies accounted for about 10 percent of the Hispanic housing clients served by all of these HUD-approved agencies and about 7 percent of all clients attending pre-purchase workshops. However, neither Merced Housing or NAHREP are included among these HUD-approved agencies.
Exhibit 3-9 displays the distribution of Hispanic renters in San Antonio and the locations of each interviewed organization.6 Hispanic renters are concentrated in the central city, particularly to the south and west of downtown. Each nonprofit service provider is located in an area that has a high percentage of Hispanic renters, suggesting the organizations are geographically situated to assist potential Hispanic homebuyers. The only organization that is outside of the inner city boundary of Interstate 410 is NAHREP whose members reported that they assist clients in every area of the city.
5 The list of HUD-approved counseling agencies was obtained from the HUD Web site (www.hud.gov/offices/hsg/sfh/hcc/hccprof14.cfm).
6 Neighborhoods are represented by census tracts. In the map, tracts are divided into quartiles based on Hispanic renters’ share of all households. The quartiles are defined as follows: tracts in the lowest quartile have between 0 and 6.1 percent Hispanic renters, the second quartile tracts have between 6.1 and 13.7 percent Hispanic renters; the third quartile tracts have between 13.7 and 28.1 percent Hispanic renters, and the top quartile tracts have more than 28.1 percent Hispanic renters.
Chapter 3. San Antonio, TX Case Study 46
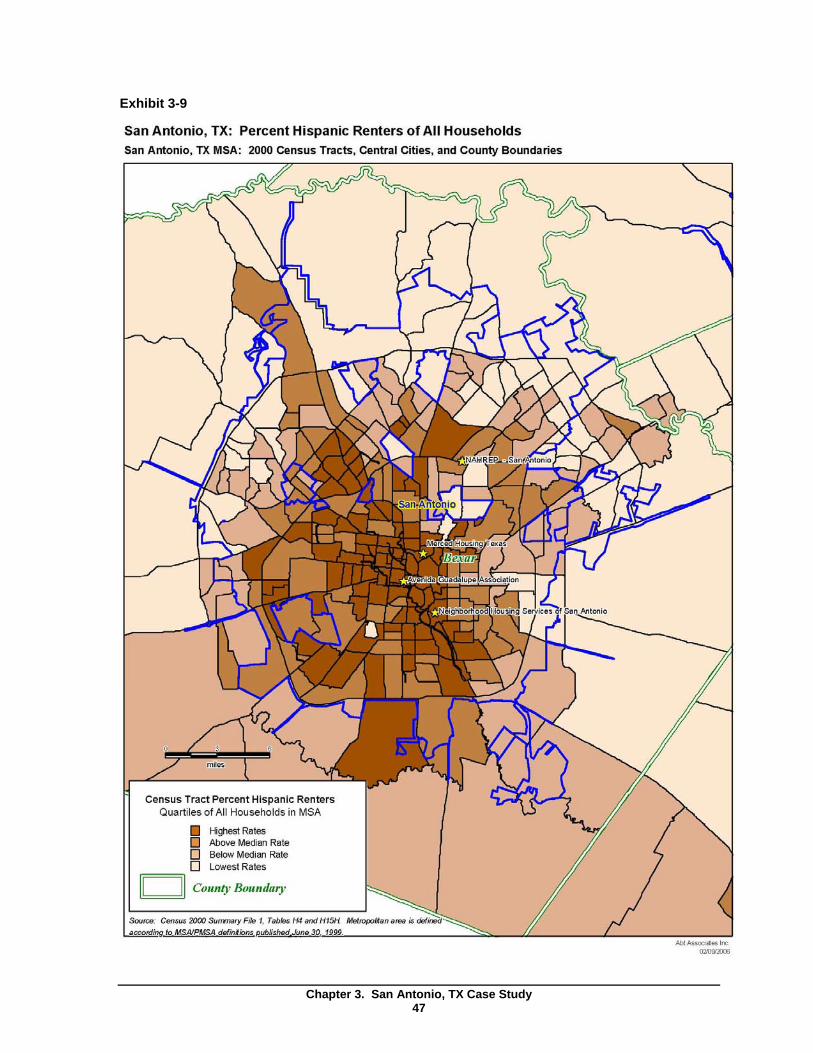
Exhibit 3-9
Chapter 3. San Antonio, TX Case Study47
3.2 Homeownership Barriers
This section briefly reviews the key barriers to homeownership that were identified by interview participants in San Antonio. Overall, respondents identified many of the barriers that are highlighted in the homeownership literature, including a lack of knowledge about the home purchase process; lack of decent, safe, affordable housing; poor credit; and insufficient savings (for a review, see Cortes et al. 2005). Although San Antonio has an affordable housing market when compared to other regions of the United States, the deteriorated condition of existing affordable housing presents a particular barrier to low-income households. These households are often constricted by two impractical homeownership options: low-cost, inadequate housing in the inner city and new construction which is typically out of their price range and located in the northern suburbs.
Lack of Information
One of the most significant barriers to Hispanic homeownership according to respondents in San Antonio is an overall lack of information about, and distrust of, the home purchase process and financial institutions. Typically, the Hispanic households served by these agencies:
• Do not understand the overall home purchase process. Respondents agree that low-income Hispanic clients are generally not familiar with the home purchase process. One loan officer spends an hour with clients explaining the process and distributes a flow chart to help them track their progress towards becoming a homeowner. Respondents also note that clients are often hesitant to question the process and the services they are receiving, even when they are unsure of the situation. Many clients are afraid to “rock the boat” by asking questions or are nervous that an unexpected occurrence will ultimately prevent the purchase.
• Have poor financial skills or a lack of knowledge about financial institutions in the United States. Poor financial literacy among Hispanics is rooted in a general lack of understanding of financial institutions in the United States. Staff from one organization note that financial literacy and habits differ between first and second generation Hispanic households. First generation households might distrust and avoid financial systems in the United States even after being in the country for several years, while second generation households tend to become overly indebted, establishing poor credit histories. Households with poor credit histories often do not understand the implications of signing contracts and establishing credit. Ultimately, the lack of financial knowledge places Hispanics in a vulnerable position, which makes them susceptible to predatory lending practices and may discourage some Hispanics from pursuing homeownership opportunities.
• Believe that homeownership is out of their reach due to a lack of credit, poor credit histories, or insufficient savings for a downpayment. Families frequently believe homeownership is not a viable option because many incorrectly assume that their financial situation prevents them from becoming homeowners. For example, Hispanics believe that poor credit histories and insufficient savings for a downpayment invariably precludes them from becoming homeowners, and are unaware of flexible mortgage products that address these issues.
Chapter 3. San Antonio, TX Case Study 48
The literature suggests that poor English-speaking skills is one of the main reasons why Hispanics do not understand the homebuying process or fail to engage the U.S. financial system. However, service providers in San Antonio were less certain about the role that English-speaking skills has on knowledge gaps. For example, one respondent reports that most people in the area are bi-lingual, and thus language does not contribute to Hispanics’ knowledge gap. This may be a positive implication of the high concentration of Hispanics in the San Antonio area. Still, the real estate agent and lenders indicate that all legally binding documents are in English and there is a need for bi-lingual homeownership materials, even though Texas requires translation of legal homeownership documents for review by Spanish-speaking buyers. Another respondent notes that clients may not be completely literate in either English or Spanish and, therefore, not entirely comfortable in either language. Exhibit 3-4 suggests that most Hispanics in San Antonio can speak English well, although about 1 out of 10 have poor English-speaking skills.
Housing Market Barriers
Compared to other regions in the country San Antonio offers a relatively affordable housing market with the median sales price of an existing single-family home at $133,400 in 2005, well below the national median house price of $207,300 (National Association of Real Estate Agents, 2006). House price appreciation has also been more moderate in San Antonio, with prices only growing by 13 percent since 2003 compared to 22 percent nationally. However, service providers emphasize two major housing market barriers to Hispanic homeownership: the deteriorated condition of the existing housing stock and an unbalanced ratio of household income to housing prices, which results in affordability issues for low-income households.
First, respondents report that much of the housing stock in San Antonio’s Hispanic neighborhoods is in poor condition. Neighborhoods located in the east, west, and south sides or the “inner” city are distressed, with the existing affordable housing stock being inadequate and unsafe. Service providers admit that a family could purchase a home on the west side for about $25,000, but the home would need expensive repairs. Also, the lack of satisfactory housing and other in neighborhood eyesores impede revitalization efforts by discouraging households from staying or moving into these neighborhoods. According to an interview respondent, the growth rate for new residential construction has been about 2 percent since 1960 on the west side of San Antonio, compared to about 20 percent on the more affluent north side. Service providers believe, however, that market demand exists in these distressed neighborhoods. Two organizations that build small-scale infill housing report that they easily sell new or renovated homes once they are constructed in these areas.
The deteriorated condition of the existing housing stock also presents barriers for organizations that renovate homes for affordable housing purposes. The actual costs of acquiring and renovating homes in these types of neighborhoods often surpass existing home values, and as a result, home prices increase. Organizations must either subsidize construction costs or provide subsidies to homebuyers to make the purchase affordable.
Second, affordability barriers are closely associated with incomes among prospective Hispanic homebuyers. According to one service provider, San Antonio contains several of the lowest income census tracts in the United States. Respondents report that most clients have hourly, low-wage employment, making it difficult to purchase a suitable home that does not require extensive rehabilitation or maintenance. The escalating costs of land, infrastructure, and construction materials further limit opportunities to develop new affordable homes for low-income populations.
Chapter 3. San Antonio, TX Case Study 49
Mortgage Market Barriers
Respondents routinely cite a lack of credit or poor credit, as well as minimal savings for a downpayment, as barriers to Hispanic homeownership in San Antonio. According to those interviewed, first and second generation Hispanic households use credit differently and typically demonstrate differences in creditworthiness. First generation or foreign-born immigrants often lack a credit history and may not have established a bank account. First generation Hispanics have savings, but their savings account is their “mattress money.” On the other hand, second generation Hispanic households who were born in the United States generally have excessive credit and are overly indebted. These Hispanics lack the savings for a downpayment. In both of these situations, Hispanics have considerable challenges to qualifying for a mortgage.
Also, similar to other regions of the county, undocumented immigrants are underserved in the San Antonio housing market. Due to identification and financial requirements of subsidy programs and conventional mortgage products, all of the organizations that were interviewed are unable to serve undocumented individuals without social security numbers. Only a handful of relatively new mortgage products are available for use with undocumented immigrants. Often times the only way for an undocumented immigrant to purchase a home is through seller financed arrangements, such as a contract for deed, and these informal lease-to-purchase agreements leave immigrant households financially vulnerable. Undocumented immigrants are also vulnerable to unfavorable terms in the subprime lending market.
Lastly, two respondents indicate that some government programs and products deter real estate professionals from accessing them. One loan officer notes that Federal Housing Administration (FHA) mortgage loans are relatively inflexible when compared to other mortgage products. For example, FHA loans do not allow undocumented income, which is common among Hispanic households. Thus, as underwriting requirements have become more flexible among other mortgage products, the loan officer has moved away from using FHA mortgages. In addition, another respondent notes that the City of San Antonio’s downpayment assistance program is too complicated and places a ceiling on the housing price ($89,000), which discourages lenders and real estate agents from using the program. For example, multiple inspections are required and the forgivable loan formula is complicated. The respondents believe that real estate professionals would be more likely to use the program for low and moderate-income households if it were less cumbersome and the capped affordable housing price limit was adjusted to better reflect the housing market.
3.3 Homeownership Services in San Antonio
The organizations interviewed in San Antonio provide a variety of homeownership services. Overall, agencies have adopted a supportive model of service provision, where one or more staff persons track and assist a client as the household moves through the home purchase process. The staff person could be a housing counselor, but may be another staff member, a real estate agent, or loan officer. Each respondent mentioned that an education component was part of the provision of services even if it was not a formal course or housing counseling sessions. For example, loan officers generally take the first session with a client to explain the underwriting process and to collect the documentation and information needed for mortgage pre-approval. A real estate agent may take a similar approach, depending on where a household is along the homebuying process. Every respondent routinely referred clients to other industry professionals for services they do not provide. Neighborhood
Chapter 3. San Antonio, TX Case Study 50
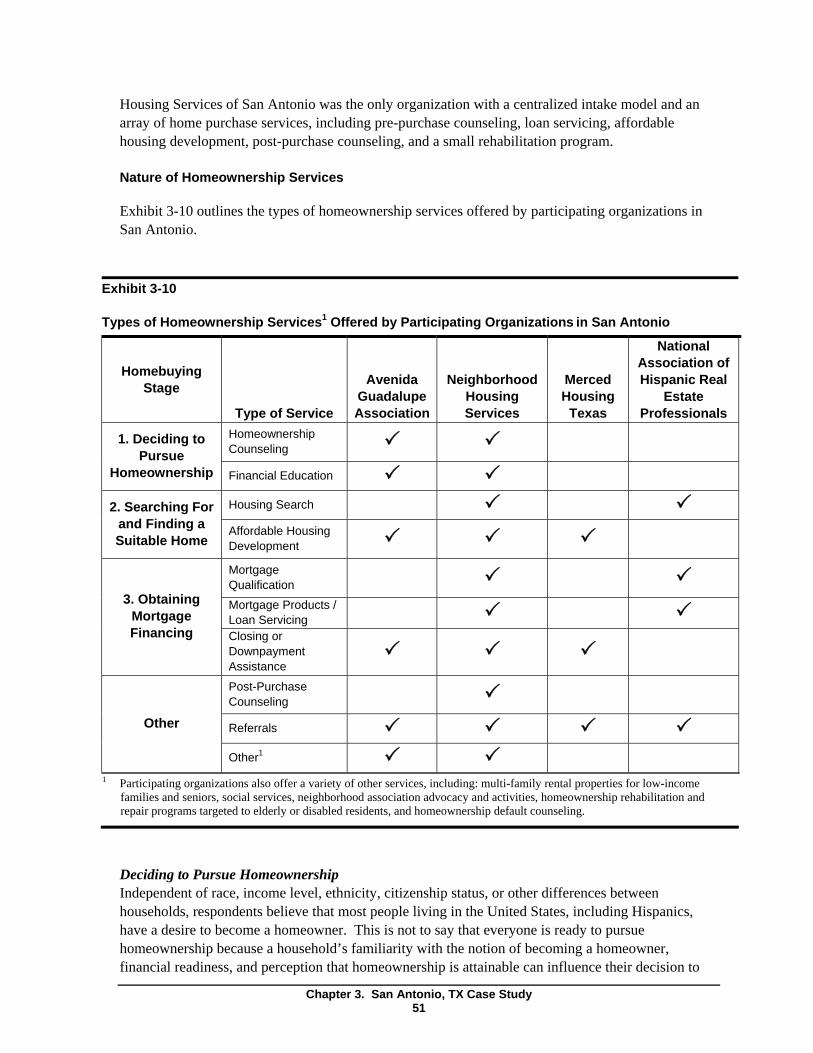
1
Housing Services of San Antonio was the only organization with a centralized intake model and an array of home purchase services, including pre-purchase counseling, loan servicing, affordable housing development, post-purchase counseling, and a small rehabilitation program.
Nature of Homeownership Services
Exhibit 3-10 outlines the types of homeownership services offered by participating organizations in San Antonio.
Exhibit 3-10
Types of Homeownership Services1 Offered by Participating Organizations in San Antonio
Homebuying Stage
Type of Service
Avenida Guadalupe Association
Neighborhood Housing Services
Homeownership Counseling 3 31. Deciding to
Pursue Homeownership Financial Education 3 3
Housing Search 32. Searching For and Finding a Suitable Home
Affordable Housing Development 3 3 Mortgage Qualification 3 Mortgage Products / Loan Servicing 3
3. Obtaining Mortgage Financing Closing or
Downpayment Assistance
3 3
Post-Purchase Counseling 3
Referrals 3 3Other
Other1 3 3
Merced Housing
Texas
3
3
3
National Association of Hispanic Real
Estate Professionals
3
3
3
3
Participating organizations also offer a variety of other services, including: multi-family rental properties for low-income families and seniors, social services, neighborhood association advocacy and activities, homeownership rehabilitation and repair programs targeted to elderly or disabled residents, and homeownership default counseling.
Deciding to Pursue Homeownership Independent of race, income level, ethnicity, citizenship status, or other differences between households, respondents believe that most people living in the United States, including Hispanics, have a desire to become a homeowner. This is not to say that everyone is ready to pursue homeownership because a household’s familiarity with the notion of becoming a homeowner, financial readiness, and perception that homeownership is attainable can influence their decision to
Chapter 3. San Antonio, TX Case Study 51
pursue homeownership opportunities. As one respondent explains, families that have never been exposed to homeownership usually walk through the door without any knowledge of the fundamental steps in the process.
Homeownership Counseling and Financial Education Two of the agencies interviewed in San Antonio, Avenida Guadalupe Association and Neighborhood Housing Services of San Antonio, provide housing counseling for clients. Merced Housing Texas and representatives from NAHREP do not counsel clients themselves, but routinely refer clients to housing counseling and financial education programs.
AGA offers group and one-on-one counseling for clients. The group classes are HUD-certified and typically include presentations by a lender, real estate agent, insurance agent, home inspector, and a representative from a utility company in two, four-hour sessions. The class is offered monthly with about 12 participants and has a maximum capacity of 20 participants per class. Classes provide information about the home purchase process, including information on credit and finances, mortgage qualification, housing search, fair housing issues, energy conservation, and home maintenance. The classes are open to residents of Bexar County to households of any income level and are offered in English or Spanish by bi-lingual presenters. A large majority of AGA’s participants are Hispanic (about 98%). Most attendees live outside the agency’s immediate service area (about 90%).
One-on-one pre-purchase counseling is available once a household has attended the group counseling class and agency staff generally encouraged households with credit issues to attend one-on-one counseling. About half of the families that attend group courses request one-on-one counseling. AGA’s housing counselor sees about five families individually per week. The housing counselor initially meets with the family for about an hour during the first session to pull their credit report and discuss any credit issues. The counselor may write letters of dispute to assist the household in cleaning up these credit issues and continues to work with a household until they are mortgage ready. On average, the process takes about five or six months per client. The AGA counselor has about 20 one-on-one active clients at any given time, and about 25 percent of clients successfully purchase a home. The counseling program has expanded since the current housing counselor took the position about five years ago. AGA now offers default and refinance counseling, as well as pre-purchase counseling. During FY 2004, the agency served a total of 112 families for group and one-on-one counseling.
At Neighborhood Housing Services of San Antonio, one-on-one housing counseling is coordinated with the intake process. A new client is required to submit an application and a credit report fee of $18 to access services. A household’s annual income cannot exceed 80 percent of the area media income to be eligible for services. The housing counselor reviews the application to determine if the household is mortgage-ready and to calculate the maximum loan amount for which the household can qualify. If the household is not mortgage-ready, the housing counselor sends the household a letter identifying the credit or other issues that need to be resolved and also offers to help resolve these issues. If the family is mortgage-ready, the housing counselor sends a letter scheduling an appointment. During the appointment, the housing counselor reviews:
• The basics of homeownership and the underwriting process, including the four Cs – credit history, capacity to repay a loan, cash for a downpayment, and collateral for the loan;
Chapter 3. San Antonio, TX Case Study 52
• The household’s credit report, showing the family how to read it;
• The homebuying programs NHSSA offers and what the different payment structures would mean for the household (only if the household is mortgage ready); and
• Develops a plan to help the family achieve homeownership.
Once a mortgage-ready household decides which program best fits their needs, their application is sent for review by NHSSA’s in-house underwriter. When the loans are originated, the housing counselor introduces the household to the real estate agent at NHSSA (if the family does not already have an agent) and the family can begin the housing search process. Mortgage-ready households are referred to the group homebuyer-training course.
NHSSA offers a group housing counseling class that is required for families receiving second or third mortgage assistance through the agency. The group class is a nine-hour, HUD-approved course that reviews different aspects of the home purchase process and includes the following components:
• Are you ready to buy a home?;
• Budgeting and credit;
• Shopping for a home;
• Getting a mortgage loan;
• Keeping your home and managing your finances; and
• Home maintenance.
NHSSA offers the class at least once per month with 12 to 15 households attending each class. Hispanic households comprise a majority of NHSSA’s clients (92%). The group classes are offered in English and Spanish with bi-lingual instructors. Spanish-only classes are offered if a portion of clients feel more comfortable attending a class in Spanish, although participants are usually bi-lingual and the housing counselor has only experienced a few occasions where a client did not speak any English. For each session the housing counselor schedules two sets of presenters. Presenters include a variety of real estate professionals, such as real estate agents and lenders.
With the exception of the organization’s loan servicing, every NHSSA service is provided on-site within their Homeownership Center, which is a one-stop-shop for intake, loan application, initial processing, housing counseling, and closing assistance. The only off-site activity that a household eventually has to complete is filling out a loan application for the primary mortgage at one of NHSSA’s four banking partners, which is discussed below.
In addition to pre-purchase counseling, NHSSA also offers post-purchase classes that review the importance of asset allocation, tax benefits of homeownership, basic home repair, tips on being a good neighbor, and advice about avoiding predatory lending. Post-purchase classes are taught by a team of individuals. A hands-on workshop is located on-site to show clients how to complete routine maintenance. The workshop includes stations where participants can practice changing locks, basic plumbing repair, hot water heater maintenance, and other home repair and maintenance activities. Participants receive a homeownership manual that was developed by NHS. To encourage
Chapter 3. San Antonio, TX Case Study 53
participation, NHSSA collects a $200 fee for post-purchase counseling at each closing, which is returned to the client in the form of cash and Sears gift cards if the household attends the class.7 Sears also provided resources to construct the workshop, develop the manual, and hold the classes.
Searching For and Finding a Suitable Home Finding safe, decent, affordable housing in San Antonio can be a challenge, especially for low-income families. Existing homes often requires expensive rehabilitation, while new construction may be out of a household’s price range or in a newer neighborhood that would require the family to relocate. All four of the agencies interviewed in San Antonio provide services to address housing market barriers, including help searching for a home and affordable housing development and rehabilitation.
Housing Search NHSSA and the real estate agent from NAHREP San Antonio provide housing search services to households in Bexar County. NHSSA recently hired an in-house agent to assist clients with the housing search process and to recruit a pool of agents willing to work with NHSSA clients. The organization decided to create the position after acknowledging that some clients were not receiving adequate real estate agent services. For example, a few clients settled on homes despite concerns from NHSSA staff about the housing search process and a few other clients did not receive a thorough home inspection. Staff explains that a natural tension exists between the role of real estate agents and the intent of the program. Agents want to close on homes and receive a commission, but clients require a patient real estate agent who is willing to take the time necessary to explain the process and continue looking for an appropriate home.
The co-founder of NAHREP San Antonio recently opened a new real estate office in San Antonio that is a branch office to the largest Latino-owned real estate company in Texas and the second largest in the country. The San Antonio office provides bi-lingual realty services to households in the San Antonio area. According to the NAHREP real estate agent, one of the main reasons why the office was founded is to increase homeownership opportunities among Hispanics in San Antonio.
Affordable Housing Rehabilitation and Development Both AGA and NHSSA develop safe, decent affordable housing in the San Antonio metropolitan area and in Bexar County.
AGA operates a small infill-housing program that constructs affordable housing within the bounds of the agency’s service area. The organization has developed seven single-family homes in the past three years. The lack of available, affordable lots is an ongoing challenge, but AGA staff have discovered that a viable market for new construction exists within their surrounding neighborhood. In the next few years, AGA will be collaborating with the City and local non-profits to develop a total of 49 homes in a large tract of land close to the agency’s service area. AGA will act as a developer for six to eight of the homes.
Similarly, NHSSA develops new affordable housing in the San Antonio area and plans to develop 40 to 50 new homes each year through 2007. As a developer, the organization purchases and assembles tracts of land, collaborates with surrounding communities to plan the developments, completes site
Sears is a national sponsor for Neighborhood Works Post-purchase Counseling program.
Chapter 3. San Antonio, TX Case Study 54
7
work and infrastructure, and manages the construction of the homes. NHSSA often partners with other non-profits to build the developments, especially when constructing affordable housing in areas of the city where the private sector will not build. Clients use the organization’s subsidy programs (described below) to make the purchase of a newly constructed home more affordable to low-income households.
Merced Housing Texas acquires and renovates affordable housing in the “inner city” area of San Antonio. The organization sells the homes for approximately $60,000 by subsidizing the renovation with private donations and paying for all, or a portion of, the buyer’s closing costs. Merced Housing has finished fifteen homes total, and two homes are currently under construction. The organization is continuously looking for properties to purchase and rehabilitate. Merced often works with neighborhood and community associations to identify properties for rehabilitation.
Merced finances the rehabilitations with a line of credit, which requires buyers to qualify for a conventional, fixed-rate mortgage. Merced refers interested households to local lenders. One lender offers an affordable housing mortgage product and the other is an FHA lender. If the household is not initially approved for a loan, Merced staff will work with the household and lender to identify what steps need to be taken to secure approval. If a household is ultimately turned down, Merced refers them to an agency that offers credit and housing counseling and begins looking for another mortgage-ready household. The agency typically reviews fifteen to twenty applicants for each renovated home due to difficulties securing a conventional mortgage.
Once a household qualifies for a mortgage, Merced staff works with the client to negotiate the final sale price of the home. The organization prices the home to cover acquisition and rehabilitation costs, and typically assists the family with closing costs. One of the largest challenges is acquiring and renovating a home while keeping the selling price around $60,000. Merced Housing was recently awarded a $60,000 American Dream Downpayment Initiative (ADDI) grant through the City to be used for downpayment assistance. For each household, up to $10,000 of downpayment and closing costs will be provided. Buyers will be required to attend pre-purchase housing counseling and agree to five years of counseling follow-up after the purchase.
Obtaining Mortgage Financing Qualifying for a mortgage is a critical obstacle to low-and moderate-income Hispanic households who seek homeownership.
Mortgage Qualification Each of the organizations interviewed in San Antonio provide some type of mortgage qualification assistance to clients. Neighborhood Housing Services of San Antonio and Avenida Guadalupe Association provide in-depth, housing counseling assistance to help clients secure mortgage approval. Both organizations provide group and individual housing counseling, and review credit reports with clients. Counselors at both agencies help the household address credit issues that may prevent loan approval.
NHSSA uses a tandem lending model and has formed partnerships with five financial institutions. In the tandem model, downpayment and closing cost assistance is provided by the agency in the form of second and third mortgages, which are serviced by the agency, while the first mortgage is provided by one of the five financial partners. The housing counselor routinely explains details of the programs and products to mortgage-ready clients and assists households with their product decisions. In
Chapter 3. San Antonio, TX Case Study 55
addition, because NHSSA offers loan products, the organization assists clients with no credit history to identify alternative forms of credit, such as rent or utility bills.
Merced Housing and representatives from NAHREP assist clients in a less formal manner than NHSSA and AGA. Merced Housing refers clients to partner lenders and works with the applicant and lender as needed to address the mortgage approval. If a client is not approved, Merced refers the household to a housing counseling agency. In addition, the NAHREP loan officers provide guidance on selecting the most appropriate mortgage product by discussing the benefits and shortcomings of each product.
Mortgage Products None of the agencies interviewed are able to serve illegal immigrants who do not possess a valid Social Security Number (SSN). For example, NHSSA receives funding through government subsidy programs that require citizenship or permanent resident status, and Merced Housing’s line of credit mandates that homebuyers access a fixed-rate mortgage product that requires an SSN. Only representatives of NAHREP and AGA were aware of mortgage products that use an Individual Tax Identification Number (ITIN) instead of a Social Security Number. Nonetheless, a variety of mortgage products and downpayment assistance programs are available through the agencies interviewed in San Antonio or their formal or informal partners.
NHSSA assists clients by providing downpayment and closing cost assistance along with providing access to a first mortgage through one of the agency’s five financial partners. Four banks and one credit union provide annual financial support to NHSSA and offer primary mortgages at fairly low fixed interest rate to NHSSA clients (for example, the rate was 5.95 percent at the time of our interview). NHSSA then offers second and third mortgages to clients depending on whether the client is purchasing new or existing construction. Partner banks meet Community Reinvestment Act (CRA) requirements and also receive a steady stream of referrals from NHSSA. NHSSA typically alternates between the five lenders, unless one of the banks initially referred the client to the program. In this case, the referring lender will issue the first mortgage.
NHSSA offers two mortgage products. One product is available for clients who purchase a new home in a NHSSA development, and a second product is offered to clients who purchase an existing home. Both programs require that the applicant put down the greater of $1,000 or 2 percent of the contracted sales price.
• The First-Time Homebuyer Program is designed for the purchase of a new home in a NHSSA development. The homes range from $70,000 to $85,000. Through this program NHSSA offers a second $15,000 mortgage that is forgiven over time and a third mortgage of $10,000 at a 5 percent fixed interest rate.
• The Second Mortgage Program is targeted to households who purchase a new home built by another developer or an existing home in Bexar County. A household can access a second mortgage totaling 25 percent of the contracted sales price at a 5-percent fixed interest rate. The loan pays for part of the downpayment and closing costs. Any existing home must meet the City of San Antonio building codes and an inspection must be performed by a licensed property inspector.
Chapter 3. San Antonio, TX Case Study 56
NHSSA’s mortgage programs are funded through a City of San Antonio HOME grant. A household’s annual income cannot exceed 80 percent of the area median income, and NHSSA follows firm underwriting guidelines. For example, a family’s monthly mortgage payment cannot be more than 33 percent of their income. NHSSA has discovered that it is important to require a minimal downpayment because the applicant will feel a great stake in their home investment. Additional subsidies may also be available to homebuyers, depending on whether NHSSA has other grant funding available. Extra funding is typically used to help households qualify for better quality house or reduce their monthly mortgage payments.
Merced Housing refers prospective homebuyers to banks for conventional or FHA mortgages. Jefferson State Bank offers the Home Owners Advantage Program to households at or below 80 percent of AMI (Texas Appleseed, 2005). The program offers several options, including: a 30-year fixed loan at a 7-percent interest rate; a 15-year fixed loan at a 9-percent interest rate; and a 30/15balloon loan at a 9-percent interest rate. Each product requires a 5 percent downpayment, but the bank pays for $1,500 of the closing costs. The underwriting guidelines are flexible and the bank accepts alternative credit sources with a stable two-year work history. Staff at Merced Housing reported that the bank tends to warehouse these loans for a period of time and can therefore be more flexible with underwriting because there is no immediate sale of the loan into the secondary mortgage market.
The NAHEP loan officer works for Bank of America and reported that she frequently uses the ACORN partnership product for low- and moderate-income households. The loan officer likes the product because clients are required to attend the housing counseling classes through ACORN. Bank of America offers a 30-year fixed interest rate to families at or below 100 percent of the AMI. The interest rate is typically lower than a conventional mortgage rate. The product requires a 3 percent downpayment, $500 of which must come directly from the borrower and accepts up to $1,200 in undocumented income. The bank accepts alternative lines of credit—including rent, utility, rent-toown, or other regular payments—and requires at least two years of stable employment history. Applicants must be renting a house or apartment and also be able to establish a history of paying rent on time.
Lastly, the City of San Antonio offers a downpayment assistance program for first-time homebuyers called the Homeownership Incentive Program (HIP). HIP offers a maximum $8,000 loan to first-time, income eligible homebuyers in the City of San Antonio at 3-percent interest over five years. A portion of the loan may be forgiven depending on the borrower’s circumstances. Households with 80 percent AMI or below qualify for the loan and households must purchase a home that is $89,000 or less, which is the maximum affordable housing price set by San Antonio City Council.
Closing Assistance Staff from each organization interviewed in San Antonio are available to assist clients with questions or problems through and after the closing process. Merced Housing staff attend client closings, as does the housing counselor at AGA. At NHSSA, closings typically take place in their Homeownership Center and a variety of staff attend the closings, especially because the second and third mortgages are also finalized at that time. The real estate agent and loan officers that represent NAHREP typically attend their clients’ closings. In addition, service providers educate clients about the closing process during the housing counseling class, and some distribute translated copies of sample closing documents to clients.
Chapter 3. San Antonio, TX Case Study 57
Service Provision and Outreach
This section describes the scale of service provision delivered by each organization, the level of service coordination among service providers in the metropolitan area, and the types of outreach that these organizations conduct to market their services. The section also discusses the perceived demand for their services.
Service Provision The housing counseling program at AGA served 121 households in 2004. Ninety-five percent of these clients are Hispanic and about 25 percent of counselees eventually purchase a home. According to AGA staff, none of the counseled households have defaulted on mortgages since the program began five years ago. AGA staff would like to expand the default counseling program, but believe that the current services are effective, with one-on-one counseling having the most impact on families eventually achieving homeownership.
At NHSSA, staff believe that their range of services are generally effective, especially their housing counseling classes. Their educational classes eliminate much of the fear and suspicion that first-time homebuyers frequently experience and provide guidance at each step of the homebuying process. The housing counseling program at NHSSA served 181 households with pre-purchase and post-purchase counseling in FY 2004. NHSSA provided second and third mortgages to about 75 households that closed on homes, and about 95 percent of these households were Hispanic.
Merced Housing Texas staff believe the agency has been effective in creating safe, decent affordable housing and in revitalizing neighborhoods. The organization has completed 15 homes since 1995 and currently has two under construction. All but two of the homes were sold to Hispanic families. Staff would like to renovate a greater number homes, but finding homes that are financially feasible to acquire, rehab, and sell as affordable housing is difficult, especially when competing with private investors. The agency also recognizes that there is a cohort of undocumented households that do not have access to their programs because their conventional fixed-rate mortgages require proper documentation. Staff believe that new, conventional mortgage products targeted to high-risk buyers are needed.
The real estate agent and loan officers representing NAHREP consider their services effective if they educate clients about the home purchase process and help a family close on a home. One loan officer helped 143 families close on homes during 2005. Sixty percent of these families were Hispanic. The other loan officer estimates that he works with about five to ten households per month.
Partnerships and Service Coordination The majority of partnerships among agencies and real estate professionals in San Antonio are informal. Besides NHSSA’s formal partnerships with local financial institutions and two other nationally-based partnerships between companies and non-profit organizations, the remaining working relationships have developed informally. However, service providers comment that the nature of their work demands that professionals and non-profit organizations develop and maintain partnerships within the industry. For example, housing counseling programs continuously cultivate relationships with lenders, real estate agents, and other professionals to participate in their HUD-certified homeownership counseling services and real estate professionals, in turn, are constantly prospecting for new clients. Non-profit organizations need to be confident that clients will be treated with respect by lender and real estate agent partners, and tend to continue working with professionals
Chapter 3. San Antonio, TX Case Study 58
who are sensitive to the needs of their clients. Also, one of NAHREP’s objectives is to encourage networking among real estate professionals that serve Hispanic households. Providing forums for this kind of informal relationship building should foster working partnerships and encourage Hispanic homeownership.
Marketing Homeownership Services Each of the organizations interviewed in San Antonio engage in some type of marketing or outreach effort, including:
• Media advertisements, including public service radio advertisements;
• Print advertisements in newspapers and written media;
• Presentations at community events or educational seminars, like a housing counseling sessions or homebuyers’ fairs;
• Distributing flyers;
• Targeted mass mailings; and
• Outreach with other non-profit organizations or other partners.
Outreach to the Hispanic population is a key part of informing households about available programs and services in San Antonio, as well as influencing their decision to pursue homeownership. Agencies conduct outreach to Hispanic households using a variety of methods, but tend to agree that word of mouth is the most effective marketing tool. One loan officer assisted an entire extended family to qualify for mortgages and close on homes based on such referrals. The loan officers also reported that Spanish-language television commercials advertising mortgage products or homeownership programs have an impact. While major financial institutions have marketing budgets for television campaigns, small non-profit organizations recognize the limitations of more affordable types of advertising and outreach. Neighborhood Housing Services recently began a series of public service radio announcements on one of the Spanish-speaking radio stations in town. All respondents reported that they routinely give presentations at community meetings or attend homebuyer fairs. Referrals between real estate professionals and organizations are also important for both parties.
Two organizations expressed concerns about conducting outreach and marketing their services. Outreach is key, but it is often difficult to effectively target marketing efforts with limited resources and budgets. Another organization expressed concerns over predatory lenders and other predatory financial services that target low-income households. These for-profit companies often have the marketing dollars to reach consumers before non-profit service providers are able to educate consumers and warn them about predatory lending practices.
According to the service providers, print, radio, or television advertisements must emphasize that programs and services are bi-lingual. The real estate agents and loan officers from NAHREP emphasized that bi-lingual printed materials about products and programs are essential. NHSSA staff discovered that listing programs as “Spanish-speaking” has the potential to alienate bi-lingual households that are not comfortable speaking only Spanish or only English. The agency now advertises the housing counseling course and other programs as bi-lingual to help households feel comfortable contacting the agency and attending the class.
Chapter 3. San Antonio, TX Case Study 59
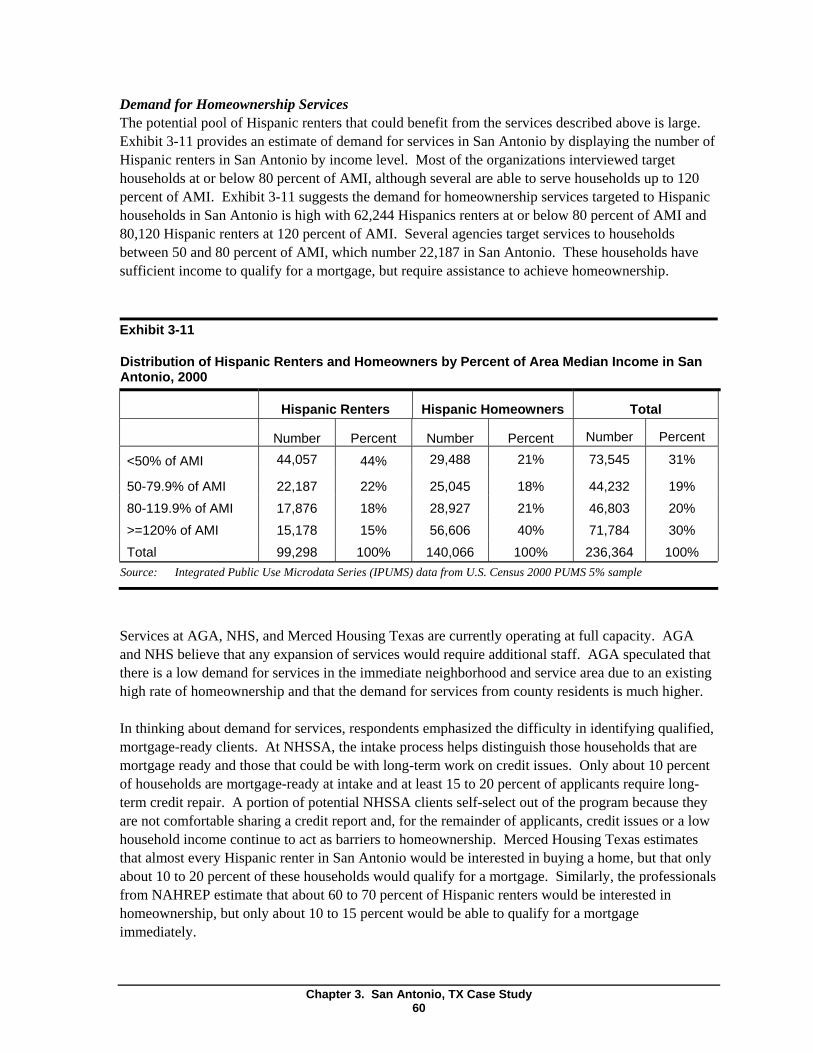
Demand for Homeownership Services The potential pool of Hispanic renters that could benefit from the services described above is large. Exhibit 3-11 provides an estimate of demand for services in San Antonio by displaying the number of Hispanic renters in San Antonio by income level. Most of the organizations interviewed target households at or below 80 percent of AMI, although several are able to serve households up to 120 percent of AMI. Exhibit 3-11 suggests the demand for homeownership services targeted to Hispanic households in San Antonio is high with 62,244 Hispanics renters at or below 80 percent of AMI and 80,120 Hispanic renters at 120 percent of AMI. Several agencies target services to households between 50 and 80 percent of AMI, which number 22,187 in San Antonio. These households have sufficient income to qualify for a mortgage, but require assistance to achieve homeownership.
Exhibit 3-11
Distribution of Hispanic Renters and Homeowners by Percent of Area Median Income in San Antonio, 2000
<50% of AMI
50-79.9% of AMI 80-119.9% of AMI >=120% of AMI Total
Hispanic Renters
Number Percent 44,057 44%
22,187 22% 17,876 18% 15,178 15%99,298 100%
Hispanic Homeowners
Number Percent 29,488 21%
25,045 18% 28,927 21% 56,606 40% 140,066 100%
Total
Number Percent
73,545 31%
44,232 19% 46,803 20% 71,784 30% 236,364 100%
Source: Integrated Public Use Microdata Series (IPUMS) data from U.S. Census 2000 PUMS 5% sample
Services at AGA, NHS, and Merced Housing Texas are currently operating at full capacity. AGA and NHS believe that any expansion of services would require additional staff. AGA speculated that there is a low demand for services in the immediate neighborhood and service area due to an existing high rate of homeownership and that the demand for services from county residents is much higher.
In thinking about demand for services, respondents emphasized the difficulty in identifying qualified, mortgage-ready clients. At NHSSA, the intake process helps distinguish those households that are mortgage ready and those that could be with long-term work on credit issues. Only about 10 percent of households are mortgage-ready at intake and at least 15 to 20 percent of applicants require long-term credit repair. A portion of potential NHSSA clients self-select out of the program because they are not comfortable sharing a credit report and, for the remainder of applicants, credit issues or a low household income continue to act as barriers to homeownership. Merced Housing Texas estimates that almost every Hispanic renter in San Antonio would be interested in buying a home, but that only about 10 to 20 percent of these households would qualify for a mortgage. Similarly, the professionals from NAHREP estimate that about 60 to 70 percent of Hispanic renters would be interested in homeownership, but only about 10 to 15 percent would be able to qualify for a mortgage immediately.
Chapter 3. San Antonio, TX Case Study 60
Demand for services are also influenced by marketing efforts. One respondent believes that adequate homeownership services exist to serve those in need, but that the public is not aware of them, indicating a marketing gap. In addition, organizations find that marketing is a balancing act that may have both positive and negative outcomes. On the one hand, agencies want to serve as many households as possible and improve access to homeownership opportunities. On the other hand, service providers must be careful not to overwhelm staff with a large influx of clients. For example, NHSSA has done mass mailing and radio advertisements for particular developments in the past, which subsequently overwhelmed staff with phone calls and applications. NHSSA also finds that community presentations generate a large volume of interested households.
Nevertheless, the demand for services is expected to grow dramatically as the Hispanic population grows in San Antonio. According to recent analyses of Census population estimates, the San Antonio metropolitan area is ranked 9th in terms of largest Hispanic population, and Hispanics constitute 61 percent of the population under age 15 (Frey, 2006).
3.4 Conclusions
Interviews with organizations that provide homeownership services to low- and moderate-income Hispanic households in San Antonio highlighted three areas of consideration. First, service providers emphasize the lack of safe, decent affordable housing in traditionally Hispanic neighborhoods in San Antonio as a major barrier to homeownership. Although several organizations construct new infill housing or acquire and renovate existing homes, the process is filled with challenges and takes time. In AGA’s service area there is a lack of available and suitable lots. Merced Housing Texas struggles to find properties to acquire and renovate while still keeping the sales price affordable and reasonable for the neighborhood housing market. In addition, organizations that build affordable housing are constantly coping with increases in price of land and construction materials. Although these agencies are making progress, the demand for safe, decent affordable housing in San Antonio outpaces existing production. For example, the interviewed agencies produce approximately 50 housing units per year, and the demand for Hispanic homeownership is 22,187 households among those in the 50 to 80 percent AMI levels alone. This demand is expected to increase as the Hispanic population rises in San Antonio along with continuing economic growth.
Second, financial barriers to Hispanic homeownership vary by first and second generation low- and moderate-income households. First generation Hispanic households typically have no credit histories, no established bank accounts, but large cash savings. They tend to be more suspicious of financial institutions in the U.S. or have had negative experiences in the past. Second generation Hispanic households often have poor credit histories and are unable to save for a downpayment. These households tend to follow the financial patterns of other low- or moderate-income groups in the U.S. by acquiring debt at a young age without fully understanding the implications of credit. Homeownership services need to be flexible enough to address the diverging needs of these two groups.
In addition, immigrant, undocumented households are effectively excluded from accessing homeownership opportunities because most readily available mortgage products require a Social Security Number. Although a few demonstration programs are experimenting with ITIN numbers in lieu of SSN, these products are few in number and difficult to access, and non-profit organizations are generally unaware of new and innovative products that address this niche.
Chapter 3. San Antonio, TX Case Study 61
Lastly, respondents provided insight into the high rate of Hispanic homeownership in San Antonio when compared to the rest of the country. The Hispanic homeownership rate in San Antonio (58.5 percent) is nearly 13 percentage points higher than the national rate (45.6 percent). Respondents believe that the high Hispanic homeownership rate is primarily due to the intersection between the large population of Hispanics in San Antonio and the recent economic boom that the region experiencing. The concentration of Hispanic households in San Antonio appears to reduce the impact of certain barriers. For example, the language barrier is less severe because a significant proportion of people in the area are bi-lingual. Hispanic households are also more likely to speak English than Hispanics in other regions of the country.
Representatives of NAHREP and Merced Housing Texas reported that an influx of industry and job opportunities have boosted the San Antonio economy in the last five to ten years. Hispanic families have benefited from steady, albeit largely low-wage, employment and a low unemployment rate. One respondent also believes that there is a solid middle and working class Hispanic community in San Antonio and thinks this segment of the population could have an impact on the higher Hispanic homeownership rate. In addition to the large population of Hispanics and the economic expansion in the region, the city also offers relatively affordable housing stock, making homeownership a real possibility for low- and moderate-income households.
Chapter 3. San Antonio, TX Case Study 62
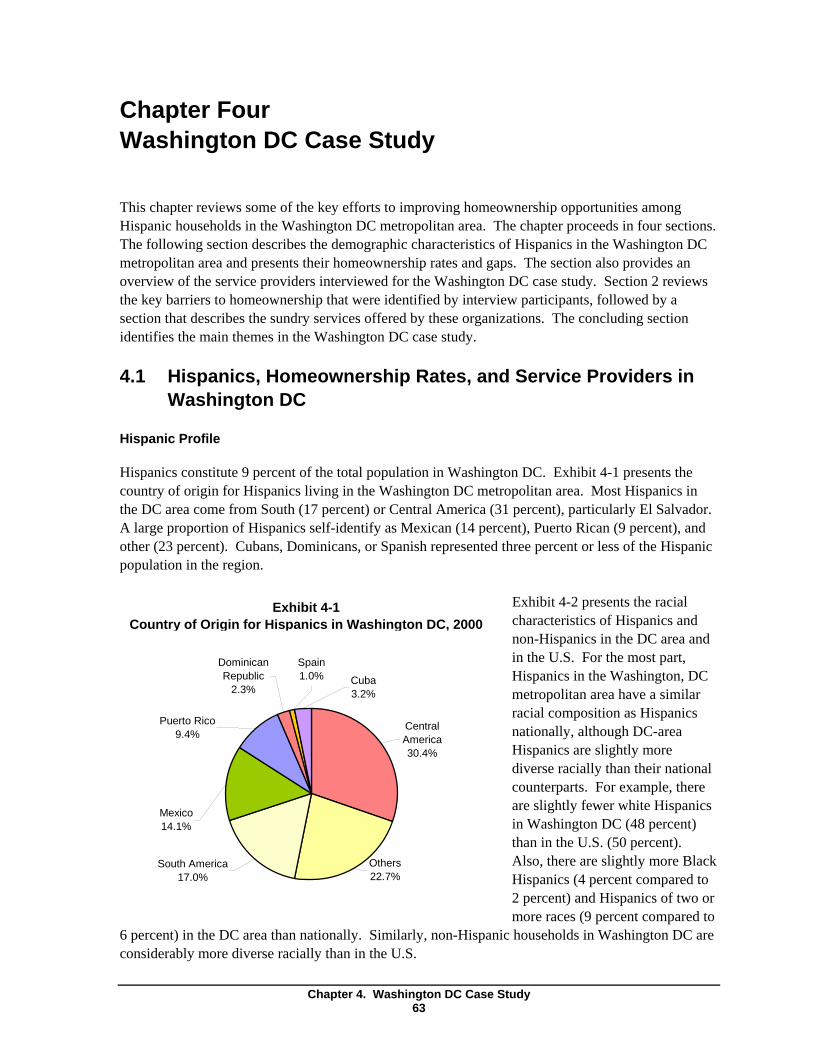
Country of Origin for Hispanics in Washington DC, 2000
Chapter Four Washington DC Case Study
This chapter reviews some of the key efforts to improving homeownership opportunities among Hispanic households in the Washington DC metropolitan area. The chapter proceeds in four sections. The following section describes the demographic characteristics of Hispanics in the Washington DC metropolitan area and presents their homeownership rates and gaps. The section also provides an overview of the service providers interviewed for the Washington DC case study. Section 2 reviews the key barriers to homeownership that were identified by interview participants, followed by a section that describes the sundry services offered by these organizations. The concluding section identifies the main themes in the Washington DC case study.
4.1 Hispanics, Homeownership Rates, and Service Providers in Washington DC
Hispanic Profile
Hispanics constitute 9 percent of the total population in Washington DC. Exhibit 4-1 presents the country of origin for Hispanics living in the Washington DC metropolitan area. Most Hispanics in the DC area come from South (17 percent) or Central America (31 percent), particularly El Salvador. A large proportion of Hispanics self-identify as Mexican (14 percent), Puerto Rican (9 percent), and other (23 percent). Cubans, Dominicans, or Spanish represented three percent or less of the Hispanic population in the region.
Exhibit 4-1 Exhibit 4-2 presents the racial characteristics of Hispanics and non-Hispanics in the DC area and
Dominican Spain in the U.S. For the most part, Republic 1.0% Cuba Hispanics in the Washington, DC
2.3% 3.2% metropolitan area have a similar racial composition as Hispanics Puerto Rico Central
9.4% America nationally, although DC-area 30.4% Hispanics are slightly more
diverse racially than their national counterparts. For example, there are slightly fewer white Hispanics Mexico
14.1% in Washington DC (48 percent) than in the U.S. (50 percent).
South America Others Also, there are slightly more Black 17.0% 22.7% Hispanics (4 percent compared to
2 percent) and Hispanics of two or more races (9 percent compared to
6 percent) in the DC area than nationally. Similarly, non-Hispanic households in Washington DC are considerably more diverse racially than in the U.S.
Chapter 4. Washington DC Case Study 63
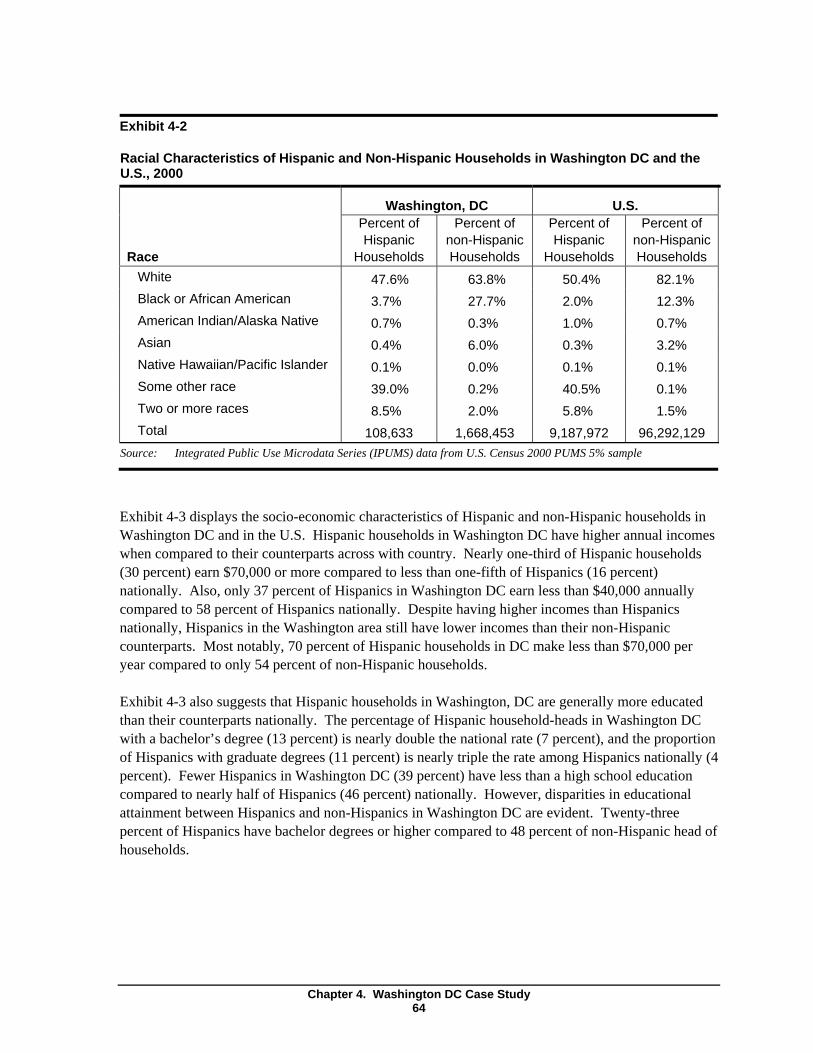
Exhibit 4-2
Racial Characteristics of Hispanic and Non-Hispanic Households in Washington DC and the U.S., 2000
Race White Black or African American American Indian/Alaska Native Asian Native Hawaiian/Pacific Islander Some other race Two or more races Total
Washington, DC Percent of Hispanic
Households
Percent of non-Hispanic Households
47.6% 63.8% 3.7% 27.7% 0.7% 0.3% 0.4% 6.0% 0.1% 0.0% 39.0% 0.2% 8.5% 2.0%
108,633 1,668,453
U.S. Percent of Hispanic
Households
Percent of non-Hispanic Households
50.4% 82.1% 2.0% 12.3% 1.0% 0.7% 0.3% 3.2% 0.1% 0.1% 40.5% 0.1% 5.8% 1.5%
9,187,972 96,292,129 Source: Integrated Public Use Microdata Series (IPUMS) data from U.S. Census 2000 PUMS 5% sample
Exhibit 4-3 displays the socio-economic characteristics of Hispanic and non-Hispanic households in Washington DC and in the U.S. Hispanic households in Washington DC have higher annual incomes when compared to their counterparts across with country. Nearly one-third of Hispanic households (30 percent) earn $70,000 or more compared to less than one-fifth of Hispanics (16 percent) nationally. Also, only 37 percent of Hispanics in Washington DC earn less than $40,000 annually compared to 58 percent of Hispanics nationally. Despite having higher incomes than Hispanics nationally, Hispanics in the Washington area still have lower incomes than their non-Hispanic counterparts. Most notably, 70 percent of Hispanic households in DC make less than $70,000 per year compared to only 54 percent of non-Hispanic households.
Exhibit 4-3 also suggests that Hispanic households in Washington, DC are generally more educated than their counterparts nationally. The percentage of Hispanic household-heads in Washington DC with a bachelor’s degree (13 percent) is nearly double the national rate (7 percent), and the proportion of Hispanics with graduate degrees (11 percent) is nearly triple the rate among Hispanics nationally (4 percent). Fewer Hispanics in Washington DC (39 percent) have less than a high school education compared to nearly half of Hispanics (46 percent) nationally. However, disparities in educational attainment between Hispanics and non-Hispanics in Washington DC are evident. Twenty-three percent of Hispanics have bachelor degrees or higher compared to 48 percent of non-Hispanic head of households.
Chapter 4. Washington DC Case Study 64
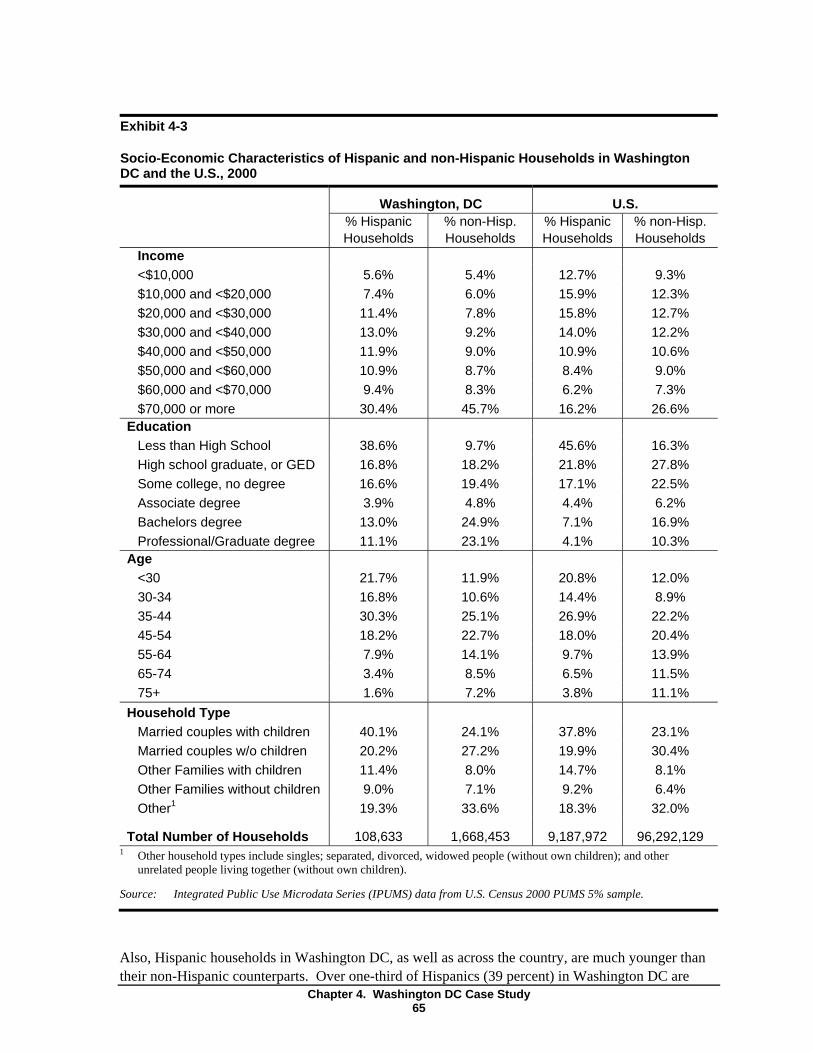
Exhibit 4-3
Socio-Economic Characteristics of Hispanic and non-Hispanic Households in Washington DC and the U.S., 2000
Washington, DC U.S. % Hispanic Households
% non-Hisp. Households
% Hispanic Households
% non-Hisp. Households
Income <$10,000 $10,000 and <$20,000 $20,000 and <$30,000 $30,000 and <$40,000 $40,000 and <$50,000 $50,000 and <$60,000 $60,000 and <$70,000 $70,000 or more
5.6% 7.4%11.4%13.0%11.9%10.9%9.4%30.4%
5.4% 6.0% 7.8% 9.2% 9.0% 8.7% 8.3%
45.7%
12.7% 15.9% 15.8% 14.0% 10.9% 8.4% 6.2% 16.2%
9.3% 12.3% 12.7% 12.2% 10.6% 9.0% 7.3%
26.6% Education
Less than High School High school graduate, or GED Some college, no degree Associate degree Bachelors degree Professional/Graduate degree
38.6% 16.8% 16.6% 3.9%13.0%11.1%
9.7% 18.2% 19.4% 4.8%
24.9% 23.1%
45.6% 21.8% 17.1% 4.4% 7.1% 4.1%
16.3% 27.8% 22.5% 6.2%
16.9% 10.3%
Age <30 30-3435-4445-5455-6465-7475+
21.7% 16.8% 30.3% 18.2% 7.9% 3.4% 1.6%
11.9% 10.6% 25.1% 22.7% 14.1% 8.5% 7.2%
20.8% 14.4% 26.9% 18.0% 9.7% 6.5% 3.8%
12.0% 8.9%
22.2% 20.4% 13.9% 11.5% 11.1%
Household Type Married couples with children Married couples w/o children Other Families with children Other Families without children Other1
Total Number of Households
40.1% 20.2% 11.4% 9.0% 19.3%
108,633
24.1% 27.2% 8.0% 7.1%
33.6%
1,668,453
37.8% 19.9% 14.7% 9.2% 18.3%
9,187,972
23.1% 30.4% 8.1% 6.4%
32.0%
96,292,129 Other household types include singles; separated, divorced, widowed people (without own children); and other unrelated people living together (without own children).
Source: Integrated Public Use Microdata Series (IPUMS) data from U.S. Census 2000 PUMS 5% sample.
Also, Hispanic households in Washington DC, as well as across the country, are much younger than their non-Hispanic counterparts. Over one-third of Hispanics (39 percent) in Washington DC are
Chapter 4. Washington DC Case Study 65
1
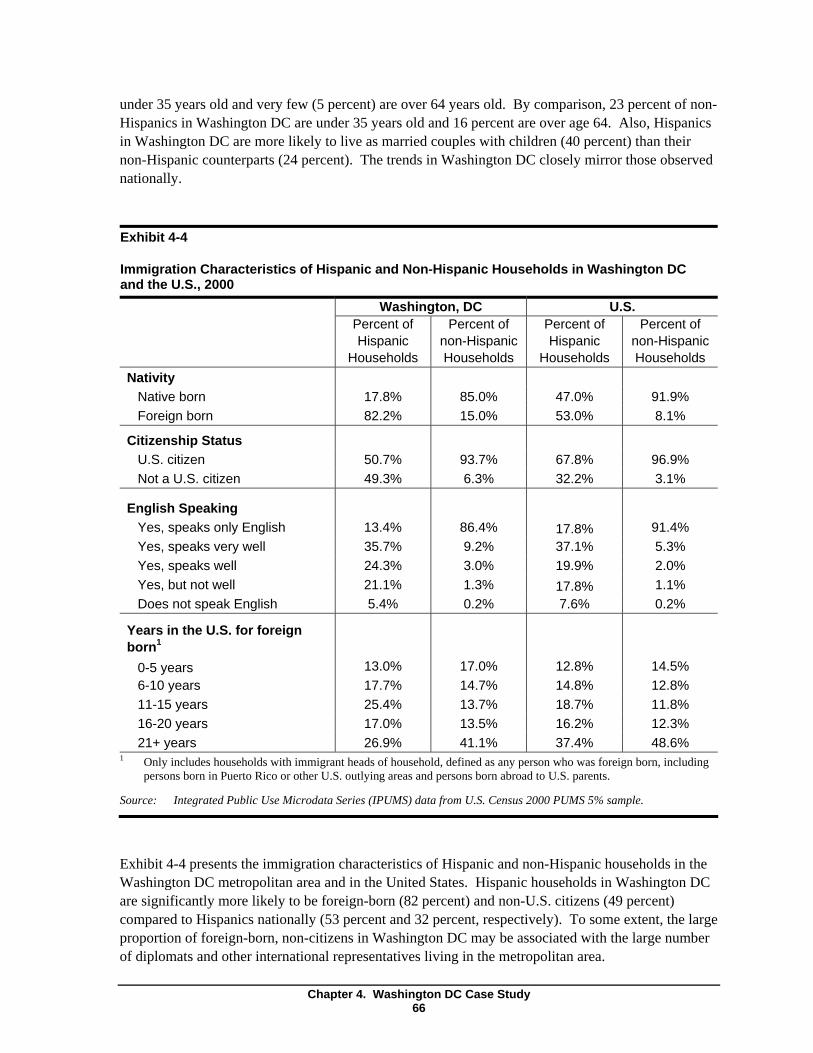
1
under 35 years old and very few (5 percent) are over 64 years old. By comparison, 23 percent of non-Hispanics in Washington DC are under 35 years old and 16 percent are over age 64. Also, Hispanics in Washington DC are more likely to live as married couples with children (40 percent) than their non-Hispanic counterparts (24 percent). The trends in Washington DC closely mirror those observed nationally.
Exhibit 4-4
Immigration Characteristics of Hispanic and Non-Hispanic Households in Washington DC and the U.S., 2000 Washington, DC U.S.
Percent of Hispanic
Households
Percent of non-Hispanic Households
Percent of Hispanic
Households
Percent of non-Hispanic Households
Nativity Native born Foreign born
17.8% 82.2%
85.0% 15.0%
47.0% 53.0%
91.9% 8.1%
Citizenship Status U.S. citizen Not a U.S. citizen
50.7% 49.3%
93.7% 6.3%
67.8% 32.2%
96.9% 3.1%
English Speaking Yes, speaks only English Yes, speaks very well Yes, speaks well Yes, but not well Does not speak English
13.4% 35.7% 24.3%21.1% 5.4%
86.4% 9.2% 3.0% 1.3% 0.2%
17.8% 37.1% 19.9% 17.8% 7.6%
91.4% 5.3% 2.0% 1.1% 0.2%
Years in the U.S. for foreign born1
0-5 years 6-10 years 11-15 years 16-20 years 21+ years
13.0% 17.7% 25.4% 17.0% 26.9%
17.0% 14.7% 13.7% 13.5% 41.1%
12.8% 14.8% 18.7% 16.2% 37.4%
14.5% 12.8% 11.8% 12.3% 48.6%
Only includes households with immigrant heads of household, defined as any person who was foreign born, including persons born in Puerto Rico or other U.S. outlying areas and persons born abroad to U.S. parents.
Source: Integrated Public Use Microdata Series (IPUMS) data from U.S. Census 2000 PUMS 5% sample.
Exhibit 4-4 presents the immigration characteristics of Hispanic and non-Hispanic households in the Washington DC metropolitan area and in the United States. Hispanic households in Washington DC are significantly more likely to be foreign-born (82 percent) and non-U.S. citizens (49 percent) compared to Hispanics nationally (53 percent and 32 percent, respectively). To some extent, the large proportion of foreign-born, non-citizens in Washington DC may be associated with the large number of diplomats and other international representatives living in the metropolitan area.
Chapter 4. Washington DC Case Study 66
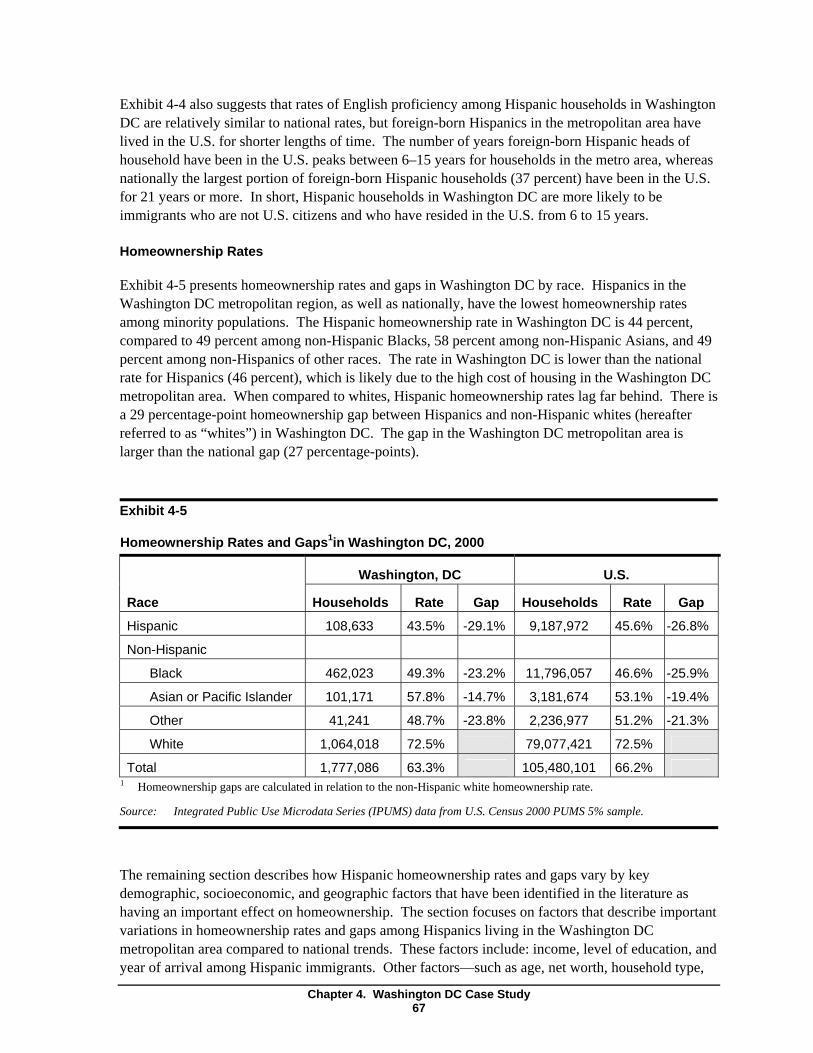
1
Exhibit 4-4 also suggests that rates of English proficiency among Hispanic households in Washington DC are relatively similar to national rates, but foreign-born Hispanics in the metropolitan area have lived in the U.S. for shorter lengths of time. The number of years foreign-born Hispanic heads of household have been in the U.S. peaks between 6–15 years for households in the metro area, whereas nationally the largest portion of foreign-born Hispanic households (37 percent) have been in the U.S. for 21 years or more. In short, Hispanic households in Washington DC are more likely to be immigrants who are not U.S. citizens and who have resided in the U.S. from 6 to 15 years.
Homeownership Rates
Exhibit 4-5 presents homeownership rates and gaps in Washington DC by race. Hispanics in the Washington DC metropolitan region, as well as nationally, have the lowest homeownership rates among minority populations. The Hispanic homeownership rate in Washington DC is 44 percent, compared to 49 percent among non-Hispanic Blacks, 58 percent among non-Hispanic Asians, and 49 percent among non-Hispanics of other races. The rate in Washington DC is lower than the national rate for Hispanics (46 percent), which is likely due to the high cost of housing in the Washington DC metropolitan area. When compared to whites, Hispanic homeownership rates lag far behind. There is a 29 percentage-point homeownership gap between Hispanics and non-Hispanic whites (hereafter referred to as “whites”) in Washington DC. The gap in the Washington DC metropolitan area is larger than the national gap (27 percentage-points).
Exhibit 4-5
Homeownership Rates and Gaps1in Washington DC, 2000
Race
Hispanic
Non-Hispanic
Black
Asian or Pacific Islander
Other
White
Total
Washington, DC U.S.
Households Rate Gap Households Rate Gap
108,633 43.5% -29.1% 9,187,972 45.6% -26.8%
462,023 49.3% -23.2% 11,796,057 46.6% -25.9%
101,171 57.8% -14.7% 3,181,674 53.1% -19.4%
41,241 48.7% -23.8% 2,236,977 51.2% -21.3%
1,064,018 72.5% 79,077,421 72.5%
1,777,086 63.3% 105,480,101 66.2% Homeownership gaps are calculated in relation to the non-Hispanic white homeownership rate.
Source: Integrated Public Use Microdata Series (IPUMS) data from U.S. Census 2000 PUMS 5% sample.
The remaining section describes how Hispanic homeownership rates and gaps vary by key demographic, socioeconomic, and geographic factors that have been identified in the literature as having an important effect on homeownership. The section focuses on factors that describe important variations in homeownership rates and gaps among Hispanics living in the Washington DC metropolitan area compared to national trends. These factors include: income, level of education, and year of arrival among Hispanic immigrants. Other factors—such as age, net worth, household type,
Chapter 4. Washington DC Case Study 67
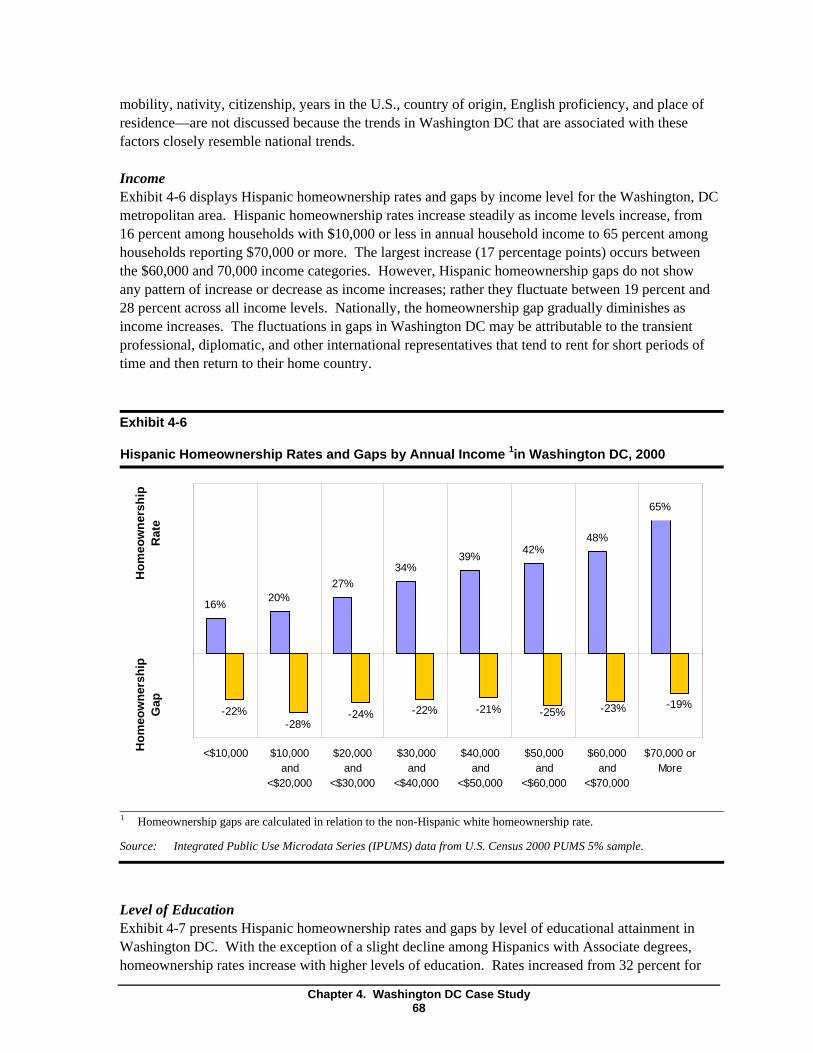
mobility, nativity, citizenship, years in the U.S., country of origin, English proficiency, and place of residence—are not discussed because the trends in Washington DC that are associated with these factors closely resemble national trends.
Income Exhibit 4-6 displays Hispanic homeownership rates and gaps by income level for the Washington, DC metropolitan area. Hispanic homeownership rates increase steadily as income levels increase, from 16 percent among households with $10,000 or less in annual household income to 65 percent among households reporting $70,000 or more. The largest increase (17 percentage points) occurs between the $60,000 and 70,000 income categories. However, Hispanic homeownership gaps do not show any pattern of increase or decrease as income increases; rather they fluctuate between 19 percent and 28 percent across all income levels. Nationally, the homeownership gap gradually diminishes as income increases. The fluctuations in gaps in Washington DC may be attributable to the transient professional, diplomatic, and other international representatives that tend to rent for short periods of time and then return to their home country.
Exhibit 4-6
Hispanic Homeownership Rates and Gaps by Annual Income 1in Washington DC, 2000
Hom
eow
ners
hip
Rat
e H
omeo
wne
rshi
p
Gap
16% 20% 27%
34% 39% 42%
48%
-22% -28%
-24% -22% -21% -19%
65%
-23% -25%
<$10,000 $10,000 $20,000 $30,000 $40,000 $50,000 $60,000 $70,000 or and and and and and and More
<$20,000 <$30,000 <$40,000 <$50,000 <$60,000 <$70,000
Homeownership gaps are calculated in relation to the non-Hispanic white homeownership rate.
Source: Integrated Public Use Microdata Series (IPUMS) data from U.S. Census 2000 PUMS 5% sample.
Level of Education Exhibit 4-7 presents Hispanic homeownership rates and gaps by level of educational attainment in Washington DC. With the exception of a slight decline among Hispanics with Associate degrees, homeownership rates increase with higher levels of education. Rates increased from 32 percent for
Chapter 4. Washington DC Case Study 68
1
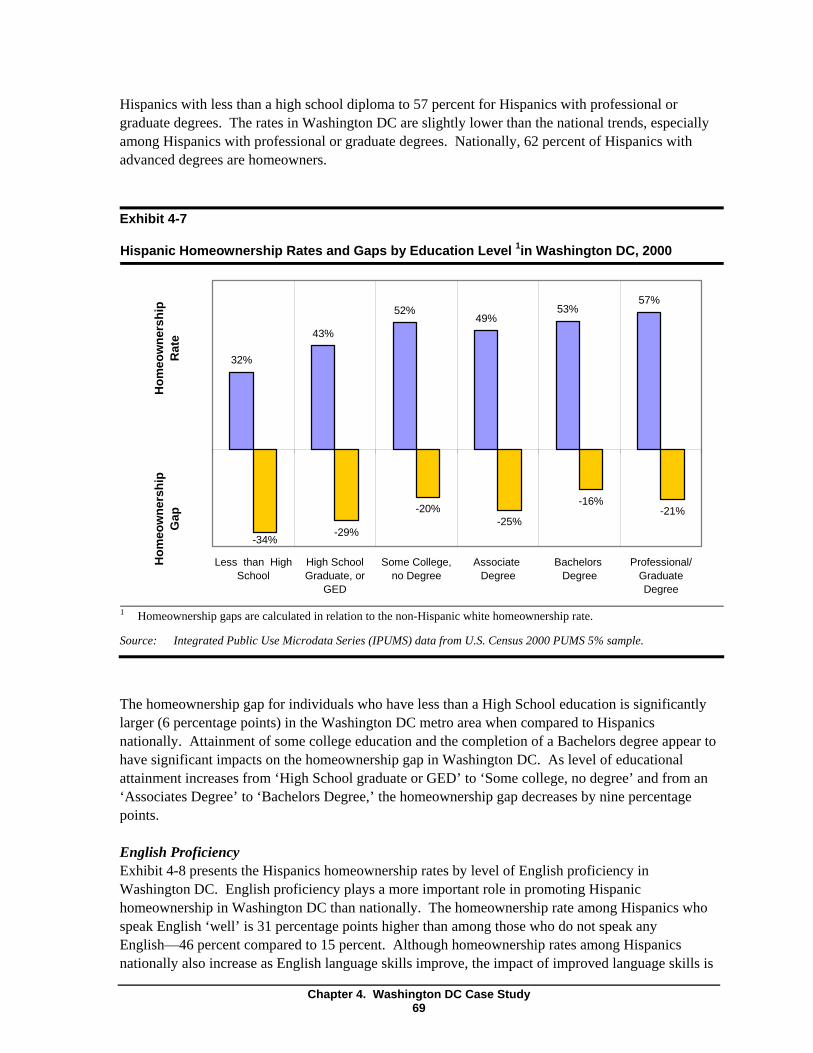
1
Hispanics with less than a high school diploma to 57 percent for Hispanics with professional or graduate degrees. The rates in Washington DC are slightly lower than the national trends, especially among Hispanics with professional or graduate degrees. Nationally, 62 percent of Hispanics with advanced degrees are homeowners.
Exhibit 4-7
Hispanic Homeownership Rates and Gaps by Education Level 1in Washington DC, 2000
Hom
eow
ners
hip
R
ate
Hom
eow
ners
hip
G
ap
32%
43%
52% 49%
53% 57%
-29%
-20% -25%
-16% -21%
-34%
Less than High High School Some College, Associate Bachelors Professional/ School Graduate, or no Degree Degree Degree Graduate
GED Degree
Homeownership gaps are calculated in relation to the non-Hispanic white homeownership rate.
Source: Integrated Public Use Microdata Series (IPUMS) data from U.S. Census 2000 PUMS 5% sample.
The homeownership gap for individuals who have less than a High School education is significantly larger (6 percentage points) in the Washington DC metro area when compared to Hispanics nationally. Attainment of some college education and the completion of a Bachelors degree appear to have significant impacts on the homeownership gap in Washington DC. As level of educational attainment increases from ‘High School graduate or GED’ to ‘Some college, no degree’ and from an ‘Associates Degree’ to ‘Bachelors Degree,’ the homeownership gap decreases by nine percentage points.
English Proficiency Exhibit 4-8 presents the Hispanics homeownership rates by level of English proficiency in Washington DC. English proficiency plays a more important role in promoting Hispanic homeownership in Washington DC than nationally. The homeownership rate among Hispanics who speak English ‘well’ is 31 percentage points higher than among those who do not speak any English—46 percent compared to 15 percent. Although homeownership rates among Hispanics nationally also increase as English language skills improve, the impact of improved language skills is
Chapter 4. Washington DC Case Study 69
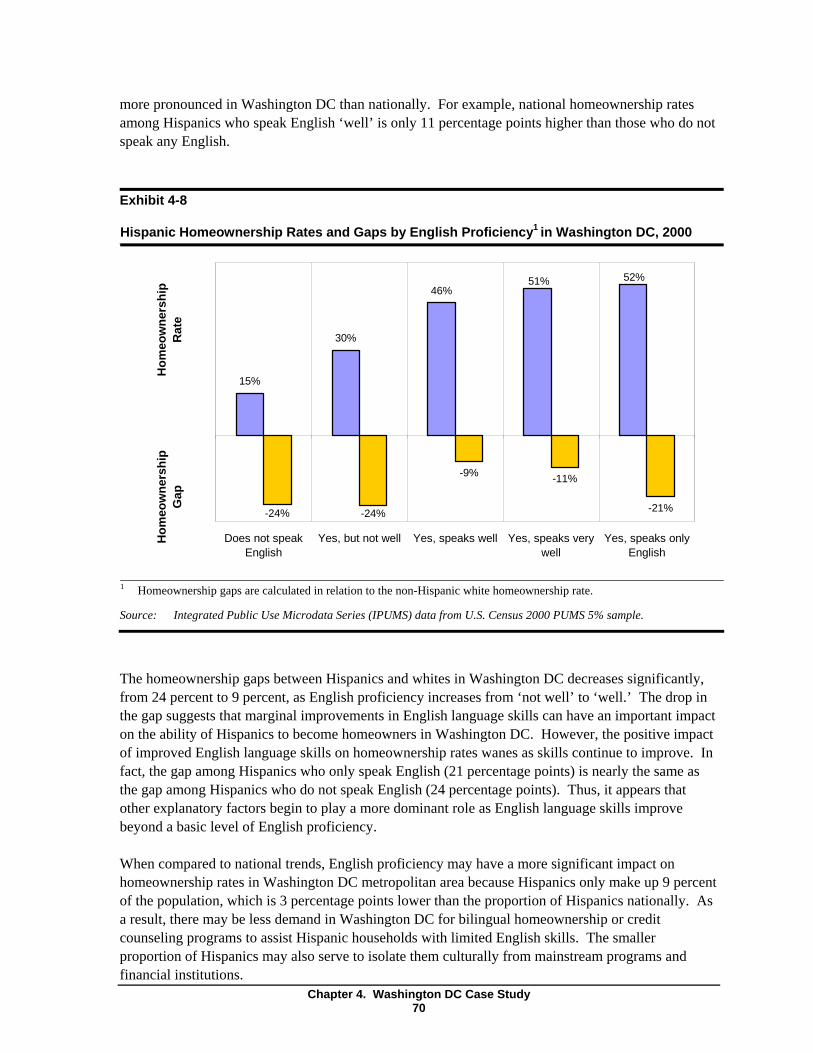
1
more pronounced in Washington DC than nationally. For example, national homeownership rates among Hispanics who speak English ‘well’ is only 11 percentage points higher than those who do not speak any English.
Exhibit 4-8
Hispanic Homeownership Rates and Gaps by English Proficiency1 in Washington DC, 2000
Hom
eow
ners
hip
R
ate
Hom
eow
ners
hip
G
ap
-21%
-11%-9%
46%
30%
15%
-24% -24%
51% 52%
Does not speak Yes, but not well Yes, speaks well Yes, speaks very Yes, speaks onlyEnglish well English
Homeownership gaps are calculated in relation to the non-Hispanic white homeownership rate.
Source: Integrated Public Use Microdata Series (IPUMS) data from U.S. Census 2000 PUMS 5% sample.
The homeownership gaps between Hispanics and whites in Washington DC decreases significantly, from 24 percent to 9 percent, as English proficiency increases from ‘not well’ to ‘well.’ The drop in the gap suggests that marginal improvements in English language skills can have an important impact on the ability of Hispanics to become homeowners in Washington DC. However, the positive impact of improved English language skills on homeownership rates wanes as skills continue to improve. In fact, the gap among Hispanics who only speak English (21 percentage points) is nearly the same as the gap among Hispanics who do not speak English (24 percentage points). Thus, it appears that other explanatory factors begin to play a more dominant role as English language skills improve beyond a basic level of English proficiency.
When compared to national trends, English proficiency may have a more significant impact on homeownership rates in Washington DC metropolitan area because Hispanics only make up 9 percent of the population, which is 3 percentage points lower than the proportion of Hispanics nationally. As a result, there may be less demand in Washington DC for bilingual homeownership or credit counseling programs to assist Hispanic households with limited English skills. The smaller proportion of Hispanics may also serve to isolate them culturally from mainstream programs and financial institutions.
Chapter 4. Washington DC Case Study 70
Organizations Interviewed in the Washington DC Area
The remainder of this case study is based on full, in-depth interviews with representatives from three housing counseling agencies in the Washington DC metropolitan area, as well as shorter telephone interviews with a realtor, lender, and an additional housing counseling agency. Interviews were conducted with staff from the following organizations:
Hispanic Committee of Virginia (HCV) The Hispanic Committee of Virginia (HCV) is an established non-profit agency that provides a wide variety of social services “to enable Hispanic immigrants to more fully participate in and contribute to American society.” HCV staff emphasized the holistic approach of the agency, which often assists households with multiple issues. Services include the homeownership program, education programs for adults and children, an employment and micro-enterprise program, an immigration assistance program, information and referrals, and general social services provided by a social worker.
Based on HCV’s 2002-2003 annual report, most of HCV clients live in northern Virginia and nearly all of their clients (96 percent) are Hispanic and nearly all household heads (97 percent) were born outside the mainland U.S. Approximately 94 percent of Hispanics served by HCV are employed full- or part-time, especially in the service industry, but almost half report earnings less than 50 percent of the median income in Fairfax County. The average client income was approximately $17,550. Few clients receive Temporary Assistance to Needy Families. Also, the majority of their clients speak English well and about one-third do not speak English or speak broken English. Clients are typically poorly educated and more than half (55 percent) have less than a high school education.
Latino Economic Development Corporation (LEDC) Established in 1991, LEDC is a non-profit community development corporation in northwest Washington DC. The mission of LEDC is “to economically empower Washington, DC area Latinos and other emerging communities.” The organization provides business development services, homeownership counseling, and a façade improvement program for local businesses. The business development services include $500-$30,000 business loans for entrepreneurs.
LEDC’s client population is similar to the Hispanic population served by HCV and other service providers. About 90 percent of their clients are Hispanic, especially Central Americans from El Salvador, Guatemala, and Honduras, as well as South Americans from Peru and Bolivia. The overwhelming majority are low- or moderate-income with poor credit histories and financial literacy skills. LEDC’s Hispanic clients tend to be married couples with 3 or 4 children. Most of their clients are immigrants who speak English poorly, and their native-born Hispanic clients are generally more educated than their foreign-born counterparts.
Manna, Inc. Manna is “a non-profit developer that turns crumbling buildings, trash-filled lots and boarded shells into homes for low- and moderate-income families in DC.” Manna rehabilitates or builds new homes with in-house staff and a design-build approach. Manna staff report that
Chapter 4. Washington DC Case Study 71
the organization is the largest affordable housing developer for homeownership in DC. The organization typically rehabilitates or builds three or four projects per year. All of the current projects are condos, but past projects included single-family homes. In addition to development, Manna also offers low-cost mortgage loans through Manna Mortgage Corporation, as well as homebuyer’s education through Homebuyer’s Clubs and an IDA program.
The Program Coordinator described her Hispanic clients as primarily from El Salvador and most are middle-aged, single females or couples with two or three children. Most Hispanic clients at Manna have a high school education or less, have household incomes around $35,000 (usually two incomes combined), and work in service-related industry (e.g., hotels and janitorial work). About 10 percent of their clients speak at least some English and most have been in the country between 5-7 years.
Weichert Realtors Weichert Realtors is a national real estate company that provides residential brokerage services. The realtor we spoke with provides comprehensive realty services to clients seeking homes in Northern Virginia. He assists households that are pre-approved for a mortgage to identify a property, formulate a bid, and negotiate a contract. He also provides any additional needed services, such as referrals or education about the homebuying process. Approximately 80 percent of his clients are Hispanic. He frequently refers clients to HCV for homeownership counseling and education.
Citibank - CitiMortgage As an affiliate of Citibank, CitiMortgage recently made a $200 billion commitment to increase low- and moderate-income homeownership by 2010. The homeownership directive is being implemented through low-income homeownership products available in different parts of the country. CitiMortgage in Virginia has been working with Acorn to develop and implement a mortgage product that uses an ITIN in lieu of a Social Security Number. The product is described in more detail below.
Association of Community Organizations for Reform Now (ACORN) ACORN is one of the largest grassroots organizations in the country dedicated to helping low- and moderate-income families. ACORN has advocated for low- and moderate-income families in numerous policy areas, including neighborhood safety, health and environmental justice, voter participation, employment and living wage, schools, housing, and community reinvestment. ACORN has recently partnered with CitiMortgage in Virginia to help develop, implement and operate a mortgage product that does not require a Social Security Number.
The list of HUD-approved counseling agencies indicates there are 15 agencies providing housing counseling in Washington DC area.8 Of these, four were interviewed for this study. Based on data on client volumes submitted to HUD for fiscal 2004, these four agencies combined accounted for 60 percent of Hispanic counseling clients in the metro area, and 22 percent of all clients attending prepurchase workshops.
The list of HUD-approved counseling agencies was obtained from the HUD Web site (www.hud.gov/offices/hsg/sfh/hcc/hccprof14.cfm).
Chapter 4. Washington DC Case Study 72
8
Exhibit 4-9 displays the geographic location of these service providers within the immediate DC vicinity, and also shows the concentration of Hispanic renters in proportion to all households by census tract.9 Weichert Realtors and Citibank are not shown on the map because these service providers have numerous branches located throughout the DC metropolitan area that are easily accessible. As the exhibit suggests, most of the service providers interviewed for this case study are located in areas with many Hispanic renters, and thus are well situated to engage potential Hispanic homebuyers. HCV and LEDC’s offices are located in neighborhoods that are within the highest quartile of concentration of Hispanic renters. Manna Inc and two of ACORN’s branch offices are located in areas with an above median concentration of Hispanic renters.10
The exhibit also shows the distribution of Hispanic renters in proportion to all households throughout the immediate DC vicinity. There are large concentrations of Hispanic renters within the city’s Northeast and Northwest quadrants, especially in the Adams Morgan and Mount Pleasant neighborhoods that surround LEDC. There are also large concentrations of Hispanic renters in northern Virginia, especially near Alexandria and Arlington, and in southern Prince George’s County Maryland.
9 The quartiles are defined as follows: 0 <= lowest quartile < 0.5 percent Hispanic renters; 0.5 <= below median quartile < 1.3 percent; Hispanic renters; 1.3 <= above median quartile < 4.0 percent Hispanic renters; 4.0 <= highest quartile < 71.3 percent Hispanic renters.
10 There are two additional ACORN offices located in the Baltimore area, which are not displayed in the exhibit.
Chapter 4. Washington DC Case Study 73
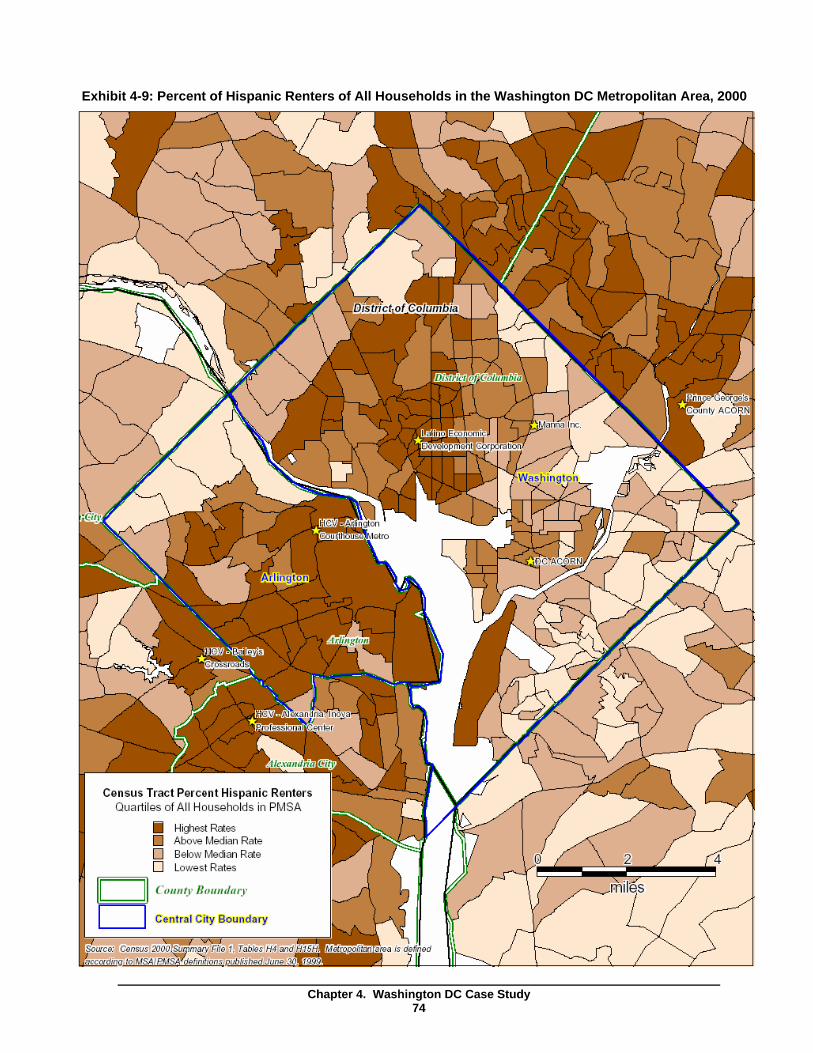
Exhibit 4-9: Percent of Hispanic Renters of All Households in the Washington DC Metropolitan Area, 2000
Chapter 4. Washington DC Case Study74
4.2 Homeownership Barriers
This section briefly reviews the key barriers to homeownership that were identified by interview participants in Washington DC. Overall, respondents identified many of the barriers that are highlighted in the homeownership literature, including lack of information, a limited supply of affordable housing, difficulties in accessing mortgage financing, and discrimination in housing and mortgage markets (for a review, see Cortes et al. 2005). Respondents indicate that Hispanics generally have a low level of understanding about the homebuying process, the importance of a sound financial history, and the mortgage qualification process. In addition, respondents mention that the paucity of affordable housing is a major barrier to Hispanic homeownership. Rising housing prices not only prevent some Hispanics from affording a home, but also discourage some Hispanics from seeking their services as homeownership appears to be an unattainable goal. Respondents also say that Hispanics have difficulties satisfying mortgage qualification requirements, and the mortgage market industry has not responded adequately to the needs of prospective Hispanic homebuyers.
Lack of Information
According to industry experts in Washington DC, the lack of knowledge about the home purchase and mortgage qualification processes among Hispanics is a key barrier to homeownership. Specifically, Hispanics often:
• Do not understand the overall home purchase process. Service providers repeatedly pointed out that Hispanic households frequently do not know: how to start the homeownership process; how to begin the mortgage pre-approval process; how to search for housing; and how the homebuying process proceeds. Many Hispanics are unfamiliar with the full range of industry professionals, including lenders, realtors, closing agents, and title companies, and their role during the homebuying process.
• Believe that homeownership is out of their reach. Service providers report that Hispanic households frequently believe homeownership is unattainable either because their incomes are too low or because they are not legal residents in the U.S. and lack a social security number.
• Have incorrect perceptions about the downpayment and credit history requirements needed to qualify for a mortgage. Hispanics often assume that large downpayments and perfect credit are required to buy a home. Many Hispanics are generally unaware that non-traditional forms of credit, such as rent or utility payments, can help people without credit histories to qualify for a mortgage. The misperception that past credit issues may altogether prevent homeownership is also common according to service providers. Some respondents suggest that these perceptions were originally fostered by the experiences of Hispanics in their country of origin.
• Have poor financial skills. All too often, poor financial skills lead to poor credit histories and inadequate savings. As a result, service providers are challenged to identify mortgage products that have flexible qualification requirements and are affordable to low-income buyers.
Chapter 4. Washington DC Case Study 75
According to service providers, two factors intensify the misperceptions about homeownership among Hispanic households. First, language barriers could exacerbate these information gaps or, alternatively, cause a Hispanic household to trust an unscrupulous Spanish-speaking realtor or lender. In both situations, Hispanics with poor English-speaking skills are in a vulnerable position where they can be charged excessive fees, agree to higher interest rates or other burdensome terms, or purchase a home with higher monthly payments than are unsustainable in the long-term and likely to result in default. Several service providers report that Hispanics may inherently trust a Spanish-speaking Hispanic realtor or lender, particularly if they are from the same country of origin. Again, this dependency can create opportunities for unscrupulous industry players to take advantage of Hispanics.
Second, some Hispanics do not understand that as a consumer they have the right to be selective in choosing industry experts to work with throughout the homebuying process. Several service providers emphasize that Hispanics are often not aware of their options and choices during the home purchase process and, as a result, can lead some households to feel overwhelmed and confused. According to respondents, selecting a real estate agent, lender, or a mortgage product is foreign to many Hispanic households, particularly households with language barriers. For example, one service provider reports that a Hispanic client assumed that lenders are required to offer the best mortgage interest rate available and, therefore, the household did not search other providers for better interest rates. Another service provider details a case where a household was required to pay Primary Mortgage Insurance (PMI) because his lender did not suggest the common practice of taking out a first mortgage for 80 percent of the home value and a second mortgage for the remaining amount to be borrowed to avoid paying PMI.
Service providers identify two major challenges in overcoming the information gap among Hispanic households: a marketing gap and a lack of service capacity. The “marketing gap” refers to the fact that there is insufficient outreach to the Hispanic community to make them aware of the services available to help achieve homeownership. Although each agency conducted some type of marketing activity, only one engaged in active outreach into the community on a weekly basis by attending and making announcements at a variety of community meetings. Common marketing tactics included advertisements in Spanish language newspapers, limited television advertisements or public service announcements, and, for the realtor and lender, the formation of partnerships with community-based organizations. One such service provider comments that television advertisements on Spanish language channels are the most effective way to reach Hispanic households. After one public service announcement on a Spanish television channel, the agency received over 80 phone calls inquiring about their homeownership program. The realtor and the lender both identify relationships with established community-based organizations as an important way to reach prospective Hispanic homebuyers.
The second challenge to overcoming the information gap is a lack of capacity within the community to serve every Hispanic household in need of homeownership services. A majority of the service providers comment that they are already operating at full capacity, although one agency has plans for expansion to a second office. All respondents believe there is a high demand for their services and if the marketing gap were bridged, their programs would be inundated with prospective Hispanic homebuyers.
Chapter 4. Washington DC Case Study 76
Housing Market Barriers
Every service provider cited housing affordability as a major barrier to Hispanic homeownership in the DC metropolitan area. While housing prices continue to rise, particularly for single-family homes, household income for Hispanic households remains low when compared to whites. According to data from the National Association of Realtors®, the median sales price of an existing single family home increased sharply from $277,900 in 2003 to $424,700 in 2005 – an increase of 53 percent in just two years. Based on 2000 Census data, the annual median household income in the Washington DC metropolitan area is $48,931 among Hispanics and $65,357 among whites. Although service providers report that their Hispanic clients typically have more than one job, their employment is heavily concentrated in low-wage service industries, especially housekeeping or construction. Despite multiple income-earners, low-income Hispanic households are often unable to secure a mortgage due to inadequate household income.
Housing affordability barriers also affect the housing preferences of Hispanic households. In DC, Latino neighborhoods are concentrated in the Northwest quadrant of the city, which also houses some of the most expensive housing stock. As a result, low-income Hispanic households must explore the Northeast, Southeast, or Southwest quadrants for more affordable homeownership opportunities. Service providers in DC report that Hispanic households are often wary of these areas due to a perception of crime and some choose to move to Maryland instead of staying in the District. In Virginia, Hispanic households have begun to move beyond Northern Virginia to Prince William or Louden Counties in search of affordable housing. Agencies in both areas are less sure about the impact that leaving an established Hispanic community has on housing choices for Hispanic households.
According to service providers, Hispanics traditionally prefer to purchase single-family homes, but households are struggling to afford such homes on their own. One service provider notes that Hispanics prefer single-family homes because families tend be larger, therefore making it more difficult to find a condominium of adequate size. He estimates that about 90 percent of his clients who are homeowners purchased a single-family home, while 10 percent closed on a condominium. A new trend in Northern Virginia is for one or more Hispanic households or nuclear families, most often related, to purchase a single-family home together to overcome affordability issues.
Service providers recognize that the affordability barrier is beyond the scope of their services. Although state and local subsidy programs exist to bridge the affordability gap for low- and moderate-income households, the effectiveness of such programs is questionable. For example, two service providers suggest that downpayment and closing cost assistance programs are inadequate for the current housing market. Program guidelines specifying the amount of subsidy and the maximum mortgage and housing price as a function of household income generally do not allow participants to purchase an average home in the DC area. In Northern Virginia, one service provider observes that the state’s housing subsidy and mortgage programs are also quickly becoming irrelevant in the escalating housing market. Overall, service providers believe that the current housing market is a “sellers’ market” where homes are not on the market very long and buyers routinely waive inspections to make their bid more attractive. Also, sellers are typically less willing to accept subsidy programs that require inspections and additional paperwork if they have other bids to consider.
Chapter 4. Washington DC Case Study 77
Mortgage Market Barriers
The confluence of several factors conspires to make it difficult for Hispanic households to qualify for a mortgage. As Burnett et al. (2004) describe, two requirements of many conventional mortgage products that are problematic for some prospective Hispanic homebuyers are a healthy credit score and a social security number for approval. In addition, compared to their white counterparts in the DC metropolitan area, Hispanics are disproportionately low-income. Mortgage market barriers are exacerbated by a lack of Spanish-speaking brokerage and lender staff. Although two respondents believe that a lack of English-language ability is not a major barrier in the housing industry, the lender reports that it is difficult to find and retain Spanish-speaking mortgage consultants to serve the Hispanic community.
While service providers cite credit worthiness as a barrier, they also emphasize that a prospective buyer’s credit can be repaired, or that alternative information can be used to establish credit history. One service provider notes that as long as an individual has a legitimate social security number, everything else can be remedied over time. Housing counselors typically work one-on-one with families to resolve credit issues. To overcome a lack of credit history, lenders are also coming out with mortgage products that do not require a conventional credit history. Even the lack of a social security number is being addressed by new mortgage products that accept an Individual Tax Identification Number (ITIN) in its place. The ITIN can also be used to establish a credit history. In short, new mortgage products are fulfilling a market niche for undocumented Hispanic immigrants who are looking to purchase a home.
4.3 Homeownership Services in Washington DC
This section reviews the sundry services offered by participating organizations that are designed to expand homeownership opportunities for Hispanic households. The section reviews the nature of these services and their ability to promote homeownership among Hispanics in the Washington DC area. Most participating organizations offer a comprehensive package of homeownership services— particularly the housing counseling agencies—and organizations have developed networks of other service providers to supplement their services. The networks are usually based on informal relationships that have evolved over time and are based on client satisfaction and trust. Also, most organizations use a complementary approach to service delivery by offering both large group meetings and intensive one-on-one sessions with clients, although the representatives from the realty and mortgage companies focus exclusively on one-on-one meetings. All the organizations interviewed in the Washington DC area market their services through print, radio, and television outlets, although some expressed a “marketing gap” in reaching potential Hispanic homebuyers. However, most of these providers are operating at full capacity and do not have the resources to serve additional clients.
Nature of Homeownership Services
Exhibit 4-10 describes a variety of services offered by the organizations in the Washington DC area. The services are grouped into three main categories based on their relationship to the homebuying process. There are several services that affect a potential Hispanic homebuyer’s decision to pursue homeownership, including: homeownership counseling, financial education, immigration services, and outreach. A few organizations assist homebuyers in searching for a suitable home and by developing affordable housing. Also, several organizations help homebuyers obtain mortgage
Chapter 4. Washington DC Case Study 78
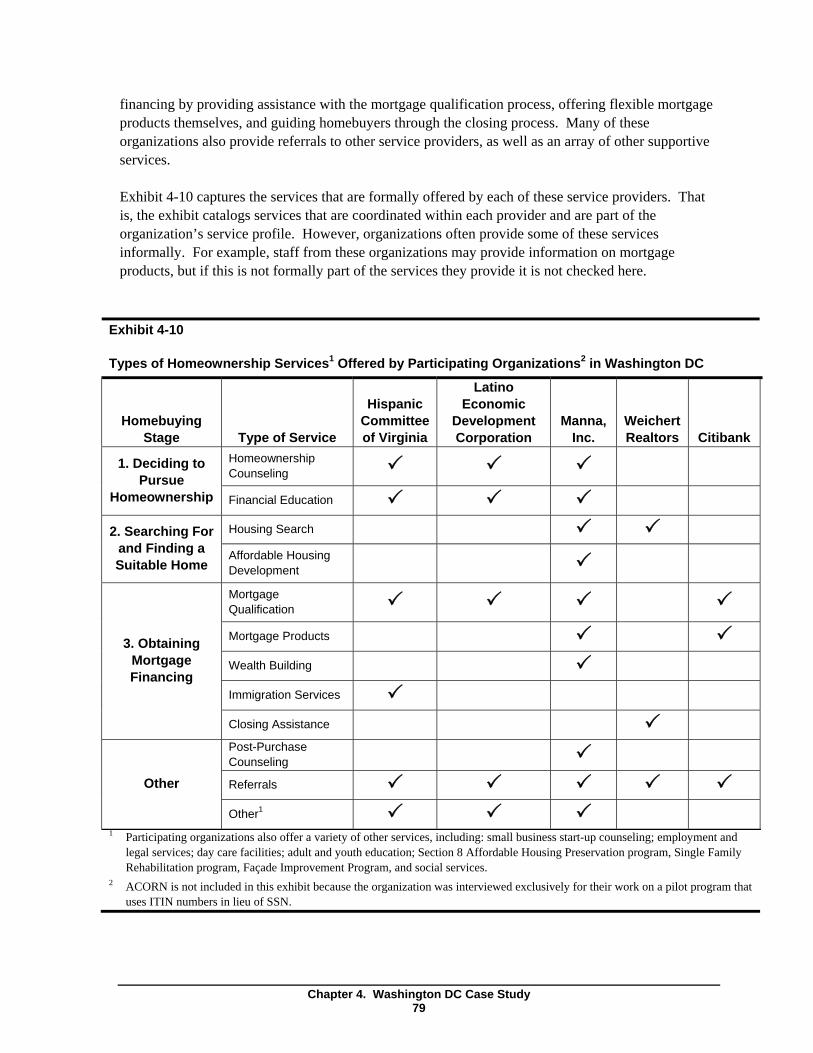
financing by providing assistance with the mortgage qualification process, offering flexible mortgage products themselves, and guiding homebuyers through the closing process. Many of these organizations also provide referrals to other service providers, as well as an array of other supportive services.
Exhibit 4-10 captures the services that are formally offered by each of these service providers. That is, the exhibit catalogs services that are coordinated within each provider and are part of the organization’s service profile. However, organizations often provide some of these services informally. For example, staff from these organizations may provide information on mortgage products, but if this is not formally part of the services they provide it is not checked here.
Exhibit 4-10
Types of Homeownership Services1 Offered by Participating Organizations2 in Washington DC
Homebuying Stage Type of Service
Homeownership Counseling
1. Deciding to Pursue
Homeownership Financial Education
Housing Search 2. Searching For and Finding a Suitable Home
Affordable Housing Development
Mortgage Qualification
Mortgage Products
Wealth Building
Immigration Services
3. Obtaining Mortgage Financing
Closing Assistance
Post-Purchase Counseling
ReferralsOther
Other1
Hispanic Committee of Virginia
3
3
3
3
3 3
Latino Economic
Development Corporation
3
3
3
3 3
Manna, Inc.
Weichert Realtors Citibank
3
3 3 3
3
3 3
3 3 3
3
3
3 3 3 3
1 Participating organizations also offer a variety of other services, including: small business start-up counseling; employment and legal services; day care facilities; adult and youth education; Section 8 Affordable Housing Preservation program, Single Family Rehabilitation program, Façade Improvement Program, and social services.
2 ACORN is not included in this exhibit because the organization was interviewed exclusively for their work on a pilot program that uses ITIN numbers in lieu of SSN.
Chapter 4. Washington DC Case Study 79
Deciding to Pursue Homeownership Past research suggests that many Hispanics are dissuaded from considering homeownership and are less confident about completing the homebuying process because they lack sufficient and reliable information about the homebuying process. Several organizations interviewed in the Washington DC area are providing services designed to bridge this information gap. HCV, LEDC, and Manna each focus on expanding homeownership opportunities among Hispanics by providing formal homeownership counseling, financial education courses, and immigration services to the Hispanic community.
Homeownership Counseling and Financial Education HCV’s homeownership counseling program began in 2003 with the goal of improving “the standard of living in the community by helping Hispanic Northern Virginia residents find homes at reasonable cost while educating them about the value of home ownership and the home ownership process” (HCV Annual Report, 2003). HCV’s homeownership counseling consists of free one-on-one meetings with potential homebuyers, as well as a group homeownership education seminar that is offered on the last Saturday of every month. The homeownership counseling program is run by two housing counselors, with one of the counselors managing the program. During the one-on-one sessions, housing counselors work with clients to construct an accurate financial picture of the household and develop a financial plan for homeownership. HCV provides homeownership counseling and financial education services to approximately 60 clients monthly.
In addition, HCV offers a six-hour homeownership group seminar that is based on a standard curriculum provided by the Virginia Housing and Development Authority (VHDA). The curriculum reviews five key steps in becoming a homeowner. Step one focuses on understanding a client’s personal finances and credit reports, developing a spending plan, and learning how a credit history and credit score impact a client’s ability to purchase a home. Step two focuses on the role of the lender and on understanding the mortgage qualification process. The VHDA curriculum includes sample mortgage applications and guidance on how to avoid predatory lending practices. In step three, clients learn how to work with a real estate agent, and how to identify a house that meets their financial constraints and personal preferences. The fourth step in the VHDA curriculum teaches participants about the home inspection process and understanding the difference between a home inspector and an appraiser. The final step focuses on closing the mortgage loan and understanding the legal documents that are part of the closing process. Sample documents are provided, including a Deed of Trust, Note, and Settlement Statement. HCV invites real estate agents, mortgage lenders, and other housing professionals to attend and present portions of the seminar.
Similarly, one of LEDC’s goals11 is to increase homeownership among Hispanics though homeownership counseling, financial training, and loan packaging services. The focus of LEDC’s homeownership program is both to familiarize clients with the home purchase process generally and with the District of Columbia’s Home Purchase Assistance Program (HPAP). LEDC offers one-onone homeownership counseling and homeownership education seminars. During the individual counseling sessions, staff collect basic information on each client, explain how to qualify for HPAP
LEDC is also committed to “increasing the number, strength, and wealth-creating capacity of Latino businesses through LEDC’s Emerging Business Loan Fund,” and “increasing economic vitality by investing directly in small businesses and real estate development, thereby creating business ownership, management, and employment and affordable homeownership opportunities for Latinos” (website: www.ledc.org).
Chapter 4. Washington DC Case Study 80
11
assistance, and identify a variety lenders, real estate agents, and insurance and settlement companies that clients may choose.
LEDC’s homeownership seminar covers the fundamentals to becoming a homeowner: budgeting, credit, applying for a mortgage, the housing search process, and closing on a house. The 2-hour homeownership seminar is offered twice monthly. Two full-time and two part-time counselors conduct the counseling sessions and seminars, and a Housing Director supervises the homeownership program. A full-time housing counselor sees about 10-15 clients per week, or about 40-60 clients monthly.
Manna Inc. provides many housing services in-house. In 1988, Manna created one of the first Homebuyer Clubs in the country, which are peer support groups and homeownership counseling programs. The goal of Manna’s Homebuyer Club is to encourage participants to save for a downpayment on a home, and also to provide participants with the skills and knowledge necessary to successfully complete the mortgage application and approval process. Manna staff interview each prospective homebuyer to determine his or her readiness for buying a home. Prospective homebuyers are placed in a chapter of their Homebuyers Club, which vary by level of readiness and language skills. Each chapter contains 20 to 30 people and meets once a month for a 90-minute session of peer support and educational training.
The chapter sessions provide an opportunity for participants to discuss how they were able to meet their savings goals during the past month, or explain why they fell short of their intended goals. Participants are encouraged to support the development of better money management and budgeting skills, and also to challenge each other to meet the savings goals of each participant. At the end of each session, participants set new saving goals for the following month. The chapter sessions also provide an opportunity for Manna Homebuyers Club staff, and occasionally community volunteers, to present materials on how potential homebuyers can prepare themselves for the homebuying experience. The materials focus on a variety of topics, including: personal budgeting, checking accounts, credit, saving, finding a home, homeownership, types of ownership, home purchase assistance, mortgages, and applying for a mortgage. A light dinner is served before each chapter session and childcare is also provided as needed.
Searching For and Finding a Suitable Home Housing Search To assist potential homebuyers with the housing search process, Manna has several marketing specialists that match prospective homeowners with available properties based on household income, family size, and neighborhood preferences. The marketing specialists help prospective homebuyers become familiar both with the homebuying process and the variety of affordable mortgage products available. Staff acknowledge that high housing prices have limited the housing options of many Hispanic and low-income households.
Similarly, the realtor from Weichert Realtors also provides housing search assistance to all of his clients. The realtor believes that most clients want to stay near their current community, but a few are willing to move into a new neighborhood to find an affordable home. According to the realtor, Hispanic clients place a priority on living space, proximity to work (usually the downtown DC area), and their current neighborhood when searching for a home. Space is particularly important for multiple households that are purchasing a home together, which is increasingly common among Hispanics. In these situations, Hispanics often want a basement to help accommodate the different
Chapter 4. Washington DC Case Study 81
households. The realtor also views high housing prices as a major factor that limits the housing search options of low-income Hispanics, especially in Arlington, Alexandria, and Fairfax County.
Both the marketing specialists from Manna and the realtor from Weichert Realtors accompany the potential homeowners to properties that meet the financial and personal constraints of the household and are available for purchase.
Affordable Housing Development Manna has experience in developing affordable housing in Washington DC. Beginning in 1994, Manna renovated 34 condominium units on ten properties near the block of Galveston Place, SW. The neighborhood was an open-air drug market prior to the redevelopment. A year later, Manna purchased and renovated two abandoned apartment buildings in the Brookland area (at 12th & Perry Streets, NE). Twenty-six new homeowners currently occupy Brooklander Condominiums. Beginning in 2000, Manna demolished the abandoned William Syphax School at 1360 Half Street, SW to make way for the construction of 29 new townhouses and 12 condominium units. All of these units are targeted for low-income households. Manna’s housing search specialists will refer clients to these units as they become available.
Manna supplements their work on developing affordable housing with broader community development work. In 1999 Manna worked with the Bellevue Improvement Council and a neighborhood organization, Operation Crackdown, to closedown a drug trafficking site near the Galveston Place redevelopment. Manna has been involved in similar activities throughout Southeast and Southwest DC.
Obtaining Mortgage Financing Mortgage Qualification Several organizations interviewed in the Washington DC area help Hispanic clients with the mortgage qualification process. As part of the routine intake process, HCV counselors pull a client’s credit report at no charge, review a client’s budget, and then create a financial action plan that helps the client repair or establish credit before applying for a mortgage. If the client is ready to apply for a mortgage loan, the counselor reviews several mortgage options and forwards the client’s financial information to the appropriate lender. The housing counselors typically review county and state mortgage products, particularly mortgage products offered through the Virginia Housing Development Authority (reviewed below). If the household does not qualify for a government-sponsored mortgage product, the housing counselor assists clients in identifying at least three possible mortgage lenders and forwards client information to these lenders. All clients that receive mortgage qualification assistance from HCV counselors are required to attend the monthly homeownership seminar.
After several mortgage products are identified, HCV staff and clients review them and help the family decide which product is most appropriate. According to the housing counselor, HCV’s homeownership program emphasizes and continuously reminds Hispanic clients that they have a choice about which industry professionals to choose. HCV staff are available to assist the client at any point during the mortgage qualification process.
The approach by LEDC staff is similar to that used by HCV staff. Staff from LEDC complete an intake form with the client during the first appointment and also review the city’s HPAP homeownership program. LEDC counselors pull the client’s credit report (for a $20 fee) and assist
Chapter 4. Washington DC Case Study 82
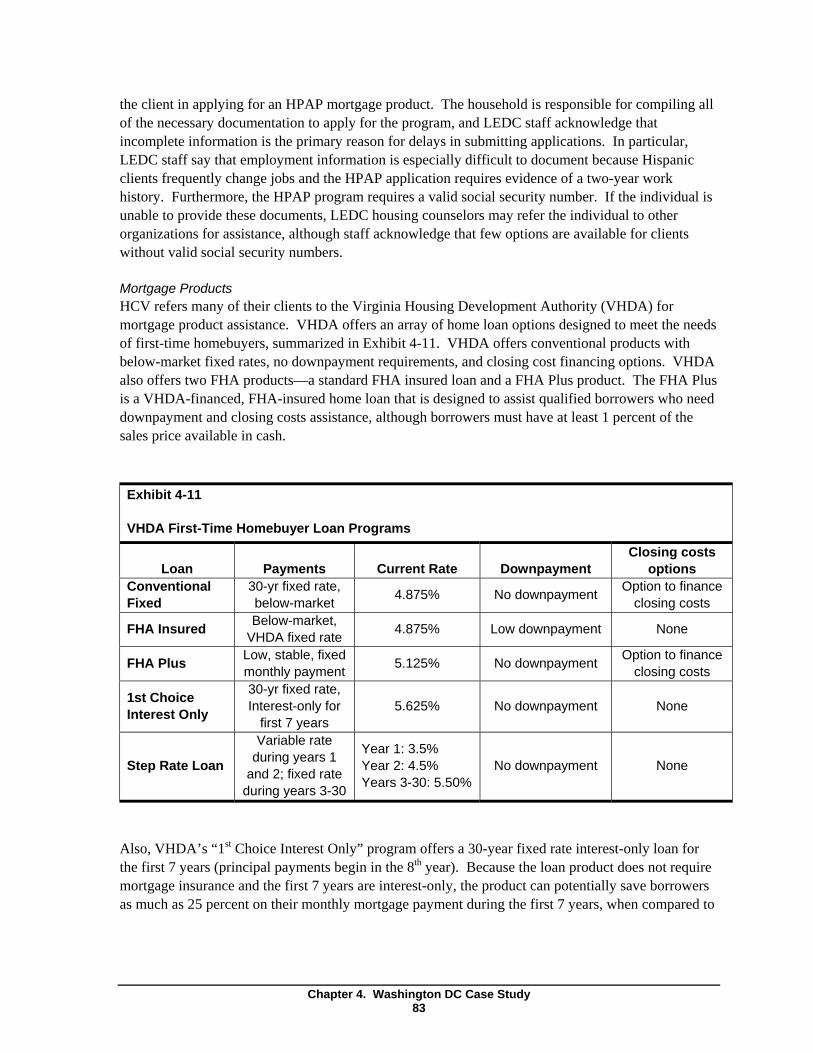
the client in applying for an HPAP mortgage product. The household is responsible for compiling all of the necessary documentation to apply for the program, and LEDC staff acknowledge that incomplete information is the primary reason for delays in submitting applications. In particular, LEDC staff say that employment information is especially difficult to document because Hispanic clients frequently change jobs and the HPAP application requires evidence of a two-year work history. Furthermore, the HPAP program requires a valid social security number. If the individual is unable to provide these documents, LEDC housing counselors may refer the individual to other organizations for assistance, although staff acknowledge that few options are available for clients without valid social security numbers.
Mortgage Products HCV refers many of their clients to the Virginia Housing Development Authority (VHDA) for mortgage product assistance. VHDA offers an array of home loan options designed to meet the needs of first-time homebuyers, summarized in Exhibit 4-11. VHDA offers conventional products with below-market fixed rates, no downpayment requirements, and closing cost financing options. VHDA also offers two FHA products—a standard FHA insured loan and a FHA Plus product. The FHA Plus is a VHDA-financed, FHA-insured home loan that is designed to assist qualified borrowers who need downpayment and closing costs assistance, although borrowers must have at least 1 percent of the sales price available in cash.
Exhibit 4-11
VHDA First-Time Homebuyer Loan Programs
Loan Payments Current Rate Downpayment Closing costs
options Conventional Fixed
30-yr fixed rate, below-market 4.875% No downpayment Option to finance
closing costs
FHA Insured Below-market, VHDA fixed rate 4.875% Low downpayment None
FHA Plus Low, stable, fixed monthly payment 5.125% No downpayment Option to finance
closing costs
1st Choice Interest Only
30-yr fixed rate, Interest-only for
first 7 years 5.625% No downpayment None
Step Rate Loan
Variable rate during years 1
and 2; fixed rate during years 3-30
Year 1: 3.5% Year 2: 4.5% Years 3-30: 5.50%
No downpayment None
Also, VHDA’s “1st Choice Interest Only” program offers a 30-year fixed rate interest-only loan for the first 7 years (principal payments begin in the 8th year). Because the loan product does not require mortgage insurance and the first 7 years are interest-only, the product can potentially save borrowers as much as 25 percent on their monthly mortgage payment during the first 7 years, when compared to
Chapter 4. Washington DC Case Study 83
a market rate conventional loan.12 However, monthly payments increase in year 8 and remain fixed thereafter.
Prospective homebuyers that visit LEDC are often referred to the city’s HPAP program. Based on median income guidelines, households qualify for low- or no-interest loans to assist with downpayment and closing costs. Payments on HPAP loans are deferred for five years. According to income guidelines, moderate-income applicants qualify for $10,000, lower-income applicants qualify for $20,000, and very-low-income households qualify for $30,000. Income requirements are based on a sliding scale, depending on the number of persons in the household, and can range between $65,750—$99,800 for moderate-income households, $47,800—$85,400 for low-income households, and $29,850—$56,350 for very low-income households. Also, an applicant must:
• Be a resident in DC for a minimum of one year;
• Be a first time homebuyer;
• Be able to maintain regular payments on all costs of homeownership;
• Have a good credit history and stable sources of income;
• Meet the HPAP income guidelines;
• Have funds to contribute to the downpayment on the house; and
• Be able to secure financing for a first mortgage loan.
The HPAP application takes one to two months for the City to process. After the family receives the HPAP subsidy, LEDC staff refer clients to lenders to apply for a mortgage. After the household is approved for the HPAP and a mortgage, the housing search process begins.
Of particular importance to Hispanics in the Washington DC area is a pilot program started recently by Citibank and supported by the Association of Community Organizations for Reform Now (ACORN). The mortgage product program was initiated in September 2004, and allows applicants to use an Individual Taxpayer Identification Number (ITIN) in lieu of a Social Security Number. All applicants are required to attend a homebuyer counseling program, demonstrate residency in the U.S. for at least two years, and document two consecutive years of work history. Applicants with no credit history can submit alternative forms of credit, including electricity bills, automobile and insurance payments, and other payments that establish a household’s ability to pay bills regularly. The pilot program is administered in conjunction with Citibank’s Closing Cost Advantage program, which provides $3,000 in grant funding for closing cost assistance. From September 2004 through August 2005, an ACORN representative estimates that 20 households have closed on a property using the pilot program and none of them have foreclosed. Most of these clients were referred to Citibank by a realtor.
VHDA’s website: http://www.vhda.com/vhda_com/Template_A.asp?VHDA_COM_PAGE_NAME=1stChoiceInterestOnly
Chapter 4. Washington DC Case Study 84
12
Wealth Building Manna complements their Homebuyers Club with an Individual Development Account (IDA) program. Manna’s IDA program is competitive, and participants must commit to a long-term savings and education plan in order to be enrolled. Space is limited to three classes of 15 people a year.
Once enrolled, participants must complete Manna's Financial Literacy Training Program (FLTP), which is a 10-week course that focuses on money management skills, including: budgeting, bill payment, record keeping, checking accounts and financial institutions, credit cards and credit management, consumer awareness and expense prioritization, as well as saving and planning for the future. The course is based on the Neighborhood Reinvestment Corporation’s “Realizing the American Dream” curriculum. The IDA classes are only given in English. Following the completion of the FLTP seminar, participants must open an IDA account with a minimum of $90 and are invited to join one of Manna's Homebuyers Club chapters. Participants are required to save $33.33 per month for two years, totaling $800 at the end of the program. Manna matches the participant’s savings with a 5-to-1 contribution, which provides each participant with $4,800 for the downpayment and closing costs on a Manna home.
Manna's IDA program receives matching funds from the Capital Area Asset Building Corporation (CAAB), a non-profit organization in Washington DC. In order to qualify for matching funds, an individual must commit to saving towards a specific asset goal, enroll in the organization’s financial literacy and asset training courses, and meet household income guidelines.
Immigration Services HCV assists immigrants and their families to obtain proper documentation and become permanent residents or citizens. An immigration attorney offers individual counseling assistance and helps clients understand and expedite their immigration cases. Specifically, the immigration attorney provides specialized assistance with:
• Citizenship;
• Permanent residency;
• Work permits;
• The Nicaraguan Adjustment and Central American Relief Act (NACARA)13;
• Visa applications (especially the new K and V Visas, and the existing H-1B Visas);
• Temporary Protective Status applications;
• Renewal of Green Cards; and
• Visa lottery applications;
HCV facilities have cameras and other equipment needed to compile the necessary documents. In 2002, HCV provided over 5,200 immigration-related services to over 1,500 families. By May 2003, HCV’s immigration program served more than 520 clients in one month.
NACARA provides various forms of immigration benefits and relief from deportation to certain Nicaraguans, Cubans, Salvadorans, and Guatemalans (as well as nationals of former Soviet bloc countries and their dependents).
Chapter 4. Washington DC Case Study 85
13
Closing Assistance Most of the providers interviewed in Washington DC provide some form of closing assistance, typically in the form of informal services. For example, providers will explain the closing process to clients and answer questions as needed. The Virginia realtor provides formal closing assistance by helping each client write and submit bids, submit the final contract to the lender and title company, and attend the settlement. The realtor always advises the client to use an attorney and refers clients to a bi-lingual attorney as needed. If the household uses an English-speaking attorney, the realtor recommends that the household bring a relative or friend to the closing to translate. The realtor has an established network of lenders, settlement agencies, and other real estate professionals that he prefers to work with based on past experience. Overall, he always emphasizes the client’s ability to choose who they work with during the process.
Service Provision and Outreach
This section describes the scale of service provision delivered by each organization, the level of service coordination among service providers in the metropolitan area, and the types of outreach that these organizations conduct to market their services. The section also discusses the perceived demand for their services.
Service Provision In the first quarter of FY2004-05, staff from HCV served approximately 283 individuals with one-onone counseling and 189 individuals in the homeownership seminars. Seventy-five clients have closed on homes. Each HCV housing counselor has approximately 32 open cases, which is twice their case load compared to last year, and the current budget does not allow for hiring additional counselors. Overall, HCV staff view their group homeownership education seminars and one-on-one counseling as complementary. The group seminars provide clients with a general understanding of personal finances, credit reports, the mortgage qualification process, the roles played by various industry stakeholders, the home inspection process, and the legal documents that are part of the closing process. The seminars are an essential first step in learning about the homebuying process. The one-on-one counseling offers individualized attention that clients do not receive in the seminars. Clients often have questions about their personal finances that are not asked during the seminars because of privacy concerns. Thus, both of these types of service delivery approaches are viewed by HCV staff as critical to bridging the information gap.
In the past three years, LEDC has packaged nearly 400 client loan packages for the HPAP program in Washington DC; and 61 families – almost all Latinos – were able to purchase homes. The low success rate among applicants is due mostly to rejection by the HPAP program and failure to obtain mortgage financing. LEDC staff speculate that households that do not close on homes are unable to complete the homebuying process due to such factors as an inability to produce the necessary documentation, insufficient savings for a downpayment, and low incomes. Nevertheless, LEDC staff believe that their housing counseling services are very effective in helping Hispanic households achieve homeownership, although external factors such as rising housing prices are increasingly difficult to overcome. LEDC staff believe that homeownership seminars are more effective service models than one-on-one counseling because the group atmosphere helps people feel more comfortable and participants learn from others’ questions. LEDC staff also note that maintaining flexible office hours is important when serving Hispanic populations due to the nature of their
Chapter 4. Washington DC Case Study 86
employment schedules, e.g., seasonal work, multiple jobs, weekend jobs, and day- and night-time shifts.
At Manna, staff believe that a successful homeownership program is built on respect for each client, and also on the provision of supportive services, such as daycare, that allow single parents to attend classes. Manna staff have helped 225 households close on a home since 1994, and acknowledge that downpayment and closing cost assistance programs are increasingly less effective due to escalating housing prices and program requirements. According to Manna staff, sellers frequently do not want to deal with a buyer that is using the HPAP program, for example, due to the required paperwork and because the HPAP program is strict about conducting housing inspections. Staff from Manna, as well as HCV, believe that because the metropolitan housing market is highly competitive, buyers are forced to waive inspections and appraisals. As a result, many buyers are taken advantage of during the homebuying process.
The Virginia realtor estimates that he serves about 55 clients in a year, 80 percent are Hispanic, and approximately 30 to 40 of these clients purchase homes. Thus, the realtor estimates that he helped about 24 to 32 Hispanics purchase homes last year. Clients who do not purchase a home generally postpone homeownership for personal reasons or are discouraged by the high cost of housing.
Partnerships and Service Coordination Partnerships with other service providers throughout the Washington DC metropolitan area play an important role for all the providers in the case study, albeit the level of coordination across various providers is unclear. The overwhelming majority of HCV’s participants hear about their homeownership program by word of mouth and walk-in for services. Some clients (approximately 20 percent) are referred from industry professionals, such as realtors, lenders, or other service providers. HCV staff also refer clients to appropriate housing professionals as needed from a network of service providers developed informally over the past 2 years. The service network is based mostly on client satisfaction and on trust. HCV relies on service providers that receive praise from clients and also demonstrate that their client’s interests were served. However, the manager of HCV’s homeownership counseling program acknowledges that many homeownership-related organizations serving Hispanics tend to keep referrals “in the family.” The manager believes that family-based networks are less likely to serve the best interests of the client and place clients in a vulnerable position.
LEDC have developed more formal relationships with other service providers in the area. LEDC staff tend to refer clients to three primary organizations—Citibank, Bank of America, and Manna Inc.—as these organizations have Spanish-speaking professionals on staff. Language barriers are more common among other non-profit groups and community development corporations that develop affordable housing units in Washington DC because they typically lack to the resources to augment their staffing with a Spanish-speaking professional. LEDC staff seldom refer clients to housing professionals that are located in surrounding suburbs. Thus, LEDC’s network of service providers is small.
Likewise, the realtor has an established network of lenders, settlement agencies, and other real estate professionals that he prefers to work with based on past experience. The realtor will always emphasizes the client’s ability to choose who they work with during the process, but a list of industry stakeholders will be provided to facilitate the process.
Chapter 4. Washington DC Case Study 87
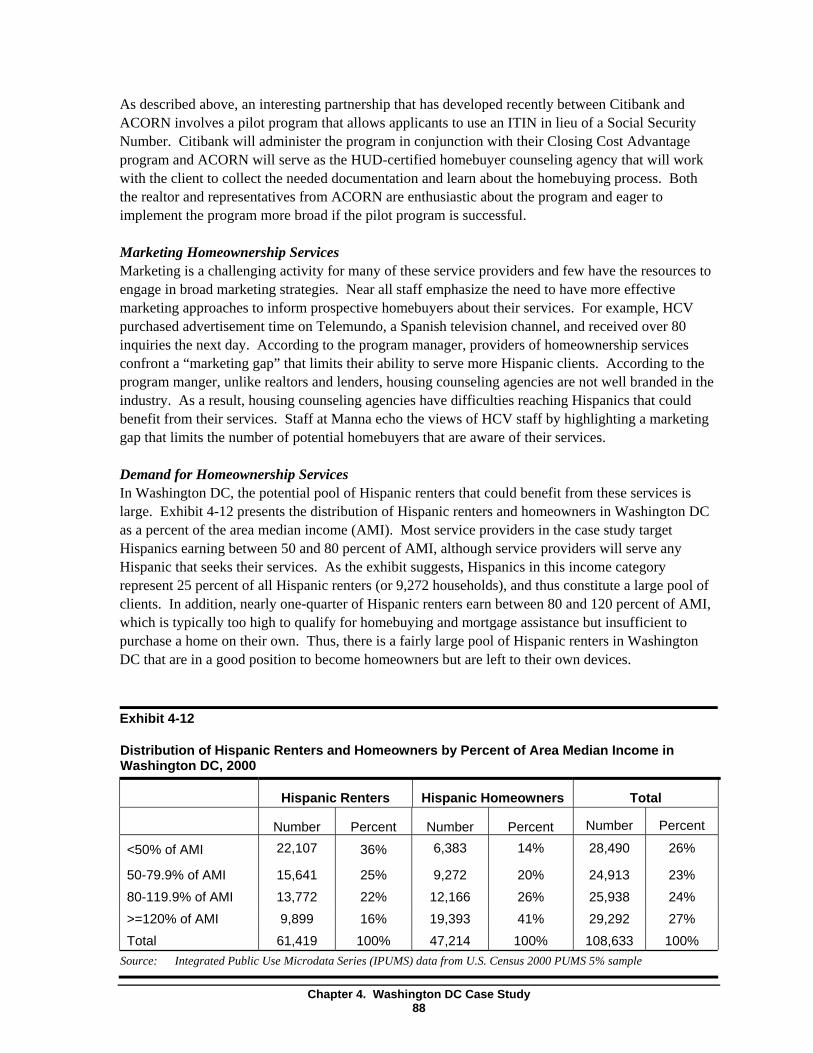
As described above, an interesting partnership that has developed recently between Citibank and ACORN involves a pilot program that allows applicants to use an ITIN in lieu of a Social Security Number. Citibank will administer the program in conjunction with their Closing Cost Advantage program and ACORN will serve as the HUD-certified homebuyer counseling agency that will work with the client to collect the needed documentation and learn about the homebuying process. Both the realtor and representatives from ACORN are enthusiastic about the program and eager to implement the program more broad if the pilot program is successful.
Marketing Homeownership Services Marketing is a challenging activity for many of these service providers and few have the resources to engage in broad marketing strategies. Near all staff emphasize the need to have more effective marketing approaches to inform prospective homebuyers about their services. For example, HCV purchased advertisement time on Telemundo, a Spanish television channel, and received over 80 inquiries the next day. According to the program manager, providers of homeownership services confront a “marketing gap” that limits their ability to serve more Hispanic clients. According to the program manger, unlike realtors and lenders, housing counseling agencies are not well branded in the industry. As a result, housing counseling agencies have difficulties reaching Hispanics that could benefit from their services. Staff at Manna echo the views of HCV staff by highlighting a marketing gap that limits the number of potential homebuyers that are aware of their services.
Demand for Homeownership Services In Washington DC, the potential pool of Hispanic renters that could benefit from these services is large. Exhibit 4-12 presents the distribution of Hispanic renters and homeowners in Washington DC as a percent of the area median income (AMI). Most service providers in the case study target Hispanics earning between 50 and 80 percent of AMI, although service providers will serve any Hispanic that seeks their services. As the exhibit suggests, Hispanics in this income category represent 25 percent of all Hispanic renters (or 9,272 households), and thus constitute a large pool of clients. In addition, nearly one-quarter of Hispanic renters earn between 80 and 120 percent of AMI, which is typically too high to qualify for homebuying and mortgage assistance but insufficient to purchase a home on their own. Thus, there is a fairly large pool of Hispanic renters in Washington DC that are in a good position to become homeowners but are left to their own devices.
Exhibit 4-12
Distribution of Hispanic Renters and Homeowners by Percent of Area Median Income in Washington DC, 2000
<50% of AMI
50-79.9% of AMI 80-119.9% of AMI >=120% of AMI Total
Hispanic Renters
Number Percent 22,107 36%
15,641 25% 13,772 22% 9,899 16% 61,419 100%
Hispanic Homeowners
Number Percent 6,383 14%
9,272 20% 12,166 26% 19,393 41% 47,214 100%
Total
Number Percent
28,490 26%
24,913 23% 25,938 24% 29,292 27% 108,633 100%
Source: Integrated Public Use Microdata Series (IPUMS) data from U.S. Census 2000 PUMS 5% sample
Chapter 4. Washington DC Case Study 88
All service providers agree that the demand for their services is great and increasing every year. HCV’s program manager expects to far exceed their target goals for this fiscal year, and the program is currently running at full capacity. Indeed, HCV staff believe there is a very large demand for homeownership counseling and financial education services, noting that less than 10 percent of homebuyers in the Virginia area use a housing counselor. However, HCV is also operating at, or near, full capacity, and program staff doubt that they could serve many more clients.
Similarly, staff from LEDC and Manna, as well as the realtor, agree that the demand for their services and for affordable housing in Washington DC is extraordinarily high. Each provider agrees that if all Hispanic renters in the DC area were aware of their services, about 50 percent would contact them for services. According to these service providers, there is plenty of evidence to support this view. For example, in 2004, Manna conducted a lottery for 13 units of affordable housing in northwest DC and 250 households applied for the lottery. The realtor believes there is a high demand for his services because of the booming housing market and also because of the poor understanding of the homebuying process among Hispanics. In particular, the realtor believes that Hispanics (as well as other prospective homebuyers) do not understand if a mortgage is appropriate to their circumstances, and some households are approved for mortgages or terms that they cannot sustain in the long run. The realtor cites the use of mortgages with adjustable interest rates as an example because some Hispanics are unaware of the mortgage rate increases that potentially follow the initial few years with a low rate. The realtor concludes that education about the homebuying process is critical to expanding homeownership opportunities to Hispanics.
However, most of these organizations are operating at full capacity. LEDC is currently operating near capacity—each housing counselor sees 10-15 clients per week and each case is open for approximately 2 months. At Manna, the coordinator believes that their homebuyer counseling and IDA programs could serve a few more participants, but demand for services has increasingly strained services and demand will soon exceed their service capacity. Recent analyses of 2004 Census population estimates suggests that the Washington DC metropolitan area has experienced sizable growth among the Hispanic population since 2000. The metropolitan area is ranked 9th among the largest population gains nationwide, and these new Hispanic households will likely strain the service system’s capacity to provide services to prospective homebuyers.
4.4 Conclusions
The interviews with several key organizations in the Washington DC metropolitan area serving Hispanics highlight three main themes. First, potential Hispanic homebuyers in Washington DC need a range of services to confront multiple barriers to homeownership. The services are needed to help Hispanics pursue homeownership, search for and find suitable housing, and obtain mortgage financing. While these services are available throughout the Washington DC metropolitan area, Hispanics must cobble them together from a sequence of organizations. Most service providers have developed a network of referral organizations that can help Hispanics identify and connect with needed services.
Second, the potential demand for services appears to be much greater across the Washington DC metropolitan area than the existing service capacity. Most key service providers are operating at full capacity and all of them acknowledged that many more clients need their services. Many of these
Chapter 4. Washington DC Case Study 89
service providers target Hispanics earning less than 80 percent of AMI, which constitutes over 60 percent of all Hispanic renters in the area. As service providers improve their marketing capacity, many of them except to be overwhelmed with requests for their services. Service capacity may also be strained by households with incomes between 80 and 120 percent of AMI who have been left to their own devices but may need assistance as well.
Third, housing affordability is a primary concern in the Washington DC metropolitan area. Although Hispanic households in Washington DC have higher annual incomes and are generally more educated compared to their counterparts nationally, median annual incomes lag far behind white households and housing appreciation in the area has been dramatic. The efficacy of housing counseling programs and other important service providers in the Washington DC area is constrained by these housing market realities. Service providers have been able to link Hispanics to some financial assistance programs, but the amount of assistance is small relative to the rising cost of housing.
Although state and local subsidy programs exist to bridge the affordability gap for low- and moderate-income households, the effectiveness of such programs is questionable. Downpayment and closing cost assistance programs appear to be inadequate for the current housing market because the amount of subsidy and the maximum mortgage and housing price do not allow participants to purchase an average home in the DC area. Similarly, Virginia’s housing subsidy and mortgage programs are also quickly becoming irrelevant in the escalating housing market. In addition, industry representatives are concerned that in a “sellers’ market” buyers routinely waive inspections to make their bid more attractive and sellers are often less willing to accept subsidy programs that require inspections and additional paperwork if they have other bids to consider.
Chapter 4. Washington DC Case Study 90
Chapter Five Conclusion
This report explores Hispanic homeownership rates and gaps in three market areas: Orlando, San Antonio, and Washington DC. For each market, the report provides an in-depth analysis of Hispanic homeownership rates and gaps and the efforts to address these gaps by exploring:
• The demographic profile of the Hispanic population;
• Hispanic homeownership rates and gaps in comparison to national trends and to non-Hispanic whites;
• Major barriers to Hispanic homeownership, including lack of information about the homebuying or mortgage qualification process, as well as barriers in the housing and mortgage markets;
• The services offered by providers to improve Hispanics’ access to homeownership opportunities; and
• The scale of, and demand for, homeownership services, as well as approaches to marketing and coordinating services.
The report is based on analysis of data from the decennial census and in-depth interviews that were conducted onsite with staff from a range of service providers, including housing counselors, affordable housing developers, mortgage lenders and loan officers, and real estate agents. Each of these industry representatives provides an important perspective about the barriers confronting Hispanics and about the ability of service providers to address these challenges. Overall, the interviews highlight six main themes.
Hispanic homeownership rates and gaps are shaped by the demographic and socioeconomic characteristics of Hispanics. Communities were purposively selected to provide a diverse demographic and socioeconomic profile of Hispanics, because past research suggests that some attributes that vary from place to place explain why Hispanic homeownership rates lag behind non-Hispanic white rates. The case studies confirm this hypothesis. For example, the three case studies highlight the different barriers faced by the three predominant Hispanic groups represented in these communities: Puerto Ricans, Mexicans, and Central Americans. Puerto Ricans represent over half the total Hispanic population in Orlando and, unlike other Hispanic groups, all Puerto Ricans are legal citizens, which grants them access to mortgage products that are not available to undocumented Hispanics. By contrast, proper documentation among Mexicans and Central Americans is a problem identified by service providers in San Antonio and Washington DC. The service providers interviewed in San Antonio do not serve undocumented Hispanics, while a provider in Washington DC addresses this issue by providing immigration services to help establish legal residency.
In Orlando, migration patterns play an important role in understanding homeownership rates and barriers. Hispanics from the North (e.g., Boston and Chicago) and from Miami are moving to Central Florida and these Hispanics generally are better off financially and are able to purchase homes in Central Florida. Census 2000 data suggests that 69 percent of Hispanics in the Orlando metropolitan
Chapter 5. Conclusion 91
area were in a different house in 1995, and among these Hispanics, 26 percent came from a different state (more than half of them from the Northeast). These Hispanics are potentially responsible for driving the higher homeownership rates in Orlando when compared to those of other metropolitan areas.
In San Antonio, Hispanics comprise a large share of the total population (45 percent in 2000), and service providers repeatedly indicated that their size partially explains why homeownership rates in San Antonio are higher than most other metropolitan areas. The demand for homeownership services among Hispanics grows as the Hispanic population grows, which, in turn, prompts more service providers to offer targeted services to Hispanics. For example, providers say that there are more Spanish-speaking professionals working in both the housing and mortgage markets because the demand for these services compels these markets to hire Spanish-speaking staff.
Also, the Washington DC case study demonstrates that Hispanic homeownership gaps do not always narrow as household income increases. This finding counters the prevailing association between income and homeownership rates that has been established in the literature. Although Hispanic homeownership rates increase steadily as income levels increase, gaps do not show any pattern of increase or decrease as income increases; rather they fluctuate between 19 percent and 28 percent across all income levels. The fluctuations in gaps in Washington DC may be attributable to the transient professional, diplomatic, and other international representatives that tend to rent for short periods of time and then return to their home country.
In addition to these market-specific phenomenon, the case studies highlight several barriers that are common across all markets. For example, service providers highlight several demographic characteristics that contribute to Hispanic’s propensity to become homeowners: income, English proficiency, and country of origin. A disproportionate share of Hispanic households are low-income, which is related to the generally low education levels among Hispanics and the relatively high share that work in the service industry. As a result, many Hispanics, particularly in high cost markets, are unable to afford a decent home in an attractive neighborhood. However, the case studies also suggest that many Hispanics earn enough income to be able to buy a home with the help of a variety of downpayment assistance programs.
Service providers also indicate that clients’ English proficiency is an important factor because language skills affect their ability to understand both the homebuying and mortgage qualification processes, which in turn reduces their willingness to consider pursuing homeownership opportunities. Hispanics with poor English language skills are unable to understand credit reports, tax forms, or other documents that are used as part of the homebuying and mortgage qualification process. Hispanic immigrants are also more likely than native-born citizens to be illiterate and thus have trouble understanding basic forms, such as a housing counseling agency’s application form. These clients need individualized one-on-one counseling to help translate and explain each document. Moreover, poor English language skills also discourage Hispanics from contacting a housing counseling agency for fear that no one will understand them, which further reduces their willingness to consider homeownership.
However, it is important to note that because service providers interviewed in these communities offer a similar range of services, they are likely to attract similar types of clients. Their counseling services are aimed at helping those with limited understanding of the home purchase process, many of which are in need of assistance to overcome limited English proficiency. Furthermore, most agencies
Chapter 5. Conclusion 92
serve as a conduit for downpayment assistance and special lending programs aimed at those earning between 50 and 80 percent of AMI. In short, while these markets may differ in the extent to which other groups of Hispanics need homeownership assistance (such as those with somewhat higher incomes, greater English-language proficiency, and some familiarity with the homebuying process), none of the agencies interviewed targeted their efforts at these groups.
The most commonly identified barriers to homeownership among Hispanics are lack of information about the homebuying and mortgage qualification process, lack of affordable housing, and lack of credit or poor credit histories. All service providers agree that many of their Hispanic clients, particularly immigrants, are uninformed about the homebuying process and are unfamiliar with the roles played by different industry stakeholders throughout the process. These clients may not know where to begin the homebuying process; what documentation is required; why credit histories and bank accounts are important; or how to search for an appropriate home. This lack of knowledge is attributed to their disconnect from mainstream financial institutions, bad experiences with these institutions in their country of origin, and poor English-speaking skills. However, service providers said that this attitude may be changing among younger Hispanics who are more assimilated into the American culture. In addition, Hispanics harbor misconceptions about the mortgage qualification process and typically overestimate the requirements to qualify for a mortgage (e.g., they assume that large downpayments and perfect credit are required to buy a home). The lack of knowledge and misconceptions about the homebuying and mortgage qualification process discourage many Hispanics from pursuing homeownership opportunities, undermine their confidence in completing the process, and leave them vulnerable to predatory lending practices. On the other hand, other Hispanics underestimate the mortgage qualification requirements by assuming that anyone with a history of bankruptcies, poor credit, and insufficient savings can qualify for a loan. This underestimation leads some Hispanics to believe that credit and savings are not important factors to becoming a homeowner. According to some service providers, these misconceptions are fostered and reinforced by advertisements from questionable lenders. These Hispanics are susceptible to predatory lending practices.
Service providers in Orlando and Washington consistently cite the lack of affordable housing as a primary barrier to Hispanic homeownership, but less so in San Antonio. The lack of affordable housing is associated with three factors. First, housing prices in these areas are rising at a much higher rate than Hispanic incomes, which are already low relative to median housing values. Thus, homeownership is increasingly out of financial reach for many low-income households. Second, the escalating costs of land, infrastructure, and construction materials limit opportunities to develop new affordable homes for low-income populations. According to several housing developers, the costs of acquiring and renovating homes often surpasses planned budgets, and as a result, home prices increase. These developments also tend to be small and only produce a few homeownership units over several years. Lastly, the affordable housing stock is largely concentrated in distressed neighborhoods or in neighborhoods that are predominantly African-American, yet, some Hispanics prefer to live in neighborhoods that are predominantly Hispanic. A few providers indicate that some Hispanics would rather rent in a predominantly Hispanic neighborhood than become a homeowner in a predominantly African American or white neighborhood or a neighborhood that is populated by a different Hispanic nationality. This factor limits the availability of affordable housing to the extent that Hispanics limit their housing search to a small number of communities with a fraction of the metropolitan area’s affordable housing stock.
Chapter 5. Conclusion 93
In all three markets, those interviewed consistently report that alack of credit or poor credit severely limits the ability of many Hispanic clients to qualify for mortgage products. Several providers indicate that it is not uncommon for Hispanics to not believe in using credit to make purchases and may not have a savings or checking account. Similar to the factors undergriding the lack of information, poor credit histories are attributed to poor financial literacy skills, general mistrust of the U.S. banking system, and poor English-speaking skills. Respondents note that Hispanics’ financial status may differ between first- and second-generation Hispanic households. First generation households may distrust and avoid financial systems in the United States even after being in the country for several years, while second generation households are more likely to become overly indebted, resulting in poor credit histories.
The housing financing process is made easier by the growing use of flexible mortgage products and downpayment assistance programs, but the efficacy of these financing packages is limited by a community’s housing market characteristics and by the targeting of certain Hispanic households for services. The case studies suggest that there are an increasing number of flexible mortgage products capable of addressing credit and other financial barriers to mortgage financing. For example, the NAHREP real estate agent in Orlando has witnessed an increase in the use of “no doc” products that rely for eligibility mostly on an applicant’s credit score, cash reserves, and demonstrated ability to pay bills on time. These products de-emphasize underwriting guidelines that have traditionally served as barriers to qualifying for a loan—documenting income and employment for Hispanics who change jobs frequently. In San Antonio, NHSSA offers two mortgage products that require very low downpayments, feature low, fixed interest rates, and offer second mortgages that can be forgiven over time. Similarly, in Washington DC, HCV clients are referred to the VHDA, which offers several first-time homebuyer products that have made significant inroads into the Hispanic market. Moreover, a pilot program started recently by Citibank and supported by ACORN Housing allows applicants to use an ITIN in lieu of a Social Security Number. Thus, although some Hispanics continue to face credit barriers to homeownership, flexible mortgage underwriting guidelines are improving access to mortgage financing. Access to these products is further facilitated by the work of housing counselors who are helping client become mortgage ready (e.g., opening up bank accounts, developing budgets, and teaching clients to save).
In addition, providers in each community are relying on a variety of downpayment assistance programs to help Hispanics overcome the initial costs of becoming a homeowner. For example, HANDS uses an array of downpayment assistance programs offered by the City of Orlando, Osceola County, Orange County, Volusia County, and the Florida Housing Finance Corporation. Similarly, in San Antonio, a service provider is using an American Dream Downpayment Initiative grant through the City to provide downpayment assistance to its clients. In Washington DC, a large counseling provider is using a city program that offers low- or no-interest loans to assist with downpayment and closing costs, and payments on the loans are deferred for five years. Overall, these downpayment assistance programs are effective at helping Hispanic clients with insufficient savings or wealth to afford the initial costs associated with homebuying.
However, the overall impact of these financing packages on Hispanic homeownership rates is questionable. Service providers reported that some mortgage underwriting guidelines continue to be a major barrier to improving access to mortgage financing, especially the requirement to provide Social Security Numbers. A few pilot programs use an ITIN in lieu of SSN, but the need for these types of products far outstrips the availability. This was especially a problem in San Antonio, where providers cannot serve undocumented Hispanics. In addition, several providers indicated that the
Chapter 5. Conclusion 94
amount of downpayment assistance is small relative to the rising costs of housing. That is, the effectiveness of these programs to assuage the high initial costs of homeownership is limited by housing values that have increased by at least 50 percent between 2003 and 2005 in both Washington and Orlando. Lastly, because service providers and downpayment assistance programs target households earning 50 to 80 percent of area median income (AMI), moderate-income households earning 80 to 120 percent of AMI are ineligible for services or financial support. These households are nearly ready for homeownership, and, although some may need services similar to their low-income counterparts, they are largely overlooked.
The majority of Hispanic clients need most, if not all, of the available services, but clients are typically required to cobble these services together from multiple providers in order to overcome the barriers to homeownership. Service providers offer a wide-range of services to help Hispanics overcome barriers to homeownership, including: homebuyer education counseling, financial literacy classes, housing search assistance, development of affordable housing, assistance with the mortgage qualification process, access to mortgage products, wealth building opportunities, immigration services, downpayment assistance, guidance through the closing process, post-purchase counseling, and referrals to other service providers. Although a few providers have the capacity to function as a “one-stop-shop” for services by providing many of these services in-house, service providers typically offer only some of these services as part of their formal service package and routinely make referrals to other service providers to supplement their services. Housing counselors often limit their involvement after the referral by answering client questions as needed via telephone rather than by directly participating, for example, in the housing search or in the selection of mortgage financing. These breaks in the chain of service provision may result in incomplete homebuying processes if some Hispanic households fail to follow through with the referrals.
Housing counseling agencies offer the most comprehensive package of services and they use three service delivery models: group seminars, one-one-one sessions, and informal counseling. Most clients receive services through all three service models as they progress through the agency’s program. Clients start by attending a group seminar, which is typically designed to provide a broad, introductory overview of the homebuying and mortgage qualification process in a relatively short amount of time—about six hours. These seminars often involve multiple industry stakeholders, such as representatives from housing counseling agencies, mortgage companies, real estate agencies, and title companies, who discuss their role in the homebuying and mortgage qualification process. The seminars are increasingly being offered in English and in Spanish, using standard curriculums, such as the curricula developed by Fannie Mae.
Following the group seminar, clients typically schedule one-on-one counseling sessions. The one-onone counseling focuses on the financial barriers to homeownership and includes a thorough review of each client’s credit report, the development of a budget and financial action plan, and an assessment of the client’s ability to qualify for a mortgage. Clients are usually asked to compile and bring documentation regarding their financial status to their one-on-one counseling sessions (e.g., a budget sheet, picture ID and Social Security Card, employment pay stubs, proof of any other income sources, tax returns, recent bank statements, and proof of rent payments). Staff agree that one-on-one counseling is particularly effective at addressing sensitive issues that clients do not feel comfortable discussing in the group seminars. The individualized counseling is also critical to resolving the unique credit issues that confront clients. The frequency of one-on-one counseling varies considerably depending on the needs of clients and the resources available.
Chapter 5. Conclusion 95
Informal counseling includes the ad hoc guidance that is provided throughout the formal provision of services. For example, real estate agents may help clients understand what documents will be required at closing (i.e., informal closing assistance) at the same time they are helping the client search for appropriate housing (i.e., formal housing search assistance). Similarly, a lender may educate clients about the mortgage qualification process while helping clients qualify for a mortgage. Housing counselors are typically “on-call” to answer clients’ questions as needed in-between one-onone counseling sessions.
Service providers operate within their own preferred network of providers, with the result that service coordination is fragmented across metropolitan areas. Despite a few efforts to better coordinate services metropolitan-area-wide, homeownership agencies in the study rely almost exclusively on their trusted network of referral organizations to supplement their services. That is, the network of organizations used by one agency is likely to be different from the network of organizations used by another agency within the same metropolitan area. These networks are developed and maintained based on trust and past experience. Agencies in the housing and mortgage markets are keenly aware of the questionable practices within their industry and, as a result, providers are careful to partner with other providers who have reputations for being professional, for following through with clients, and for treating clients with patience and respect. Service networks tend to be small (three to six partners) and are used to supplement services that are not provided by the agency. The provider-specific networks tend to be highly coordinated, comprehensive, and based on long-standing relationships.
The network of trusted partners has expanded to include other types of organizations that are not part of the housing and mortgage market industry, e.g., churches and neighborhood organizations. Service providers in all three communities in which we conducted interviews have fostered relationships with neighborhood churches or neighborhood groups to market their services, engage potential homebuyers, and conduct homebuying and financial education classes in their facilities. Churches are viewed as particularly important, because they are viewed as reputable and because service providers can reach a large number of potential clients at limited costs to the organization.
This collection of agency-specific networks suggests that service coordination is fragmented across metropolitan areas. Agencies will only use referral organizations that are part of their network— mostly because they do not trust other organizations with their clients—and only a few large organizations are found on multiple agency-specific networks. In addition, some agencies in the study indicate that the Hispanic community lacks a centralized leadership that can serve as a fulcrum for better service coordination metropolitan-wide.
Interviewed organizations report that there is strong demand for homeownership services among Hispanics, but also that their capacity to serve these clients is increasingly strained. Demand for homeownership services is large and expected to grow as the Hispanic population increases in each of these communities. In all three communities, the potential pool of Hispanic renters that could benefit from these services is large. Most service providers in the case studies serve Hispanics earning between 50 to 80 percent of AMI, which typically represents about 25 percent of all Hispanic renters in these communities and thus constitutes a fairly large pool of prospective homebuyers. In addition, a similar proportion of Hispanic renters in these communities earn 80 to 120 percent of AMI. These renters often do not qualify for many downpayment assistance programs, and they may not qualify for services from some of the service providers interviewed. Thus, there is a large group of Hispanic
Chapter 5. Conclusion 96
renters that are in a good position to purchase a home but are not receiving services or financial support.
Service providers were unable to quantify the precise demand for services, but they offered examples of how their marketing activities resulted in an overwhelming request for their services. For example, in Orlando, NAHREP partnered with Univision to produce a television call-in program called “Linea Ayunda” or “Help Line,” which allowed people to call a 1-800 number and ask questions about the homebuying process. Telephone operators received over 1,000 phone calls during the one-hour program. In Washington DC, Manna conducted a lottery for 13 units of affordable housing in Northwest DC, and 250 households applied for the lottery. In San Antonio, service providers believe that the active demand for service is currently being met, but acknowledge that a large proportion of additional Hispanic renters could benefit from their services.
The demand for services is closely linked to the ability of providers to market their services, and nearly all providers in the study have limited marketing capacity. Few providers engage in systematic marketing, although most conduct some form of marketing through grassroots community engagements or housing fairs. According to some housing counseling agencies, their agency confronts a “marketing gap” because, unlike realtors and lenders, housing counseling agencies are not well branded in the industry. As a result, housing counseling agencies have difficulty reaching Hispanics who could benefit from their services.
On the other hand, nearly all service providers interviewed in these communities are currently operating at full capacity, and most do not have additional resources to add staff or serve new clients. The strain on service capacity is exacerbated by demographic trends in each of these communities. Recent analyses of Census population estimates demonstrate that all three communities are experiencing tremendous growth of Hispanic populations, accounting for a large share of the metropolitan areas’ overall growth since 2000. Accordingly, staff suspect that as the Hispanic population continues to grow dramatically in the U.S., the demand for homeownership services will swell.
Overall, these case studies highlight the prevalence of several common barriers to Hispanic homeownership, and describe similar types of services and service delivery models that are used to overcome these barriers. These case studies also identified significant differences across each market—the demographic and socioeconomic characteristics of Hispanics, the scale of the Hispanic population, and affordability conditions—that influence Hispanic homeownership rates and gaps. Service providers in each of these communities clearly are working very hard to open homeownership opportunities to Hispanics, and overall, homeownership assistance is available to address most barriers. However, a few key issues remain. The distinct impacts associated with particular demographic and socioeconomic characteristics on Hispanics homeownership rates suggest that public and private sector interventions should be tailored to account for the metropolitan-level variations. Furthermore, it is unclear whether the scale of these efforts will continue to meet the demand for these services. Service effectiveness may also be undermined by the lack of coordination across service providers and across stages of the homebuying process. Finally, the lack of any real attention to households in the 80 to 120 percent of AMI group overlooks a large segment of Hispanics that might benefit from assistance to become homeowners. These concerns may suggest that government’s efforts to promote homeownership among Hispanics (and other low-income households) should be mindful of each community’s service capacity and degree of service
Chapter 5. Conclusion 97

coordination, and also account for service gaps in either the stages of the homebuying process or in the types of income groups served.
Chapter 5. Conclusion 98
References
Cortes, Alvaro, Christopher E. Herbert, Erin Wilson, and Elizabeth Clay. 2006. “Improving Homeownership Opportunities for Hispanic Families: A Review of the Literature.” Abt Associates: Cambridge, MA.
Coulson, N. E. 1999. “Why Are Hispanic and Asian-American Homeownership Rates So Low?: Immigration and Other Factors.” Journal of Urban Economics 45:209-227.
Fannie Mae. 2003. “Understanding America's Homeownership Gaps: 2003 Fannie Mae National Housing Survey.” Washington, DC: Fannie Mae.
Frey, William H. 2006. “Diversity Spreads Out: Metropolitan Shifts in Hispanic, Asian, and Black Populations since 2006.” The Brookings Institution: Living Cities Census Series, March.
Krivo, Lauren J. 1995. “Immigrant Characteristics and Hispanic-Anglo Housing Inequality.” Demography 32:599-615.
Lee, Jongho, Louis Tornatzky, and Celina Torres. 2004. “El Sueño de su Casa: The Homeownership Potential of Mexican-Heritage Families.” Los Angeles, CA: The Tomás Rivera Policy Institute.
Masnick, George. 1998. “Citizenship and Homeownership among Foreign Born Residents in the US.” Cambridge, MA: Harvard University, Joint Center for Housing Studies Research Note N97-1. August.
National Association of Real Estate Agents. Median Sales Price of Existing Single-Family Homes for Metropolitan Areas. Preliminary estimate for 2005. www.real estate agent.org/Research.nsf/files/REL05Q4T.pdf/$FILE/REL05Q4T.pdf.
Texas Appleseed. 2005. Building Texas Communities: A Guide for Home Mortgage Lending to Immigrant and Low-Income Families. September.
Wachter, Susan M. and I.F. Megbolugbe. 1992. “Racial and Ethnic Disparities in Homeownership.” Housing Policy Debate 3(2): 333-370.
References 99


![Introductory video [click here] Black Hispanics? “Hispanics come in all colors and shapes. There are Asian Hispanics, white Hispanics, black Hispanics.](https://static.fdocuments.us/doc/165x107/56649c825503460f9493a192/introductory-video-click-here-black-hispanics-hispanics-come-in-all-colors.jpg)