Efficient separation of precious metals from computer ...
16
Efficient separation of precious metals from computer waste printed circuit boards by hydrocyclone and dilution-gravity methods Downloaded from: https://research.chalmers.se, 2021-11-14 09:46 UTC Citation for the original published paper (version of record): Bilesan, M., Makarova, I., Wickman, B. et al (2021) Efficient separation of precious metals from computer waste printed circuit boards by hydrocyclone and dilution-gravity methods Journal of Cleaner Production, 286 http://dx.doi.org/10.1016/j.jclepro.2020.125505 N.B. When citing this work, cite the original published paper. research.chalmers.se offers the possibility of retrieving research publications produced at Chalmers University of Technology. It covers all kind of research output: articles, dissertations, conference papers, reports etc. since 2004. research.chalmers.se is administrated and maintained by Chalmers Library (article starts on next page)
Transcript of Efficient separation of precious metals from computer ...

Efficient separation of precious metals from computer wasteprinted circuit boards by hydrocyclone and dilution-gravitymethods
Downloaded from: https://research.chalmers.se, 2021-11-14 09:46 UTC
Citation for the original published paper (version of record):Bilesan, M., Makarova, I., Wickman, B. et al (2021)Efficient separation of precious metals from computer waste printed circuit boards byhydrocyclone and dilution-gravity methodsJournal of Cleaner Production, 286http://dx.doi.org/10.1016/j.jclepro.2020.125505
N.B. When citing this work, cite the original published paper.
research.chalmers.se offers the possibility of retrieving research publications produced at Chalmers University of Technology.It covers all kind of research output: articles, dissertations, conference papers, reports etc. since 2004.research.chalmers.se is administrated and maintained by Chalmers Library
(article starts on next page)

lable at ScienceDirect
Journal of Cleaner Production 286 (2021) 125505
Contents lists avai
Journal of Cleaner Production
journal homepage: www.elsevier .com/locate/ jc lepro
Efficient separation of precious metals from computer waste printedcircuit boards by hydrocyclone and dilution-gravity methods
Mohammad Reza Bilesan a, *, Irina Makarova a, Bj€orn Wickman b, Eveliina Repo a
a Department of Separation Science, LUT University, FI, 53850, Lappeenranta, Finlandb Department of Physics, Chalmers University of Technology, 412 96, Gothenburg, Sweden
a r t i c l e i n f o
Article history:Received 22 June 2020Received in revised form5 December 2020Accepted 9 December 2020
Handling editor: Cecilia Maria Villas Boas deAlmeida
Keywords:Waste printed circuit boardHydrocycloneGravity methodPrecious metalsRosin-Rammler-Bennett model
* Corresponding author.E-mail address: [email protected] (M
https://doi.org/10.1016/j.jclepro.2020.1255050959-6526/© 2020 The Author(s). Published by Elsevie).
a b s t r a c t
To fulfill the different aspects of green chemistry and to achieve full use of the secondary resources(waste printed circuit boards (WPCB)), the necessity of developing green methods for recovery ofprecious metals (Au, Pd, and Ag) is highly demanded. In this study, a novel environment-friendly physicalseparation approach; the combination of crushing, grinding, sieving as pretreatment steps alongsidehydrocyclone and the dilution-gravity method (DGM) as the main final steps; is proposed. Inductivelycoupled plasma-mass spectrometry (ICP-MS), atomic absorption spectroscopy (AAS), and energy-dispersive X-ray spectroscopy (EDS) characterization methods were utilized to understand the effectsof different separation steps applied in this research. The size and shape of grinded materials and theones produced after hydrocyclone and DGM were evaluated using scanning electron microscopy. Theresults showed that the sieving step separated the highest gold fraction in the finer classification(<75 mm) while placed the copper (70 wt.%) into the coarser contents. The overflow to underflow outletdiameter ratio and inlet pressure was evaluated to determine the separation efficiency of a hydrocycloneeffect of parameters. In the best-case scenario at 3 bar hydrocyclone operation pressure where theoverflow to underflow outlet diameter (Do/Du) was 6.5, the highest metal fraction (87 wt.%) was ach-ieved in the sink of the DGM. In this case, the total separation efficiency of gold, palladium, silver, andcopper was 75%, 78%, 64%, 72%, respectively. Thus, this study demonstrates the feasibility of utilizing thesieving as mentioned above classification pretreatment steps followed by hydrocyclone and DGMmethods as promising approaches for recovering precious metals from WPCBs that contain annuallyalmost 50 million tons of e-waste.© 2020 The Author(s). Published by Elsevier Ltd. This is an open access article under the CC BY-NC-ND
license (http://creativecommons.org/licenses/by-nc-nd/4.0/).
1. Introduction
End-of-life printed circuit boards are one of the fastest-growinge-waste streams which pose potential environmental and healththreats. Furthermore, due to the significant quantity of preciousmetals in circuit boards, finding the most effective and affordableseparation method to separate the valuable metals is increasinglyimportant to eradicate e-waste piling up in the landfills. E-wastegeneration is estimated to be approximately 50 million tons of e-waste per annum (Ruediger K., 2011; Huisman J., 2012). The recy-cling of e-waste improves supply chain sustainability and support acircular economy. Mainstream metals refining corporations arecurrently exploiting profits from e-waste and touting for business.
.R. Bilesan).
r Ltd. This is an open access article
High client demand for the newest and most powerful gadgetsleads to increasing electronic device production. Therefore, lesssophisticated techniques tend to be used for recovering metals(Purchase, D., 2020), which have harmful implications for both la-bor safety and the environment. These activities, which involvelandfills and factories can threaten public health and ecosystemsseriously. Furthermore, the implementation of efficient processesand feasible techniques is essential in valuable metals recoveryfrom e-waste, and new and improved techniques for increased ef-ficiency of e-waste recycling are highly sought after.
The average values of selected material composition in WastePrinted Circuit Boards (WPCBs) are presented in Table 1.
Generally, the non-metal fraction (NMF) of WPCBs representsapproximately 70% of the mass of the WPCB. The NMF consists offiberglass or cellulose as reinforcing materials (3%), EPDM (0.9%),epoxy, and phenolic or polyester as resins (3%). The most commontypes of WPCBs are etain (3.9%), polyethylene (2.1%),
under the CC BY-NC-ND license (http://creativecommons.org/licenses/by-nc-nd/4.0/

Table 1Material composition of Printed Circuit Boards (PCBs).
Materials Element Vasile et al.(2008)
Hino et al.(2009)
Birloaga et al.(2013)
Yang et al.(2009)
Oishi et al.(2007)
Behnamfardet al. (2013)
Fogarasi et al.(2014)
Gramatyka et al.(2007)
Cui and Zhang(2008)
Average
Organicepoxyresin
C(wt.%) 24.7 18.1 e e e e e e e 21.4H(wt.%) 1.38 1.8 e e e e e e e 1.6N(wt.%) 0.85 0.32 e e e e e e e 0.6Br(wt.%) 4.94 5.07 e e e 5.88 e e e 5.3Sb(wt.%) e 0.45 e e 0.16 0.37 e e e 0.3
Inorganicglass fiber
e e 37.6 e e e e e e e 37.62
Elements Cu(wt.%) 13.8 14.6 30.6 25.1 26 19.2 18 20.12 14.3 20.2Fe(wt.%) 1.97 4.79 15.21 0.66 3.4 1.13 3 8.11 4.5 4.8Sn(wt.%)
e 5.62 7.36 1.86 4.9 0.69 4 4 e 4.1
Ni(wt.%) 0.17 1.65 1.58 0.0024 1.5 0.17 1.11 2 1.1 1.0Zn(wt.%) e e 1.86 0.04 2.6 0.84 1.71 1 e 1.3Pb(wt.%) e 2.96 6.7 0.8 3 0.39 2.31 2 2.2 2.5Au(ppm) e 205 238 e e 130 110 100 566 224.8Ag(ppm) e 450 688 e 630 704 180 200 639 498.7Pd(ppm) e 220 e e e 27 e 100 124 117.8
M.R. Bilesan, I. Makarova, B. Wickman et al. Journal of Cleaner Production 286 (2021) 125505
polypropylene, polyesters, and polycarbonates (6.9%), PVC (6%), andABS (4.2%) are typical plastic components (Guo et al., 2009). Therest of the constituents are silicon, bismuth, beryllium, calcium, andmagnesium oxides (Tiwary et al., 2017). On the other hand, WPCBsare an essential source of base and precious metals providing aneconomic incentive for their recycling (Lehner T., 1998; Bleiwas D.and Kelly T., 2001; He et al., 2006; Deveci H. et al., 2010). Theaverage metal content in WPCBs is approximately 30e35% (VasileC. et al., 2008; Birloaga I. et al., 2013; Oishi T. et al., 2007;Fogarasi S. et al., 2014).
Most of the inorganic materials included in PCBs are reported tothe density range of 1.55e19.3 g/cm3. WPCBs contain variousvaluable metals such as copper, silver, gold, and palladium.Furthermore, the different density characteristics of the elementsin PCBs can be taken into consideration for the separation of non-metals and precious metals. As gold especially has the highestdensity among the other elements, gravitymethods can provide thebest selective separation for the gold (Gray, T., 2012).
Due to the mutual challenges regarding the e-waste recycling, itis necessary to design the new methods for the recovery of metals.On the one hand, according to the newest designs of Gigabyte andAsus [1, 2] in their future PCBs, a higher amount of precious metalsis being used to upgrade desired features of the electronic andelectric boards’ demands. On the other hand, to recover the valu-able metals, hazardous materials such as lead and flame retardantbearing chemicals require pretreatment before proper disposal(Kumar A. et al., 2018). China, India, and South Africa, which are thetraditional destination of the global e-waste, have introduced newstrict regulations in terms of importing e-wastes (Guarnieri P.,2020; Goodship V., 2019; Zhang S., 2015). While there are manychallenges for e-waste recycling and exporting, the most effectiveway to solve the problem is to develop an affordable and moreenvironmentally friendly recycling technology to ease the burdenof e-waste recycling for industry. However, it is worth mentioningthat precious metals extraction from virgin-mines is strugglingwith the technology and environmental challenges. For instance,the gold concentration in ores to be mined can be as low as 0.4 g/tand it is more complicated to concentrate the content (Lee J. C. andSrivastava R. R., 2016). Furthermore, highly toxic chemicals such ascyanide are required to recover the gold. Therefore, e-waste
2
recycling will bring a reasonable point to be considered as theprimary precious metals’ mines.
There are different physical and mechanical recycling tech-niques for e-waste treatment. The following separation steps usecyclone, fluidization, or jigging as the separation method (He W.et al., 2006; Xue M. et al., 2012; Barnwal A. et al., 2020; Zhu X. N.et al., 2020, Cui J., and Forssberg E., 2003). These methods includedifferent pretreatment steps such as dry crushing and pulverizingto obtain a mixture of metal and non-metal components. Magneticseparation to extract ferrous particles, eddy current, and highvoltage electrostatic separators to separate the metal constituentsare also utilized (Xue M. and Xu Z., 2013; Duan C. et al., 2009; Leet al., 2014; Ilyas S. et al., 2014). Regarding the feasibility of therequirements, technologies can be combined into one unit sectionwith automated lines for e-waste recycling (Zhou L. et al., 2012;Duan et al., 2009). However, applying pretreatment before me-chanical and physical separations affects the cost of the separationprocesses. In addition, the previous mechanical and physicalstudies encounter with some issues, for instance, agglomeration offine particles during cyclone and fluidization. Regarding the gravityseparation methods, as the particle size is reduced (<100 mm), thewater flow becomes dominant over the centrifugal force thereforethe gravity separation of fine particles could not be effective(Murthy Y. R. et al., 2011; Barnwal A. et al., 2020). In fluidization, thecollector requirements such as ionic collectors (oil) to separatehydrophobic and hydrophilic materials will add further organicremoval steps for powders, which are used for highly sensitiveelectrochemical recovery methods.
The significant complex, layered design of WPCBs makes itcomplicated to achieve an efficient separation by so-called jiggingprocess whereas the leading force is used oscillation by the pulsingof water through the material that allows separate suspension intolayers according to different densities (the heaviest concentrateforming the lowest layer and the lightest product the highest one).The negative point of this technique is the impossibility of dividingparticles less than 1 mm in size (Schubert G, 1991). In addition tothe abovementioned pretreatment methods, thermal treatmentand pyrolysis are presented as thermal recycling techniques, whichare considered as the supplementary procedure to achieve extranon-metals separation (Fujita T. et al., 2014). According to the most

M.R. Bilesan, I. Makarova, B. Wickman et al. Journal of Cleaner Production 286 (2021) 125505
recent studies, high temperatures up to 800 �C have been consid-ered to eradicate the toxic compounds emissions in separationprocedures, and purifying the metals’ values (Barnwal A. et al.,2020; Nie C.C. et al., 2020; Hossain et al., 2018; Shokri et al.,2017; Ulman et al., 2018a, 2018b). However, besides high energyconsumption, it is acknowledged that the different heating stepscan lead to removing Au contents in the solder films. Regarding theequilibrium diagram phase, at the temperature of 250 �C, a two-phase of 63Sne37Pb matrix and AuSn4 intermetallic compoundcan be formed (Vianco P.T. et al., 1996, 1993). Therefore, the intro-duction of a viable method without thermal treatment is of para-mount for WPCBs’ recycling. Comparison of different approachesabout recycling of WPCBs are presented in Table 2.
Motherboards were used as an object of research, whereasprinted circuit boards can be collected either from other secondaryresources. It can be noticed that even in one form of PCBs, forinstance, motherboards, the amount of precious metals variedconsiderably through the years. In particular, gold values above1000 ppm were reported in 1993 and 1995. Since then, all valueshave been reported are below 1000 ppm, with most values below100 ppm (Bizzo W.A. et al., 2014). Therefore, considerable differ-ences in the composition of collected PCBs should be considered inrecycling techniques. Similar types of PCBs provide more homo-geneous material to the mixtures of different e-wastes.
This work aims to define the leading affordable and morestraightforward strategies for the separation of valuable metals andthe non-metal fraction (NMF) from e-waste based on the dilution-gravity method (DGM) combined with a hydrocyclone. All theWPCBs’ powders are controlled by water flow during the separa-tion process. Hydrocyclone was chosen as a feasible method thatwas successfully applied for separation of plastic waste (Gent M.et al., 2018; Fu S. et al., 2019). However, to the best of authors’knowledge separation of WPCBs have not been studied extensivelyby hydrocyclone. The milling and sieving steps were considered asthe first vital steps to concentrate the valuable components. On theone hand, it was expressed previously that fine particles are chal-lenging for the hydrocyclone method as lower efficiencies can beobtained (Vieira, L.G. and Barrozo, M.A., 2014). On the other hand,the finer particle size distribution is vital for enhancing the recov-ery steps. Consequently, the optimal operating configurations ofthe hydrocyclone were investigated. The hydrocyclone technique isa simple design, it has high reliability, and uses low maintenanceequipment which is required to separate uniform shapes, sizes, andhigher density of precious metals. In addition, the dilution-gravitymethod (DGM) is considered as a simple, efficient method com-bined with hydrocyclone. The process was evaluated by inductivelycoupled plasma-mass spectrometry (ICP), atomic absorptionspectroscopy (AAS), scanning electron microscope (SEM), andenergy-dispersive x-ray spectroscopy (EDS) analysis. The Rosin-Rammler-Bennett (RRB) model was used to evaluate the separa-tion characteristics of the particle size distribution results obtainedby particle size analyzer. Therefore, this study design is based on asimple, environmentally friendly method with the advantage oflow toxic dust dispersion.
2. Materials and methods
2.1. Materials and sample preparation
Disassembled printed circuit boards (motherboards) from end-of-life computers (manufactured between 1998e2010, LUT Uni-versity, Finland) were cut into pieces of 30 mm � 30 mm by a HandGuillotine Shear Cutter. Further, the comminuted parts were milledto 0.25 mm grain size using a cross beater mill (Retsch, SK 300,Germany) with a rotating speed of 3000 min�1 to fragment the
3
components. The sieving step was performed by using a sieveshaker (Horizontal Sieve Shaker AS 400 Control, Retcsh, Germany)to classify powder based on the grain size. The samples weredivided into five different size fractions. The set of sieves was 200,150, 100, and 75 mm.
2.1.1. Hydrocyclone separation methodIn the first step of separation procedure, a Richard Mozley
Limited (Redruth, UK) hydrocyclone (Fig. 1) was utilized to separatevaluable metals through a continuous classification of solid parti-cles according to their different size, shape, and density charac-teristics (Bai et al., 2009b; Ghadirian et al., 2015). Hydrocycloneconsists of a cylindrical section at the top and a conical base. In thismethod, the suspension is fed through a tangential inlet to generatea centrifugal field by a downward helical vortex inclining close tothe wall of the hydrocyclone. The vortex approaches the underflowoutlet when a reverse helical flow in the axial direction towards thevortex finder is generated. The vortex finder is a tube positionedaxially from top of the hydrocyclone towards the lower edge of thesuspension entry. The coarse and high dense particles in the feedstream are directed to the underflow outlet (Cilliers J. J, 2000;Cullivan et al., 2004; Svarovsky, 2000).
The overflow diameter was 14.3 mm, the cone angle 7�, and thecolumn thickness 5 mm. The hydrocyclone separation procedurewas accomplished in different overflow (OF) to underflow (UF)diameter ratio (Do/Du) at different feed inlet pressure over therange of 1e3 bar. The details of the performed experiments arepresented in Table 3. In order to change the Do/Du ratio, theunderflow diameter was altered over the range of 1.5e5 mmwhilethe overflow diameter (14.3 mm) was kept constant. Particle sizelower than 75 mm was selected due to the highest fraction ofpreciousmetals in this sieved portion. Moreover, lower particle sizewill enhance the leaching efficiency (Sun et al., 2018) during thechemical/electrochemical recovery of valuable constituents whichcan be considered for the future research. Therefore, the suspensionof 120 g motherboard powders with particle size lower than 75 mmdispersed into 10 L of water was used for each experiment(Svarovsky L., 2000; Gonçalves et al., 2017). In order to minimizethe effect of particles’ agglomeration, all the suspensions werethoroughly mixed at the stirring rate of 1000 rpm. In each set ofexperiments, at first the hydrocyclone was set to the desiredpressure and the suspensionwas recirculated for 15min to stabilizethe system, and to achieve a homogenized suspension. Thereafter,the samples were taken from both overflow and underflowsimultaneously at a defined constant time. The same procedurewasapplied for different Do/Du ratios.
2.1.2. Dilution-gravity methodIn the next step, the dilution-gravity separation (DGM) (Ren Y.
et al., 2017) of underflow samples from the hydrocyclone stepwas performed. In the DGM, the underflow suspended solutionwasinitially transferred into clean glass beaker and diluted by ultrapurewater until 1000 mL (Fig. 1). Thereafter, the diluted suspensionwasmechanically stirred with a propeller stirrer at 500 rpm at 22 �C for5 min. Afterwards, 900 mL of supernatant including float samplewas transferred to another beaker and subsequently filtered using aBuchner system and Whatman paper (grade 42 filter paper what-man®, UK). The rest of the solution (100 mL) including sedimentswas also filtered and called as the sink samples for further analysis.It should also be mentioned that both hydrocyclone and DGMmethods were carried out in triplicate at optimum experimentalconditions in terms of the highest recovery of precious metals toensure the results’ reliability.

Table 2Comparison of approaches about WPCBs recycling.
Methods Feed Aims and approaches Results References
Pyrometallurgy PCBsapproximately2e3 cm2, and100 mm.
- To produce metal alloys by two stage heattreatments. Cu, Pb, Sn and Sb recovery atdifferent temperatures and using different heattreatment times (400e500 �C, and 1000e1200�C).
- (PCBs exposed at 400e1350 �C, 15e60 min.- High voltage pulse generator was applied torecover copper foils at 2 KWh/kg.
- Roasted (800 �C, 5 h) and further smelting(1500 �C, 2 h). PCBs were heated in vacuumpyrolysis at 500e700 �C.
- High Cu recovery (up to 94%).- Plastics and ceramics can be separated below400 �C.
- High environmental effects by evolution oftoxic gases (methane, carbon monoxide,carbon dioxide, and dioxins-furans withmassive carbonaceous slag formation).
- Low economic benefits.- The final big metallic droplets need moreleaching solutions and time to be recovered.
- High energy consumptions on heatingprocedure.
(Hossain et al., 2018; Ulmanet al., 2018a, 2018b; Shokriet al., 2017)
Physical process(floatation andmulti-gravityseparationmethods)
PCBs powders<1.5 mm.
- Energy-intensive milling (10 h) proceed to cryomilling to produce nanoscale alloys.
- Tabling, eddy current separator, floatation,multi gravity separator, and heavy mediaseparation were used for metals recovery.
- Complex triboelectric separator and airfluidization setup (0.03e15 m/s and 40e80 m3/h)
- Complicated steps and cost-effective equip-ment such as electrostatic separator, tribo-electric. separator, and cryo milling is used.
- High reagent costs.- Low economic benefits.- The final metal powder was 56e72% Cu, 1e3%Fe, 7e10% Sn, and 5e8% Pb.
(Duan et al., 2009; Estrada-Ruizet al., 2016; Guo et al., 2011;Han et al., 2016; Nekouei et al.,2018; Zhang et al., 2018a,2018b)
Physical process(floatation andmulti-gravityseparationmethods)
PCBs powders<0.5 mm.
- Multiple steps such as hydrocyclone, tabling,eddy current separator, floatation, and multigravity separator are used for metals recovery.
- Coarser particles were considered for theseparation.
- Hydrocyclone was used only to remove the fineparticles as the least metal fraction.
- More complicated steps and cost-effectiveequipment such as eddy current separator,multi gravity separator was used.
- No precious metals characterization wasreported.
Das et al. (2009)
Physical process(fluidizationand thermalexposure)
random accessmemory(RAM) cardswith 100e500 mm sieve.
- Recovery of copper values from discarded RAMcards.
- Compressed air and tap water are applied andused for fluidization with airflow of 1e5 m/s.
- thermal exposure of underflow at 1000 �C for1 h is applied to achieve higher purification.
- Regarding the ICP results, Cu and Auconcentrations were increased by 2 and 1.2times, respectively (after fluidization).
- 95% of metals were separated from non-metalsafter separation.
- High energy consumptions on heatingprocedure was introduced.
- No fine particles were considered for theseparation.
Barnwal et al. (2020)
Hydrocyclone andcylindricalcyclone
plastic prills2.8e8.0 mm
- The effect of particle flakiness on the quality ofplastic particle waste density separations.
- Pulp density is less than 10%, pressure 0.14 bar(hydrocyclone) and 0.40 bar (cylindricalcyclone)
- Cone angel: 24�; diameter ratio (Do/Du): 27/13; total length of hydrocyclone: 303 mm andcylindrical cyclone: 420 mm.
- Separation efficiency of plastic is from 52.1%(hydrocyclone) to 100% (cylindrical cyclone).
- The cylindrical design of hydrocyclone wasused for increasing of separation efficiency ofwaste plastic particles.
- No metal and fine particles were considered forthe separation.
- A narrow range of particle densities wasselected (0.924e1.303 g/cm3)
- High-dense particle separation was notreported.
Gent et al. (2018)
Present study(Hydrocycloneand Dilution-gravitymethods)
PCBs <75 mm - The separation of valuable metals and the non-metal fraction was focused.
- The e-waste volume reduction and preciousmetals separation at the liberation step wasconsidered.
- The hydrocyclone (3 bar), and the DGM(500 rpm, 22 �C for 5 min) allowed to achievehighest purification.
- The method requires simple design.
- The total separation efficiency of Au, Pd, and Cuwas obtained 75%, 78%, and 72%, respectively.
- The Au, Pd, and Cu amounts are increased 2, 2.2,3 times.
- The e-waste volume reduced to 61 wt.% of thewhole initial feed at the liberation step.
- The sieving step separated most of the gold(73 wt.%), and palladium (66 wt.%) fractions inthe finest fraction (<75 mm), while most of thecopper (70 wt.%) was separated to the coarserfraction (>75 mm).
- The inefficient separation of finer particles waseradicated by hydrocyclone with theseparation of high dense, uniform contents.
- An efficient pollution-controlled separationprocedure was introduced. The water can bereused after each run.
- About 87 wt.% of metals are recovered in theseparated content.
- Higher economic benefits. (Only water in lowpressures are used, and the final fine metallicpowders need lower amount of leachingsolutions and time to be recovered.). It has highreliability and uses low maintenanceequipment.
Present study
M.R. Bilesan, I. Makarova, B. Wickman et al. Journal of Cleaner Production 286 (2021) 125505
4

Fig. 1. Schematic of a hydrocyclone and DGM.
M.R. Bilesan, I. Makarova, B. Wickman et al. Journal of Cleaner Production 286 (2021) 125505
2.2. Characterization technique
The feed, underflow, overflow, float, and sink samples’ fractionswere dried at 80 �C to measure the separation efficiency andelemental concentrations. A microwave-assisted digestion tech-nique using the SRC system (UltraWave™, Milestone, Sorisole,Italy) was utilized to dissolve 1 g of sample. The samples wereweighed and added to microwave digestion vessels which were
Table 3Hydrocyclone experiment plan.
Sample code Underflow diameter (mm) Overfl
Test 1 UF5P1 5 2.86Test 2 UF5P1.5 5 2.86Test 3 UF5P2 5 2.86Test 4 UF3P1 3 4.77Test 5 UF3P1.5 3 4.77Test 6 UF3P2 3 4.77Test 7 UF3P3 3 4.77Test 8 UF1.5P3 1.5 9.53Test 9 UF2.2P3 2.2 6.50
5
then filled with 3mL HCl and 1mL HNO3 analytical grade solutions,according to the ISO standard 11,466. The vessels were sealed andpressurized with 40 bar of argon 99.999%, and then temperatureand pressure were increased to 250 �C and 200 bar, respectively.After the cooling period, the samples were transferred from eachtube to a new 50 mL tube and subsequently diluted using distilledwater until 50 mL. Prior to each elemental analysis, the sampleswere initially filtered through a Phenex 0.45 mm nylon membranesyringe filter (Phenomenex Inc, US) to remove undissolved particlesfrom the solutions. Inductively coupled plasma-mass spectrometry(ICP-MS, Agilent Technologies 7900, US) was utilized for measuringmetal concentration. In addition, atomic absorption spectroscopy(AAS) (3300 AAS, Thermo Fischer Scientific, US) was more specif-ically used for gold concentration measurement. Furthermore, thedifferent sizes and shapes of the particles from the initial feed,overflow, and sink samples of optimum condition were evaluatedby scanning electron microscope (SEM) (Hitachi SU 3500, Japan).Energy-dispersive x-ray spectroscopy (EDS) mapping of the sam-ples was also performed using Hitachi SU 3500 scanning electronmicroscope to observe elemental distributions with a carbon tapebackground. The software ImageJ was used to determine the lengthof the particles observed in SEM images. Moreover, the cumulativevolume particle size distribution (PSD) of the solids in the under-flow, float, and sink samples was studied by Mastersizer 3000particle size analyzer (Malvern Co, UK).
2.3. Theory
To utilize the solid-liquid separation process to remove the non-metal fraction (NMF) and to separate the precious metal contenteffectively, the separation efficiencies of metals such as Au, Ag, Pd,and Cu, were calculated by the following equations (Eq. (1) and Eq.(2)) (Golmaei M. et al., 2018).
EH%¼�mu
mi
�� 100; (1)
EDGM%¼�ms
mu
�� 100; (2)
wheremu is the solid mass fraction of underflow and mi is the totalsolid mass fraction of the underflow and overflow. ms is the solidmass fraction of sink. All mass values are considered in grams.
The total separation efficiency (Et) of the valuable metals can becalculated by Eq. (3) (Golmaei M. et al., 2018):
Et%¼�mu
mi
��ms
mu
�� 100: (3)
The total separation efficiency is a key parameter for the
ow to underflow diameter ratio (Do/Du) Hydrocyclone pressure (bar)
11.5211.52333

Fig. 3. Distribution of Cu, Pd, Ag, Al, Ca, and Pb fraction in the different sieve sizes.
M.R. Bilesan, I. Makarova, B. Wickman et al. Journal of Cleaner Production 286 (2021) 125505
valuable metals’ separation process, which gives us a viewpointtoward the total performance of both hydrocyclone and DGMmethods.
The Rosin-Rammler-Bennett (RRB) model (Rosin P. A. U. L, 1933)fitting was in accordance with the size distribution model of theempirical dataset characteristics. The RRB model function calcu-lates the spread parameter (PSD width) of the distribution (nR) andthe parameter affecting the mean size of distribution (XR (mm)) atthe different separation stage. nR demonstrates the sharpness ofseparation and the particle uniformity. Therefore, it is called as the“uniformity constant”. The uniformity constant nR is the slope of ln[l/(1 - F(x)] versus x. XR is the particle size corresponding to 63.2%(1 � l/e ¼ 0.632) cumulative mass distribution undersize (VesilindP. A, 1980).
The general cumulative volume form of RRB model is expressedby Eq. (4) (Rosin P. A. U. L, 1933):
FðxÞ¼1eexp�e
�XXR
��nR
; (4)
where the F(x) is the undersize distribution assuming the constantmass volume of all particles smaller than or equal to X, which is theparticle size (mm). The solver tool available in Microsoft Excelsoftware was applied to find the values of XR and nR. The non-linearoptimization method was utilized by minimizing the residual sumof squares (RSSs). All particle size distribution data were measuredtwice. The average data obtained from each sample was evaluatedfrom two different experimental results.
3. Results and discussion
3.1. Particle size, shape, and liberation characteristics
WPCBs are a multi-component system that plays essential rolein both the milling and crushing steps, ultimately leading to theacquisition of different classifications for each material. Fig. 2, de-picts the distribution function of the metals’ size range in theWPCBs. The analysis of metals concentration in the sieved WPCBsindicates that the elemental composition varies widely in thedifferent particle size fractions. Indeed, among the finest particlessmaller than 75 mm in Fig. 2, higher gold concentration (124mg/kg)was achieved. Therefore, higher gold concentration can be obtainedby a simple sieving step. Besides, the finer fraction contained61 wt.% of the whole e-waste. Interestingly, not only the highestgold fraction was reached by a simple mechanical liberation step, ahigher copper concentration was observed in the coarser particles(200e250 mm). Meanwhile, the finest particle fraction showed the
Fig. 2. Distribution of Au and PCBs’ fraction in the different sieve sizes.
6
lowest copper content. A similar trend of mass fraction distributionof WPCB over the range of less than 300 mm was observed when atwo steps physical separation method to crashed WPCB wasinvestigated (Guo C, et al., 2011; Dias P.R. et al., 2016; Barnwal A.and Dhawan N, 2020).
Fig. 3 represents the classification of metals into the differentsize categories after sieving. The mass fraction which was illus-trated in Fig. 3, represents the Cu weight percentages among thewhole considered part, including both metals and non-metalsfractions. Copper has a higher thickness (>35 mm) than gold(0.05e2.54 mm) in PCBs (Vianco P. T. et al., 1996) and therefore it isalso the most abundant metal in WPCB. In addition, due to its highductility characteristics, copper is accumulated in the coarser par-ticle fraction. However, the amount of aluminum increased from0.42 wt.% to 2.86 wt.%, and the amount of calcium from 0.50 wt.% to6.04 wt.% from coarser (200e250 mm) to finer (<75 mm) fraction.Such kind of metal distribution could be related to the elements inthe substrate of PCB. Due to the initial fibers structure of the sub-strate, it is easily to cut into long-shaped rods and during sievingaccumulates into finer fraction. The long needle regular structure(5e350 mm), attributed to Al, Si and Ca based on the EDS mappingresults, was found for the non-metal fraction (Fig. 4b and 4.d). Thediameter of these long-shaped needles was approximately 10 mmwhich increased their chance to pass the 75 mm sieve and end upinto the finer fraction. As can be seen from Figs. 2 and 3 (ICP results)and AAS results, in feed sample (<75 mm) the metal contentcompared to non-metal content was lower, which might havedecreased the tapped density of particles in this fraction (BarnwalA. and Dhawan N, 2020). The observed irregular shape of Au con-taining particles with different sizes might be ascribed to thecrushing of different sections of WPCB.
SEM pictures of the finest fraction (<75 mm) are depicted inFig. 4. Most of the gold particles were found in the following threedifferent shapes and sizes:
� the remained oval-shaped coated Au on the Cu particles (Fig. 4a)� coarse oval-shaped Auwith the narrow rod shape fibers (Fig. 4b)� round-shaped Au (Fig. 4c)
The average size of metal particles according to SEM analysisvaried from 7 to 105 mm. According to Fig. 4.d, the majority of el-ements are found as round-shaped metals.
3.2. Precious metals separation
The total solids suspended (TSS) fraction of the overflow varied

Fig. 4. SEM images of WPCBs’ particles in the finest fraction (<75 mm). a) the remained coated Au on the Cu particle. b) The oval-shaped Au and the long narrow rod-shaped fibers.c) Au round shaped particle. d) The oval-shaped CueSnePb alloy and the other round plate-shape metals (Cu, Fe, Pd, Ag, etc.). (The EDS spectrums are illustrated in the sup-plementary material, Fig. S1).
Table 4TSS fraction of the underflow and sink.
Diameter ratio (Do/Du) hydrocyclone inlet pressure (bar) Suspended solids fraction of underflow (g) Suspended solids fraction of sink (g)
4.77 1.0 17.61 8.892.86 1.0 18.71 7.744.77 1.5 20.17 9.592.86 1.5 22.62 8.104.77 2.0 21.81 10.492.86 2.0 24.68 8.909.53 3.0 17.98* 5.736.50 3.0 25.63 13.624.77 3.0 28.73 12.99
* Further reduction in underflow diameter will lead to loss of coarse solids to the overflow.
M.R. Bilesan, I. Makarova, B. Wickman et al. Journal of Cleaner Production 286 (2021) 125505
between 5.1 g and 8.2 g. The TSS fraction in the underflow is pre-sented in Table 4. According to the data presented in Table 4, as theDo/Du diameter ratio increased, the TSS fraction in the underflowsincreased, which was also proved by (Golmaei et al., 2018). At theDo/Du diameter ratio of 9.53, an abnormal spray discharge withconstant diameter known as ‘rope’ or ‘pencil’ discharge (Tian J.et al., 2020; Schneider M. and Neesse T, 2004) was replaced bythe discharge in a thicker flow (Fig. 5). Due to the unusual conditionof the underflow, the minimum recovery of total solids andmaximum pulp density is obtained. The dilution-gravity method(DGM) was acquired by water floatation to improve high densemetals concentrations in less amount of WPCBs’ powders, based onthe specific gravity. Gold, palladium, silver, copper, lead, tin, andironwith high specific gravity can be separated from thosewith lowspecific gravity. When mixing started with an agitator on theupper-medium, the helical motion of the suspended solution ledlighter particles to float upwards while the denser particles wereconcentrated in the lower central section of the vortex as sink due
7
to gravitational forces.Fig. 6 shows the effects of pressure and Do/Du ratio on the
performance of hydrocyclone and further DGM separation for re-covery of precious metals. As can be noticed, the highest separationefficiency was achieved when the experiments were accomplishedat 3 bar and Do/Du ratio of 6.5. In these operating conditions,hydrocyclone followed by DGM separation could enhance theamount of gold and its total separation efficiency by 2 times and75 wt.% compared to initial feed as can be seen in Fig. 6.a. Fig. 6.bdemonstrates that the total separation efficiency of silver was 63%.At the optimum conditions, the amount of silver was increased by22 ± 5%. The partial precipitation of Ag as AgCl in the presence ofHCl (which was used to digest the samples) is inevitable, which canpartially affect the accuracy of the obtained results related to thesilver percentage (Fig. 6b and 3). Fig. 6.c shows, since copper is themost abundant element in theWPCBs, that the copper amount wasincreased up to 20± 4.4wt.% by the hydrocyclone. Furthermore, theremarkable result was achieved after the second step of separation

Fig. 5. The different types of discharge in the underflow of hydrocyclone, a) spray discharge b) combined discharge, and c) rope discharge.
Fig. 6. Elemental analysis of the different fractions with suspended solids obtained by the 1st step (hydrocyclone) at the inlet pressures of 1, 1.5, 2, and 3 bar and the 2nd step (DGM)separation method for different metals: a) Au; b) Ag; c) Cu; d) Pd. (The standard deviations for the total efficiencies (Et) were less than 2 wt.%).
M.R. Bilesan, I. Makarova, B. Wickman et al. Journal of Cleaner Production 286 (2021) 125505
(U2.2P3 by DGM) reaching 40 ± 4 wt.% Cu ( three times higher) atthe end of the process with the separation efficiency of 72%. Fig. 6.dshows palladium as the second-highest dense metal fraction in theWPCBs. In addition to the successful separation step by thehydrocyclone for Pd, the second step of separation increased thepercentage of Pd 2.17 times higher compared to the initial feed.Additionally, the total separation efficiency of Pdwas 78%. Themassbalance error was obtained between 0.08 and 1%.
In Fig. 6, the solid filled columns in the feed sample show the
8
initial WPCBs’ values. The second step separation (the pattern fillcolumns) in the feed columns indicates the DGM method resultswithout a hydrocyclone separation step. According to the results,hydrocyclone and DGM method’s application clearly increased thetotal separation efficiency and the content of precious metals in thefinal concentrated particles. In DGM, due to the helical motion ofthe suspended solution from a larger radius at the top to the smallerone at the bottom, lower flotation was observed for the high densecontents of sink samples obtained by hydrocyclone.

Table 5The ICP results (wt.%) of the other elements for the feed, overflow, underflow, and sink samples of optimum condition at the Do/Du of 6.50 and the inlet pressure of 3 bar.
Symbol of element Feed overflow 1st step separation (underflow) 2nd step separation (sink)
Fe 3.88 1.57 5.02 19.1Sn 5.18 3.98 6.02 7.42Ni 0.41 0.33 0.5 1.61Zn 0.82 0.91 0.97 1.27Pb 0.66 0.57 0.72 1.07Ca 6.82 3.16 6.06 0.59Al 3.28 2.09 3.23 0.57Na 0.29 0.22 0.29 0.13Cr 0.04 0.10 0.05 0.13Mn 0.018 0.02 0.02 0.07Mg 0.17 0.17 0.14 0.04Co 0.006 0.009 0.007 0.021Sb 0.07 0.13 0.03 0.01K 0.049 0.039 0.062 0.006Bi 0.004 0.006 0.003 0.005Mo 0.003 0.011 0.003 0.005
Fig. 7. The hydrocyclone (UF2.2P3 and OF2.2P3) and DGM (UF2.2P3 sink and float)method separated metals/non-metal fractions (wt.%) in the optimum condition.
M.R. Bilesan, I. Makarova, B. Wickman et al. Journal of Cleaner Production 286 (2021) 125505
From the authors’ point of view, the elemental analysis resultsprove that the inefficient separation of finer particles can beeradicated by hydrocyclone as feasible and straightforward equip-ment. According to the previous studies (Barnwal A. and Dhawan N,2020), particle size below 100 mm is unfavorable when the sepa-ration process is being utilized merely by the gravity method.However, the hydrocyclone separation method leads to attainingless agglomerated and more uniform particles for the DGM.
In Table 5, the weight percent fractions of other elements arepresented. As can be seen, substantial separation improvements arefound for Fe and Sn at both the first and second steps of the sep-aration procedures. The high density, abundance, and size charac-teristics of iron and tin compared to the other elements of the listled to an increase in the amount of Fe and Sn in the underflow andsink. In addition, Ni, Zn, Pb, Cr, Mn, Co, Bi, and Mo were mostlycollected in the sink. Contrary to the others, the high Ca, Al, Na, Mg,Sb, and K flotation was observed in the DGM method.
The applied separation procedures’ desired outcome is adecrease of non-metal contents in the WPCBs’ powders. As can beseen in Fig. 7, based on the sum of elemental mass values obtainedfrom the ICP and AAS results and defining the dissolved elements,72% of the fine non-metal components contained at the overflowfraction. On the contrary, 46% of relatively uniform metals inaccordance with their shape, size, and density were mainlycollected at the underflow. Furthermore, it was observed that theamount of non-metal fraction (NMF) in the initial feed wasdecreased from 68% to 13% in the sink sample (UF2.2P3 sink). Based
9
on the ICP and AAS analyses, 87% of the UF2.2P3-sink fraction wasdissolved as a metal fraction. According to the weighed samplesbefore and after dissolution in the acid, 89% of the optimum con-dition (UF2.2P3-sink) sample was dissolved. In this method, be-sides themetal elements, oxygen and silicon could be considered asthe missing elements in the separated fractions’ compositions.
The PSD of solids in the underflow, float, sink, and the initialfeed samples are illustrated in Fig. 8. The effects of the overflow tounderflow outlet diameter ratio (Do/Du) on the particle size dis-tributions for each fraction are depicted. Furthermore, the experi-mental particle size distribution results are assigned to the Rosin-Rammler-Bennett model for each sample, and the RRB model pa-rameters are assigned to the legend of Fig. 8.
The large distribution of the separated solids with the hydro-cyclone and DMG methods was acquired in Fig. 8. Regarding therepresentative evaluation of particle size distribution and achievedmean particle size parameters (XR), mainly the finer and less denseparticles were migrated to the overflow, whereas the coarser par-ticles were collected in the underflow and especially sink. Based onthe results, significant separation of finer particles was improved byincreasing the overflow to underflow outlet diameter ratio (Do/Du)and inlet pressures. The smaller underflow diameter and higherinlet pressure led to obtaining coarser particles in the underflow,whichwas confirmed also by (Golmaei et al., 2018; Cilliers J. J, 2000;Hwang et al., 2008, and Frachon and Cilliers, 1999). Furthermore,these results are in accordancewith the elemental values measuredby the ICP and AAS analysis.
At the DMG step, further fluidization of finer particles wasachieved at the float samples. According to Fig. 8.a, the float fractionat the Do/Du parameter of 4.77, finer particles were observedcompared to the float fraction of the Do/Du parameter of 2.86 at theinlet pressure of 2 bar. In addition, the finest float fraction at Do/Duparameter of 6.5 at an inlet pressure of 3 bar was attained due tothe efficient separation of solids in the underflow fraction, whichled to the coarser and denser suspension in the sink fraction. Inother words, at the higher separation efficiency, the finer andlighter particles were migrated to the overflow. Therefore, the floatfraction of the sample at the highest separation efficiency wasobtained from a significant coarser fraction (Do/Du ¼ 6.5 e
underflow). The RRB model data presented in Fig. 8.b defines thatthe highest mean particle size parameters (XR) were separated atthe sink (Do/Du ¼ 6.5 e Sink).
The SEM backscattered electron beam images of the initial feedand the separated fraction in the underflow confirmed the sepa-ration results (Fig. 9). The coarser uniform particles were collectedat the end of the two-step separation procedure, which confirms

Fig. 8. The overflow to underflow outlet diameter ratio (Do/Du) empirical characteristics on the particle size distribution in the overflow, underflow, float, and sink at the inletpressure of 2 bar (a) and 3 bar (b). The Rosin-Rammler-Bennett (RRB) fitted model is defined with line. The spread parameters of the distribution (nR) and the mean particle sizeparameters (XR) are presented in the legends. (O: Overflow, F: Float, U: Underflow, and S: Sink).
M.R. Bilesan, I. Makarova, B. Wickman et al. Journal of Cleaner Production 286 (2021) 125505
10

Fig. 9. SEM images of a) initial feed (<75 mm), b) the overflow fraction, c) the float fraction, d) the underflow fraction, e) sink fraction of optimum condition. Sample UF2.2P3.
M.R. Bilesan, I. Makarova, B. Wickman et al. Journal of Cleaner Production 286 (2021) 125505
particle size distribution analysis and RRB model results. As Fig. 9.bshows most of the fiber rods were separated from the overflow’sinitial feed. In Fig. 9.c, more fiber rods were separated within thefine metals in the float. As can be noted, no coarse particlesremained within the overflow and float samples. Fig. 9.d illustratesthe underflow from the hydrocyclone separation step. As a com-parison to Fig. 9.a, fewer fiber rods and more round plate-shapedparticles were observed in Fig. 9.d. Further, in Fig. 9.e, coarsergrains were divided from the underflow sample in the second stepof the separation (DMG). Since more fiber rods were separated inthe float fraction, fewer fiber rods can be seen in the sink sample.These results are in parallel with the RRB model and particle sizedistribution experimental results in Fig. 9.
EDS maps were acquired from the initial feed and the optimumseparated sample (UF2.2P3 � Sink). According to Fig. 10, preciousmetals are distributed homogeneously in the samples. Fig. 10a and10.b illustrate that Ca, Al, and Si are the fiber rods’ main compo-nents. The Cu, Fe, Sn, Pb, and Ag elemental phase distribution in theoptimum separated sample (UF2.2P3 � Sink) confirms the sepa-ration of coarser grains at the end of the process which was indi-cated in the particle size distribution analysis. Finally, in order toobtain a better understanding of the subject, the selected processesfor the efficient separation of valuable metals are addressed with asimplified flowchart represented in Fig. 11.
4. Conclusions
Efficient separation of precious metals from WPCBs to highlyconcentrated content can lead to industrial prospects in urbanmining. In this study, a sustainable, green, and simple method wasutilized to investigate different particles’ separation behavior basedon their size, shape, and density. At the preliminary stage, thedifferent liberation characteristics of metals and non-metals in thegrinding step led to the separation of 61 wt.% of the e-waste massvolume in the finest fraction (<75 mm). Interestingly, most of thegold (73 wt.%), palladium (66 wt.%), and silver (33 wt.%) were ac-quired in the finest fraction (<75 mm), while most of the copper
11
(70 wt.%) was separated to the coarser fraction (>75 mm) by asimple grinding. Although the separation efficiency of the finepowders (<100 mm) are considered more challenging due to thehigher amount of non-metal fractions (NMF) and fibers, thehydrocyclone technique was shown as a valuable method for theseparation of high dense, uniform content from the initial feed. Inthe first step, the effects of the hydrocyclone variables in theseparated precious metals were studied. The overflow fractioncontained 72% of the fine non-metal fractions separated. On thecontrary, the content with 46% of moderately uniform metals wascollected mainly at the underflow. The results showed that thehigher overflow to underflow outlet diameter (Do/Du ¼ 6.5) andhigher inlet pressure (3 bar) of the hydrocyclone positivelyimpacted on the separation of precious metals to the underflow,and 87 wt.% separation of metal fractions into the sink. Moreover,the dilution-gravity method (DGM), as a second step, enhanced thefinal collectedmetal fraction. The total separation efficiency of gold,palladium, silver, and copper was obtained 75%, 78%, 64%, and 72%,respectively.
CRediT authorship contribution statement
Mohammad Reza Bilesan: Investigation, Writing - originaldraft, Writing - review & editing, Formal analysis, Software,Conceptualization, Methodology. Irina Makarova: Investigation,Writing - review & editing, Conceptualization, Formal analysis.Bj€orn Wickman: Supervision, Writing - review & editing,Conceptualization. Eveliina Repo: Supervision, Project adminis-tration, Funding acquisition, Writing - review & editing,Conceptualization.
Declaration of competing interest
The authors declare that they have no known competingfinancial interests or personal relationships that could haveappeared to influence the work reported in this paper.

Fig. 10. SEM-EDS elemental mapping in the optimum condition, a) underflow sample UF2.2P3; b) overflow OF2.2P3.
M.R. Bilesan, I. Makarova, B. Wickman et al. Journal of Cleaner Production 286 (2021) 125505
12
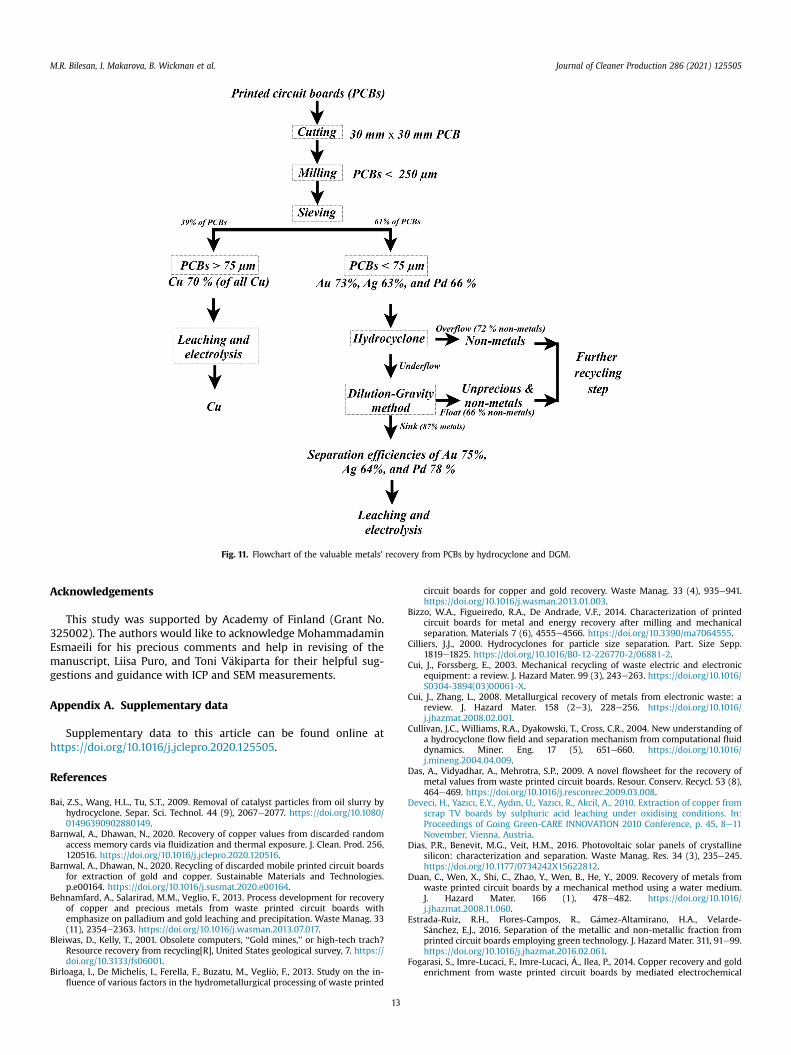
Fig. 11. Flowchart of the valuable metals’ recovery from PCBs by hydrocyclone and DGM.
M.R. Bilesan, I. Makarova, B. Wickman et al. Journal of Cleaner Production 286 (2021) 125505
Acknowledgements
This study was supported by Academy of Finland (Grant No.325002). The authors would like to acknowledge MohammadaminEsmaeili for his precious comments and help in revising of themanuscript, Liisa Puro, and Toni V€akiparta for their helpful sug-gestions and guidance with ICP and SEM measurements.
Appendix A. Supplementary data
Supplementary data to this article can be found online athttps://doi.org/10.1016/j.jclepro.2020.125505.
References
Bai, Z.S., Wang, H.L., Tu, S.T., 2009. Removal of catalyst particles from oil slurry byhydrocyclone. Separ. Sci. Technol. 44 (9), 2067e2077. https://doi.org/10.1080/01496390902880149.
Barnwal, A., Dhawan, N., 2020. Recovery of copper values from discarded randomaccess memory cards via fluidization and thermal exposure. J. Clean. Prod. 256,120516. https://doi.org/10.1016/j.jclepro.2020.120516.
Barnwal, A., Dhawan, N., 2020. Recycling of discarded mobile printed circuit boardsfor extraction of gold and copper. Sustainable Materials and Technologies.p.e00164. https://doi.org/10.1016/j.susmat.2020.e00164.
Behnamfard, A., Salarirad, M.M., Veglio, F., 2013. Process development for recoveryof copper and precious metals from waste printed circuit boards withemphasize on palladium and gold leaching and precipitation. Waste Manag. 33(11), 2354e2363. https://doi.org/10.1016/j.wasman.2013.07.017.
Bleiwas, D., Kelly, T., 2001. Obsolete computers, ‘‘Gold mines,’’ or high-tech trach?Resource recovery from recycling[R], United States geological survey, 7. https://doi.org/10.3133/fs06001.
Birloaga, I., De Michelis, I., Ferella, F., Buzatu, M., Vegli�o, F., 2013. Study on the in-fluence of various factors in the hydrometallurgical processing of waste printed
13
circuit boards for copper and gold recovery. Waste Manag. 33 (4), 935e941.https://doi.org/10.1016/j.wasman.2013.01.003.
Bizzo, W.A., Figueiredo, R.A., De Andrade, V.F., 2014. Characterization of printedcircuit boards for metal and energy recovery after milling and mechanicalseparation. Materials 7 (6), 4555e4566. https://doi.org/10.3390/ma7064555.
Cilliers, J.J., 2000. Hydrocyclones for particle size separation. Part. Size Sepp.1819e1825. https://doi.org/10.1016/B0-12-226770-2/06881-2.
Cui, J., Forssberg, E., 2003. Mechanical recycling of waste electric and electronicequipment: a review. J. Hazard Mater. 99 (3), 243e263. https://doi.org/10.1016/S0304-3894(03)00061-X.
Cui, J., Zhang, L., 2008. Metallurgical recovery of metals from electronic waste: areview. J. Hazard Mater. 158 (2e3), 228e256. https://doi.org/10.1016/j.jhazmat.2008.02.001.
Cullivan, J.C., Williams, R.A., Dyakowski, T., Cross, C.R., 2004. New understanding ofa hydrocyclone flow field and separation mechanism from computational fluiddynamics. Miner. Eng. 17 (5), 651e660. https://doi.org/10.1016/j.mineng.2004.04.009.
Das, A., Vidyadhar, A., Mehrotra, S.P., 2009. A novel flowsheet for the recovery ofmetal values from waste printed circuit boards. Resour. Conserv. Recycl. 53 (8),464e469. https://doi.org/10.1016/j.resconrec.2009.03.008.
Deveci, H., Yazıcı, E.Y., Aydın, U., Yazıcı, R., Akcil, A., 2010. Extraction of copper fromscrap TV boards by sulphuric acid leaching under oxidising conditions. In:Proceedings of Going Green-CARE INNOVATION 2010 Conference, p. 45, 8e11November, Vienna, Austria.
Dias, P.R., Benevit, M.G., Veit, H.M., 2016. Photovoltaic solar panels of crystallinesilicon: characterization and separation. Waste Manag. Res. 34 (3), 235e245.https://doi.org/10.1177/0734242X15622812.
Duan, C., Wen, X., Shi, C., Zhao, Y., Wen, B., He, Y., 2009. Recovery of metals fromwaste printed circuit boards by a mechanical method using a water medium.J. Hazard Mater. 166 (1), 478e482. https://doi.org/10.1016/j.jhazmat.2008.11.060.
Estrada-Ruiz, R.H., Flores-Campos, R., G�amez-Altamirano, H.A., Velarde-S�anchez, E.J., 2016. Separation of the metallic and non-metallic fraction fromprinted circuit boards employing green technology. J. Hazard Mater. 311, 91e99.https://doi.org/10.1016/j.jhazmat.2016.02.061.
Fogarasi, S., Imre-Lucaci, F., Imre-Lucaci, �A., Ilea, P., 2014. Copper recovery and goldenrichment from waste printed circuit boards by mediated electrochemical

M.R. Bilesan, I. Makarova, B. Wickman et al. Journal of Cleaner Production 286 (2021) 125505
oxidation. J. Hazard Mater. 273, 215e221. https://doi.org/10.1016/j.jhazmat.2014.03.043.
Frachon, M., Cilliers, J., 1999. A general model for hydrocyclone partition curves.Chem. Eng. J. 73, 53e59. https://doi.org/10.1016/S1385-8947(99)00040-6.
Fu, S., Hua, W., Yuan, H., Ling, J., Shi, Q., 2019. Study on the light medium separationof waste plastics with hydrocyclones. Waste Manag. 91, 54e61. https://doi.org/10.1016/j.wasman.2019.04.043.
Fujita, T., Ono, H., Dodbiba, G., Yamaguchi, K., 2014. Evaluation of a recycling processfor printed circuit board by physical separation and heat treatment. WasteManag. 34 (7), 1264e1273. https://doi.org/10.1016/j.wasman.2014.03.002.
Gent, M., Sierra, H.M., �Alvarez, M.M., McCulloch, J., 2018. An evaluation of hydro-cyclones and the LARCODEMS cylindrical cyclone for the separation of wasteplastics of proximate densities. Waste Manag. 79, 374e384. https://doi.org/10.1016/j.wasman.2018.08.004.
Ghadirian, M., Afacan, A., Hayes, R.E., Mmbaga, J.P., Mahmood, T., Xu, Z., Masliyah, J.,2015. A study of the hydrocyclone for the separation of light and heavy particlesin aqueous slurry. Can. J. Chem. Eng. 93 (9), 1667e1677. https://doi.org/10.1002/cjce.22252.
Golmaei, M., Kinnarinen, T., Jernstr€om, E., H€akkinen, A., 2018. Efficient separation ofhazardous trace metals and improvement of the filtration properties of greenliquor dregs by a hydrocyclone. J. Clean. Prod. 183, 162e171. https://doi.org/10.1016/j.jclepro.2018.02.123.
Gonçalves, S.M., Barrozo, M.A., Vieira, L.G., 2017. Effects of solids concentration andunderflow diameter on the performance of a newly designed hydrocyclone.Chem. Eng. Technol. 40 (10), 1750e1757. https://doi.org/10.1002/ceat.201600496.
Goodship, V., Stevels, A., Huisman, J. (Eds.), 2019. Waste Electrical and ElectronicEquipment (WEEE) Handbook. Woodhead Publishing.
Gramatyka, P., Nowosielski, R., Sakiewicz, P., 2007. Recycling of waste electrical andelectronic equipment. J. Achiev. Mater. Manuf. Eng. 20 (1e2), 535e538. https://www.researchgate.net/publication/42253354_Recycling_of_waste_electrical_and_electronic_equipment.
Gray, T., 2012. Elements: A Visual Exploration of Every Known Atom in the Universe.Black Dog & Leventhal Publishing, Inc, Hachette UK.
Guarnieri, P., e Silva, L.C., Xavier, L.H., Chaves, G.L.D., 2020. Recycling challenges forelectronic consumer products to E-waste: a developing countries’ perspective.In: E-waste Recycling and Management. Springer, Cham, pp. 81e110.
Guo, J., Guo, J., Xu, Z., 2009. Recycling of non-metallic fractions from waste printedcircuit boards: a review. J. Hazard Mater. 168 (2e3), 567e590. https://doi.org/10.1016/j.jhazmat.2009.02.104.
Guo, C., Wang, H., Liang, W., Fu, J., Yi, X., 2011. Liberation characteristic and physicalseparation of printed circuit board (PCB). Waste Manag. 31 (9e10), 2161e2166.https://doi.org/10.1016/j.wasman.2011.05.011.
Han, Y., He, W., Li, L., Li, G., Huang, J., 2016. Mathematical analysis of the gasesolidfluidized bed separation of metals and nonmetals from waste PCB powders.Powder Technol. 295, 142e151. https://doi.org/10.1016/j.powtec.2016.03.040.
He, W., Li, G., Ma, X., Wang, H., Huang, J., Xu, M., Huang, C., 2006. WEEE recoverystrategies and the WEEE treatment status in China. J. Hazard Mater. 136 (3),502e512. https://doi.org/10.1016/j.jhazmat.2006.04.060.
Hino, T., Agawa, R., Moriya, Y., Nishida, M., Tsugita, Y., Araki, T., 2009. Techniques toseparate metal from waste printed circuit boards from discarded personalcomputers. J. Mater. Cycles Waste Manag. 11, 42e54. https://doi.org/10.1007/s10163-008-0218-0.
Hossain, R., Nekouei, R.K., Mansuri, I., Sahajwalla, V., 2018. Sustainable recovery ofCu and Sn from problematic global waste: exploring value from waste printedcircuit boards. ACS Sustain. Chem. Eng. 7 (1), 1006e1017. https://doi.org/10.1021/acssuschemeng.8b04657.
Huisman, J., 2012. Eco-efficiency evaluation of WEEE take-back systems. In: WasteElectrical and Electronic Equipment (WEEE) Handbook. Woodhead Publishing,pp. 93e119. https://doi.org/10.1533/9780857096333.1.93.
Hwang, K.J., Wu, W.H., Qian*, S., Nagase, Y., 2008. CFD study on the effect ofhydrocyclone structure on the separation efficiency of fine particles. Separ. Sci.Technol. 43 (15), 3777e3797. https://doi.org/10.1080/01496390802286637.
Ilyas, S., Lee, J.C., Kim, B.S., 2014. Bioremoval of heavy metals from recycling industryelectronic waste by a consortium of moderate thermophiles: process devel-opment and optimization. J. Clean. Prod. 70, 194e202. https://doi.org/10.1016/j.jclepro.2014.02.019.
Kumar, A., Holuszko, M., Janke, T., 2018. Separating inorganics from the non-metalfraction of the processed waste PCBS using heavy liquid separation. Int J WasteResour 8 (355), 2. https://doi.org/10.1016/j.wasman.2018.02.010.
Le, H.L., Yamasue, E., Okumura, H., Ishihara, K.N., 2014. Improving sustainable re-covery of metals from waste printed circuit boards by the primary coppersmelter process. J. Mater. Cycles Waste Manag. 16 (2), 298e305. https://doi.org/10.1007/s10163-013-0189-7.
Lee, J.C., Srivastava, R.R., 2016. Leaching of Gold from the Spent/end-Of-Life MobilePhone-PCBs Using “Greener Reagents”. The Recovery of Gold from SecondarySources, vols. 7e56. Imperial College Press.
Lehner, T., 1998. Integrated recycling of non-ferrousmetal at boliden ltd. In: Pro-ceedings of the IEEE International Symposium on Electronics and the Envi-ronment, pp. 42e47. https://doi.org/10.1109/ISEE.1998.675028, 1998.
Murthy, Y.R., Tripathy, S.K., Kumar, C.R., 2011. Chrome ore beneficiation challenges &opportunitieseA review. Miner. Eng. 24 (5), 375e380. https://doi.org/10.1016/j.mineng.2010.12.001.
Nekouei, R.K., Pahlevani, F., Rajarao, R., Golmohammadzadeh, R., Sahajwalla, V.,2018. Direct transformation of waste printed circuit boards to nano-structured
14
powders through mechanical alloying. Mater. Des. 141, 26e36. https://doi.org/10.1016/j.matdes.2017.12.032.
Nie, C.C., Wang, Y.Y., Zhang, H., Zhang, Y.K., Zhang, Y.Q., Yan, Z.Q., Li, B., Lyu, X.J.,Tao, Y.J., Qiu, J., Li, L., 2020. Cleaner utilization of non-metallic components inseparation tailings of waste printed circuit board: pyrolysis oil, calorific valueand building aggregate. J. Clean. Prod. 120976. https://doi.org/10.1016/j.jclepro.2020.120976.
Oishi, T., Koyama, K., Alam, S., Tanaka, M., Lee, J.C., 2007. Recovery of high puritycopper cathode from printed circuit boards using ammoniacal sulfate or chlo-ride solutions. Hydrometallurgy 89 (1e2), 82e88. https://doi.org/10.1016/j.hydromet.2007.05.010.
Purchase, D., Abbasi, G., Bisschop, L., Chatterjee, D., Ekberg, C., Ermolin, M.,Fedotov, P., Garelick, H., Isimekhai, K., Kandile, N.G., Lundstr€om, M., 2020. Globaloccurrence, chemical properties, and ecological impacts of e-wastes (IUPACtechnical report). Pure Appl. Chem. 1 https://doi.org/10.1515/pac-2019-0502(ahead-of-print).
Ren, Y., Zhang, X., Wei, H., Xu, L., Zhang, J., Sun, J., Wang, X., Li, W., 2017. Compar-isons of methods to obtain insoluble particles in snow for transmission electronmicroscopy. Atmos. Environ. 153, 61e69. https://doi.org/10.1016/j.atmosenv.2017.01.021.
Rosin, P.A.U.L., 1933. Laws governing the fineness of powdered coal. J. Inst. Fuel 7,29e36.
Ruediger, K., 2011. Solving the E-Waste Problem (Step) Initiative: Annual Report.United Nations University, p. 32.
Schneider, M., Neesse, T., 2004. Overflow-control system for a hydrocyclone battery.Int. J. Miner. Process. 74, S339eS343. https://doi.org/10.1016/j.minpro.2004.07.037.
Schubert, G., 1991. Aufbereitung der NE-Metallschrotte und NE-metallhaltigenAbf€alle. II. Aufbereit. - Tech. 32 (7), 352e358.
Shokri, A., Pahlevani, F., Cole, I., Sahajwalla, V., 2017. Selective thermal trans-formation of old computer printed circuit boards to Cu-Sn based alloy.J. Environ. Manag. 199, 7e12. https://doi.org/10.1016/j.jenvman.2017.05.028.
Svarovsky, L., 2000. Solid-liquid Separation. Elsevier.Sun, Y., Fu, G., Jiang, L., 2018. Reductive Leaching of Low-Grade Manganese Oxide
Ores Using Pretreated Straw as Reductant. Mineral Processing and ExtractiveMetallurgy, pp. 1e6. https://doi.org/10.1080/25726641.2018.1505210.
Tian, J., Wang, H., Lv, W., Huang, Y., Fu, P., Li, J., Liu, Y., 2020. Enhancement of pol-lutants hydrocyclone separation by adjusting back pressure ratio and pressuredrop ratio. Separ. Purif. Technol. 240, 116604. https://doi.org/10.1016/j.seppur.2020.116604.
Tiwary, C.S., Kishore, S., Vasireddi, R., Mahapatra, D.R., Ajayan, P.M.,Chattopadhyay, K., 2017. Electronic waste recycling via cryo-milling and nano-particle beneficiation. Mater. Today 20 (2), 67e73. https://doi.org/10.1016/j.mattod.2017.01.015.
Ulman, K., Ghose, A., Maroufi, S., Mansuri, I., Sahajwalla, V., 2018. Disentanglementof random access memory cards to regenerate copper foil: a novel thermo-electrical approach. Waste Manag. 81, 138e147. https://doi.org/10.1016/j.wasman.2018.10.002.
Ulman, K., Maroufi, S., Bhattacharyya, S., Sahajwalla, V., 2018. Thermal trans-formation of printed circuit boards at 500� C for synthesis of a copper-basedproduct. J. Clean. Prod. 198, 1485e1493. https://doi.org/10.1016/j.jclepro.2018.07.140.
Vasile, C., Brebu, M.A., Totolin, M., Yanik, J.A.L.E., Karayildirim, T.A.M.E.R., Darie, H.,2008. Feedstock recycling from the printed circuit boards of used computers.Energy Fuels 22 (3), 1658e1665. https://doi.org/10.1021/ef700659t.
Vesilind, P.A., 1980. The Rosin-Rammler particle size distribution. Resour. RecoveryConserv. 5 (3), 275e277. https://doi.org/10.1016/0304-3967(80)90007-4.
Vianco, P.T., 1993. Embrittlement of Surface Mount Solder Joints by Hot Solder-Dipped, Gold-Plated Leads (No. SAND-93-0082C; CONF-9308126-3). SandiaNational Labs., Albuquerque, NM (United States).
Vianco, P.T., Hosking, F.M., Rejent, J.A., 1996. Ultrasonic soldering for structural andelectronic applications. Welding Journal-Including Welding Research Supple-ment 75 (11), 343s.
Vieira, L.G., Barrozo, M.A., 2014. Effect of vortex finder diameter on the performanceof a novel hydrocyclone separator. Miner. Eng. 57, 50e56. https://doi.org/10.1016/j.mineng.2013.11.014.
Xue, M., Yang, Y., Ruan, J., Xu, Z., 2012. Assessment of noise and heavy metals (Cr, Cu,Cd, Pb) in the ambience of the production line for recycling waste printedcircuit boards. Environ. Sci. Technol. 46 (1), 494e499. https://doi.org/10.1021/es202513b.
Xue, M., Li, J., Xu, Z., 2013. Management strategies on the industrialization road ofstate-of-the-art technologies for e-waste recycling: the case study of electro-static separationda review. Waste Manag. Res. 31 (2), 130e140. https://doi.org/10.1177/0734242X12465464.
Yang, T., Xu, Z., Wen, J., Yang, L., 2009. Factors influencing bioleaching copper fromwaste printed circuit boards by Acidithiobacillus ferrooxidans. Hydrometallurgy97 (1e2), 29e32. https://doi.org/10.1016/j.hydromet.2008.12.011.
Zhang, S., Ding, Y., Liu, B., Pan, D.A., Chang, C.C., Volinsky, A.A., 2015. Challenges inlegislation, recycling system and technical system of waste electrical andelectronic equipment in China. Waste Manag. 45, 361e373. https://doi.org/10.1016/j.wasman.2015.05.015.
Zhang, G., He, Y., Feng, Y., Zhang, T., Wang, H., Zhu, X., 2018a. Recovery of residualmetals from fine nonmetallic fractions of waste printed circuit boards using avibrated gas-solid fluidized bed. Separ. Purif. Technol. 207, 321e328.
Zhang, G., Wang, H., Yang, J., He, Y., Zhang, T., 2018b. Application of electric field to a

M.R. Bilesan, I. Makarova, B. Wickman et al. Journal of Cleaner Production 286 (2021) 125505
fluidized bed for recovering residual metals from fine particles of the non-metallic fraction of waste printed circuit boards. J. Clean. Prod. 187,1036e1042. https://doi.org/10.1016/j.jclepro.2018.03.282.
Zhou, L., Xu, Z., 2012. Response to waste electrical and electronic equipments inChina: legislation, recycling system, and advanced integrated process. Environ.Sci. Technol. 46 (9), 4713e4724. https://doi.org/10.1021/es203771m.
Zhu, X.N., Nie, C.C., Wang, S.S., Xie, Y., Zhang, H., Lyu, X.J., Qiu, J., Li, L., 2020. Cleanerapproach to the recycling of metals in waste printed circuit boards by magneticand gravity separation. J. Clean. Prod. 248, 119235. https://doi.org/10.1016/
15
j.jclepro.2019.119235.
Web references
https://www.asus.com/Motherboards/EX-A320M-GAMING/. The last accessedtime; 3.9.2020.https://www.gigabyte.com/hr/Press/News/1283/. The last accessed time; 3.9.2020.