Efficiency, Timeliness, and Quality: A New Perspective ... · IV • EFFICIENCY, TIMELINESS, AND...
92
Efficiency, Timeliness, and Quality: A New Perspective from Nine State Criminal Trial Courts NCJ 178403
Transcript of Efficiency, Timeliness, and Quality: A New Perspective ... · IV • EFFICIENCY, TIMELINESS, AND...

Efficiency, Timeliness, and Quality:A New Perspective from
Nine State Criminal Trial Courts
NCJ 178403

EFFICIENCY, TIMELINESS, AND QUALITY:
A NEW PERSPECTIVE FROM
NINE STATE CRIMINAL TRIAL COURTS
Prepared for the
National Institute of Justice andthe State Justice Institute
Authored by
Brian J. OstromRoger A. Hanson
National Center for State Courts
k

II • EFFICIENCY, TIMELINESS, AND QUALITY: A NEW PERSPECTIVE
This report is a joint effort by the National Center for State Courts andthe American Prosecutors Research Institute, with the support of theNational Institute of Justice (NIJ) and the State Justice Institute (SJI).
The authors gratefully acknowledge the support of both agencies,but the opinions and conclusions contained in this report do not
necessarily reflect the policies or positions of either NIJ or SJI.
Copyright 1999National Center for State Courts
ISBN 0-89656-199-2

TABLE OF CONTENTS
Acknowledgments ....................................................................................... viiAbstract ......................................................................................................... xiExecutive Summary................................................................................... xiii
Chapter 1 What Do We Need to Know?....................................................1
Introduction ....................................................................................................1Statement of the Problem ...............................................................................2The Need to Untangle Timeliness, Quality, and Performance Standards ................................................................................ 4A Conceptual Framework for Understanding Timeliness and Quality ................................................................................ 6Specific Objectives of the Current Research ................................................. 7Research Design ............................................................................................ 7Organizational Roadmap ............................................................................... 8
Chapter 2 What Do the Nine Criminal Court Systems Look Like?.....14
Introduction ..................................................................................................14Measuring the Pace of Felony Litigation .....................................................14
Figure 2.1: How Long Does It Take to Resolve Felony Cases? ..................................14Figure 2.2: How Long Do Specific Types of Felony Cases Take to Be Resolved? ....18Figure 2.3: What Do the Communities Look Like? ....................................................20Figure 2.4: What Do the Cases Look Like? ................................................................22Figure 2.5: What Recognizable Case- and Defendant-Related
Characteristics Are Present? ......................................................................................24Figure 2.6: How Are Cases Resolved? ........................................................................28
R

IV • EFFICIENCY, TIMELINESS, AND QUALITY: A NEW PERSPECTIVE
Management Strategies: Characteristics of the Court,Prosecutor’s Office, and Indigent Defense Program ..................................... 29
Figure 2.7: What Do the Nine Courts Look Like? ........................................................30Figure 2.8: What Do the Prosecutors’ Offices Look Like? ...........................................34Figure 2.9: What Do the Indigent Defense Programs Look Like? ................................36Figure 2.10: What Are the Felony Caseloads Per Judge and Per Prosecutor? ..............38
Court, Prosecutor, and Indigent Defender Resources .................................... 39Figure 2.11: What Are the Prosecutors’ and Public Defenders’ Salaries and Average Tenures? ..................................................................................................42
Summary........................................................................................................ 43
Chapter 3 Why Are Some Felony Cases Resolved Faster Than Others?.. 45
Introduction ................................................................................................... 45Review of Literature ...................................................................................... 47Data and Methods .......................................................................................... 51
Table 3.1: Variables Used in Regression .......................................................................52Results ........................................................................................................... 54
Table 3.2: Regression Results: Factors Affecting Upper-Court Case Processing Time..........56Figure 3.1: The Disposition Flow of Felony Cases in Nine Urban Courts ...................62
Summary........................................................................................................ 64
Chapter 4 Is There a Local Legal Culture That Fosters Timeliness and Quality?.......................................................... 67
Introduction ................................................................................................... 67Statement of the Problem .............................................................................. 68Analytical Framework: Efficiency and the Productivity Frontier ................. 71
Figure 4.1: Productivity Frontier ...................................................................................73Using Work Orientations to Assess Case Processing Quality ....................... 76The Importance of Attorney Attitudes in Determining Work Orientations ... 77Conceptualization and Measurement of Attorneys’ Views ............................ 81Hypotheses and Methodology ....................................................................... 86
Table 4.1: Prosecutor and Defense Attorney Survey Questions ....................................88Table 4.2: Index of Resources .......................................................................................90Table 4.3: Index of Management ...................................................................................91Table 4.4: Index of Jurisdictional Practice ....................................................................92

Table 4.5: Index of Performance ...................................................................................94Results ........................................................................................................... 96Discussion.................................................................................................... 102
Figure 4.2: Assessing Efficiency in the Three Groups of Courts ................................102Table 4.6: Overall Quality Index .................................................................................103
Summary...................................................................................................... 104
Chapter 5 What Important Conclusions Can Be Drawn?.................... 107
Policy Implications ...................................................................................... 109
Appendices
Appendix 1: Research Methodology ........................................................... 117Appendix 2: Site Overviews ........................................................................ 121Appendix 3: Questionnaires and Responses................................................ 161
References................................................................................................... 177
TABLE OF CONTENTS • V

ACKNOWLEDGMENTS
We are happy to discharge our obligation to thank the many individuals whocontributed to the ideas developed in this study. First and foremost, we offer ourappreciation to key individuals in the nine trial court systems. Their participationand cooperation enabled us to gather needed information. Without them, therewould be no study. Hence, we gratefully acknowledge the following individuals:
• Albuquerque, New Mexico - The Honorable John W. Brennan, PresidingJudge; Tom Ruiz, Court Administrator; Jeff Romero, District Attorney; andRalph Oldenwald, Public Defender
• Birmingham, Alabama - The Honorable Mike McCormick, PresidingJudge of the Criminal Division; The Honorable Wayne Thorne, PresidingJudge of the Circuit Court; Agnes Miller, Court Administrator; and DavidBarber, District Attorney
• Cincinnati, Ohio - Bill Schoenfeld, Assistant Court Administrator; LouStrigari, Chief Public Defender; and Terry Gaines, Chief Deputy Prosecut-ing Attorney
• Grand Rapids, Michigan - The Honorable Dennis Kolenda, Chief Judge;Kim Foster, Court Administrator; Richard Hillary, Director of Office ofPublic Defender; and William Forsyth, District Attorney
• Hackensack, New Jersey - The Honorable William C. Meehan, PresidingJudge of the Criminal Division; John Goodman, Court Administrator;William H. Schmidt, Prosecutor; and Louis Acevedo, Director of thePublic Defender’s Office
R
VIII • EFFICIENCY, TIMELINESS, AND QUALITY: A NEW PERSPECTIVE
• Oakland, California - The Honorable Phillip Sarkisian, Presiding Judge;Ron Overholt, Executive Officer; Jay Gaskill, Chief Public Defender; andTom Rogers, Chief Deputy District Attorney
• Sacramento, California - The Honorable Thomas M. Cecil, PresidingJudge; Mike Roddy, Executive Officer; Al Locher, Assistant Chief DeputyDistrict Attorney; Doug Welch, Chief Deputy Public Defender; FrankMartinez, Assistant Executive Officer; and John Soika, Administrator ofthe Indigent Criminal Defense Program
• Austin, Texas - The Honorable Mike Lynch, Presiding Judge; DinahDinwiddie, Executive Manger, Justice and Public Safety; Ronald Earle,Prosecutor; and Buddy Meyer, Assistant District Attorney
• Portland, Oregon - The Honorable James R. Ellis, Presiding Judge; DougBray, Court Administrator; Mike Schrunk, District Attorney; and AnnChristian, State Indigent Defense Director
Additionally, the project benefited from the generous time and attention of adistinguished advisory committee. These individuals devoted energy to review-ing the initial, middle, and end phases of the project. For this reason, we wish tothank The Honorable Franklin Burgess, Terance Dunworth, Addie Hailstorks,Phyllis D. K . Hildreth, Lee Kaplan, The Honorable Judge Graydon McKee, JamesR. Neuhard, and The Honorable Andrew Sonner.
Close examination of the report’s technical excellence and policy relevancewas provided by a thoughtful group of practitioners and researchers familiar withthe problems of and prospects for timely and quality justice. They include col-leagues at the National Center for State Courts (NCSC) and the American Pros-ecutors Research Institute (APRI). In this regard, we wish to recognize VictorFlango, William Hewitt, Ann Jones, and David Rottman of the NCSC and JaneSigmond and Heike Gramckow of the APRI. This publication also benefitedfrom the careful editing of Dawn Spinozza, and design and layout were createdby Judith Ann Sullivan.
A broader set of reviewers included several individuals in universities, courts,and other organizations outside the walls of the NCSC and the APRI. We appre-ciate the constructive criticisms and helpful advice of Ed Brekke, Joy Chapper,John Clarke, The Honorable John DiMotto, Roy Flemming, Bruce Harvey, TheHonorable Jeff Kremers, Candace McCoy, The Honorable Aaron Ment, KevinReitz, and Robert Wessels. Charles Ostrom provided thoughtful help and guid-
ance on the analytical methods used in this report. Also, we are thankful forthe advice and comment of two anonymous reviewers as part of NIJ’s peerreview process.
Finally, the support of the National Institute of Justice (NIJ) and the StateJustice Institute (SJI) must be recognized. However, their assistance goes beyondfunding. Janice Munsterman at NIJ and Dick Van Duizend at SJI consistentlyprovided us with encouragement while monitoring the progress of our inquiry.We wish to thank them personally for their help. Hence, we are uncommonlygrateful to the many helping hands.
Brian OstromRoger HansonMargaret Fonner
National Center for State Courts
John GoerdtSupreme Court of IowaFormerly National Center for State Courts
Donald RebovichCSR, IncorporatedFormerly American Prosecutors Research Institute
ACKNOWLEDGMENTS • IX
ABSTRACT
A fundamental U.S. constitutional right is the right to “a speedy and publictrial” (Sixth Amendment to the United States Constitution). Framers of this pro-vision did not intend the pace of the legal process to be detrimental to otherfundamental values, such as due process, equality, the protection against doublejeopardy, excessive bail, self-incrimination, and so forth. However, striking thisbalance is not easy, and a basic challenge confronting the contemporary justicesystem remains: Is it possible to resolve cases expeditiously without sacrificingthe quality of justice?
On the basis of an examination of nine contemporary state criminal trialcourt systems, researchers at the National Center for State Courts and the Ameri-can Prosecutors Research Institute conclude that timeliness in felony case pro-cessing occurs in contexts that also are conducive to the achievement of caseprocessing quality. In both faster and slower courts, the more serious, more com-plicated, and more difficult cases take a longer amount of time to resolve than theless serious, less complicated, and less difficult cases. This pattern suggests thatcourts generally adhere to a norm of proportionality, which states that the amountof attention that each case receives should be in proportion to the amount that itwarrants. The difference is that in the more expeditious courts, the work getsdone within tighter time frames.
The presence of more efficient work orientations among prosecutors andcriminal defense attorneys underlies the tighter time frames. Attorneys’ viewsabout their work environment and toward each other’s activities are linked tohow timely their particular court is. In expeditious courts, prosecutors and de-
R

XII • EFFICIENCY, TIMELINESS, AND QUALITY: A NEW PERSPECTIVE
fense attorneys are adversarial in their outlook to the same degree that prosecu-tors and defense attorneys are in less expeditious courts, but they share viewstoward resources, management, and the competency of their opponents that areunlike those of their counterparts in less expeditious courts. In faster courts, pros-ecutors and defense attorneys are more likely to see each other as well prepared,well trained, and trial tested. Additionally, they are less likely to see resourceshortages, even though their caseloads are no less burdensome than those of theircounterparts in slower courts. A main policy implication from the inquiry is thatthe agenda of future national, state, and local judicial and attorney training pro-grams should center on how judges and attorneys can become more efficient andhow to use the gains in efficiency to secure both timeliness and case resolutionquality. Furthermore, because the results, which demonstrate that greater effi-ciency enhances both timeliness and quality, are new and different from previousresearch, future work is essential to confirm (or disconfirm) the current study. Isit true, as this study suggests, that the work of criminal trial courts is strikinglysimilar? Do other courts tend to follow the norm of proportionality in handlingcases? Are the views of prosecutors and defense attorneys in courts with tightertime frames distinctively different from those in other courts? Verification andrefinement of the current results will improve greatly our understanding of fun-damental functions of the criminal justice system.
EXECUTIVE SUMMARY
C Central Finding
Timeliness and the quality of justice are not mutually exclusive either in theoryor in fact. Expeditious criminal case resolution is found to be associated withcourt systems in which the conditions also promote effective advocacy. Becauseeffective advocacy underlies due process and equal protection of the law, it is anintegral aspect of the broader concept of quality case processing. The evidencefrom this study suggests that well-performing courts should be expected to excelin terms of both timeliness and quality.
This central conclusion reached by researchers at the National Center forState Courts and the American Prosecutors Research Institute is based on datacollected from nine different state criminal trial court systems located in variousparts of the country (Albuquerque, New Mexico; Austin, Texas; Birmingham,Alabama; Cincinnati, Ohio; Grand Rapids, Michigan; Hackensack, New Jersey;Oakland, California; Portland, Oregon; and Sacramento, California). Data foreach court system included multiple case and defendant characteristics drawnfrom a random sample of approximately 400 individual cases resolved in 1994;questionnaire responses from prosecutors and criminal defense attorneys; on-siteobservations and interviews with judges, prosecutors, and defense attorneys; andcommunity and court organizational attributes.
The study’s central finding emerges from a recent, thorough, and systematicinquiry into the perennial question: How are case processing timeliness and qual-ity related? The current research challenges the traditional notion that the twovalues are in conflict so that a gain in one comes only at a loss in the other.
R

XIV • EFFICIENCY, TIMELINESS, AND QUALITY: A NEW PERSPECTIVE
C Analytical Framework
An analytical framework is developed to show how the values of timelinessand quality are affected by the concept of efficiency. Timeliness is measuredin a direct way: the number of days from indictment or bindover to finalresolution. There is far less general acceptance, however, on how to measurethe quality of case processing. In this study, we draw on Standard 3.3, Equal-ity, Fairness, and Integrity, of the Trial Court Performance Standards to de-velop a measure of case processing quality that relates directly to timeliness.Focusing “on what many consider the essence of justice,” Standard 3.3 ex-plains that the decisions and actions of trial courts should be based on indi-vidual attention to each case. It further requires that the court’s decisionsand actions be in proper proportion to the nature and magnitude of the case.In addition, we argue that meaningful and effective advocacy is more likelyto occur in criminal justice systems that are well managed, adequatelyresourced, sufficiently adversarial, and home to competent counsel. There-fore, we focus on one critical dimension of quality case processing: the ex-tent to which cases are given individual attention and whether the criminalcourt system is conducive to providing effective advocacy to cases. We thenexamine how this measure of quality varies among courts with different lev-els of timeliness.
Efficiency within the context of case resolution means to use resourcesin their most productive fashion to produce the most of what a court systemvalues. Therefore, to be efficient, court leaders need to devote sufficient timeto determining and clarifying what the court values. Few would argue againstthe statement that both timeliness and quality are each worthwhile values forcourts to pursue. However, what is strikingly different from traditional think-ing is our proposition that as judges, prosecutors, and defense attorneys be-come more efficient, they create the opportunity to increase timeliness andquality simultaneously. Well-performing courts have spent time examiningthe policies and practices that allow their organization to better use theirpersonnel, procedures, and technology to achieve a range of desired ends. Asa result, we believe that a fundamental challenge confronting courts is toincrease efficiency as the means to improve performance across the boardinstead of seeing the value of timeliness inherently contrary to the value ofquality, a so-called zero sum game.
C Supporting Evidence
The majority of this report is directed toward putting the analytical framework tothe test. To clarify the relationship between timeliness and quality, our analysisattempts to account for why some court systems manage to come closer to thetime standards articulated by the American Bar Association (ABA) and the Con-ference of State Court Administrators (COSCA). Specifically, the analysis wasdivided into three parts:
1. Investigate the extent to which three important factors in the court envi-ronment (caseload characteristics, management strategies, and resources)contribute to differences in the pace of felony litigation.
2. Analyze why some cases are processed more quickly than others in eachof the nine courts by testing the influence of a variety of individual case-and defendant-related factors thought to shape case processing time.
3. Examine whether attorneys’ attitudes about key dimensions of case pro-cessing quality vary systematically with the speed of case processing.
The first part of the analysis examines the “commonsense” view that crimi-nal court case processing is slowed down by a high volume of cases and an insuf-ficient number of judges, prosecutors, and/or criminal defense attorneys (for greaterdetail, see Chapter 2). The variation in case processing time among the nine courtsystems studied is analyzed in relationship to separate caseload, structural, andresource measures. The primary question is whether there is a systematic con-nection between any of these separate court-level factors and timely court perfor-mance. Key findings include:
• The kinds of cases coming to the nine courts are more striking intheir similarities than in their differences, despite that these courtsare drawn from throughout the country and differ considerably interms of demographics.
• The courts tend to handle predominantly drug-related offenses, followedby burglary and theft offenses. Very violent crimes against the person(capital murder, homicide, rape, and sexual assault) are a small minorityof the cases filed in each court.
• The majority of cases are resolved by guilty pleas, and trials are rarein all courts.
EXECUTIVE SUMMARY • XV

XVI • EFFICIENCY, TIMELINESS, AND QUALITY: A NEW PERSPECTIVE
• Most criminal defendants are released on bond, and most have a publiclyappointed attorney.
• There is no relationship between either cases resolved per judge or resolu-tions per prosecutor and case processing time.
The second part of the analysis looks closely at the extent to which multipleindividual case and defendant characteristics in combination affect how long ittakes a state criminal trial court to resolve felony cases (for greater detail, seeChapter 3). At this stage, the analysis moves from a focus on aggregate court-level features to an examination of approximately 3,500 individual cases drawnfrom the nine jurisdictions studied. This type of individual case-level analysis isdesigned to uncover relationships sometimes missed or obscured by aggregatedata. In addition, a primary issue is whether case- and defendant-related datashow any evidence that more expeditious courts process cases differently fromslower courts. Key findings include:
• Core case and defendant characteristics help explain some—but not all—of why some cases are resolved more expeditiously than others withineach of the systems. The severity of the offense, the method of resolution(trial versus guilty plea), the defendant’s bond status, and the additionalscheduling involved when a bench warrant is issued for the defendant’sfailure to appear at a court hearing are key determinants of processingtime in all courts. For example, cases involving the most violent crimesagainst the person that go to trial take about the same proportion of caseprocessing time in the faster courts as in the slower courts.
• There is evidence that the nine court systems handle their commoncaseloads with the same relative degree of timeliness. The more serious,the more complicated, and the more difficult cases take longer to resolvethan the less serious, less complicated, and the less difficult cases. Thispattern of proportionality suggests that criminal court systems resolvecases purposively and with individual attention. Faster courts do notachieve their timeliness through the imposition of “assembly line justice.”
• An important way in which the nine court systems differ is in the timeframe that it takes to resolve all of the cases. The absolute elapsed time(measured in days) is longer in some of the systems than in others. Infact, there were three broad categories of overall case processing times.Three courts were quite expeditious, on average, three courts were mod-erately so, and the remaining three courts were slower than the others. In

the faster courts, the judges, court staff, and attorneys have developed theability to get the same, basic job done in a shorter period of time.
In summary, the results indicate that a consistent set of case- and defendant-related characteristics underlie differences in the time to resolution in all ninecourts. Moreover, there is evidence that the variation is in proportion to the na-ture and seriousness of the case and the characteristics of the parties. However,differences in case- and defendant-related characteristics do not explain all of thedifferences in case processing time between courts. So while these findings sug-gest that the norm in most courts is to provide a proportional degree of individualattention to cases, they do not explain how practitioners in some courts are ableto achieve this goal within much tighter time frames.
Consequently, the third step in our analysis is to begin to unpack the conceptof “local legal culture,” with an eye toward clarifying how some courts are ableto achieve higher levels of both quality and timeliness (for greater detail, seeChapter 4). This task involves an in-depth examination of the views of criminaldefense counsel and prosecuting attorneys in the nine court systems toward theirwork situations, including the actions of the judges and opposing counsel. Datawere gathered concerning the attorneys’ views toward four aspects of their worksituation: (1) the adequacy of available resources, (2) the extent of clear courtpolicies governing the pace of litigation, (3) the competency of opposing coun-sel, and (4) the effects of opposing counsel’s practices (e.g., plea bargaining ne-gotiation) on the timeliness of case resolution. For purposes of the analysis, thenine court systems were divided into three groups of three courts according toeach court’s relative speed of case resolution.
The assumption of the current research is that the attorneys’ views towardthese four aspects indicate whether their working conditions promote or inhibiteffective advocacy. When attorneys believe that they have adequate resources,that the court articulates clearly and firmly what the pace of litigation should be,and that opposing counsel is considered to be well skilled and well prepared, thenthey are working under conditions that foster their effectiveness as an advocatefor the community’s interest (prosecutors) or the defendant’s interest (defenseattorneys). Inadequate resources, uncertainty concerning the court’s expectationsabout how long cases should take to be resolved, and the effort required to clearaway the underbrush created by inexperienced and ill-trained opposing counselfrustrate effective advocacy. Finally, effective advocacy means that prosecutorsand defense attorneys in all courts should maintain their adversarial positions.
EXECUTIVE SUMMARY • XVII

XVIII • EFFICIENCY, TIMELINESS, AND QUALITY: A NEW PERSPECTIVE
Key findings include:
• The more expeditious courts are most conducive to effective advocacy.Attorneys in the most expeditious courts were much more likely to be-lieve that they had sufficient resources, that the court promulgated clearand decisive policies on case resolution, and that opposing counsel werewell trained and well prepared, although they were just as likely to viewthe practices (e.g., plea negotiations) of opposing counsel critically.
• In contrast, in the less expeditious courts, the prosecutors and defenseattorneys tended to see resource shortages, even though the number ofcases per prosecutor and the number of cases per judge were not higher inthe less expeditious systems. The attorneys, moreover, perceived littleevidence of effective case management policies. Their views on the com-petency of counsel were reciprocal but negative. Prosecutors and defenseattorneys were less likely to see the other side as well trained and skilled.
• The subjective working conditions of attorneys in the expeditions courtsare more conducive to effective advocacy, due process, and quality thanthe conditions in the less expeditious courts.
Taken together, these findings imply the need for a basic rethinking abouttimeliness and quality in American state criminal courts. There is evidence thatthe world of state criminal trial courts is a purposive and deliberative process ofproportionality by which cases receive the amount of attention that they deserve.The process operates more expeditiously in some systems than in others, and oneway to view these differences is through the lens of efficiency. Efficiency is fun-damental to timeliness and a court system’s provision of effective advocacy. Hence,a real need for courts is to learn from each other on how to get essentially thesame job done in a tighter time frame. That challenge should and can be theagenda for future national, state, and local judicial and attorney training pro-grams (see Chapter 5).
C Methodology
Data for each site were obtained from case files for approximately 400 casesresolved in 1994, responses to mail questionnaires sent to prosecutors and crimi-nal defense attorneys, on-site interviews with judges, court managers, prosecu-tors, and criminal defense attorneys, and contextual measures of community andcourt organizational characteristics.

The methodology for analyzing the individual case-level data involves theuse of an interactive regression model. This model has distinct advantages overtechniques used in previous research. Specifically, the model distinguishes theinfluence of each potential causal factor on case processing time in each separatecourt and directly compares and contrasts the influence of each factor across allof the courts combined. Looking at Oakland, for example, one can compare thetime it takes to resolve a case in which the offender was represented by a publiclyappointed attorney and was convicted of a violent crime at trial with the time ittakes to resolve a case in which a drug offender was represented by a privatelyretained attorney and was convicted by a guilty plea. Additionally, one can exam-ine whether the same factor influences case processing time in the same way inthe nine courts. For example, does case resolution by a guilty plea affect caseprocessing time in Portland in the same way that it does in Austin (or any of theother courts)? Finally, having all nine courts integrated into a single model pro-vides the basis for knowing how well and consistently a common core of case-and defendant-related characteristics explain case processing time.
The methodology for analyzing the questionnaire responses was to constructfour “scales” (i.e., particular combinations of questionnaire items) that were sub-stantively connected and intercorrelated. The scales measured the subjective viewsof the attorneys toward resources, court management, opposing counsel’s com-petence, and opposing counsel’s practices. Finally, the demographic and court-related data were examined in two ways. One way was to compute the averageprocessing time associated with the presence or absence of a given factor (e.g.,grand jury). Does the use of a grand jury appear to result in longer, shorter,or about the same average processing time? The other way was more quanti-tative. Specific organizational factors, along with individual case character-istics, were tested for their effects, as mentioned above in the discussion ofthe regression model.
Thus, the current research demonstrates the utility of an integrated, com-parative approach. Almost all previous research on timeliness has focused solelyon differences in caseload characteristics and aspects of organization, manage-ment, and resources to explain variations in case processing times. Other research-ers subsequently focused on the qualitative social and political dynamics withincourts to understand case processing times. This study attempts to bridge theworld of structure, organization, caseload, and resources with the world of atti-tudes held by the key actors in court systems. Specifically, we examine case pro-
EXECUTIVE SUMMARY • XIX

XX • EFFICIENCY, TIMELINESS, AND QUALITY: A NEW PERSPECTIVE
cessing time in nine courts taking into account differences in (1) court context(e.g., structure, personnel, and resources) and the volume and type of crimi-nal cases entering each court, (2) individual case processing and resolution,and (3) attorneys’ views and perceptions about critical work elements of thecourt system. Few, if any, prior studies have systematically examined all ofthese factors.
WHAT DO WE NEED TO KNOW ? • 1
C Introduction
The state criminal court system is an important institution in the attempt to limitcriminal activity and to restore a measure of justice when laws are broken.1 Therelationships among state judges, prosecutors, and criminal defense attorneys con-stitute the criminal court system, while the outcomes of their individual and jointdecisions are basic to the public’s perception of the system’s effectiveness. Onekey measure of court effectiveness is how long it takes to resolve cases. The U.S.Supreme Court emphasized the importance of the speedy trial in the criminalprocess by stating that this right was “as fundamental as any of the rights securedby the Sixth Amendment.”2 The Texas Supreme Court also reminded observershow insidious court delay can be:
Delay haunts the administration of justice. It postpones the rectification ofwrong and the vindication of the unjustly accused. It crowds the dockets ofthe courts . . . pressuring judges to take shortcuts, interfering with the promptand deliberate disposition of those cases in which all parties are diligent andprepared for trial, and overhanging the entire process with the pall of disor-ganization and insolubility. . . . [P]ossibilities for error multiply rapidly astime elapses between the original fact and its judicial determination. If the
1 State criminal trial courts handle the overwhelming majority of serious criminal cases each year. In1996, they resolved over two and a half million felony cases, while the federal courts resolved60,000 cases, which included both felonies and misdemeanors (Ostrom and Kauder, 1997).2 386 U.S. 223, 87 S.Ct. 993, 18 L.ed. 2d 1 (1967).
Chapter 1
k
WHAT DO WE NEED TO KNOW?

2 • EFFICIENCY, TIMELINESS, AND QUALITY: A NEW PERSPECTIVE
facts are not fully and accurately determined, then the wisest judge cannotdistinguish between merit and demerit. If we do not get the facts right, thereis little chance for the judgment to be right.3
Responding to concerns about the timeliness of case resolution, researchershave produced a body of literature seeking to understand what causes some courtsto take longer in resolving criminal cases. Over the past few decades, numerousreports, monographs, and research articles addressed delay in state criminal trialcourts.4 A primary reason for the past and current interest in the topic is thatidentifying what factors produce delay, and how and why they produce delay, hasremained difficult.
C Statement of the Problem
A natural starting point for research on criminal court delay has been to examineaspects of the adjudication process that enter from outside the court (e.g., theindividual characteristics of cases and defendants) or that can be manipulated bythe court (e.g., case management procedures and court organization). However,there are four unsettled issues that emerge from an examination of previous re-search results. First, there is no cumulative evidence that indicates which of themany possible case and defendant characteristics have the largest impact on caseprocessing time. A wide range of factors have been tested, but even the beststudies in this line of research have identified characteristics that explain only asmall portion of the variation in criminal case processing times. Such studiesoffer little guidance to courts wishing to better understand why some cases takelonger than others.
The second unsettled issue concerns how the norms of the courtroom “workgroup” influence the pace of litigation and the adjudication process in general.
3 Southern Pacific Transportation Co. v. Stoot, 530 S.W. 2nd 930 (1975).4 Comparative research on state criminal court delay all but ceased in the 1990s, although practicalefforts at delay reduction continued during this period especially with the advent of specialized drugcourts. Our review of the literature found no cross-jurisdictional studies completed and publishedsince 1991. Past research in this area includes, for example, Church, Lee, et al. (1978); Friesen,Jordan, and Sulmonetti (1978); Neubauer et al. (1981); Flemming, Nardulli, and Eisenstein (1987);Luskin and Luskin (1987); Mahoney et al. (1988); Goerdt and Martin (1989); Hewitt et al. (1990);Goerdt et al. (1991). Because our focus is on case processing in the state courts, we do not discussdelay in the context of the federal courts.
WHAT DO WE NEED TO KNOW ? • 3
A major contention is that the substance of case processing reflects the views ofpracticing attorneys about how long cases should take to be resolved. Efforts toeither speed up or delay case processing from the prevailing local norm will beseen as a threat to justice and frequently resisted. Yet, the research on this topichas reached only the rather modest conclusion that judges and lawyers live up totheir expectations.
A third unsettled issue is the lack of a comprehensive view of the criminaljustice system. Few studies have attempted to integrate data on the mix of casesand defendants, case management, and resources (e.g., number of judges) withdata on the important qualitative aspects of local court communities (e.g., attor-neys’ attitudes). Because past studies tend to focus exclusively on case charac-teristics or on “local legal culture,” the ways in which these different sets offactors come together to influence timeliness remain conceptually murky andare seldom subject to rigorous testing. As a result, the court community is leftwith a fragmented and partial understanding of what distinguishes operations infaster courts from those in slower courts.
The fourth unsettled issue is how the pace of litigation relates to the qualityof litigation. While relative newcomers to the age of standards, courts have movedquickly to embrace case processing time frames that spell out explicitly the di-vide between acceptable and unacceptable time to disposition. The standardsmovement raises critical questions as to whether courts can reduce delay whilesimultaneously maintaining quality along other dimensions of case processing,such as due process, accessibility, affordability, equality, and so forth. Address-ing this issue requires assessing whether court environments that come closest tomeeting established time standards are also conducive to quality case process-ing. Case characteristics should not be examined in isolation. Rather, researchersshould investigate whether cases receive individual attention in both fast andslow courts. Likewise, a priority in examining local legal culture in courts shouldbe to make use of practitioner experience to clarify how the effectiveness of theadvocacy process varies between faster and slower courts.
The current research is intended to increase understanding of how fac-tors such as the types of cases entering the court, case management, resources,and attorneys’ attitudes about key aspects of local court communities arerelated to the pace of litigation. Moreover, the research offers a frameworkfor analyzing how this blend of quantitative and qualitative information canbe used to determine whether quality case processing varies between fasterand slower courts.

4 • EFFICIENCY, TIMELINESS, AND QUALITY: A NEW PERSPECTIVE
C The Need to Untangle Timeliness, Quality, andPerformance Standards
Today, a well-functioning court system is expected to process a large volume ofwork while maintaining high performance within demanding time frames. The grow-ing nationwide interest in standards of court performance, and time standards inparticular, is where these two expectations intersect and create the challenge toprocess more work within an environment that wants increased accountability.
Time to disposition can be measured and compared among courts. However,other dimensions of court performance centering on the quality of case process-ing are more difficult to define and measure. Are cases given the needed level ofindividual attention? Is the relationship between prosecutors and defense attor-neys sufficiently adversarial, and do the opposing attorneys have the requisiteskills? Do prosecutors, criminal defense attorneys, and judges have sufficientopportunities to discuss problems in system effectiveness and to create mutuallybeneficial responses? If case processing time is reduced, are other aspects of fairand equitable case processing compromised? Is there a cost to delay reduction?Do courts face a trade-off between timeliness and quality?
In discussions of delay reduction, time standards are a natural cynosure. Timestandards can provide general boundaries for case processing by balancing theconcerns of “quality” and “timeliness.” The very notion of criminal justice re-flects two legitimate but competing perspectives. One perspective emphasizesthe importance of timeliness and the need to resolve cases as quickly as possible.For example, early pleas of guilty are preferred over late pleas to permit courts tokeep up with the incoming cases. The other perspective emphasizes “quality”case processing to ensure justice, including the importance of a thorough reviewin every individual case and the need to protect the defendant’s constitutionalrights at all stages of the legal process. For example, limited restrictions on mo-tions for continuances are preferred over tight restrictions to give defense coun-sel ample time to prepare the strongest case possible. Therefore, the effort tostructure case processing through standards seeks to resolve the competing prin-ciples of timeliness and the quality of justice.
Standards that balance timeliness and quality are necessary to give courtsdirection and to provide guidance on the manner in which they conduct theirbusiness. In response to this need, without removing local court discretion inmanaging caseloads, professional organizations of attorneys as well as judgesand court managers have established guidelines for case processing that reflect

WHAT DO WE NEED TO KNOW ? • 5
how long it should take to resolve cases.5 However, the American Bar Associa-tion (ABA) and Conference of State Court Administrators (COSCA) Time Stan-dards focus primarily on delay reduction (“timeliness”), and none of the stan-dards assess explicitly whether case processing quality suffered or improved un-der tighter time lines.6 As a result, many important questions are left unanswered.Are there both positive and negative consequences of delay reduction? Isthere evidence that courts with faster average case processing times also haveother characteristics associated with quality case processing?
Answering these questions means coming to terms with what qualitycase processing means. Steps have been taken in this direction with thedevelopment of the Trial Court Performance Standards (TCPS). 7 The TCPSoffer an extensive system of performance goals and measures geared to enhanc-ing public accountability and understanding overall trial court performance. Inthis study, we draw on Standard 3.3: Court Decisions and Actions, which fallswithin the Equality, Fairness, and Integrity area of the TCPS, to develop a mea-sure of case processing quality that relates directly to timeliness. Focusing “onwhat many consider the essence of justice,” Standard 3.3 states that the decisionsand actions of trial courts should be based on individual attention to each case.It further requires that the court’s decisions and actions be in proper propor-tion to the nature and magnitude of the case. In addition, we argue that mean-ingful and effective advocacy is more likely to occur in criminal justice sys-tems that are well managed, adequately resourced, sufficiently adversarial,and home to competent counsel. Therefore, we focus on one critical dimen-sion of quality case processing: the extent to which cases are given indi-vidual attention and whether the criminal court system is conducive to pro-viding effective advocacy to cases. We then examine how this measure ofquality varies among courts with different levels of timeliness.
5 American Bar Association Standards and COSCA Standards.6 The Committee on Court Delay Reduction appears to believe that reducing court delay will natu-rally improve the quality of justice: “As the steward of public trust in our legal system, the courtsystem is obliged to dispose of court business without delay. To do less is to compromise justice”(pp. 5-6). But no standards or measures are developed to assess the validity of this assumption.7 Commission on Trial Court Performance Standards (1990). There are multiple standards in fiveareas of performance: access to justice; expedition and timeliness; fairness, equality, and integrity;independence and accountability; and public trust and confidence.

6 • EFFICIENCY, TIMELINESS, AND QUALITY: A NEW PERSPECTIVE
C A Conceptual Framework for UnderstandingTimeliness and Quality
The basic framework proposed in the current research is that a court’s ability tomeet both the goals of timeliness and effective case processing is part of a largercriminal justice system context.8 This idea implies that research should take intoaccount the many and often divergent pressures that influence timeliness andfairness. On the one hand, judges preside over an adversarial system in which themotives and goals of prosecutors and criminal defense attorneys are often in con-flict. Incentives abound for both prosecutors and defense attorneys to speed or retardaction on their cases. On the other hand, the fundamental assumption of case man-agement is that court procedures are malleable. The premise is that through im-proved management practices a court can respond proactively to a growing vol-ume of work and, thereby, achieve higher levels of institutional performance.
The theoretical framework of this study rests on the assumption that timestandards reflect society’s choice on what is an “optimal” solution to the tensionbetween quality and timeliness. Moving closer to this optimal state requires thatcourt systems improve their efficiency. Efficiency within the context of case reso-lution means to use resources in their most productive fashion to produce themost of what a court system values. Therefore, to be efficient, court leaders mustfirst devote the time necessary to determine and clarify what the court values.Few would argue against the statement that timeliness, individual attention to cases,and effective advocacy are worthwhile values for courts to pursue. To achieve bothtimeliness and quality, a well-performing court must determine the policies andpractices that will allow it to better use personnel, procedures, and technology toimprove overall effectiveness. The key is efficiency.
From this orientation, the primary purpose of this study is to address a set offundamental questions that include: What features characterize criminal courtsthat come closest to meeting nationally recognized time standards? Is timelinessachieved primarily through “assembly line justice” (e.g., treating all cases thesame, relying heavily on plea bargains), or are timely courts still able to provideindividual attention to cases? By drawing on a wide range of attorney attitudesabout case processing, how does the effectiveness of the advocacy process differbetween fast and slow courts?
8 Eisenstein, Flemming, and Nardulli (1988).
WHAT DO WE NEED TO KNOW ? • 7
C Specific Objectives of the Current Research
This report offers an integrated approach to studying how case processing timevaries across courts. Almost all previous research on court delay focused solelyon differences in caseload characteristics and aspects of organization, manage-ment, and resources to explain variations in case processing times. Because thesestudies failed to explain much of the variance in the pace of litigation, otherresearchers subsequently focused on the qualitative social and political dynamicswithin courts to understand case processing times. This study attempts to bridgethe world of structure, organization, caseload, and resources with the world ofattitudes held by the key actors in court systems. Specifically, we examine caseprocessing time in nine courts taking into account differences in (1) court context(e.g., structure, personnel, and resources) and the volume and type of criminalcases entering each court, (2) individual case processing and resolution, and (3)attorneys’ attitudes and perceptions about critical elements of the local court sys-tem. Few prior studies have systematically examined all of these factors. Ourinvestigation involves conceptualizing, defining, and constructing a set of em-pirically based measures that will allow direct comparison of the impact of eachmajor attribute (i.e., caseload and resources, management, and legal culture) inthe nine courts.9
C Research Design
The National Center for State Courts (NCSC) and American Prosecutors Re-search Institute (APRI) conducted this study in nine large urban trial courts (countypopulations ranging from 400,000 to 1.2 million) in eight states representing vari-ous regions of the U.S.10 Project staff obtained four types of data from each juris-
9 The movement within the nation’s state courts toward the implementation of time standards, grow-ing public concern with the accountability of public institutions, and long-standing practitioner andscholarly interest in the determinants of court delay place a premium on comparative research.Without data on several courts, it becomes difficult to see whether differences in structure, resources,practices, procedures, or views of practitioners are related to any observable differences in caseprocessing. Our goal is to take the first steps toward determining whether timeliness in case process-ing tends to appear in court environments that are conducive to other dimensions of case quality orif a focus on delay reduction appears to reduce a court’s ability to offer quality case processing.10 A detailed description of the methodology is included in Appendix 1.

8 • EFFICIENCY, TIMELINESS, AND QUALITY: A NEW PERSPECTIVE
diction. First, the court in each site provided moderately detailed data on about400 randomly sampled felony cases disposed in the general jurisdiction courtduring fiscal year 1994-95. Second, the court administrator, prosecutor’s office,and indigent defense program in each site provided data on their felony caseload,staffing, and case management procedures. Third, during visits to each countyinterviews were conducted with judges, attorneys, and court managers about arange of issues related to felony case processing. Finally, 15 to 30 prosecutorsand about the same number of defense attorneys in each county completed a briefquestionnaire that solicited their opinions and observations on a range of issuesrelated to felony case processing in their respective jurisdictions. These four typesof data will be analyzed throughout this report.
C Organizational Roadmap
In this study, we focus on nine court systems by bringing together case-level data,interview data, and survey results from prosecutors and defense counsel in eachjurisdiction. The basic approach, questions to be addressed, and report organiza-tion are discussed below.
The Context of Criminal Case ProcessingCourt delay is a concern of the courts and has been the subject of a series of
studies over the past few decades. The “commonsense” view that criminal courtdelay is basically caused by too many cases and an insufficient number of judges,prosecutors, and/or defense counsel remains strong among practitioners. Follow-ing the lead of numerous studies of delay conducted by the National Center forState Courts and others, Chapter 2 of this report begins with a seriatim examina-tion. Case processing time is analyzed in relationship to separate caseload, struc-tural, and resource measures one at a time. The following questions are examined:
• How do the courts compare in terms of case processing time as measuredby both arrest to disposition and indictment or information to disposition?
• How do the courts compare in terms of key workload and resource mea-sures, felony caseload mix, and disposition types?
• Is there any connection between each of these separate court-level factorsand timely case outcomes?
This section also serves to build a comparable descriptive profile of the nineparticipating jurisdictions.

WHAT DO WE NEED TO KNOW ? • 9
Multivariate Statistical Analysis of the Influence of Caseload Factors ofFelony Case ProcessingOne reason that many previous studies have not found a strong relationship
between case processing time and court caseload, structure, and related factorsmay be that basic descriptive statistics (e.g., average processing times for highversus low caseload volume courts) obscure as much as they reveal. Practitionersand researchers alike assert that case processing time is influenced by an interac-tion of a wide range of case attributes, such as the seriousness of the charge, thedefendant’s prior record, type of legal representation, and so forth.
• What case and defendant attributes are significantly related to case processing time?
One of the few consistent findings in the literature is that case and defendantcharacteristics explain less than half of the variation in case processing time. Weexpect the data from these nine courts to show the same pattern. However, theprimary interest here is to determine whether case- and defendant-related datashow any evidence that more expeditious courts (i.e., those that are closer tomeeting established time standards) process cases differently from slower courts.
• Are the same factors found to be statistically significant in explaining whysome cases take longer than others in fast courts also significant in slowercourts? What patterns in the significance of case- and defendant-relatedfactors emerge across the nine courts?
In Chapter 3, a statistical model is employed to compare the impact of case- anddefendant-level factors on case processing time across the nine courts.
The analysis then takes a further step to clarify whether fast courts processcases differently than slower courts. Is faster case processing time achieved byessentially treating all felony cases the same, or does faster case processing stillallow for differentiation between cases (e.g., more serious cases are given moretime than less serious cases)? Do fast courts give more serious cases relativelythe same amount of time as courts less concerned with timely disposition of cases?The primary questions are as follows:
• If more serious, complex felony cases (e.g., homicide) take longer than lessserious cases (e.g., burglary) to resolve, do case processing time patterns infaster courts look relatively the same as patterns in slower courts? We knowthe absolute measures of case processing time (measured in the averagenumber of days from arrest to disposition) vary widely between courts.However, do fast courts achieve their timeliness by processing all cases

10 • EFFICIENCY, TIMELINESS, AND QUALITY: A NEW PERSPECTIVE
with about the same speed (regardless of seriousness), or do fast courtsprovide more serious cases about the same proportion of their (shorter) caseprocessing time as slower courts?
This analysis is conducted by building a uniform profile of a “complex case”from a small, common set of significant factors and comparing its time to resolu-tion both within and among the courts. This approach allows a direct comparisonof relatively how much time complex cases take in the nine sites.
The statistical analysis in Chapter 3 provides part of the answer for under-standing how and why case processing speed varies across the nine sites. How-ever, as indicated in previous studies, caseload characteristics explain only a lim-ited amount of the variation in case processing times. In addition, there are moresimilarities than differences between courts in how case characteristics affectcase processing. Hence, there is reason to examine elements of the social contextof criminal court case processing.
Efficiency, Quality, and Attorneys’ AttitudesA primary goal of this project is to add conceptual clarity and systematic
evidence to the debate about case processing quality and timeliness. Chapter 4begins by developing an analytical framework called the productivity frontier toshow how the goals of timeliness and quality are affected by the concept of effi-ciency. Efficiency is a pertinent and helpful idea because high levels of both timeli-ness and quality can be shown to be achievable in more efficient court systems.
Our operational definition of case processing quality focuses on a courtsystem’s ability to provide due process through individual attention to cases (ex-amined in Chapter 3) and effective advocacy. This phase of the project draws onthe work of the TCPS and other court management experts to construct an ob-servable and measurable set of work-related factors that we believe are associ-ated with effective advocacy. Over the past decades, court practitioners and re-searchers have isolated certain fundamental aspects of court operations and caseprocessing that, when present, create the opportunity for effective advocacy. Weargue that meaningful and effective advocacy is more likely to occur in criminaljustice systems that are well managed, adequately resourced, sufficientlyadversarial, and home to competent counsel. We do not claim that we have as-sembled an exhaustive set of factors that definitively define effective advocacy.Rather, our goal is to suggest measurable elements, determine what findingsflow from an analysis of those elements, and provide a concrete basis for im-proved future research.

WHAT DO WE NEED TO KNOW ? • 11
Chapter 4 unpacks key underlying components of case processing qualityto examine and assess whether attorneys’ attitudes vary systematically with thespeed of case processing. We examine attorneys’ attitudes among the followingfour key dimensions of the work environment surrounding the attorneys in thenine court communities:
• Adequacy of resources: Are resources sufficient in the sense that thereare enough judges, prosecutors, and defense attorneys for the workload?
• Characteristics of management: Is the court system well managed witheffective leadership and the opportunity for interagency coordinationand communication?
• Jurisdiction practices: How do judges, prosecutors, and defense attor-neys assess the effectiveness of delay reduction efforts within the courtsystem?
• Quality of opposing counsel’s performance: Do prosecutors and defenseattorneys see each other as having sufficient experience and skill toachieve high levels of performance?
We then examine attorneys’ attitudes on these dimensions by controlling forwhether the respondent is a prosecutor or a criminal defense attorney. Do thesetwo sets of attorneys in faster courts share attitudes that are different from theircounterparts, or are prosecutors (or defense attorneys) alike in their views re-gardless of the pace of the courts in which they work? In addition, analysis of thequestionnaire data provides a basis for assessing the extent of agreement or dis-cord among prosecutors and public defenders within jurisdictions and whetherpatterns exist among faster and slower courts.11
Finally, Chapter 5 concludes the report with a review of the major findingsand a discussion of their implications for policy, practice, and future research.
11 Let us be clear, however, that we are not looking to establish causality in the analysis of attorneys’attitudes and the pace of litigation. We do not assert that particular attitudes lead to timeliness or viceversa—it almost certainly goes both ways. Our goal is to examine whether and how practitionerattitudes differ across faster and slower courts. These attitudinal differences should provide substan-tial insight into why some courts are faster than others.

WHAT DO THE NINE CRIMINAL COURT SYSTEMS LOOK LIKE ? • 13
C Introduction
This chapter provides an overview of the felony case processing times in the ninecourts under study and the contexts in which they operate. It is intended to achievethree objectives. The first goal is to understand the similarities and differences infelony case processing times among the nine courts. The second objective is todetermine which of the jurisdictions approach a desired pace of litigation usingthe American Bar Association (ABA) time standards as a guide. The third goal isto examine the extent to which caseload characteristics, management strategies,and resources contribute to differences among courts in the pace of litigation.
Certainly many readers will be familiar with the received tradition on howand why caseload characteristics, management strategies, and resources do or donot affect timeliness. For that reason, some readers might only want to scan thecontents of Chapter 2. However, every reader might find it illuminating to seehow similar these nine courts are to each other. Furthermore, all readers mightfind it interesting to see how the specific courts with which they are most familiarshare key attributes with one or more of the nine courts on many of the multipledimensions under study. The pattern of similarities that we see among the ninecourts, moreover, is one that is not stressed in the literature.
C Measuring the Pace of Felony Litigation
One of the important roles of courts in the American adversarial legal system isto balance the sometimes competing interests of speed with individual justice.
Chapter 2
k
WHAT DO THE NINE CRIMINALCOURT SYSTEMS LOOK LIKE?

14 • EFFICIENCY, TIMELINESS, AND QUALITY: A NEW PERSPECTIVE
Time from Arrest to Disposition
Number Percentage Resolved Within Number of Days* of Cases 180 Days* 365 Days* Mean Median
Cincinnati 478 86% 97% 121 81
Grand Rapids 460 82 95 151 93
Portland 448 79 90 158 105
Oakland 416 58 83 230 144
Sacramento 187 40 82 251 227
Austin 404 43 74 280 201
Birmingham 457 11 57 401 316
Hackensack 405 9 57 395 336
All Courts Combined 3,255 52 89 245 169
Time from Indictment/Information to Disposition
Number Percentage Resolved Within Number of Days* of Cases 180 Days* 365 Days* Mean Median
Cincinnati 477 89% 98% 97 67
Grand Rapids 459 83 96 129 91
Portland 453 80 90 180 91
Oakland 414 71 89 178 95
Sacramento 200 67 92 163 120
Albuquerque 359 64 92 190 154
Austin 477 56 83 222 154
Birmingham 457 51 76 280 181
Hackensack 406 49 87 211 183
All Courts Combined 3,702 68 89 184 118
* The American Bar Association stipulates that 98 percent of the cases should be resolved within 180 daysafter arrest and that 100 percent should be resolved within 365 days.
Figure 2.1
How Long Does It Take to Resolve Felony Cases?*
WHAT DO THE NINE CRIMINAL COURT SYSTEMS LOOK LIKE ? • 15
12 ABA (1987); Otto (1985b).13 The ABA standards define “delay” as any time that is not necessary for a fair preparation anddisposition of a case (ABA, 1987).14 Disposition time standards are goals toward which courts should aspire, but they do not have theforce of law such that a defendant could have his charges dismissed if the court or prosecutor fails toobtain a disposition within the time frame suggested in the relevant standard.15 Although this study uses the ABA standards as a framework, it should be noted that they aresimilar to the standards promulgated jointly by CCJ and COSCA. The CCJ/COSCA Criminal Stan-dards state that 100 percent of felony cases should move from arrest to trial in 180 days except inindividual cases in which the court determines exceptional circumstances exist. Since 1985, moststates have adopted disposition time goals (besides speedy trial rules) for adjudicating all felonycases. The NCSC’s Information Service has compiled a report on state disposition time goals forcriminal, civil, and other cases, which is available upon request.
Courts must constrain the natural conflicts and strategies of prosecutors and defenseattorneys while managing their own resources wisely to ensure that the quality ofjustice is not denigrated by a process that is either too speedy or too slow.
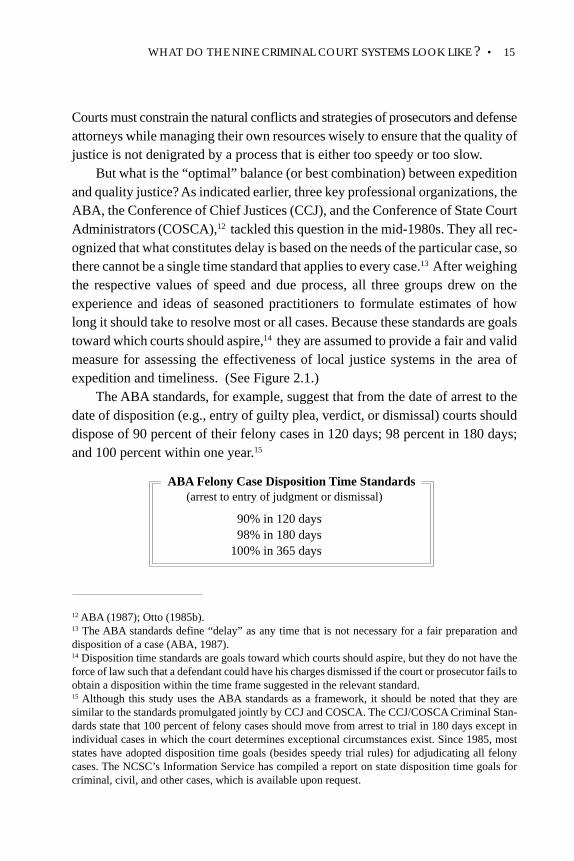
But what is the “optimal” balance (or best combination) between expeditionand quality justice? As indicated earlier, three key professional organizations, theABA, the Conference of Chief Justices (CCJ), and the Conference of State CourtAdministrators (COSCA),12 tackled this question in the mid-1980s. They all rec-ognized that what constitutes delay is based on the needs of the particular case, sothere cannot be a single time standard that applies to every case.13 After weighingthe respective values of speed and due process, all three groups drew on theexperience and ideas of seasoned practitioners to formulate estimates of howlong it should take to resolve most or all cases. Because these standards are goalstoward which courts should aspire,14 they are assumed to provide a fair and validmeasure for assessing the effectiveness of local justice systems in the area ofexpedition and timeliness. (See Figure 2.1.)
The ABA standards, for example, suggest that from the date of arrest to thedate of disposition (e.g., entry of guilty plea, verdict, or dismissal) courts shoulddispose of 90 percent of their felony cases in 120 days; 98 percent in 180 days;and 100 percent within one year.15
ABA Felony Case Disposition Time Standards (arrest to entry of judgment or dismissal)
90% in 120 days 98% in 180 days 100% in 365 days

16 • EFFICIENCY, TIMELINESS, AND QUALITY: A NEW PERSPECTIVE
There is substantial variation among the courts in the number of days takento move a case from the time of arrest to the time of disposition as shown inFigure 2.1.16 Cincinnati, Portland, and Grand Rapids are the best performers onthe one-year standard; each disposed of at least 90 percent of their felony caseswithin a year. In fact, these are the only three courts that have an average timefrom arrest to disposition of less than 180 days. On the other hand, three jurisdic-tions disposed of 74 percent or fewer of their cases within a year and two dis-posed of less than 12 percent within 180 days of arrest. Overall, no court in thisstudy meets the ABA standards.
Despite calls from national and statewide authorities to measure time begin-ning with arrest, we faced two practical considerations that steered us away fromusing arrest to disposition as our measure of case processing time. First, we wereinformed that arrest dates in some jurisdictions were unreliable. Second, arrestdates were completely absent in one court. As a consequence, and in the interestof inclusion, this study employs a modified version of the ABA standards thatfocuses on “upper-court” case processing—the time from indictment/informa-tion to disposition. Although data restrictions drive much of our decision, thereare other reasons to focus more specifically on the general jurisdiction trial courtphase of felony adjudication.
One justification for looking at the upper court is that in felony adjudicationvarious stages of the legal process frequently occur separately in two differentcourts.17 In most court systems, the first stage of the felony process is handled ina limited jurisdiction court (e.g., municipal, county). This “first appearance” iswhen the defendant is told of the charges that have been brought against him orher and bail is set, usually within 24 hours of arrest. The limited jurisdiction courtalso conducts the preliminary hearing to determine whether there is probablecause for continued prosecution, or a grand jury might determine probablecause. If the judge finds a reasonable basis for a felony charge after a pre-liminary hearing (or the grand jury issues an indictment), the felony case istransferred to the general jurisdiction trial court. If probable cause for con-tinued prosecution is not found, the case may be dismissed or the prosecutor
16 Arrest dates could not be obtained in Albuquerque, so it is excluded from analyses of elapsed timefrom arrest to disposition.17 Figure 2.7 shows that eight of the nine jurisdictions employ a two-tiered court system; only Sacra-mento has a unified court system.

WHAT DO THE NINE CRIMINAL COURT SYSTEMS LOOK LIKE ? • 17
may agree to a guilty plea on a nonfelony offense. The general jurisdictioncourt, which arraigns the defendant on a felony charge and either accepts aguilty plea or sets the case for trial, also handles almost all pretrial motionsand trials in felony cases. Therefore, meeting the ABA standards requiresthat the limited and general jurisdiction courts not only operate well sepa-rately, but also actively coordinate their work.
In addition, speedy trial rules in almost every state start the clock when theindictment is issued or the defendant is arraigned in the general jurisdiction trialcourt on the indictment or information. Courts and prosecutors take these rulesseriously to avoid dismissal of felony charges. Moreover, a trial in the generaljurisdiction court is the ultimate forum for adjudicating felony charges, and manyfelony offenders wait until a trial is imminent to enter a guilty plea. Trial sched-uling practices can have a ripple effect on the pace of adjudication for all felonycases regardless of how they are disposed. For example, if an excessive numberof cases are scheduled for trial, defendants can expect their trial to be postponedwith the need to reschedule another trial on an already overcrowded trial docket.This situation may offer a strategic advantage to the defendants by allowing themto get their “best deal” by pleading guilty to a reduced charge in exchange foragreeing to drop their requests for trial. As a result, the pace at which a casemoves from arrest to disposition rests largely on how cases are handled in thegeneral jurisdiction court.
Thus, for all of these reasons, this study adapts the ABA standards’ call for98 percent of all felonies to be resolved within 180 days after the initial arrest toestablish the standard that 98 percent of all cases should be disposed within 180days after indictment or bindover. Measured against this modified standard, thenine courts tend to fall into three relatively distinct clusters: three courts tend tobe the most expeditious (Cincinnati, Portland, and Grand Rapids); three othercourts are intermediate in terms of timeliness (Oakland, Sacramento, and Albu-querque), and the remaining three courts are slower (Austin, Hackensack, andBirmingham). Figure 2.2 shows that only Cincinnati, Portland, and Grand Rap-ids resolved at least 80 percent of their felony cases within 180 days after indict-ment, while the three slowest courts disposed of only 56 percent or less of theircases within this time frame. The three fastest courts, moreover, are relativelyexpeditious regardless of case type. They produced the most timely performancein each case category (i.e., most violent, other violent crimes against the person,burglary, and drug cases).

18 • EFFICIENCY, TIMELINESS, AND QUALITY: A NEW PERSPECTIVE
All Most Other Burglary Drug Sale & Other Felonies Violent Violent & Theft Possession Felony
All Courts Combined 68% 48% 64% 69% 71% 75%
Faster Courts
Cincinnati* 89 75 90 89 88 95
Grand Rapids 83 65 74 86 92 83
Portland* 80 90 88 82 79 69
Moderate Courts
Oakland 71 44 64 82 78 72
Sacramento 67 51 63 71 70 82
Albuquerque* 64 45 69 66 57 75
Slower Courts
Austin 56 41 57 48 66 67
Birmingham* 51 10 40 60 53 58
Hackensack* 49 55 35 54 45 64
Figure 2.2
How Long Do Specific Types of Felony Cases Take to Be Resolved?
All Most Other Burglary Drug Sale & Other Felonies Violent Violent & Theft Possession Felony
All Courts Combined 184 303 183 179 172 170
Faster Courts
Cincinnati* 97 153 103 90 96 88
Grand Rapids 129 264 151 119 97 130
Portland* 180 225 182 174 150 455
Moderate Courts
Oakland 178 480 175 107 141 205
Sacramento 163 219 165 144 162 132
Albuquerque* 190 269 166 202 208 140
Slower Courts
Austin 222 255 166 262 207 191
Birmingham* 280 483 334 236 278 217
Hackensack* 211 195 243 199 233 164
* This jurisdiction charges most of its felony cases by grand jury indictment.
The Average Number of Days from Indictment to Resolution
Percentage of Felony Cases Resolved Within 180 days After the Date of Indictment or Bindover

WHAT DO THE NINE CRIMINAL COURT SYSTEMS LOOK LIKE ? • 19
Examining the Context of Felony AdjudicationReason, experience, and the research literature suggest that the factors that
shape the overall pace of felony litigation are a rich mosaic. Practitioners andresearchers have focused on several key elements of local justice systems, in-cluding variations in the size and complexity of their caseloads, organizationaland management strategies, jurisdictional practices, resources, and practitioners’norms and attitudes. Chapter 3 of this report will examine differences in caseprocessing times through a multivariate statistical model that analyzes the inter-action of case-level variables and some key court-level factors. In anticipation ofthat analysis, the context of felony adjudication in each of the nine courts is ex-amined. An overview of key community characteristics is provided to facilitate a“quick” understanding of the environment surrounding the courts under this study.The utility of this contextual information is that it suggests that virtually everystate trial court in the country likely shares some key attributes with one or moreof the nine courts. Consequently, the nine courts are not an odd sample that bearsno relationship to the rest of the world. Hence, the findings should be relevant toa wide range of trial courts and a basis against which courts not included in thestudy can compare themselves.
The “conventional wisdom” regarding how several key factors are expectedto influence the pace of litigation is then examined to discern whether patternsemerge that are consistent with the expected patterns. To facilitate this analysis,throughout the remaining tables in this chapter we have listed the nine courts inorder from highest to lowest on the percentage of felony cases resolved within180 days after indictment or bindover.
County Demographic CharacteristicsAs Figure 2.3 indicates, the counties18 in which the nine courts are located
are from eight different states representing five regions of the country (North-east, South, Midwest, Southwest, and West Coast). The counties are all largeurban or suburban areas, ranging in population from 499,000 in Bernalillo Co.,New Mexico (Albuquerque), to 1.3 million in Alameda Co., California (Oak-land). Population density varies substantially, from less than 600 people per squaremile in two counties to more than 3,500 per square mile in Bergen Co., NewJersey (Hackensack), a suburban area outside New York City. Travis Co., Texas
18 To ease the exposition, we tend to use the primary city rather than the county name.

20 • EFFICIENCY, TIMELINESS, AND QUALITY: A NEW PERSPECTIVE
Fig
ure
2.3
Wha
t Do
the
Com
mun
ities
Loo
k Li
ke?
*
Pop
ulat
ion,
199
5
I
ncom
e, 1
989
V
iole
nt c
rime
Den
sity
% B
elow
% D
ispo
sed
for
100
,000
per
sq.
%
Cha
nge
M
edia
n
pov
erty
R
ace,
199
0
in 1
80 d
ays*
*po
p., 1
991
P
erso
ns
m
ile
19
80-1
990
hou
seho
ld
lin
e
%
Whi
te
% B
lack
Fas
ter
Cou
rts
Cin
cinn
ati
8978
086
3,90
82,
140
-0.8
$29,
498
13.3
77.7
20.9
Gra
nd R
apid
s83
808
525,
355
598
12.6
32,3
589.
288
.78.
1
Por
tland
801,
464
614,
104
1,38
03.
826
,928
13.1
87.0
6.0
Mod
erat
e C
ourt
s
Oak
land
711,
180
1,32
3,31
21,
773
15.5
37,5
4410
.659
.617
.9
Sac
ram
ento
6790
31,
103,
499
1,13
232
.932
,297
12.5
75.1
9.3
Alb
uque
rque
641,
123
522,
328
428
14.4
27,3
8214
.676
.92.
7
Slo
wer
Cou
rts
Aus
tin56
543
644,
802
620
37.4
27,4
8816
.073
.311
.0
Birm
ingh
am51
1,46
765
7,82
759
1-3
.025
,858
16.0
64.2
35.1
Hac
kens
ack
4916
184
5,18
93,
565
-2.4
49,2
493.
987
.04.
9
* A
ll da
ta a
re fr
om th
e C
ity a
nd C
ount
y D
ata
Boo
k, 1
997 .
**
Cas
e pr
oces
sing
tim
e is
mea
sure
d fr
om in
dict
men
t or
bind
over
to d
ispo
sitio
n.

WHAT DO THE NINE CRIMINAL COURT SYSTEMS LOOK LIKE ? • 21
(Austin), and Sacramento Co., California (Sacramento), represent rapidly grow-ing cities; both grew in population by more than 32 percent during the 1980s.Hamilton Co., Ohio (Cincinnati), and Hackensack, conversely, experienced a de-cline in population during the 1980s.
On measures of wealth, Hackensack has the highest median household in-come ($49,249) and the lowest poverty rate (3.9 percent).19 Jefferson Co., Ala-bama (Birmingham), and Austin have the highest poverty rates (16 percent each),but Albuquerque has the lowest income per capita ($17,518). Oakland and Aus-tin exhibit the greatest racial diversity, while Hackensack and Kent Co., Michi-gan (Grand Rapids), are the least diverse, with Caucasians comprising at least 86percent of the population. Violent crime rates also vary remarkably, ranging from161 per 100,000 population in Hackensack to 1,467 per 100,000 population in Bir-mingham and 1,464 per 100,000 population in Multnomah Co., Oregon (Portland).20
Felony Caseload CharacteristicsFelony caseloads in urban jurisdictions vary in seriousness and complexity.
Both researchers and practitioners agree that numerous case- and defendant-levelcharacteristics influence both the workload and the quality of case processing.Four categories of factors are distinguished when investigating these claims: theseverity of the charge at indictment, procedural aspects, defendant resources, andthe manner of case resolution. This section reviews the received tradition on howcase and defendant characteristics in each category are thought to complicate theadjudication process and contribute to a particular pace of litigation.
Severity of the charge at indictment. Many practitioners have asserted thatthe composition of a court’s caseload is a primary determinant of case processingtime. Composition may matter if certain types of cases (e.g., most violent felo-nies) are inherently more complex (e.g., more motions, more trials, more atten-tion to victims and witnesses) and thereby require more court time and attentionto resolve than other felony cases. In addition, judges and prosecutors may be-lieve that more serious cases deserve more time and attention from the court andmay establish explicit or implicit priorities to meet that goal. For example, estab-lishing a special court to expedite drug cases may leave other judges in the court
19 The income level, however, is undoubtedly offset to some extent by the relatively high cost ofliving in the New York City area.20 For a more detailed description of the felony adjudication process in each jurisdiction, seeAppendix 2.

22 • EFFICIENCY, TIMELINESS, AND QUALITY: A NEW PERSPECTIVE
Figure 2.4
What Do the Cases Look Like?
Composition of Felony Caseloads
Most Serious Offense Charged in Indictment/Information
Case Type
Most Other Burglary Drug Sale Other Number of Violent 1 Violent 2 & Theft & Possession Felonies 3 Sample Cases
Overall 6.2% 16.8% 31.5% 34.2% 11.4% 3,779
Faster CourtsCincinnati 4.3 12.8 27.8 40.2 14.8 485
Grand Rapids 5.0 14.5 44.9 18.8 16.8 463
Portland 4.6 12.7 23.5 53.4 5.7 455
Moderate Courts
Oakland 8.4 22.8 14.4 45.3 9.1 417
Sacramento 11.5 26.5 18.0 32.0 12.0 200
Albuquerque 5.3 25.9 39.5 18.1 11.2 375
Slower Courts
Austin 7.0 17.2 35.9 28.3 11.6 499
Birmingham 7.1 11.1 36.2 38.7 6.9 478
Hackensack 5.2 15.2 35.1 29.7 14.7 407
1 Most violent crimes include capital murder, homicide, and rape.2 Other violent crimes include robbery, assault, kidnapping, manslaughter, and child abuse.3 Other felonies include weapons possession, DWI, destruction of property, and escape.

WHAT DO THE NINE CRIMINAL COURT SYSTEMS LOOK LIKE ? • 23
with more time to devote to resolving more serious, violent cases. Finally, be-cause the expected sentence is typically longer for more serious crimes, defen-dants may wish to put off the day of reckoning and, perhaps, realize a lowersubjective probability of conviction through delay.
The research literature, however, is mixed in its findings. In the four courtshe examined, Church (1982) found that more serious cases took more time toresolve. Hausner and Seidel (1979) reached a similar result in their study of caseprocessing in the District of Columbia. In contrast, Neubauer and Ryan (1982),Luskin and Luskin (1987), and Flemming, Nardullli, and Eisenstein (1987) foundthat the seriousness of the offense had a weak relationship to case processing time.
Our initial results are also mixed. As shown in Figure 2.2, almost all of thenine courts take longer to adjudicate murder and rape cases than the other lessserious case types. One might expect, then, that courts with a larger proportion ofviolent crimes would have somewhat longer overall case processing times thancourts with a smaller proportion of violent crimes in their caseload. This result isnot apparent from examining Figure 2.4, which illustrates the similarities anddifferences among the nine courts in the proportion of most violent crimes; otherviolent crimes against the person; drug cases; burglary and theft cases; and otherfelony crimes that were concluded in 1995. (The specific offenses that make upeach of the five general categories of offenses are indicated in the figure.) Thethree faster courts had the smallest proportions of violent cases (19.5 percent orless) among the nine counties. However, violent crimes also accounted for 20percent or less of the caseload in Hackensack and Birmingham, which are thetwo slowest courts.
In addition, the proportion of drug cases varies across the nine courts.Portland (53 percent) has almost three times the proportion of drug cases aseither Grand Rapids (19 percent) or Albuquerque (18 percent). As with vio-lent crimes, there is no clear pattern between these percentages and the waythe courts rank on case processing speed. There is also a notable range in thepercentage of burglary and theft cases (from 14 to 45 percent). But again,these differences are not related systematically with case processing times inthese courts. (See Figure 2.4.)
One possible interpretation is that almost all courts give more time and atten-tion to violent crimes, but are less consistent in their treatment of other offenses.The lack of a clear relationship between caseload composition and case process-ing time may reflect explicit court practices and priorities. Some have noted thatcourts exercise some control over their case composition; it is not necessarily

24 • EFFICIENCY, TIMELINESS, AND QUALITY: A NEW PERSPECTIVE
BenchReduced warrant Prior Privatelycategory Weapons Multiple for failure felony On retained
of offense charge defendants to appear convictions bond attorneys
Overall 27% 14% 25% 21% 43% 64% 25%
Faster Courts
Cincinnati 8 12 19 16 75 67 20
Grand Rapids 40 12 22 8 40 69 15
Portland 25 5 23 28 48 69 9
Moderate Courts
Oakland 27 26 27 13 55 34 18
Sacramento 31 21 47 27 28 66 13
Albuquerque 38 19 27 16 43 74 29
Slower Courts
Austin 34 12 16 34 30 69 34
Birmingham 23 13 23 24 30 49 41
Hackensack 17 16 34 25 28 81 47
Figure 2.5
What Recognizable Case- and Defendant-RelatedCharacteristics Are Present?
Percent of Cases or Defendants With These Characteristics

WHAT DO THE NINE CRIMINAL COURT SYSTEMS LOOK LIKE ? • 25
thrust on individual judges and attorneys from the outside world.21 For example,the highest proportion of violent criminal cases is 38 percent in Sacramento. InSacramento, the system is structured to focus intense effort on obtaining guiltypleas prior to the preliminary hearing in the municipal court. This system sub-stantially reduces the number of less serious (nonviolent) cases that are boundover to the superior court for trial, thus producing a relatively high percentage ofviolent cases in the superior court caseload. Another way that a court can affectits case composition is by processing one type of case in a highly efficient man-ner. For example, the largest proportion of drug cases is in Portland, where aneffective drug court processes over 50 percent of the caseload with only 10 per-cent of the judicial resources. As a consequence, Portland was able to not onlyprosecute more drug cases, but also make the timely processing of its remaining,relatively more serious caseload a priority and a reality. Portland used the judicialresources that were “freed up” by the drug court to maintain firm trial dates,accommodate a higher trial rate, and move cases to disposition relatively quickly.These two examples illuminate two points. First, courts can and do set priorities forthe processing of different types of cases. Second, establishing priorities can affectboth the composition of cases handled and the time allocated to each type of case.
Procedural aspects. Particular crime and defendant characteristics are be-lieved to increase the procedural complexity of cases and be associated withlengthier time to disposition. For example, a substantial majority of states im-pose a mandatory sentence enhancement for cases in which offenders use weap-ons in committing crimes. Some observers expect that these mandatory sentenceenhancements raise the stakes for defendants, so they may be less likely to pleadguilty or at least delay a final disposition longer in an effort to avoid the enhance-ment. Figure 2.5 shows that from 5 percent to 26 percent of felony cases involveweapons charges. But most courts are considerably similar in this respect. Inseven of the nine courts, the percentage of cases involving weapons charges fallswithin 12 to 21 percent. Overall, there is no apparent relationship between therespective percentages and the corresponding court case processing times.
Cases with multiple defendants can be more complex because they requireseparate criminal defense counsel and, as a consequence, have greater potentialfor problems with scheduling and coordination.22 Extra time also might be re-
21 Neubauer and Ryan (1982).22 Luskin and Luskin (1987); Neubauer and Ryan (1982); Wice (1978).

26 • EFFICIENCY, TIMELINESS, AND QUALITY: A NEW PERSPECTIVE
quired to get one or more defendants to testify against the other. Figure 2.5 indi-cates that from 16 to 47 percent of the nine courts’ cases involved multiple defen-dants, but in six of the nine courts the percentage is between 22 and 34 percent.Again, there is no visible connection seen between these numbers and case pro-cessing times in the nine courts.
Most states have some type of sentence enhancement for offenders with priorfelony convictions, especially those involved in violent or drug crimes. Theseenhancements, like those for the use of a weapon, raise the stakes for defendantsand may make them less inclined to plead guilty or to do so early in the process.23
Figure 2.5 suggests that between 28 and 75 percent of felony cases involveddefendants with prior felony convictions. Interestingly, the four fastest courtshad higher percentages of defendants with prior felony convictions than the fourslowest courts. This finding is counterintuitive, but interviews in some sites sug-gested that prosecutors viewed these types of sentence enhancements as anothertype of “hammer” that they can use in plea negotiations. For example, defendantsfacing a habitual offender sentence enhancement may be induced to plead guiltyto the underlying charge sooner (and probably at the maximum sentence for thecurrent charge) if the prosecutor offers to waive the repeat offender enhancement.
Charge reduction rates also might affect felony case processing. Some pros-ecutors might “charge high” in some or many cases with the expectation that theywill negotiate a guilty plea to a lesser (but more realistic) charge. Other prosecu-tors interviewed in this study suggested that having something to “offer” the de-fendant (e.g., reducing a charge or dropping one or more charges) often facili-tates the plea negotiations. Figure 2.5 shows that the percentage of cases involv-ing reductions in the type of charge (i.e., the most serious charge at convictionwas of a less serious type than the one in the indictment or information) rangedfrom 8 to 40 percent. Most courts are quite similar on this point. In seven of thecourts, the percentage falls between 17 and 38 percent and the variations on thisissue do not appear to be related to case processing times.
Criminal defendant resources. Researchers and practitioners alike often as-sert that two economic characteristics of the defendant are associated with caseprocessing time: bail status and the type of criminal defense attorney. Defendantswho can afford to make bond may gain some strategic advantage through delay24
23 Luskin and Luskin (1987); Flemming, Nardulli, and Eisenstein (1987).24 Luskin and Luskin (1987); Nimmer (1978); Nardulli, Eisenstein, and Flemming (1988).
WHAT DO THE NINE CRIMINAL COURT SYSTEMS LOOK LIKE ? • 27
because state laws usually require courts and prosecutors to bring cases to trialmore quickly if the defendant is held in custody before trial. This requirementcan complicate the adjudication process to some extent.25 Courts with a largerproportion of defendants held in custody may exert more pressure on defendantsto plead guilty than courts in which a larger proportion of defendants are out ofcustody.26 Conversely, detained defendants are likely to be accused of more seri-ous offenses. These cases are more likely to go to trial and, therefore, take longerto resolve. Figure 2.5, however, shows substantial similarity among the courts.Six of them detain 26 to 34 percent of defendants in custody before disposition,though the range is from 19 to 66 percent. Again, there is little or no relationshipseen between the proportion of defendants in custody and upper-court case pro-cessing times.
The proportion of cases handled by court-appointed attorneys might influ-ence the overall pace of litigation. Cases handled by public defenders might movemore swiftly because public defenders’ offices are generally systematic in theirassignments and handling of cases and have a clear understanding of court opera-tions.27 Privately retained attorneys, on the other hand, may not be regular mem-bers of the local courtroom work groups, so they might not be as knowledgeableabout “going rates” for sentences and other nuances of the social relationshipswithin the court community.28 Defendants who can afford privately retained at-torneys also might have economic resources to file more motions and contestevery significant piece of evidence through pretrial motions. Furthermore, out ofconsideration for the privately retained attorneys, judges may postpone disposi-tion in some cases until the attorney has been paid.29 Thus, there is a reasonablebasis for expecting that courts with a larger proportion of cases involving pri-vately retained attorneys will have longer overall case processing times. Figure2.5 supports this notion. The four slowest courts had the largest percentages ofcases with privately retained attorneys (29 to 47 percent, versus 9 to 20 percentamong the five fastest courts). This finding supports the contention that, in gen-eral, privately retained attorneys contribute to longer case processing times infelony adjudication.
25 Neubauer and Ryan (1982).26 Casper (1972).27 Hanson, Ostrom, et al. (1992); Hanson, Ostrom, and Jones (1998).28 Eisenstein and Jacob (1977).29 Banfield and Anderson (1968); Eisenstein and Jacob (1977); Nimmer (1978).

28 • EFFICIENCY, TIMELINESS, AND QUALITY: A NEW PERSPECTIVE
Figure 2.6
How Are Cases Resolved?
Disposition Type
Guilty Plea Trial Dismissed Deferred
Overall 78.9% 5.2% 12.1% 3.8%
Faster Courts
Cincinnati 88.4 7.2 3.2 1.3
Grand Rapids 83.5 3.9 11.4 1.1
Portland 73.2 11.5 12.3 3.1
Moderate Courts
Oakland 83.6 3.6 7.0 4.3
Sacramento 81.5 4.5 10.5 1.5
Albuquerque 73.5 1.9 22.7 2.4
Slower Courts
Austin 64.8 2.6 15.4 17.2
Birmingham 82.8 5.7 11.5 0
Hackensack 87.5 5.4 5.9 0.7
Average Time (Days) to Disposition
Guilty Plea Trial Dismissed Deferred
Overall 161 272 284 268
Faster Courts
Cincinnati 93 143 98 101
Grand Rapids 100 272 283 247
Portland 147 237 241 533
Moderate Courts
Oakland 162 237 157 314
Sacramento 151 166 246 228
Albuquerque 169 184 264 145
Slower Courts
Austin 206 194 244 266
Birmingham 228 450 566
Hackensack 198 315 298 230

WHAT DO THE NINE CRIMINAL COURT SYSTEMS LOOK LIKE ? • 29
Courts also differ in the extent to which they experience problems with de-fendants failing to appear for scheduled hearings. Courts with a more substantialproblem in this area are likely to experience problems related to scheduling hear-ing and trial dates, so delays could be more common.30 In this study, from 8 to 34percent of the cases in the nine jurisdictions involved bench warrants for failureto appear. The three slowest courts had 24 percent or more cases with benchwarrants, but only one of the three fastest courts had bench warrants issued in 20percent or more of its cases. This factor appears to be weakly connected to over-all case processing times.
Manner of case resolution. Judges typically spend a substantial portion oftheir time conducting trials. As the trial rate increases in a court, the length oftime to reach trial is likely to increase unless the court can shorten the averagetrial time or reduce the amount of time judges spend on other activities. The timefrom filing to trial also can affect the average disposition time for cases disposedby other methods. If a court is not realistic and firm in the scheduling of trials,many cases will end in a guilty plea only when the actual occurrence of a trial, asopposed to its scheduling, is imminent. Conventional wisdom suggests that highertrial rates, especially jury trial rates, will be associated with longer overall caseprocessing times.31 Figure 2.6 indicates that two of the fastest courts, Cincinnatiand Portland, have the highest jury trial rates (7.2 percent and 11.5 percent, re-spectively), while the two slowest courts, Hackensack and Birmingham, have thenext highest jury trial rates (5.4 and 5.7 percent, respectively). Higher jury trialrates do not necessarily lead to slower case processing times.
Figure 2.6 also shows that six of the courts have similar guilty plea rates,from 80 to 90 percent. Two courts have guilty plea rates around 75 percent. Tothe extent that there are differences in guilty plea rates, these differences are notassociated with differences in overall case processing times.
C Management Strategies: Characteristics of the Court, Prosecutor’sOffice, and Indigent Defense Program
The court administration literature naturally emphasizes the importance of courtorganization and case management for achieving efficient and effective case pro-
30 Luskin and Luskin (1987).31 Nimmer (1978); Luskin and Luskin (1987); Neubauer and Ryan (1982).

30 • EFFICIENCY, TIMELINESS, AND QUALITY: A NEW PERSPECTIVE
PrimaryCriminal Felony Felony PrimaryCourt Charging Judges’ Calendar State’s GoalsStructure Procedure Docket Type System for Felony CPT
Faster CourtsCincinnati Two-tiered Grand jury Combined Individual Arraignment on
docket (felony indictment to& civil) disposition: 100%
in 180 days
Portland Two-tiered Grand jury Felony only Master hybrid 1st appearanceto disposition: 90% in90 days; 98% in 180days; 100% in 1 year
Grand Rapids Two-tiered Preliminary Felony only Individual 1st appearance tohearing and prelim. hearing: 100%bindover in 12 days. Bindover
to disposition: 90% in91 days; 98% in 154days; 100% in 10 mos.
Moderate CourtsOakland Two-tiered Preliminary Felony only Master hybrid 1st appearance to
hearing and prelim. hearing: 100%bindover in 90 days.1st appear-
ance to disposition:100% in 1 year
Sacramento Unified Preliminary Felony only Master 1st appearance tohearing and prelim. hearing: 100%bindover in 90 days.1st appear-
ance to disposition:100% in 1 year
Albuquerque Two-tiered Grand jury Felony only Individual None
Slower CourtsAustin Two-tiered Grand jury Felony only Individual Complaint to
announcement of trialreadiness by state:120 days
Birmingham Two-tiered Grand jury Felony only Individual 1st appearance todisposition: 90% in 9mos; 100% in 1 year
Hackensack Two-tiered Grand jury Felony only Individual Indictment to disposi-tion: 100% in 120 days
* In the general jurisdiction court.
Figure 2.7
What Do the Nine Courts Look Like?*

WHAT DO THE NINE CRIMINAL COURT SYSTEMS LOOK LIKE ? • 31
cessing.32 Although this is a commonsense position, simple categories of organi-zation (e.g., unified vs. multi-tiered courts) or management strategies (e.g., indi-vidual vs. master calendars) seldom explain much variation in case processingtimes among criminal courts.33 Nevertheless, these beliefs remain strong in theminds of many practitioners, so a review of the case management strategies andresources in the nine courts is an important step in this analysis.
Court Structure and Case Management ProceduresFigure 2.7 shows data on general jurisdiction trial court structure and felony
case management characteristics in each county. (For more information on thecase management system in each jurisdiction, see Appendix 2.) The courts differin whether they use a grand jury or a preliminary hearing before a judge to deter-mine whether there is probable cause for charging a felony. Six of the courts inthis study use a grand jury process, and four of these (Albuquerque, Austin,Hackensack, and Birmingham) are the slowest courts in this study. Yet, the grandjury process occurs before a felony case reaches the general jurisdiction trialcourt, so using a grand jury cannot fully account for long case processing times.Furthermore, Cincinnati and Portland also use a grand jury, and they are the twofastest courts on virtually all measures of case processing time at both the pre-indictment and post-indictment stages.
Courts often structure their case assignment and calendar systems with aneye toward improving case management efficiency. Most large urban courts, in-cluding eight of the nine in this study, have developed specialized felony docketswhereby they designate specific judges to handle only felony cases for a periodof time. However, more variation exists in the type of calendar system used bycourts. In an individual calendar system, a court manager or administrative judgetypically assigns felony cases (in some random fashion) to an individual judgesoon after the bindover or indictment. The assigned judge handles all motions orother proceedings until the case is concluded. Conversely, in a master calendarsystem, different judges may handle the arraignment, motions, and trial, depend-ing on who is assigned to handle those duties and who is available on the sched-uled date. Much has been written about the pros and cons of individual and mas-ter calendars.34 The choice of a calendar system involves weighing the compet-
32 Zeisel (1959); Friesen, Jordan, and Sulmonetti (1978); Solomon and Somerlot (1987).33 Luskin and Luskin (1987); Flemming, Nardulli, and Eisenstein (1987).34 Luskin and Luskin (1987).

32 • EFFICIENCY, TIMELINESS, AND QUALITY: A NEW PERSPECTIVE
35 Flemming, Nardulli, and Eisenstein (1992).36 Goerdt et al. (1991); Flemming, Nardulli, and Eisenstein (1987).37 Goerdt et al. (1991).38 Friesen (1984); Solomon and Somerlot (1987); Mahoney et al. (1988).39 Commission on Trial Court Performance Standards (1990).40 Melcher (1984); ABA (1987); Solomon and Somerlot (1987); Mahoney et al. (1988); Mahoneyand Sipes (1985).
ing values of equity, efficiency, and accountability.35 Judges perceive individualcalendars as fair because each judge receives the same number of cases. Mastercalendars may be more efficient because they supposedly maximize the use ofavailable judges’ time. However, it is also true that judges who work more quicklyor efficiently than others receive more cases, which might have the appearance ofinequity to some efficient judges. Previous research in 39 large urban courts,however, found no correlation between calendar type and felony case processingtimes.36 Indeed, as shown in Figure 2.7, calendar type shows no association withcase processing times.
There is some evidence from the study of large urban courts, however, thatfirm trial dates and early resolution of pretrial motions affect how long it takes toresolve felony cases.37 This finding supports central tenets of the proponents ofcase management.38 However, the basis for concluding that firm trial dates andearly resolution of motions are effective ways to reduce case processing time islimited because the effects of competing factors were not screened out by the useof appropriate statistical analysis. Rival explanations were controlled for one at atime rather than simultaneously, and the most likely counterexplanation (i.e., sizeof the pending caseload per judge) was not taken into account. Hence, explana-tions of variation in court processing times await firmer evidence.
In part because of the lack of a clear relationship between these organiza-tional and procedural factors and the pace of adjudication, courts and profes-sional organizations have begun to focus more on court performance than onstructure and procedures.39 In other words, courts should be given performancestandards and goals and then should be allowed to determine the organizationaland procedural features that help them achieve the standards or goals. As indi-cated in Chapter 1, the ABA and other major professional organizations in thelegal community have advocated adoption of disposition time goals as a manage-ment tool to inspire improved court performance and reduce delays.40 Given theconstitutional right to a speedy trial in criminal cases, every state has a rule or law

WHAT DO THE NINE CRIMINAL COURT SYSTEMS LOOK LIKE ? • 33
that requires courts to provide a trial for a felony defendant within a stated periodof time. But only a small percentage of cases actually go to trial, and many defen-dants, especially those who are out of custody prior to trial, waive their right to aspeedy trial. Because speedy trial laws do not necessarily prohibit substantialdelays in felony adjudication, time standards that are applicable to all criminalcases would appear to be desirable.
Figure 2.7 displays the state’s disposition time goals for all felony cases ineight jurisdictions (New Mexico does not have overall disposition time goals forfelony cases other than its speedy trial rule). On closer examination, New Jersey(Hackensack) and Texas (Austin) seem to have the most stringent goals: 100percent of felony cases should be concluded within 120 days after indictment (inNew Jersey) or filing of a complaint (in Texas). Hackensack and Austin, how-ever, are among the three slowest courts in this study and do not come close tomeeting established goals. Ohio (Cincinnati) also has stringent goals: all felonycases should be disposed within 180 days after arraignment on the indictment.Among the states represented in this study, only Oregon (Portland) has adoptedthe ABA’s disposition time standards without modification. Michigan (GrandRapids) also has very strict goals for processing felony cases in the lower court:100 percent should move from first appearance to preliminary hearing in 12 days.Michigan’s standards for the trial court are also quite demanding: 98 percentshould be disposed within 154 days after bindover and 100 percent within tenmonths. Given that Hackensack and Austin arguably have the most stringent dis-position time goals but some of the longest case processing times in this study,the mere adoption of disposition time goals is not enough to achieve expeditiouscase processing times.
Prosecutors’ Case Management StrategiesProsecutors are the gatekeepers of the local criminal justice system. Through
their discretion to charge and to negotiate guilty pleas, they have the capacity toaffect the volume, nature, and pace of felony litigation. As elected officials inmost states, chief prosecutors can also claim a public mandate for their policies,which enhances their power and authority.41 Figure 2.8 shows information onsome key elements of the prosecutors’ case management systems in this study.
41 In five states, prosecutors are appointed through either the governor’s or the attorney general’soffice. Hackensack is in one of the five appointment states.

34 • EFFICIENCY, TIMELINESS, AND QUALITY: A NEW PERSPECTIVE
Prosecutor Screening Plea Offer Caseof Felony Cases Authority Assignments
Faster Courts
Cincinnati A chief assistant DA screens DA Supervisors Horizontalcases before grand jury and vertical
Portland Handled by one DA within DA Supervisors Horizontalappropriate unit
Grand Rapids Handled by two DAs: one DA assigned to case Horizontalexperienced and one inexperienced and vertical
Moderate Courts
Oakland Handled by experienced attorneys DA Supervisors Horizontalwith trial experience and vertical
Sacramento Handled by experienced DAs DA Supervisors Horizontalwith trial experience and vertical
Albuquerque Experienced DAs DA Supervisors Horizontaland vertical
Slower Courts
Austin Four ADAs handle regular felonies; ADA assigned to case Horizontaltwo ADAs handle family cases
Birmingham Four DAs screen cases and one DA DA Supervisors Horizontalsupervises; positions are rotated and verticalevery 12-18 months
Hackensack Handled by three DAs, one with DA Supervisors Horizontalextensive experience and vertical
Figure 2.8
What Do the Prosecutors’ Offices Look Like?

WHAT DO THE NINE CRIMINAL COURT SYSTEMS LOOK LIKE ? • 35
Most informed observers and researchers assert that having experienced pros-ecutors screen cases and charge is critical to efficient and effective case manage-ment.42 This practice has become such a fundamental principle of case manage-ment for prosecutors that all of the prosecutors’ offices in this study use at leastone experienced prosecutor to conduct screening and charging activities.
Allowing individual, assistant prosecutors to negotiate the terms of a pleaagreement is another means for expediting felony adjudication. Of course, allow-ing individual prosecutors to negotiate guilty pleas introduces greater opportuni-ties for disparities among attorneys in the way they negotiate pleas. Most juris-dictions have resolved this conflict between efficiency and equal treatment ofcases by assigning the responsibility for determining the terms of a plea agree-ment to one or more supervisors among the prosecutors. This strategy reducesthe possibility of unequal treatment while achieving some degree of improvedefficiency because at least the chief prosecutor does not have to make the deter-mination in every case. In this study, seven prosecutors’ offices assign the re-sponsibility to determine the terms of plea agreements to one or more supervi-sors. Only in Grand Rapids and Austin are assistant district attorneys assigned tocases allowed to negotiate pleas without prior approval by a supervisor.
Most prosecutors’ offices in urban communities use a horizontal assignmentsystem to manage their caseloads. In a horizontal assignment system, one or moreteams handle all pre-indictment matters in the lower court while another team (orteams) handles all post-indictment trials through sentencing. Prosecutors in allnine courts use horizontal assignments (see Figure 2.8). In some courts, prosecu-tors also use a vertical assignment system for special case types. For example, ateam of prosecutors will handle all capital murder cases or all rape or child sexualabuse cases from the first appearance in the lower court through sentencing in thetrial court. Six jurisdictions in this study use a combination of vertical and hori-zontal assignment systems.43
42 Jacoby (1976); Mahoney and Sipes (1985).43 This examination of prosecutors’ case management procedures reveals no noticeable relationshipbetween these procedures and overall case processing times. One reason for the lack of any observ-able relationship is the absence of variation in the procedures prosecutors use to screen and assigncases. Clearly, the nature of the screening and plea bargaining policies, the way these policies areapplied in practice, and the qualities and skills of the attorneys involved in the plea negotiationprocess are more important to the pace of litigation than who has authority to determine charges andplea offers or what type of assignment system is used.

36 • EFFICIENCY, TIMELINESS, AND QUALITY: A NEW PERSPECTIVE
Percent of all felonydispositions handled Types of indigentby indigent defenders* defense structures Case assignment
Faster Courts
Cincinnati 80% Assigned counsel: 100% Vertical
Portland 91 PD: 57%; contract attorneys: 38% Vertical
Grand Rapids 85 PD: 55%; contract attorneys: 45% Vertical
Moderate Courts
Oakland 82 PD: 89%; assigned attorneys: 11% Vertical
Sacramento 87 PD: 95%; assigned attorneys: 5% Vertical
Albuquerque 72 PD: 90%; assigned attorneys: 10% Vertical
Slower Courts
Austin 66 Assigned attorneys: 100% Vertical
Birmingham 59 Assigned attorneys: 100% Vertical
Hackensack 53 PD: 90%; assigned attorneys: 10% Vertical
* Statistics obtained from the case samples examined in this study include all cases handled by assignedcounsel, contract defenders, and full-time public defender offices.
Figure 2.9
What Do the Indigent Defense Programs Look Like?

WHAT DO THE NINE CRIMINAL COURT SYSTEMS LOOK LIKE ? • 37
Indigent Defense Program Case Management StrategiesA full-time public defender’s office can contribute to greater efficiency in
case processing by more effectively coordinating the training and supervision ofnew defense attorneys, sharing information among public defenders, and coordi-nating assignments and scheduling. On the other hand, defense attorneys mightimpede efforts to improve timeliness through their power to file motions or theirrefusal to cooperate in special programs or projects. Public defender offices canalso complicate the case management process by using a case assignment systemthat increases the likelihood of scheduling conflicts.
Figure 2.9 provides basic information on some of the key aspects of the indi-gent defense programs in the nine courts. First, it is clear that the courts varysignificantly in the percentage of felony cases that are handled by publicly ap-pointed attorneys, from just 53 percent in Hackensack to 91 percent in Portland.Notably, the four slowest courts had the smallest percentages of cases handled bypublicly appointed attorneys, producing a substantial association between a lowerpercentage of cases with publicly appointed attorneys and longer overall caseprocessing times.44
How does each court provide legal services to indigent defendants? Thereare three basic models for indigent defense services. Many courts establish apublic defender’s office with full-time attorneys on staff. Some courts use “con-tract attorney” systems in which a private law firm or group of lawyers provideindigent defense services to a preestablished number of offenders for a fixedprice. Many courts, however, simply assign cases with indigent defendants toprivate lawyers who volunteer to be on the “assigned counsel list.” These law-yers are paid an hourly fee or a flat fee per case, depending on the type of caseand the payment system operating in the court. Some courts use a combination ofpublic defender and contract attorney systems. Even where public defenders orcontract attorneys are used, however, some percentage of the cases will still beassigned to other attorneys to cover cases with multiple defendants (because ofconflicts of interest). Figure 2.9 shows that three courts rely solely on an assignedcounsel list; two of these jurisdictions (Austin and Birmingham) are among thethree slowest courts. But Cincinnati, the fastest court in the study, also employsan assigned counsel list program to handle all of its felony cases with indigent
44 Note the data on this issue in Figure 2.9 are the inverse of the data in Figure 2.5 for percentageof defendants with privately retained attorneys.
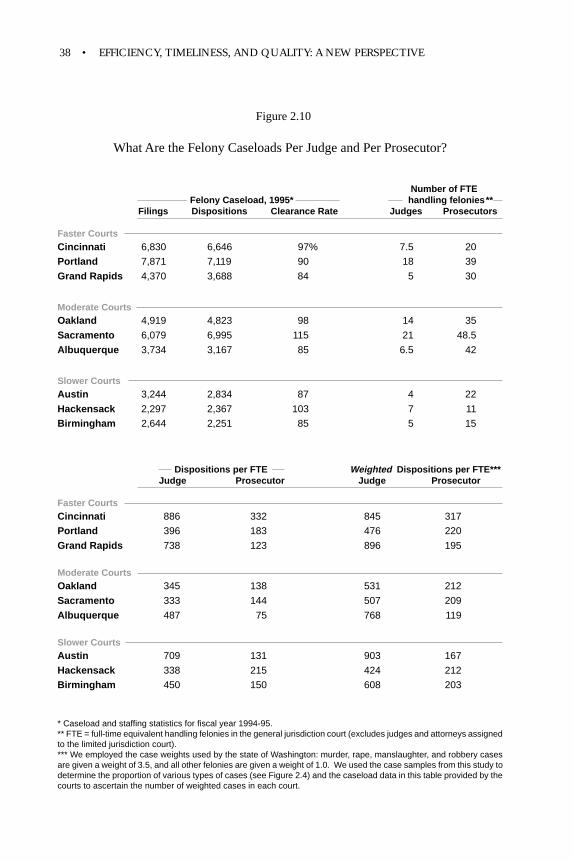
38 • EFFICIENCY, TIMELINESS, AND QUALITY: A NEW PERSPECTIVE
Figure 2.10
What Are the Felony Caseloads Per Judge and Per Prosecutor?
Number of FTE Felony Caseload, 1995* handling felonies**Filings Dispositions Clearance Rate Judges Prosecutors
Faster CourtsCincinnati 6,830 6,646 97% 7.5 20
Portland 7,871 7,119 90 18 39
Grand Rapids 4,370 3,688 84 5 30
Moderate CourtsOakland 4,919 4,823 98 14 35
Sacramento 6,079 6,995 115 21 48.5
Albuquerque 3,734 3,167 85 6.5 42
Slower CourtsAustin 3,244 2,834 87 4 22
Hackensack 2,297 2,367 103 7 11
Birmingham 2,644 2,251 85 5 15
Dispositions per FTE Weighted Dispositions per FTE*** Judge Prosecutor Judge Prosecutor
Faster CourtsCincinnati 886 332 845 317
Portland 396 183 476 220
Grand Rapids 738 123 896 195
Moderate CourtsOakland 345 138 531 212
Sacramento 333 144 507 209
Albuquerque 487 75 768 119
Slower CourtsAustin 709 131 903 167
Hackensack 338 215 424 212
Birmingham 450 150 608 203
* Caseload and staffing statistics for fiscal year 1994-95.** FTE = full-time equivalent handling felonies in the general jurisdiction court (excludes judges and attorneys assignedto the limited jurisdiction court).*** We employed the case weights used by the state of Washington: murder, rape, manslaughter, and robbery casesare given a weight of 3.5, and all other felonies are given a weight of 1.0. We used the case samples from this study todetermine the proportion of various types of cases (see Figure 2.4) and the caseload data in this table provided by thecourts to ascertain the number of weighted cases in each court.

WHAT DO THE NINE CRIMINAL COURT SYSTEMS LOOK LIKE ? • 39
defendants. Portland and Grand Rapids, two of the fastest courts, use a combina-tion of public defenders and contract attorneys. In general, there is no apparentrelationship between the type of indigent defense program and the overall paceof litigation.
Finally, indigent defense programs, like the prosecutor’s office, could handlecases horizontally (different attorneys at the pre-indictment and post-indictmentstages) or vertically (the same attorney from start to finish). Most publicly paiddefense attorneys believe that establishing a relationship with the client is criticalto effective representation. Many offenders mistrust public defenders and viewthem as part of the system that is trying to put them in prison. Defense attorneys,therefore, argue that vertical representation is essential to effective representa-tion. All nine jurisdictions in this study place defense attorneys on a vertical as-signment system for all felony cases, although there are jurisdictions where pub-lic defender offices handle at least some felony cases in a horizontal manner.
C Court, Prosecutor, and Indigent Defender Resources
Court and Prosecutor CaseloadsProbably no other factors seem so clearly connected to the pace of litigation
as judge and attorney workload. Most judges, prosecutors, and defense attorneysbelieve they are working hard already and will point to caseload size as a primarycause of delay in felony adjudication. However, numerous multiple-jurisdictionstudies in urban courts have found that there is no correlation between filings ordispositions per judge and overall case processing times.45 Figure 2.10 displaysinformation on the filings and dispositions in each jurisdiction and the number offull-time equivalent (FTE) judges and prosecutors who handled felony cases inthe general jurisdiction court. As one would expect, there is substantial variationin the number of dispositions per judge and per prosecutor, but these figures donot exhibit a connection with overall case processing times.
One of the problems with previous studies, however, is that filings or dispo-sitions per judge (or attorney) may be a good measure of “caseload” but not agood measure of “workload.” This study has attempted to address this concernby adjusting the caseload statistics from each court to produce a measure of the
45 Nimmer (1976); Flanders (1977); Church, Carlson, et al. (1978); Mahoney et al. (1988); Goerdtet al. (1991).

40 • EFFICIENCY, TIMELINESS, AND QUALITY: A NEW PERSPECTIVE
“weighted caseload” in each jurisdiction. Most weighted caseload studies indi-cate that serious violent offenses require much more judge and attorney time thanother, more typical cases. These cases are given “weights” to reflect the relativeamount of judicial resources required to adjudicate them. Several states havedeveloped weighted caseload systems to help them determine their needs for newjudgeships.46 In Figure 2.10, we have used the weighting system adopted by thestate of Washington, which gives a weight of 3.5 to all serious violent offensesand a weight of 1.0 to all others. Using the case samples obtained for this study toestimate the percentage of serious violent cases among the dispositions in eachjurisdiction, we applied this weighting scheme to the data to obtain statistics onthe number of weighted dispositions per judge and per prosecutor. Wide varia-tion exists in the number of weighted dispositions per judge, from a low of 424 inHackensack to more than twice that number in Grand Rapids (896) and Cincin-nati (845). Cincinnati also has the largest number of weighted dispositions perattorney (317), which is more than 2.5 times the figure for Albuquerque (119).
One would expect that weighting these caseload figures would help revealan association between caseload per judge or prosecutor and overall case pro-cessing time. Surprisingly, there is no obvious association between weighted dis-positions per judge and overall case processing times. There is a moderate rela-tionship, however, between the number of weighted dispositions per prosecutorand upper-court case processing times. Faster overall case processing times tendto exist where there is a larger number of weighted felony dispositions per pros-ecutor. The number of weighted dispositions per prosecutor (and per judge) is ameasure of system productivity, so jurisdictions that move cases more quicklyprobably should manifest a larger number of dispositions per prosecutor. The factthat the number of weighted dispositions per judge is not associated with overallcase processing times may indicate that prosecutors’ policies, practices, and levelof efficiency may be more important to explaining the pace of litigation than theweighted caseload of judges.
Prosecutors’ and Public Defenders’ Salaries and TenureMost observers expect that better salaries attract higher-caliber attorneys and
that greater experience contributes to greater effectiveness. Some observers alsocontend that prosecutors tend to receive higher salaries to attract and retain better
46 Flango and Ostrom (1996).

WHAT DO THE NINE CRIMINAL COURT SYSTEMS LOOK LIKE ? • 41
attorneys, thus enhancing their advantage over public defenders.Figure 2.11 displays information on the salaries and average tenure of attor-
neys employed by the full-time public defenders’ offices in six of the courts inthis study. These salary figures are not adjusted for differences in the cost ofliving among the jurisdictions, so it is difficult to evaluate or critique the levels ofcompensation among the various jurisdictions.
Entry-level salaries for public defenders in Oakland and Sacramento are abouttwice the level that similar public defenders receive in Portland and Grand Rap-ids ($52,000 vs. $27,000). Even at the upper levels of experience, Portland andGrand Rapids retain the lowest average salaries for public defenders while Sacra-mento and Oakland maintain average public defender salaries that are substan-tially higher than those in the other jurisdictions. Oakland and Sacramento pros-ecutors are also the most highly paid, while prosecutors in Cincinnati receive thelowest average salaries at each experience level.
How do the salaries of prosecutors and defenders compare within the variouscourts? The news is mixed. In Portland and Grand Rapids, prosecutors’ salariesare higher than public defender salaries at each level of experience. At the toplevel (five years of experience or more), the prosecutors’ average salaries are$20,000 to $25,000 more in each jurisdiction. This difference could be attribut-able in part to the average tenure of prosecutors and defenders; the average ten-ure for public defenders in Grand Rapids was six years, whereas the averagetenure for prosecutors was nine years. On the other hand, public defenders’ sala-ries are higher than prosecutors’ salaries at each level of experience in Oaklandand Sacramento. In Oakland, public defenders have a longer average tenure thanprosecutors (12.5 years vs. 10 years), though this would not account for the dif-ferences in salaries at the entry and mid-levels of experience.
In Albuquerque, prosecutors make more money at the entry and mid-levels,but at the upper level, public defenders achieve parity. In Hackensack, publicdefenders have higher salaries at the entry and mid-levels, but prosecutors achieveparity at the upper level. More important in Hackensack, however, is the signifi-cant advantage in average tenure among the public defenders (10 years) com-pared to prosecutors (3 years). The lack of experience among prosecutors inHackensack could be one of the reasons for the court’s performance on measuresof case processing time. In the other courts, prosecutors and public defenders aresubstantially similar in terms of their average years of experience. In general,there is no clear pattern in the average levels of compensation or tenure for prosecu-

42 • EFFICIENCY, TIMELINESS, AND QUALITY: A NEW PERSPECTIVE
■ Public Defenders
Average Attorney Compensation Entry Mid-Level Upper-Level Average Attorney (< 2 years’ exp.) (2-5 years’ exp.) (> 5 years’ exp.) Tenure (Yrs)
Faster Courts
Portland $26,784 32,742 40,485 n/a
Grand Rapids $26,500 32,000 40,000 6
Moderate Courts
Oakland $52,296* 69,398* 90,973 12.5
Sacramento $52,510* 73,829* 97,892* 10.5
Albuquerque $31,000 38,000 55,000 7.5
Slower Courts
Hackensack $45,000* 52,000* 60,000 10
* Public defenders’ average salary is more than 10 percent higher than prosecutors’ average salary at this level ofexperience in this jurisdiction.** Prosecutors’ average salary is more than 10 percent higher than public defenders’ average salary at this level ofexperience in this jurisdiction.
Figure 2.11
What Are the Prosecutors’ and Public Defenders’ Salaries and Average Tenures?
■ Prosecutors
Average Attorney Compensation Entry Mid-Level Upper-Level Average Attorney (< 2 years’ exp.) (2-5 years’ exp.) (> 5 years’ exp.) Tenure (Yrs)
Faster Courts
Cincinnati 29,115 35,940 42,627 10
Portland 33,554** 45,434** 65,000** 8
Grand Rapids 32,000** 50,000** 60,000** 9
Moderate Courts
Oakland 44,496 54,970 87,423 10
Sacramento 45,036 66,378 85,476 n/a
Albuquerque 33,986** 47,000** 50,854 7
Slower Courts
Austin n/a n/a n/a n/a
Hackensack 36,254 42,182 62,858 3
Birmingham 37,000 47,000 59,000 n/a

WHAT DO THE NINE CRIMINAL COURT SYSTEMS LOOK LIKE ? • 43
tors and public defenders within jurisdictions. Nor is there a clear pattern be-tween levels of compensation or average tenure for attorneys and overall caseprocessing times.
C Summary
Several important points can be drawn from the foregoing discussion. First, noneof the courts actually achieve the ABA time standards. Cincinnati, Grand Rapids,and Portland come close, but most courts are some distance away from meetingthese standards. Second, looking at each of the caseload characteristics one at atime does not reveal any strong association with felony case processing time.
Third, contextual factors (e.g., the level of court resources and court man-agement strategies) also have no obvious influence on the pace of litigation. Onereason for the lack of correspondence between the contextual factors examinedhere and the pace of litigation may be that the similarities among the jurisdictionsovershadow their differences. A related possibility is that the contextual factorstend to be measured in a very blunt manner (e.g., master vs. individual calendar).Elemental measures of management strategies, for example, do not capture whatis truly important: the quality or effectiveness of the management system. It isreasonable to assume that there are aspects related to the “quality” of the adjudi-cation environment, rather than the formal organizational structure or manage-ment strategies, that are most important for understanding differences in the na-ture and pace of criminal adjudication. It is not just what type of calendar systemis used or who is responsible for screening cases in the prosecutor’s office that isimportant for timely case processing. Rather, it is how well these functions arehandled. Chapter 4 will venture into this realm of analysis through an examina-tion of attorneys’ perceptions about four key dimensions of the quality of theadjudication environment: the adequacy of resources, the effectiveness of man-agement strategies, local practices, and attorneys’ performance.
Finally, the focus of Chapter 2 has been entirely at the court level. This levelof analysis is important for understanding the context of felony adjudication, butit does not have the same potential power of examining individual case- anddefendant-related characteristics from a large sample of disposed felony cases.Focusing directly on individual case-level data (e.g., the specific case involves ahomicide charge rather than armed robbery, the particular defendant was out onbond, and a particular privately retained attorney represented the defendant) rather

44 • EFFICIENCY, TIMELINESS, AND QUALITY: A NEW PERSPECTIVE
than aggregate-level data (e.g., the percentage of homicide cases, the percentageof bench warrants, and the percentage of defendants represented by privatelyretained counsel) might help uncover the extent to which each specific character-istic affects the time it takes cases to be resolved. The need to determine the effectof each case- and defendant-related characteristic on case processing time, aftertaking into account the simultaneous influences of the remaining characteristics,is responded to in the next chapter.

WHY ARE SOME FELONY CASES RESOLVED FASTER THAN OTHERS? • 45
C Introduction
This chapter looks closely at the extent to which multiple individual case anddefendant characteristics affect how long it takes a state criminal trial court sys-tem to resolve felony cases. Why do some cases take longer than others? Do thesame characteristics consistently appear influential across different courts?
As articulated in the last chapter, there is a long-standing belief that much ofthe variation in case processing time ought to be related to (1) individual case-related factors and (2) organization-related factors. The individual perspectiveacknowledges that case and defendant attributes, such as how serious the chargewas, whether the defendant was released on bond, and whether the case wasresolved by trial rather than a guilty plea, distinguish one case from another andthat each attribute has its own independent effect on the time needed to resolve anindividual case. Organizational explanations focus on the effects of the courtstructure and operations, such as the type of calendaring system in place, thesufficiency of resources, the use of case management practices, and other proce-dures, on case processing time. Assessing the relationship between timeliness andthe quality of case processing requires that both types of factors be examined.
In this chapter, attention is devoted to determining the consequences of indi-vidual case-related factors. More specifically, we examine why some cases areprocessed more quickly than others in each of nine courts by testing the influenceof a variety of independent variables (e.g., severity of the offense) thought toshape case processing time. It is reasonable to assume that some cases will takelonger to resolve simply because they are more serious (e.g., violent felony of-
Chapter 3
k
WHY ARE SOME FELONY CASESRESOLVED FASTER THAN OTHERS?

46 • EFFICIENCY, TIMELINESS, AND QUALITY: A NEW PERSPECTIVE
fenses vs. nonviolent felony offenses), require greater attention and commitmentfrom the prosecutor or the court (e.g., there are multiple defendants involved orthe case is disposed by a jury trial rather than a guilty plea), or are being pro-cessed in a less efficient (or more overworked) court. Yet, despite the intuitiveimportance of case-related characteristics, there is no clear relationship betweencase processing time in the nine courts and each court’s individual case- anddefendant-related characteristics, resource levels, and basic organization andmanagement, as shown by the data in Chapter 2.
The challenge of sorting out the extent to which case- and defendant-relatedfactors are associated with differences in case processing time has been a peren-nial topic among the research community. However, it may be that examiningcase processing time against each potential factor separately (i.e., the bivariateapproach of Chapter 2) understates and obscures the simultaneous impact of allof the factors. The true effects of case- and defendant-related characteristics on acourt’s case processing time might be revealed only when a complete and rel-evant constellation of causal factors is taken into account.
For all of these reasons, we develop a statistical model that allows us tocompare and contrast the simultaneous impact of multiple case- and defendant-related attributes within and across the nine courts. Two fundamental questionsshape the analysis:
• To what extent do familiar individual case- and defendant-related char-acteristics account for variation in each court’s case processing time?
• Do the same factors influence case processing time in a relatively similarway in the nine courts?
Answering these questions requires distinguishing the effect of each characteris-tic on case processing time from the effects of all the other characteristics. Forexample, Figure 2.3 shows that violent crimes against the person take longer, onaverage, to resolve than other types of offenses. Do certain offenses by theirnature (e.g., a violent crime against the person) require more time to resolve? Ordoes a longer average processing time for violent offenses actually reflect thefact that they also tend to be resolved in particular way (e.g., by trial rather thanby a guilty plea)? In addition, the type of analysis should establish the extent towhich the full range of individual case- and defendant-related characteristics havedifferential consequences on case processing time across different courts. Doesthe severity of the offense have a greater effect (i.e., produce longer case process-
WHY ARE SOME FELONY CASES RESOLVED FASTER THAN OTHERS? • 47
ing times) in Albuquerque than in Birmingham or any other court? Is a homicideoffense likely to take three times as long to resolve as a drug case in Albuquerquebut only twice as long in Birmingham and the same time in Hackensack? Theresults will clarify the role of individual characteristics and will help shed lighton how the magnitude of their effects are influenced by how the courts organizeand manage themselves.
C Review of Literature
An overarching result from previous studies of court delay is that individual (i.e.,case- and defendant-related) characteristics are not strong statistical explanationsof the variation in how long it takes to resolve cases. Individual attributes foundto be important in one court are found to have marginal effects in others. In addi-tion, combining factors drawn from quite exhaustive sets of case-level data pro-duces results that have relatively low explanatory power.47 Even the best of theearlier statistical studies are marked by the modest conclusion that “courts differ”in what shapes processing time48 and the acknowledgment that no one has un-covered “a small number of common, influential factors” to explain why onecase takes longer to resolve than another.49
Moreover, even with the development of larger sets of individual factors,prospects for stronger results are considered to be dim. For example, Flemming,Nardulli, and Eisenstein (1987) warn that “substantial limits may exist for build-ing theories of case processing time solely on the basis of case and dispositioninformation. . . . [C]ourts display idiosyncratic patterns of statistically significantvariables that undermine prospects that a few key indicators of a court’s ‘rawmaterial’ or its ‘technology’ can substantially explain case processing times.”50
This despairing view is magnified by Luskin and Luskin (1986), who see virtu-ally no systematic patterns between potential causal determinants and processingtime. They write: “Not every variable varies in every court, and even the vari-ables that do have varying effect.”51
47 Luskin and Luskin (1987); Flemming, Nardulli and Eisenstein (1987); Neubauer and Ryan (1982).48 Luskin and Luskin (1986), p. 225.49 Flemming, Nardulli, and Eisenstein (1987), p 199.50 Flemming, Nardulli, and Eisenstein (1987), p.194.51 Luskin and Luskin (1986), p. 225.

48 • EFFICIENCY, TIMELINESS, AND QUALITY: A NEW PERSPECTIVE
The inability of case-related factors to account for why some cases take longerthan others to be resolved has led some researchers to stress the importance oforganizational factors, such as the type of judicial calendar, the number of filingsper judge, the existence of speedy trial rules, and the extent of interagency coop-eration among the professional participants in the criminal justice process. Infact, a good deal of attention has focused on the point that timely case processingis primarily the result of the beliefs and behavior of judges, prosecutors, andcriminal defense attorneys.
In 1974 Nimmer observed that the “local discretionary system” is a majorobstacle to criminal court reform efforts. He went on to claim that lengthy caseprocessing times are “most directly associated with prevailing informal norms ofthe judicial process and with the personal motivations of participating attorneysand judges.”52 In 1978, after a study in 21 state courts, Church, Carlson, et al.(1978) developed the idea of “local legal culture” to describe this blend of infor-mal court system norms and practices. The concept of local legal culture hascome to imply that the pace of litigation is primarily governed by shared beliefs,expectations, and attitudes within the local court community about how fast crimi-nal cases should move.53
Since this landmark study, the concept of local legal culture has become aregular part of the discourse about the criminal court process.54 Yet, few researchershave ventured to probe the nature and effects of local legal culture on criminaladjudication.55 While incorporating court contextual factors into the analysis ofcase processing time has strong appeal, the traditional approaches used have run
52 Nimmer (1987), p. 93.53 Church (1986) offers a conceptual definition: “Local legal culture will refer to the practitionernorms governing case handling and participant behavior in a criminal court” (p. 451). This defini-tion implies that individuals working in a particular court system come to share—to some unspeci-fied extent—a common set of behavioral attitudes. In each jurisdiction, cases move according to along-standing, relatively stable set of practitioner attitudes and practices regarding proper procedure.54 Church, Carlson, et al. (1978); Eisenstein and Jacob (1977); Nardulli, Eisenstein, and Flemming(1988); Eisenstein, Flemming, and Nardulli (1988); Flemming, Nardulli, and Eisenstein (1992).Their multimethod approach drew on organizational and statistical information to study the influ-ence of courts’ political context, formal and informal organization, and power relations on caseprocessing and sentencing outcomes.55 Church, Carlson, et al. (1984) conducted a study in four criminal courts that explicitly examinedand tentatively confirmed a relationship between judges’ and attorneys’ beliefs and expectations andfelony case processing times. See also Eisenstein, Flemming, and Nardulli (1988).

WHY ARE SOME FELONY CASES RESOLVED FASTER THAN OTHERS? • 49
into at least four methodological problems.56 First, early attempts to assess andmeasure local legal culture were primarily qualitative. For example, Levin (1977)and Nimmer (1978) both reached the basic conclusion that cross-court patterns incourt delay reflected differences in local norms and practices without the benefitof systematic information on case characteristics or numerous contextual factors.Even Church’s argument for local legal culture rests on visual inspection of dataon timeliness and practitioners’ views in one instance57 and comparisons of re-sponses to hypothetical cases by participants in four courts in another.58
The second concern arises because the opportunity to analyze the simulta-neous influence of several contextual variables is quite restricted.59 Quantitativestudies of case processing time employ a statistical model that validly can incor-porate only a limited number of contextual factors. For technical reasons, thenumber of contextual factors must be less than the number of courts being ana-lyzed.60 As a result, the contextual factors must be selected carefully—unless thenumber of courts examined is very substantial. Given that researchers have beenable to study only nine courts or fewer because of the high cost of gatheringinformation on individual case characteristics, a detailed and extensive analysisof contextual factors has not yet taken place.61 In addition, theoretical knowledgeof what aspects of context “matter” remains relatively primitive, thus inhibitingthe correct choice of the specific factors that will have the most explanatory pay-offs. Absent a better understanding of the precise contextual factors to examine,
56 One aspect of the difficulty follows Church’s (1986) warning that “[t]here is obviously a close—some might say tautological—relationship between local legal culture thus defined and existing casehandling procedures” (p. 451). How powerful is it to say that a court has slow case processing timebecause its norm is to be slow?57 Church, Lee, et al. (1978).58 Church (1982; 1986).59 Flemming, Nardulli, and Eisenstein (1992).60 Simply adding more contextual factors into the model will result in problems of multicollinearlity.According to Stipak and Hensler (1982): “Because perfect multicollinearity will result from attemptingto estimate as many contextual effects as there are contexts, the contextual analyst has limited abilityto disentangle the effects of different contextual variables if there are only a few contexts.”61 An approach employed by some researchers is to specify a number of specific contextual factors(e.g., type of judicial calendar: master vs. individual vs. hybrid). The problem with this approach istwofold. First, one is constrained by the number of courts (K) since the model can include no morethan K-1 contextual variables without the variables becoming linearly dependent. Second, the ap-proach does not allow one to distinguish the impact of the contextual factor in one court, say Port-land, from the impact in another court, say Austin.

50 • EFFICIENCY, TIMELINESS, AND QUALITY: A NEW PERSPECTIVE
most studies are said to be shooting in the dark when selecting a handful of po-tential contextual indicators to include in a statistical model.62
A third concern is the strong possibility that many contextual factors (e.g.,the type of calendar and the particular design of delay reduction efforts) are mu-tually intertwined and therefore difficult to distinguish individually. Moreover,the limits on the number of variables that can be included in the model precludethe possibility of turning each possible combination into separate variables. Ad-ditionally, as shown in Chapter 2, there turns out to be little variation across thenine courts under study. For example, judges in eight of the nine courts hear onlyfelony cases on their docket, all of the prosecutor offices use senior attorneys atscreening and horizontal processing, and all criminal defense attorneys use verti-cal processing. Because there are few cross-court differences among many basiccontextual elements, it is not productive to use these factors to differentiate caseprocessing time across courts.
The fourth, and most fundamental, concern is that identifying the existenceof a particular aspect of context is not the same as measuring its actual effect.Many courts have, for example, implemented delay reduction programs with spe-cific procedures, but the actual consequences of these procedures on case pro-cessing time vary dramatically. This situation is not surprising since saying is notthe same as doing. A successful delay reduction effort depends on the interactionof numerous (and often difficult to measure) factors, such as judicial leadershipin articulating and enforcing time goals; interagency cooperation between thejudiciary, prosecution, and defense bar in achieving the time goals; efficient useof resources; and sufficiently skilled attorneys. The objective of assessing manycontextual factors is not simply to note their presence or absence, but to measurethe level of acceptance and effectiveness among the critical court actors.
Hence, a general observation that one can draw from the literature is that theefficient resolution of criminal cases is an interactive process requiring the co-operation and coordination of judges, prosecutors, and defense attorneys. Ourapproach builds on the recent wave of court studies that recognize the centralityof uncovering the dynamics of case processing.63 Basic case- and defendant-re-
62 This view is expressed also by Luskin and Luskin (1986): “[I]ntercourt differences in effects mustbe functions of structural or environmental differences. Identifying the differences responsible is thehard part” (p. 225).63 Myers and Talarico (1987); Nardulli, Eisenstein, and Flemming (1988); Eisenstein and Jacob (1977).

WHY ARE SOME FELONY CASES RESOLVED FASTER THAN OTHERS? • 51
lated characteristics tell part of the story, but a fuller understanding of case pro-cessing in a particular court context means also paying attention to how judges,prosecutors, and defense attorneys interact and work together. This latterpoint suggests that an awareness of the efficiency and effectiveness of thejustice system context (e.g., organization, resource allocation, and manage-ment) is essential if our understanding of the determinants of case process-ing is to progress.
The two-stage approach employed in this study recognizes the limita-tions of past attempts in the model-building process for sorting out the im-pact of individual and organizational factors on case processing. We begin inChapter 3 by using the statistical technique of multivariate regression to analyzean extensive set of individual case-level data. The goal is to examine the extent towhich a common set of case- and defendant-related factors explain case process-ing time in nine jurisdictions. What distinguishes this analysis from earlier stud-ies is the use of a particular form of statistical analysis to pool the data sets touncover basic similarities and differences in how individual case attributes influ-ence case processing among the nine jurisdictions. Building from this compara-tive baseline analysis, Chapter 4 will examine prosecutor and criminal defenseattorney views on the efficiency and effectiveness of the case processing context.
C Data and Methods
DataThe data cover 3,702 cases resolved in 1994 in each of the nine jurisdictions.
The cases were randomly drawn as nine individual samples, one from each juris-diction. A minimum of 400 cases were sought for each of the nine samples.64
Drawn from nine metropolitan communities, the data include a wide range ofoffense and defendant types and aspects of important legal variables.
VariablesThe dependent variable is the number of days taken to resolve each case as
measured from the time of indictment (or information) to final disposition, ad-
64 A more complete description of the data is given in Chapter 2, and the basic project methodologyand data collection strategy is described in Appendix 1.

52 • EFFICIENCY, TIMELINESS, AND QUALITY: A NEW PERSPECTIVE
Expected Impact on Standard
Variable Name Description CPT Mean Deviation
Severity of Charge at Indictment
Most Violent Capital murder, homicide, rape and sexual assault? + .06 .24Violent Other violent crime? + .17 .37Burglary and Theft Burglary and theft? 0 .32 .42Drug Drug sale or possession? 0 .34 .47Other Felony Other felony? 0 .11 .50
Procedural Aspects
Charge Reduction Conviction charge reduced from indictment charge? + .27 .44Weapon Indictment included a weapons charge? + .14 .35Multiple Defendants Case involved multiple defendants? + .25 .43Bench Warrant Bench warrant issued? + .21 .41Prior Defendant had at least one prior felony conviction? + .43 .50
Manner of Resolution
Guilty Plea Case resolved by guilty plea? - .79 .43Trial Case resolved by trial? + .05 .27Deferred Case resolved by deferred judgment? + .04 .19Dismissal Case dismissed? + .12 .33
Defendant Resources
Bail Defendant released on bail? + .64 .48Private Counsel Defendant had a privately retained attorney? + .25 .43
Note: All variables are dichotomous, coded 1 for yes and 0 for no.
Table 3.1
Variables Used in Regression

WHY ARE SOME FELONY CASES RESOLVED FASTER THAN OTHERS? • 53
justed for a criminal defendant’s time out on bench warrant.65 Table 3.1 summa-rizes the independent variables and provides the mean and standard deviation ofeach variable.66 Each variable is more completely described and the commonexpectation of their impact on case processing time is discussed more fully inChapter 2.
MethodThe statistical approach used in this analysis allows us to compare and con-
trast directly the impact of each of the independent variables on the time it takesto resolve an individual criminal case in each of the nine jurisdictions. This resultis achieved by developing a fully interactive regression model. Each of the inde-pendent variables interacts with (or is multiplied by) a set of nine “dummy” orcategorical variables representing each of the nine jurisdictions.67 The rationalefor this manipulation of the data is to help disentangle the contextual or organiza-tional influences on case processing time brought on by the fact that a particularcase is being resolved in one court system rather than another (e.g., Portland vs.Austin). Variation in the basic “facts” of each case (e.g., the severity of charge,the presence or absence of a prior record, the manner in which the case wasdisposed) might not exert a similar influence on case processing time in differentjurisdictions. With an interactive model, one can determine, for example, whether
65 Our primary goal is to ascertain how a number of case- and defendant-related characteristicsinfluence case processing time while the defendant is under court control. Approximately 21 per-cent of the defendants in our sample had a bench warrant issued for failure to appear (Figure 2.5).For cases in which a bench warrant was issued, we have deducted the number of days that thedefendant was outside of court control (bench warrant time) from total case processing time.66 The model with the greatest explanatory power also turned out to be among the most streamlined.All independent variables are structured as dichotomous variables. The variable is coded as 1 if thecriterion applies in a particular case or 0 if the criterion does not apply in the particular case. Re-searchers call these categorical variables “dummy variables.” Many other possible models withdifferent configurations and ways of measuring the independent variables were analyzed. For ex-ample, prior record was measured as the number of previous felony convictions, and misdemeanorconvictions were also distinguished from felony convictions. Several alternative offense severityscales were tested. Many other case characteristics were examined, including the existence of mul-tiple charges. “Extralegal” factors, including the defendant’s race, gender, and age, were examined.In all instances, these additional variables or alternative ways of measuring the variables (dichoto-mous vs. interval) did not improve the statistical performance of the model and were thus rejected infavor of the less complex alternative.67 This expands the number of independent variables in the model from 14 to 136 (14 times 9).

54 • EFFICIENCY, TIMELINESS, AND QUALITY: A NEW PERSPECTIVE
resolving a case at trial versus by guilty plea influences how long it takes toresolve a case in Portland versus Austin.68
The dual benefit of building an interactive model is that it distinguishes theinfluence of each independent variable on case processing time in each separatejurisdiction and compares and contrasts directly the influence of each indepen-dent variable across all of the sites combined. Looking at Oakland, for example,one can compare the time it takes to resolve a case in which the offender wasrepresented by a publicly appointed attorney and was convicted of a violent crimeat trial with the time it takes to resolve a case in which a drug offender wasrepresented by a privately retained attorney and was convicted by a guilty plea.Additionally, one can readily examine whether the same determinant influencescase processing time in the same way in the nine jurisdictions. For example, isthe impact of case resolution by guilty plea in Portland similar to or differentfrom the impact of case resolution by guilty plea in Austin (or any of the otherjurisdictions)? Finally, having all nine jurisdictions integrated into a single modelprovides the basis for knowing how well and consistently a common core ofcase- and defendant-related characteristics explain case processing time.
C Results
Regression analysis of the variables listed in Table 3.1 for the pooled data fromall nine sites is the statistical technique of choice.69 The results from applying
68 The current approach circumvents many of the methodological roadblocks discussed earlier. Onepast technique has been to include a set of dummy variables that indicate the identity of each courtparticipating in the study (e.g., Portland, Austin). However, including a dummy variable for eachsite (rather than using an interactive model) does not allow one to investigate the existence of adifferential impact of case and defendant characteristics across sites (e.g., whether the existence orabsence of a prior record makes a substantial difference in how long it takes to resolve a case in onecourt but not in another). Rather, all aspects of court context are “rolled up” into a single indicatorand the effects of the context are assumed to be independent of the case characteristics. As a result,this past approach assumes that individual case characteristics do not have a differential impact onprocessing time depending on whether the case is filed in, say, Austin or Portland. It is assumed thatthe Austin context affects the time necessary to dispose of cases by trial or guilty plea to the samedegree as the Portland context. Hence, from previous studies one will never know whether theAustin “context” affects the processing of guilty plea cases in a manner different from the manner inwhich the Portland “context” does.69 Regression analysis is a standard statistical technique used to sort the overall impact of severalindependent variables on a single dependent variable and the relative importance of each indepen-dent variable. Impact is measured by the extent to which variation in each independent variable isassociated with variation in the dependent variable.

WHY ARE SOME FELONY CASES RESOLVED FASTER THAN OTHERS? • 55
this tool are displayed and the statistically significant regression coefficients areindicated in Table 3.2. Examining the individual coefficients in Table 3.2 revealsthe effect of each individual characteristic alone or in tandem controlling for theinfluence of all other factors in the model. The numerical value of coefficients inthe table shows the number of days (as well as the statistical significance) thateach factor, on average, exerts on case processing time within and across courts.The strength of this modeling approach is that it captures the interaction of case-and defendant-related characteristics on case processing time within and acrossthe justice system context of each of the nine jurisdictions. Finally, the table alsoshows the R2, which is the proportion of the total variation in case processingtime in all nine sites that is explained by the model.
A distinguishing feature of the results is that this single model “explains” 30percent of the variation in case processing time for all nine courts combined. Thisrelatively small number of common case and defendant characteristics accountsfor about one-third of the variation in the time it takes to resolve criminal cases inall nine courts.
There are two ways of interpreting these results. First, there is the “glass ishalf empty” point of view that emphasizes that some two-thirds of case process-ing time remains unexplained. Following this viewpoint, one might concludethat courts are too different and peculiar for the findings from one court (or evennine courts) to extend and clarify our understanding of case processing time inother courts across the country. Such an interpretation is in line with many paststudies that stress the differences in case processing among courts.70 However,meaningful differences among courts should not be overstated to the point thatimportant similarities are overlooked. This gives rise to the second interpretationthat the “glass is half full.”
From our perspective, it is valid, important, and useful to recognize that acommon core of elements are influential, and statistically significant, factors in
70 Past studies have always constructed separate models for each jurisdiction being investigatedrather than employing an interactive technique such as the model used in this study. For example,Flemming, Nardulli, and Eisenstein (1987) constructed nine separate models, one for each of thenine jurisdictions in their study. They found that the explained variation (R2) varied from a low of 10percent to a high of 29 percent. A central conclusion in their study was that “the most striking feature. . . is the dissimilarity among statistically significant variables across courts” (p. 191). The exten-sive set of case characteristics examined by Luskin and Luskin (1986) with a separate model foreach of the three courts resulted in values of R2 ranging from .28 to .47. Despite the higher levels ofexplained variation, their primary conclusion was that courts differ.

56 • EFFICIENCY, TIMELINESS, AND QUALITY: A NEW PERSPECTIVE T
able
3.2
Reg
ress
ion
Res
ults
: Fac
tors
Affe
ctin
g U
pper
-Cou
rt C
ase
Pro
cess
ing
Tim
e
Dep
ende
nt V
aria
ble:
Upp
er-c
ourt
cas
e pr
oces
sing
tim
e m
easu
red
in d
ays
G
rand
C
inci
nnat
i
Rap
ids
P
ortla
nd
O
akla
nd
Sac
ram
ento
A
lbuq
uerq
ue
Aus
tin
H
acke
nsac
k
Birm
ingh
am
Sev
erity
of C
harg
eat
Indi
ctm
ent
Mos
t Vio
lent
38.6
104.
5**
*23
.528
2.1
***
110.
1**
*10
6.3
***
62.1
*26
.415
1.8
***
Vio
lent
-12.
320
.1-3
.810
.167
.6**
*5.
114
.448
.2**
19.7
***
Bur
glar
y/T
heft
-31.
2**
2.9
3.7
12.7
12.6
9.3
5.0
4.3
-4.1
Oth
er F
elon
y-5
2.3
*13
.312
.8-1
2.1
60.6
*-2
0.8
-26.
2-2
4.1
10.7
Pro
cedu
ral A
spec
tsC
harg
e R
educ
tion
-21.
213
.45.
125
.8-1
1.0
97.2
***
11.1
45.9
*73
.9**
*W
eapo
n44
.8*
-5.3
37.8
65.7
***
-35.
6-1
7.2
-12.
417
.6-6
.2M
ultip
le D
efen
dant
s23
.6-3
0.4
**-7
.828
.6**
34.9
**23
.7-4
8.5
*40
.9**
*26
.2*
Ben
ch W
arra
nt39
.5**
29.0
43.4
***
84.3
***
32.5
89.9
***
69.3
***
14.2
67.1
***
Prio
r R
ecor
d-4
.3-1
9.5
-23.
4**
-12.
0-1
0.6
8.0
1.7
26.1
*-7
.4
Man
ner
of R
esol
utio
nTr
ial
37.4
*13
3.2
***
85.1
***
157.
7**
*26
.912
1.6
**14
6.9
***
52.7
**11
8.0
***
Def
erra
l28
.812
8.0
**34
2.5
***
138.
5**
*98
.0-8
7.6
*13
.8-0
.5D
ism
issa
l18
.614
6.3
***
26.4
-50.
7*
127.
8**
*-1
0.4
123.
1**
32.9
66.2
**
Def
enda
nt R
esou
rces
Bai
l19
.7*
32.8
***
19.0
60.0
***
24.7
39.2
***
95.1
***
77.1
***
118.
8**
*P
rivat
e C
ouns
el25
.0*
60.1
***
12.8
-28.
9-1
9.3
25.2
*31
.012
.153
.1
Con
stan
t67
.7**
R2 :
.30
Adj
uste
d R
2:
.27
Num
ber
of c
ases
: 3,
152
* p
< .1
0;
**
p <
.05;
*
** p
< .0
1 (s
tatis
tical
sig
nific
ance
)
Fas
ter
Cou
rts
M
oder
ate
Cou
rts
Slo
wer
Cou
rts
WHY ARE SOME FELONY CASES RESOLVED FASTER THAN OTHERS? • 57
shaping case processing time in both the faster courts and the slower courts.There are some basic consistencies in how case- and defendant-related character-istics influence case processing time within and among courts. Certainly, as seenin Table 3.2, not all factors under study are significant or have the same effect oncase processing time. However, there is evidence that a core set exerts a rela-tively similar impact on case processing time in these courts. This result suggeststhat the same factors related to the seriousness and complexity of cases influencecase processing time in all courts.
Individual CharacteristicsOne can glean basic patterns of similarities across the nine courts by looking
at each of the five groupings of independent variables. First, under severity ofcharge at conviction, the time to resolve cases for those offenders convicted ofmost violent felony charges (i.e., capital murder, homicide, and sexual assault) islongest in eight of the nine courts (and significantly longer in six of them). Eachof the coefficients under severity of charge at conviction shows the average num-ber of days of case processing time that a particular charge adds or subtractscompared to a drug sale or possession case. Drug sale or possession is the cat-egory or charge that is held out of the model and is the base category againstwhich other charge types are compared.
Simply stated, more serious charges take more time and the relationship holdstrue in all courts. Cases that result in an offender being convicted of a “mostviolent crime against the person” take, for example, about 39 days longer thandrug cases in Cincinnati and 152 days longer than drug cases in Birmingham. Inaddition, five of the nine courts exhibit the same pattern in which the cases in-volving the most violent offenses and cases involving other violent offenses (e.g.,armed robbery) take the longest to resolve.
Second, factors assessing the procedural aspects of the case show inconsis-tent relationships with case processing time. To begin with, cases involving theissuance of a bench warrant take considerably longer to resolve in all nine courts(and significantly longer in six).71 When a defendant jumps bail, court proceed-
71 Recall that the case processing time dependent variable is calculated by deducting the number ofdays that the defendant has absconded. Therefore, the bench warrant variable is not influenced bythe length of time that defendants are outside court control. Instead, the bench warrant variable canbe interpreted as the additional court time related to processing a defendant who has been appre-hended after jumping bail (e.g., additional hearings).

58 • EFFICIENCY, TIMELINESS, AND QUALITY: A NEW PERSPECTIVE
ings are missed and new and additional hearings are required subsequently. Theadditional court time taken to process a case involving a defendant who has beenre-arrested after failing to appear at an earlier scheduled hearing is, for example,about 29 to 44 days longer in the faster courts (i.e., Cincinnati, Grand Rapids, andPortland) and about 67 to 90 days longer in the slower courts (i.e., Albuquerque,Austin, Birmingham, and Oakland).72
In addition, cases involving a charge reduction add time to the process ofcase resolution in seven of nine courts (though only significantly for three ofthem). Necessary negotiations must be accommodated. The three courts wherecharge reductions significantly add to case processing time are among the slow-est (Albuquerque, Birmingham, and Hackensack), but charge reductions add littleor nothing to case processing time in the fastest courts. Additionally, the potentialprocedural complexity measured by the existence of a weapons charge, the pres-ence of multiple defendants, or the existence of prior felony convictions havelittle or no consistent relationship to case processing time.73 The presence ofmultiple defendants in a case has significant consequences in six of the nine courts,but the effect in Grand Rapids and Austin (to reduce case processing time) is theopposite of the effect in Oakland, Sacramento, Hackensack, and Birmingham (toincrease case processing time). Weapons charges and the existence of a priorrecord have significant effects in few courts. This finding may be surprising,particularly because prior record is a primary determinant at the conviction andsentencing stages according to the well-established literature.
Third, as shown under manner of resolution, cases that are resolved by trialrather than by guilty plea take significantly longer to resolve in eight of the ninecourts. Resolving a case by trial takes, for example, about 147 days longer inAustin and 133 days longer in Grand Rapids. A significant coefficient on the trialvariable also indicates that trials lead to longer case processing time independentof other factors. It is more time-consuming and complicated to assemble jurors,witnesses, the defendant, attorneys, the judges, and court staff regardless of thetype of offense and other characteristics of the case and defendant. In addition,trials have a significant impact in courts of all speeds, but the relative impacttends to be less in the faster courts. In Cincinnati and Portland, for example,defendants wait only 37 and 85 days longer, respectively, for a trial to resolve
72 An exception is Hackensack.73 Oakland is the one jurisdiction where both weapons and multiple defendants are significant.

WHY ARE SOME FELONY CASES RESOLVED FASTER THAN OTHERS? • 59
their cases than do defendants who resolve their cases by pleading guilty. Thesetwo courts are probably better able to accommodate trial dispositions because ofa well-organized and managed scheduling office and more clearly specified pre-trial procedures.
Cases that are resolved by deferral or dismissal take longer—often far longer—than cases resolved by guilty pleas in these nine courts. Although conducting acourt hearing to dismiss the charges can be completed in minutes, the elapsedtime that it takes to arrange and schedule such hearings comports with the viewthat prosecutors are reluctant to dismiss the charges against a defendant who hasmade it through the screening and indictment process. Deferrals are a rare formof disposition except in Austin, where they tend to be treated much the same as atraditional guilty plea. The very lengthy deferral process evident in Grand Rapids,Portland, and Oakland reflects the fact that the defendant’s progress under theterms of the deferral are initially monitored before a final disposition is entered.
Fourth, examining the two factors associated with the level of defendant re-sources shows that in seven of the nine courts, case processing times are signifi-cantly longer for cases in which criminal defendants have been released on bond.As expected, to minimize the cost of imprisonment and the defendant’s loss ofliberty, courts give priority to handling cases in which criminal defendants aredetained. Out-of-custody defendants have their cases resolved less quickly thanin-custody defendants. The size of the net effect, however, tends to vary. In thethree fastest courts (Cincinnati, Portland, and Grand Rapids), release on bondadds about 19 to 33 days to case processing time, while in the three slowestcourts (Austin, Hackensack, and Birmingham), the effect of bail is to add be-tween 77 and 119 days to case processing time. Additionally, there is little sup-port for the belief that privately retained attorneys are a consistent source of de-lay. Although the bivariate analysis in Chapter 2 (Figure 2.5) showed that theslower courts tend to have a higher proportion of cases in which the defendantswere represented by privately retained attorneys, there is no independent effectof attorney type when all other characteristics of the case are taken into account.In only three courts (Cincinnati, Grand Rapids, and Albuquerque) are privatelyretained attorneys associated with significantly longer case processing times.
The Relative ImpactThe regression model used in this chapter helps identify the case- and defen-
dant-related characteristics that exert the most substantial influence on case pro-cessing time in each of the nine courts. There are some notable similarities. Four

60 • EFFICIENCY, TIMELINESS, AND QUALITY: A NEW PERSPECTIVE
factors—a most violent felony charge, a resolution by trial, the issuance of abench warrant, and pretrial release on bond—tend to increase significantly timeto resolution in faster courts as well as in slower courts. Yet, the effect is mostvisible on a relative rather than absolute scale. That is, while the absolute numberof additional days of case processing time associated with these factors tends tobe smaller in the faster courts and larger in the slower courts, the relative impactis quite similar.
One way to see more clearly the impact of these individual characteristics isto select two or more of the “important” case- and defendant-related characteris-tics (e.g., violent offense, trial, bench warrant, and bond) and create a “defendantprofile.” For example, one can isolate the impact on case processing time broughton solely by a defendant being charged with a most violent felony offense whoseeks to have his or her case disposed by trial. The effect of all other potentialcase- and defendant-related characteristics can be removed (or set to zero). Thatis, we assume that the case involves no charge reduction, no use of a weapon, noadditional defendants, no bench warrant, no prior record, no release on bond, andno privately retained attorney. By building such a profile, one can compare therelative impact that a particular type of case has among jurisdictions.
Figure 3.1 shows the point in the distribution of case processing times (arrestto disposition) where our particular “defendant profile” case is expected to bedisposed in each of the nine jurisdictions.74 The profile is composed solely ofdefendants who are charged with a most violent felony and whose cases are dis-posed at trial. Again, no other case or defendant characteristics are assumed to bepresent (i.e., no bail, no privately retained attorney, no weapon, no prior record,etc.).75 As can be seen, the expected disposition of such a case would occur at thefar right of the distribution (beyond the 75th percentile) in all courts (with the
74 The charts show arrest to disposition in eight counties; because arrest dates were unavailable inAlbuquerque, the chart for this site shows indictment to disposition. In the three faster courts, a largeproportion of cases are disposed within the first two to three months after arrest. Only a smallpercentage of cases remain after eight months in these courts. Among the slowest courts, the dispo-sition graphs peak much later in the process. In these three courts, dispositions are spread out over alonger period of time, with many cases disposed beyond the 18-month mark.75 Of course, adding in the effect of additional characteristics to this defendant profile will typicallyserve to increase the expected case processing time (moving further to the right on the distribution ofcase processing times). That is, one can augment the defendant profile by adding or subtracting thedays of case processing time as measured by the regression coefficients on, for example, bail, pri-vately retained attorney, or multiple defendants.

WHY ARE SOME FELONY CASES RESOLVED FASTER THAN OTHERS? • 61
exception of Hackensack). This type of case is among the most time-consum-ing.76 However, “time-consuming” has a different meaning in different courts.Note that a case like this defendant profile case takes six to nine months to beresolved in the faster courts and 13 to 19 months in the slowest courts.
Our interpretation of this result is that the courtroom participants in somecourt systems are able to get the same job done within tighter time frames thantheir counterparts in other court systems. Some degree of case differentiation isevident in courts of all speeds. The norm is that case processing time will belonger for cases in which the defendant is convicted of a more serious felonycharge, the disposition occurs by trial, a bench warrant has been issued, and thedefendant has been released on bail. In most every system, one can see similari-ties in the relative amount of time needed to resolve different types of cases. As aresult, the average speed with which more serious and complex cases are pro-cessed is different from court to court, but the relative speed of cases within eachcourt is affected by a similar set of characteristics. Homicide cases take longer toresolve in some courts than in others, but in almost all courts, homicide casestake longer than burglary cases, drug sale and possession cases, or cases involv-ing driving under the influence.
The fact that a parsimonious set of factors account for a considerable amountof the variation in how long it takes cases to be resolved resonates well with oneof the basic principles of modern case management. The principle of proportion-ality77 states that every case should receive individual attention, but the amountof the attention should be proportional to the attention that the case warrants.78
More complicated cases, more difficult cases, and more serious cases shouldreceive more attention than routine, uncomplicated, and less serious cases. Theidea of proportionality is intended to maintain equality and due process in the
76 One further observation is that the expected time to disposition for this complex defendant profile isat the 83rd to 94th percentile in the four fastest courts and at the 75th percentile in the slower courts(50th in Hackensack). This pattern may indicate that the faster courts are better able to differentiatecases early in the process and move the less serious and less complex cases to timely disposition.77 Chapper and Hanson (1983); Woolf (1996).78 The principle of proportionality comports well with the goal of differentiated case management.As noted in Differentiated Case Management (Bureau of Justice Assistance, 1993), “Inherent in theconcept of DCM is the recognition that some cases can—and should—proceed through the courtsystem at a faster pace than others. In a DCM system, the traditional ‘first-in-first-out’ rule for casescheduling is replaced by a case management system that accommodates the diversity of case pro-cessing events and timeframes appropriate to the individual cases filed” (p. 1).

62 • EFFICIENCY, TIMELINESS, AND QUALITY: A NEW PERSPECTIVE
Figure 3.1
Percentage of Felony Cases Disposed Within 36 Months(Arrest to Disposition)
5%
10%
15%
30%
3624129630
Most violent offense resolved by trial(85th percentile)
5%
10%
15%
30%
3624129630
Most violent offense resolved by trial(94th percentile)
5%
10%
15%
30%
3624129630
Most violent offense resolved by trial(83rd percentile)
5%
10%
15%
30%
3624129630
Most violent offense resolved by trial(85th percentile)
5%
10%
15%
30%
3624129630
Most violent offense resolved by trial(75th percentile)
5%
10%
15%
30%
3624129630
Most violent offense resolved by trial
Cincinnati Oakland
Grand Rapids Sacramento
Portland Albuquerque
Faster Courts Moderate Courts

WHY ARE SOME FELONY CASES RESOLVED FASTER THAN OTHERS? • 63
5%
10%
15%
30%
3624129630
Most violent offense resolved by trial(75th percentile)
5%
10%
15%
30%
3624129630
Most violent offense resolved by trial(50th percentile)
5%
10%
15%
30%
3624129630
Most violent offense resolved by trial(75th percentile)
Percentage of Felony Cases Disposed Within 36 Months, continued
Austin
Hackensack
Birmingham
Slower Courts

64 • EFFICIENCY, TIMELINESS, AND QUALITY: A NEW PERSPECTIVE
treatment of cases, but it also is intended to achieve those standards in an effi-cient manner.79
In addition, some court contexts accomplish the proportional treatment ofdefendants without undue delay. Defendants who want to have their cases re-solved by trial or who were out on bond need not have their case languish. Howmuch impact case- and defendant-related characteristics have on case processingtime is within the court’s control. The consequences can be large or small, likelydepending on how the court, prosecution, and defense are coordinated and man-aged. Hence, judges, attorneys, and court staff interested in improving their court’sperformance should find hope in the result that a portion of the variation in caseprocessing time is explained by case- and defendant-related characteristics andthat these factors are susceptible to court control. That is, they are not stuck withcausal factors that cannot be managed. Just the opposite is true. Serious and com-plex cases, such as homicide cases, need not take forever to resolve. The fastcourts under study manage to resolve these cases in shorter time frames whileadhering to the norm of proportionality just like the slower courts.
C Summary
Two major observations emerge from an analysis of the role that case- and defen-dant-related characteristics play in explaining differences in case processing time.First, a common set of case- and defendant-related characteristics account forapproximately one-third of the variation in case processing time among nine courts.This result supports the notion that basic facts about individual cases explaindifferences in the time it takes for cases to move through the system. Second, acommon core of factors tend to explain case processing time in courts at all lev-els of timeliness. Timeliness is not achieved by a disregard for the severity of the
79 A contrary principle to proportionality is the idea that all cases should receive the same amount ofattention. However, the principle of equal attention, in addition to being one of inefficiency, makesno sense constitutionally. The Equal Protection Clause of the U.S. Constitution surely does notrequire that all cases be treated alike. Equal Protection requires that like cases be treated alike.However, Neubauer and Ryan (1982) assert that too much differentiation in how cases are treated(e.g., trials take many months longer to resolve than guilty pleas) is undesirable disparity. Casedifferentiation, they argue, is appropriate but should be constrained so as to ensure access to speedyjustice regardless of the severity of the charge or the manner of case resolution. Yet Neubauer andRyan’s point of view is in a real sense only a note of caution that proportionality has some limits andis not the only principle of case management.

WHY ARE SOME FELONY CASES RESOLVED FASTER THAN OTHERS? • 65
offense or the method of resolution. More serious and more complex cases takelonger than less serious and less complex cases in all courts. However, in moreexpeditious courts, the time frame for all cases is tighter. Hence, the principle ofproportionality rather than assembly line justice guides the resolution of cases.
Why some courts are able to resolve cases in tighter time frames, however, isnot answered by the principle of proportionality or the role of case- and defen-dant-related characteristics. Other researchers acutely recognize the limitationsof case-related data, although in a somewhat different context. For example, con-sider the words of Nardulli, Eisenstein, and Flemming (1988):
We will not learn much by continuing to conduct multivariate analyses ofcase, defendant, and decision maker attributes. . . . We do not suggest a totalabandonment of studies that focus on case outcomes; they are still thebottomline of what criminal courts do. Instead, we suggest a move awayfrom the preoccupation with deviation from system norms to a focus on thedifferences in norms across court communities. Such a reorientation . . .would open new vistas for court research and broaden the scope of researchinto these vital and complex institutions.80
They later note:
A more systematic analysis and mapping of court community norms andvalues could help identify key differences across court communities.81
We agree and contend that a “more systematic analysis and mapping of courtcommunity norms” requires a structured framework for conducting comparative,cross-court analysis. The first stage of our analysis—examining the role of case-and defendant-related characteristics in determining case processing time—es-tablishes that a common set of these factors are influential in most courts. Theefficiency and effectiveness with which a court responds to its particular input ofcases and defendants are the subjects of Chapter 4.
80 Nardulli, Eisenstein, and Flemming (1988), pp. 383-43.81 Ibid., pp. 369-70.

IS THERE A LOCAL LEGAL CULTURE THAT FOSTERS TIMELINESS & QUALITY? • 67
C Introduction
This chapter takes up the challenge of defining, measuring, and analyzing keydimensions of quality in state criminal trial courts with different degrees of time-liness. In so doing, we examine whether higher levels of timeliness are associ-ated with higher or lower levels of case processing quality.
We have argued that the development of time standards focuses attention ontwo competing goals for the resolution of criminal cases. Time standards honorthe achievement of both expeditious case resolution and justice in individualcases (quality). Yet, there is clearly competition, or even a trade-off under someconditions, between these two alternative aspirations. In the context of our crimi-nal justice system, it is often said that procedural expediency is relinquished toallow the accused a presumption of innocence. One possible extension of thisrelationship is that actions taken to reduce the time to resolution will be contraryto the goal of effective advocacy. Speed, it is argued, encourages attorneys andjudges to cut corners, to give all cases the same and often perfunctory treatment,and to rely on procedures that minimize court involvement (e.g., attorney-nego-tiated plea agreements rather than trials). This point of view suggests that fastercase processing is detrimental to the quality of justice.
On the other hand, some observers see timeliness as only one of many posi-tive and compatible attributes that characterize well-functioning court systems.Other important values such as affordability, access, and due process—like timeli-
Chapter 4
k
IS THERE A LOCAL LEGAL CULTURE THATFOSTERS TIMELINESS AND QUALITY?
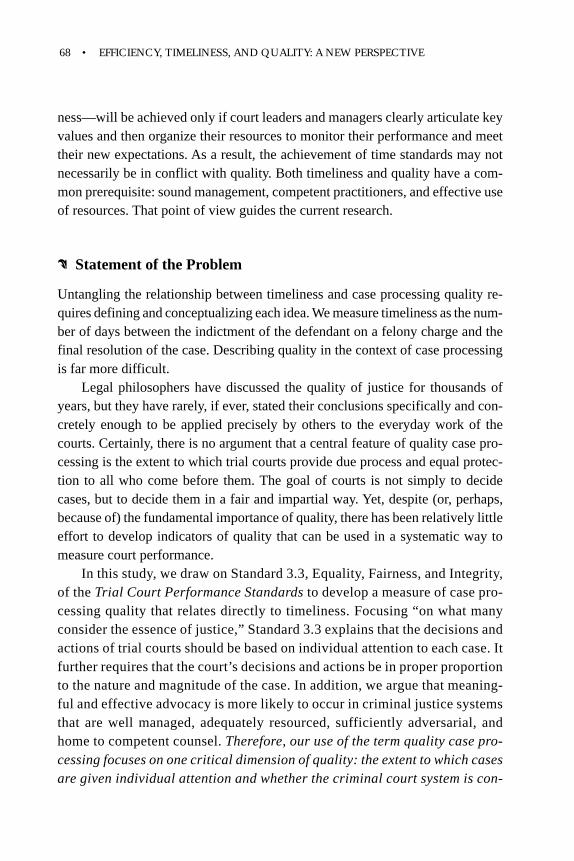
68 • EFFICIENCY, TIMELINESS, AND QUALITY: A NEW PERSPECTIVE
ness—will be achieved only if court leaders and managers clearly articulate keyvalues and then organize their resources to monitor their performance and meettheir new expectations. As a result, the achievement of time standards may notnecessarily be in conflict with quality. Both timeliness and quality have a com-mon prerequisite: sound management, competent practitioners, and effective useof resources. That point of view guides the current research.
C Statement of the Problem
Untangling the relationship between timeliness and case processing quality re-quires defining and conceptualizing each idea. We measure timeliness as the num-ber of days between the indictment of the defendant on a felony charge and thefinal resolution of the case. Describing quality in the context of case processingis far more difficult.
Legal philosophers have discussed the quality of justice for thousands ofyears, but they have rarely, if ever, stated their conclusions specifically and con-cretely enough to be applied precisely by others to the everyday work of thecourts. Certainly, there is no argument that a central feature of quality case pro-cessing is the extent to which trial courts provide due process and equal protec-tion to all who come before them. The goal of courts is not simply to decidecases, but to decide them in a fair and impartial way. Yet, despite (or, perhaps,because of) the fundamental importance of quality, there has been relatively littleeffort to develop indicators of quality that can be used in a systematic way tomeasure court performance.
In this study, we draw on Standard 3.3, Equality, Fairness, and Integrity,of the Trial Court Performance Standards to develop a measure of case pro-cessing quality that relates directly to timeliness. Focusing “on what manyconsider the essence of justice,” Standard 3.3 explains that the decisions andactions of trial courts should be based on individual attention to each case. Itfurther requires that the court’s decisions and actions be in proper proportionto the nature and magnitude of the case. In addition, we argue that meaning-ful and effective advocacy is more likely to occur in criminal justice systemsthat are well managed, adequately resourced, sufficiently adversarial, andhome to competent counsel. Therefore, our use of the term quality case pro-cessing focuses on one critical dimension of quality: the extent to which casesare given individual attention and whether the criminal court system is con-

IS THERE A LOCAL LEGAL CULTURE THAT FOSTERS TIMELINESS & QUALITY? • 69
ducive to providing effective advocacy to cases.82
Evidence of individual attention to cases in the nine sites was gleaned fromthe statistical model presented in Chapter 3. Courts tend to treat cases in rela-tively the same fashion. The more serious cases generally take longer to resolvethan the less serious cases in almost all courts, although there may be absolutedifferences in case processing time for each given category of offense in fasterand slower courts. For example, homicide, armed robbery, and sexual assaultcases take longer to resolve than burglary and theft cases, drug sale and posses-sion cases, and cases involving driving under the influence of drugs or alcohol.This finding, which we interpret as adherence to a norm of proportionality, callsinto question the notion that faster courts achieve their speed by adopting “as-sembly line” justice. The case-level data suggest that defendants get individualattention based on the severity or complexity of their case whether the over-all case processing time in their court is among the most or the least expedi-tious. Yet, evidence of proportionality does not explain why some courts areable to provide individualized attention to cases within much tighter timeframes than other courts.
Do court systems that achieve timeliness also provide effective advocacy, orare tight time frames achieved at the expense of effective advocacy by attorneys?Of course, determining whether a particular court system maintains effective ad-vocacy will always involve some degree of subjectivity. In response, we delin-eate and construct a set of measures that experts in the field of judicial adminis-tration have identified as key ingredients of effective court operations. Our mea-sures are based on the attitudes of prosecutors and criminal defense attorneys infour areas: (1) the presence or absence of clear court management policies, (2)the degree of interagency coordination and cooperation, (3) the competency ofopposing counsel, and (4) the sufficiency of court system resources. We assertnot only that information on these four areas provides critical insight into alterna-tive criminal court system environments but also that the information on attorneyattitudes aids the understanding of important dimensions of case processing quality.Therefore, the fundamental hypothesis in this chapter is that the attorneys’ views
82 We acknowledge that we have not discovered a universal definition of quality that applies toevery circumstance, every situation, and every aspect of the American legal process and all of itspossible outcomes. We are limited in our scope to the handling of felony cases, which is the settingin which the value of timeliness also is based.

70 • EFFICIENCY, TIMELINESS, AND QUALITY: A NEW PERSPECTIVE
on these four areas are related in particular ways to timeliness and the potentialfor effective advocacy.
The remainder of this chapter is organized into a two-stage process. The firststage is the development of an analytical framework based on the concept ofefficiency that clarifies the relationship between timeliness and quality.83 Effi-ciency is a pertinent and helpful idea because efficient court systems can be shownto be in a better position to achieve both greater speed and case processing qual-ity than less efficient courts. As a result, the real challenge confronting courts isto increase efficiency as the means to improve performance on multiple dimen-sions (e.g., timeliness, affordability, access) instead of seeing the interests of time-liness and the interests of quality as polar opposites. The goals of timeliness andquality are jointly achievable, at least under some conditions, rather than mutu-ally exclusive under all conditions.
Second, we analyze a set of mail questionnaire responses received from pros-ecutors and defense attorneys in the nine courts to determine if and how the fourattitudinal dimensions of quality vary by average court processing time. Perhapsthe shorter overall processing times in faster courts are not achieved by a reduc-tion in proportionality, but by an excessive and unsustainable strain on resources.One might argue that the avoidance of delay is paid for by a reduction in theadversary posture of the attorneys,84 increased bickering about staffing andcaseloads, and a general drop in job satisfaction among prosecutors and criminaldefense attorneys. On the other hand, faster courts may simply be making moreefficient use of their resources without sacrificing quality. Successful and sus-tained initiatives to improve case processing time might occur only in court envi-ronments that also support and encourage an overall commitment to case pro-cessing quality. Thus, to determine what differentiates work orientations in fasterand slower courts means coming to terms with the fundamental question: Mustsome aspect of quality suffer to improve timeliness? Or can a court have more
83 The “efficient” solution often connotes, in everyday language, the fastest or cheapest approach.This definition is not the formal definition of efficiency nor the one that we employ. Another way tothink of the level of efficiency is as the level of “jurisdictional effectiveness.” This definition fo-cuses attention on the goal of efficiency: to use resources in their most productive fashion to producethe most of what a jurisdiction values. A promising starting point, based on our reading of the litera-ture on time standards, is that jurisdictional effectiveness can be gauged by reference to two funda-mental values of courts: timeliness and quality case processing.84 See, for example, Sudnow (1965) and Blumberg (1967).
IS THERE A LOCAL LEGAL CULTURE THAT FOSTERS TIMELINESS & QUALITY? • 71
productivity, quality, and speed simultaneously?Attorneys’ views on these four broad issue areas allow us to clarify what
practitioners know about issues related to court performance, to determine howthey feel about each issue and how it is seen in their court, and to assess thelikelihood that the individual will take action based on the attitude. Our analysisis designed to test the basic hypothesis that there are distinct differences betweenthe attitudes among attorneys in faster courts and the attitudes among attorneysin slower courts.
C Analytical Framework: Efficiency and the Productivity Frontier 85
In efficient court systems, the prosecution, defense, and judiciary perform thekey activities and procedures necessary to resolve criminal disputes better thantheir counterparts in less efficient courts. Focusing on efficiency means deter-mining the policies and practices that allow an organization to better use its per-sonnel, procedures, and technology to achieve its desired ends. For example,judges can better manage the flow of cases by limiting continuances and ensur-ing firm trial dates, prosecutors can positively affect the flow of cases throughearly screening of cases, and defenders can work to ensure the early appointmentof defense counsel. This concept also covers improving interagency coordinationand cooperation between the prosecution and defense bar. One obvious exampleis ensuring the early and complete exchange of discovery so that pretrial negotia-tions can proceed in a fair and timely fashion.
Differences in efficiency among court systems are pervasive. Some pros-ecutor and defender offices and courts are able to get more out of their availableresources than others because they eliminate wasted effort, employ more ad-
85 This section draws extensively on some basic principles of economics related to the concept ofefficiency. Getting as much as possible out of scarce resources—using resources effectively—iswhat is meant by efficiency. We use this idea to examine the relationship between timeliness andcase processing quality. Because this topic is complex, we attempt to analyze and clarify centralissues through the use of a model called the “productivity frontier.” Because the goal is to under-stand whether different levels of case processing quality exist in faster and slower courts, we beginby thinking about and focusing our attention solely on these two, albeit important, features of courtperformance. We use this model because thinking analytically is a good warm-up exercise for view-ing the world in which we live. The benefit of the exercise, of course, is to better understand courtperformance in the real world. While we believe using the language and models of economics fur-thers our understanding, economics also acknowledges that the world is a complex place.

72 • EFFICIENCY, TIMELINESS, AND QUALITY: A NEW PERSPECTIVE
vanced technology, inspire employee motivation, or have greater insight intomanaging particular activities or sets of procedures. Such differences are impor-tant because they directly affect how cases move between the events that occurfrom filing to disposition.
The Productivity FrontierOne way to recognize and to appreciate the critical role of efficiency is to
imagine a productivity frontier that shows the maximum amount of quality andtimeliness that a court could produce using the sum of all existing types of “bestpractices” (see Figure 4.1). That is, the frontier represents efficient operation: thehighest combination of quality and timeliness (or “justice”) that a court systemcan attain if it maximizes available attorney skills, management techniques, andavailable technology.86 A court’s choice between achievable degrees of timeli-ness and case processing quality can be expressed with this diagram by measur-ing the quality of case processing along the vertical axis and timeliness along thehorizontal axis.87 Any particular combination of timeliness and quality case process-ing is called efficient88 if it corresponds to a point on the frontier (for example, pointA2) rather than to a point in the interior of the region (for example, point A1).
The concept of a frontier also underscores that a court’s resources can beused to achieve very different combinations of quality and timeliness. For ex-ample, a court system might allocate its resources so as to process all of its casesin a very timely fashion, but with little concern for individual justice and effec-tive advocacy. Such a situation of speedy case processing with lower levels of
86 What is considered efficient or inefficient only has meaning in reference to using resources toproduce more of what is valued. For us, the many and distinguished groups that have promulgated orcome out in favor of time standards have determined that both timeliness and quality case process-ing are primary values of the courts. The model of the productivity frontier can apply to a wide rangeof potential values. One could examine the relationship between specific values such as, say, acces-sibility, affordability, or avoidance of bias and, say, public trust and confidence. Efficiency wouldthen be judged on how well resources were used to produce this alternative set of values. It followsthat disagreements in society about the relative efficiency of particular goals in the criminal justicesystem (such as timeliness and quality case processing or accessibility) are really disagreementsabout the relative value assigned to those goals. The question is not, “What is really more efficient?”but rather, “Who has the right to determine what are the primary goals of the administration of justice?”87 Moving up the vertical axis or to the right on the horizontal axis represents higher levels of qualityand timeliness, respectively.88 By definition, a court has organized its resources efficiently if it is someplace on the productivityfrontier. Being on the frontier means that more of, say, quality case processing can be produced onlyby sacrificing some degree of timeliness. If one is on the frontier, it is impossible to increase theoutput of both goods at the same time.

IS THERE A LOCAL LEGAL CULTURE THAT FOSTERS TIMELINESS & QUALITY? • 73
case processing quality is represented by point C. On the other hand, a courtsystem might choose to provide exquisite attention and detail to every case butignore timeliness (point B). However, a court can avoid these extreme choices bychoosing to shoot for one of many possible arrangements of timeliness and caseprocessing quality indicated by the curve of the productivity frontier.
Figure 4.1: Productivity Frontier
The frontier is an analytical tool for discussing improvements in efficiencythat will allow a court to achieve more of what is valued in court performance. 89
For court systems in the real world, the frontier is primarily of value in clarifyingthat timeliness and quality are not necessarily antithetical to one another. Nocourt system, of which we are aware, is currently operating at the frontier or, inother words, at maximum efficiency represented by point A2 on the figure.
As a consequence, the current levels of quality and timeliness provided byactual court systems can be shown by locations within the interior of the frontier.Three possible examples are points A1, B, and C in Figure 4.1. Moreover, thesethree points reflect what practitioners and researchers often say about courts(e.g., “court B is slow, but it has a real commitment to ensuring public trust andconfidence” or “court C really moves the cases, but everyone is overworked”).
89 This discussion of efficiency also helps underscore that timeliness and quality case processing areboth “economic goods.” All economic goods have value in the sense that in order to get more of anygood, we are willing to forgo some amount of any other good. The temptation is to think that theterm goods applies only to tangible goods. This temptation must be resisted. Economic goods are“all valued things that are scarce” (Posner, 1979), from the most mundane tangibles like guns and butter to themost metaphysical intangibles like “justice.” Justice is a valuable good for which most of us are willing toforego some amount of other valued goods. This concept is underscored in our criminal justice system inwhich procedural expediency is relinquished in order to give the accused a presumption of innocence.
QualityQuality
Court system Court system improving efficiency
Timeliness Timeliness➛
•A1•A1
•A2•B•B
•C •C

74 • EFFICIENCY, TIMELINESS, AND QUALITY: A NEW PERSPECTIVE
Because judges and court managers commonly believe that courts are good atsome aspects of performance and not so good at others, one can see why they areconcerned about a trade-off between timeliness and quality case processing. Inour example, one court is more oriented toward quality (court B), one court to-ward timeliness (court C), and the third is somewhere in between (court A1), butno court is better on both dimensions. However, visualizing efficiency through aframework like the productivity frontier demonstrates that timeliness and qualityare not incompatible; more of both is possible (e.g., court A1 moves toward pointA2). This conclusion will be demonstrated by addressing two key questions: (1)What are the benefits of improved efficiency? and (2) How do we measure thecurrent position of different courts systems with respect to the productivity frontier?We address the first question below and the second in later sections of this chapter.
Improving EfficiencyA central point of this discussion is that if a court is operating inefficiently
(inside the frontier), then the court has the opportunity to achieve more of bothspeed and quality. This improvement is signified by moving in the direction fromA1 to A2 inside the shaded area. An allocation of timeliness and quality case pro-cessing in one court is said to be “Pareto-preferred”90 (or more efficient) in com-parison to another court system if in the first arrangement the court is performingat a higher standard with respect to both timeliness and quality. Consider twodifferent combinations of timeliness and quality called A1 and A2. A2 is Pareto-preferred to A1 because A2 represents both greater timeliness and enhanced caseprocessing quality relative to A1. A court system operating at point A2 is perform-ing at a higher level—more efficiently—than a court operating at point A1. Sim-ply stated, “More of what we value is preferred to less of what we value.” This lastpoint also suggests that critics of efficiency are logically confused. A society or court thatplaced “too high a value on efficiency” would be one that placed too high a value onusing its resources in the most valuable way. That’s an odd notion at best.
The productivity frontier can apply to an entire court system, as discussedabove, to groups of linked activities like plea bargaining, or to individual attor-ney activities. We reference Figure 4.1 again, but use the framework to discussimprovements in the efficiency of individual attorneys. As a basic illustration,consider two attorneys (corresponding to points A1 and A2 in Figure 4.1) withrelatively similar caseloads who structure their time quite differently in prepar-
90 Named for Vilfredo Pareto, Italian economist and sociologist, 1848-1923.

IS THERE A LOCAL LEGAL CULTURE THAT FOSTERS TIMELINESS & QUALITY? • 75
ing for pretrial and trial activities. One attorney (A2) might sort out the routinefrom the more complex cases and attempt to resolve several of the routine onesindividually, but within a designated period of time, and to set aside the complexcases, each of which requires a concentrated block of time to research, investi-gate, and analyze. The other attorney (A1) might follow the principle of first in,first out and develop a work schedule that fits the exigencies of each individualcase regardless of its complexity.
It is our assumption that the work required to establish gradations of caseshas payoffs in the long run. Attorney A1’s orientation accentuates the uniquenessof each case despite that the attorney has a limited amount of time to devote to allof the cases. On the other hand, attorney A2 is fitting the cases into his or heravailable work time rather than letting the nature of each case determine whatwork is required. Hence, in the end, attorney A2 not only gets the job done withina shorter time frame but also might actually be better prepared in all instances.This situation is illustrated by showing attorney A2’s position above and to theright of attorney A1’s position in the figure.
Our basic supposition is that in efficient court systems, the participants willresolve the same type of case in a shorter period of time—with no loss of qual-ity—than the participants in less efficient court systems. Judges and attorneys inalmost all court systems provide proportionality in case processing, but the par-ticipants in some systems accomplish the necessary tasks more efficiently thantheir colleagues in other systems. In addition, we suggest that courts often canimprove on multiple dimensions of performance at the same time. What wereonce believed to be real trade-offs—between quality case processing and timeli-ness, for example—may simply be illusions created by inefficiency or unfoundedfears about diminishing due process. Hence, we contend that an underlying basisfor the observed variation in overall processing times among the nine court sys-tems under study is the variation in the extent to which the systems are effi-cient.91 Focusing on improved efficiency underscores the necessity of develop-ing a workable measure of quality case processing in the courts.
91 There is a contrary point of view based on confusion over the term efficiency. Basically, thecounterargument is that timeliness is in conflict with quality and that every case deserves as muchtime as every other case. This contrary point of view, of course, fails to fully consider the concept ofscarcity, the sad fact that to get more of any good we must forego other valued goods. Bazelon(1971), for example, rejects as meaningless the notion of a trade-off between quality and efficiency.We agree. The proper trade-off is between quality and other valued goods such as timeliness, be-cause efficiency is defined as the optimal trade-off between valued scarce goods.