efficiency targets for 2020 and towards the implementation ... · Assessment of the progress made...
17
EN EN EUROPEAN COMMISSION Brussels, 18.11.2015 COM(2015) 574 final REPORT FROM THE COMMISSION TO THE EUROPEAN PARLIAMENT AND THE COUNCIL Assessment of the progress made by Member States towards the national energy efficiency targets for 2020 and towards the implementation of the Energy Efficiency Directive 2012/27/EU as required by Article 24 (3) of Energy Efficiency Directive 2012/27/EU {SWD(2015) 245 final}
Transcript of efficiency targets for 2020 and towards the implementation ... · Assessment of the progress made...

EN EN
EUROPEAN COMMISSION
Brussels, 18.11.2015
COM(2015) 574 final
REPORT FROM THE COMMISSION TO THE EUROPEAN PARLIAMENT AND
THE COUNCIL
Assessment of the progress made by Member States towards the national energy
efficiency targets for 2020 and towards the implementation of the Energy Efficiency
Directive 2012/27/EU as required by Article 24 (3) of Energy Efficiency Directive
2012/27/EU
{SWD(2015) 245 final}
2
Table of contents
1. Introduction ..................................................................................................................................... 3
2. Progress towards the 2020 EU energy efficiency target ................................................................. 3
3. National targets ............................................................................................................................... 4
4. Energy consumption trends and assessment of national measures by sector ............................... 5
4.1. Industry .................................................................................................................................... 5
4.2. Residential sector .................................................................................................................... 6
4.3. Services sector ......................................................................................................................... 8
4.4. Public sector ............................................................................................................................ 8
4.5. Transport sector ...................................................................................................................... 9
4.6. Generation sector .................................................................................................................. 10
4.7. State of transposition of the EED .......................................................................................... 11
4.8. Financing ............................................................................................................................... 11
4.9. Final energy savings in 2016 required by the Energy Services Directive 2006/32/EC .......... 13
5. CONCLUSION ................................................................................................................................. 13
Annex I ................................................................................................................................................... 16
Annex II .................................................................................................................................................. 17
3
1. INTRODUCTION
The Energy Union Strategy1 called for a fundamental rethinking of energy efficiency, to treat
it as an energy source in its own right, representing the value of energy saved. Focusing on
energy efficiency as a way of moderating energy demand delivers on the objectives of
security of supply, competitiveness and sustainability, and results in cost savings for
consumers and industry.
The Energy Union Strategy confirmed the energy efficiency target of 20 % by 2020, which
means less than 1086 Mtoe of final energy consumption or less than 1483 Mtoe of primary
energy consumption. This is the basis for moving forward to a reduction of at least 27 % by
2030 to be reviewed by 2020, having in mind a figure of 30 %.
In 2014, the Commission concluded in its Energy Efficiency Communication (COM(2014)
520 final) that the EU would achieve energy savings of around 18-19 % in 2020. Since then
Member States have made improved efforts to implement EU energy efficiency legislation
and have set more ambitious energy efficiency targets (now adding up to 17.6 % primary
energy saving in 2020, last year the targets added to only 16.4 %). On this basis the
Commission remains optimistic that the 20 % target will be achieved provided existing EU
legislation is fully implemented, Member States increase their level of ambition and the
investment conditions for energy efficiency continue to improve across Europe.
This report gives an assessment of progress made towards this target as well as the
implementation of the Energy Efficiency Directive 2012/27/EU. It includes some
recommendations for Member States2 and is based on Member States’ Annual Reports and
the National Energy Efficiency Action Plans. This report is accompanied by a staff working
document3 which contains a detailed description of the used performance indicators.
2. PROGRESS TOWARDS THE 2020 EU ENERGY EFFICIENCY TARGET
There has been significant progress in reducing energy consumption at EU level. Overall,
final energy consumption decreased by 7 % between 2005 and 2013. Primary energy
consumption decreased by 8 % in the same period and preliminary estimates show a
continuation of this declining trend to 1516 Mtoe in 2014.4
Final energy consumption5 in the EU-28 dropped from 1186 Mtoe in 2005 to 1102 Mtoe in
2012, but increased to 1105 Mtoe in 2013. The increase in 2013 was mainly due to increases
in Belgium, the Czech Republic, Germany, Ireland, France, Hungary, the Netherlands,
Austria, Slovakia and the United Kingdom.6
The energy consumption of industry decreased in absolute terms from 327 Mtoe in
2005 to 275 Mtoe in 2012 (16 %). Overall, the economic crisis, restructuring effects of
the European economies and energy efficiency measures contributed considerably to
1 COM(2015) 80 final. 2 As required by Article 24(3) Energy Efficiency Directive 2012/27/EC. 3 SWD(2015) 245 final. 4 See European Environmental Agency (2015): Trends and projections in Europe 2015
(http://www.eea.europa.eu). 5 Final energy consumption is the energy supplied to industry, transport, households, services and agriculture
excluding deliveries to the energy transformation sector and the energy industries themselves. 6 Member States are required by Annex XIV of the EED to explain the reasons for an increase in energy
consumption by sector in their Annual Reports, e.g. economic growth, weather. However, not all Member States
provided information on this.

4
this downward trend. Nevertheless, the energy consumption of industry increased to
277 Mtoe in 2013. This was due to an increase in several industrial subsectors, the
highest of which was a 6 % increase in the mining and quarrying sector.
In the residential sector, final energy consumption decreased by 3 % in 2013
compared to the level of 2005.
In the services sector, final energy consumption increased by 6% from 2005 to 2013,
but the added value created in this sector increased by 11 % over the same time which
resulted in an improved energy intensity.
Final energy consumption in transport decreased by 6 % over this period. In 2013,
transport accounted for the biggest share of final energy consumption (32 %). It was
followed by the residential sector with 27 %, industry with 25 % and the services
sector with 14%. Other sectors were responsible for the remaining 2 %.
Primary energy consumption7 in the EU-28 dropped from 1709 Mtoe in 2005 to 1567 Mtoe
in 2013. Preliminary estimates show that primary energy consumption continues declining in
2014 to 1516 Mtoe8. However, Belgium, Denmark, Germany, Estonia, France, Poland,
Portugal and Slovakia showed an increase in primary energy consumption in 2013 compared
to 2012.
Overall, the decrease in primary energy consumption in the EU-28 from 2005 to 2013
was primarily due to a drop in final energy consumption and was also influenced by
the structural change in the power generation sector towards more renewable
electricity. The energy consumption of the energy sector decreased by 13 % and
distribution losses fell by 8 % in this period.
The heat produced by CHP plants in the EU-28 decreased by 9 % from 46 Mtoe in
2005 to 42 Mtoe in 2013.
3. NATIONAL TARGETS
In 2013, Member States identified national indicative targets for energy efficiency.9 Since
then, Austria, Bulgaria, Croatia, Cyprus, Greece, Hungary, Italy, Slovakia and Spain have set
more ambitious targets in their 2014 National Energy Efficiency Action Plans for final energy
consumption, focusing on a larger decrease of demand in the residential, services, industrial
and transport sectors. Only Malta and Poland have notified less ambitious final energy
consumption targets to the Commission. The objective of energy efficiency is to decouple
energy consumption from economic growth due to efficiency gains. In this context, the level
of the indicative targets set by Croatia, Cyprus, Finland, Greece, Italy, Portugal and Romania
are not ambitious enough as final energy consumption is projected to be higher than the
forecast GDP development from 2014 to 2020.10
As regards primary energy consumption, Cyprus, France, Greece, Hungary, Ireland, Malta,
Spain and Sweden have set more ambitious indicative targets in their 2014 National Energy
Efficiency Action Plans compared to their initial targets. In particular Austria, Belgium,
France, Germany, Malta, the Netherlands, Sweden and the United Kingdom have set
themselves ambitious targets in light of the GDP growth expected in 2014-2020. Bulgaria,
7 In addition to final energy consumption, primary energy consumption also includes generation and
transformation losses, the consumption of the energy transformation sector and network losses. 8 See European Environmental Agency (2015): Trends and projections in Europe 2015
(http://www.eea.europa.eu). 9 Under Article 3 of the Energy Efficiency Directive 2012/27/EU (EED). 10 The detailed analysis can be found in SWD(2015) 245 final.
5
Croatia and Slovakia have reduced their level of ambition. For Croatia, Finland, Greece and
Romania the indicative primary energy consumption targets for 2020 would allow an increase
of primary energy consumption, at a rate higher than their expected average GDP growth in
2014-2020.11
Collectively, Member States have failed to set national energy efficiency targets ambitious
enough to add up to the 20% EU level target. The sum of the national indicative targets
corresponds to 17.6 % primary energy savings compared to projections for 2020. While this
represents a welcome improvement compared to the first set of notified targets, it still falls
short of the EU target to save 20 % of primary energy compared to projections in 2020.
However, data on recent progress suggest that a more optimistic conclusion can be drawn.
4. ENERGY CONSUMPTION TRENDS AND ASSESSMENT OF NATIONAL MEASURES BY
SECTOR
To assess Member States’ progress towards their indicative energy efficiency targets, the
Commission analysed their National Energy Efficiency Action Plans (NEEAPs), Annual
Reports and the set of indicators described in more detail in the accompanying staff working
document12
. The analysis shows that most Member States decreased their primary and final
energy consumption between 2005 to 2013 at a rate that was higher than the rate of decrease
which would be needed in the period 2005 to 2020 for them to meet their primary and final
energy consumption targets by 2020. The exceptions are: Belgium, Estonia, France, Germany,
the Netherlands, Poland and Sweden (for primary energy consumption) and Austria, Belgium,
Estonia, France, Germany, Lithuania, Malta and Slovakia (for final energy consumption).13
Primary energy intensity14
for the whole economy decreased in all Member States on average
between 2005 and 2013, except in Estonia.
4.1. Industry
The final energy consumption of industry decreased in absolute terms from 327 Mtoe in 2005
to 277 Mtoe in 2013 (-15 %). The decrease between 2008 and 2012 can be explained by a
decrease of industrial activity and changes in the structure of the industry. However, energy
efficiency improvements contributed most to this positive trend with an almost three times
bigger impact.15
11 The detailed analysis can be found in SWD(2015) 245 final. 12 SWD(2015) 245 final. 13 As only 2013 data are available, this comparison cannot take into account the impact of recently implemented
energy efficiency measures on meeting the new obligations under the EED, nor the impact of some of the
measures recently adopted under Ecodesign, energy labelling and the Energy Performance of Buildings
Directive (2010/31/EU). In addition, this comparison does not make it possible to carry out a conclusive
assessment of whether Member States are on track to meet their indicative 2020 energy efficiency targets. This is
because the future effects (positive or negative) of changes in the economy (e.g. an increase/decrease of
economic activity or a shift from energy intensive industries to the service sector), changes in energy prices, fuel
switching or climate variations cannot be foreseen until 2020. See: European Environment Agency (2014):
Trends and projections in Europe 2014 (http://www.eea.europa.eu/publications/trends-and-projections-in-
europe-2014) and Staff Working Document (2015) 245 final. 14 Energy intensity is defined as primary energy consumption divided by GDP. An analysis of drivers for energy
intensity improvements can be found in 'Member States' Energy Dependence: An Indicator-Based Assessment',
ECFIN Occasional Papers 196, June 2014. 15 PwC/Fraunhofer ISI/TU Wien (2014): Study evaluating the current energy efficiency policy framework in the
EU and providing orientation on policy options for realising the cost-effective energy efficiency/ saving potential

6
As economic growth is expected in most Member States in the coming years, more efforts
will be needed to ensure the decoupling of energy consumption from economic growth. In
addition, lower oil and gas prices could reduce the incentive for energy efficiency investments
in this sector as the payback period gets longer.
There is a significant difference between the energy intensity of industry in different Member
States, with a sevenfold difference between the most energy-intensive Member State, Bulgaria
and the least energy-intensive ones: Denmark and Ireland. Most Member States decreased
energy intensity in the industry and construction sectors from 2005 to 2013, with the
exceptions being Greece, Hungary, Ireland and Latvia.
The European emission trading system has been an important driver of energy efficiency
investments in the energy-intensive industry sectors. Furthermore, most Member States
support the energy efficiency of industry through financial incentives and fiscal measures.
Voluntary agreements are another common policy instrument for the industry sector. Nine
Member States have set up such agreements with industry actors: Belgium, Denmark,
Finland, Ireland, Luxembourg, the Netherlands, Portugal, Sweden and the United Kingdom.
Energy savings in the industry sector are also achieved with the help of market-based
instruments, e.g. in Italy through the white certificate scheme and in Denmark through the
energy saving obligation scheme.
The implementation of Article 8(4) of the EED, which requires large companies to carry out
energy audits from 2015 onwards, can help the industrial sector to identify cost-efficient
energy efficiency measures. However, around half of the Member States have not yet notified
the Commission of national legislation transposing this EED requirement; the Commission
has therefore started infringement procedures against these countries.
Member States should also address their policies towards small- and medium-sized companies
to remove market barriers and enable them to exploit any remaining energy efficiency
potential.
4.2. Residential sector
The final energy consumption of the residential sector decreased in absolute terms from 306
Mtoe in 2005 to 296 Mtoe in 2013 (-3 %), although it slightly increased from 2012 to 2013.
The overall decrease was mainly due to energy efficiency measures, especially in relation to
space heating energy consumption.16
Energy consumption per square metre decreased in all Member States between 2005 and 2013
except in Italy, where it increased by 10 %, and Estonia, where it was constant.17
The lower
energy consumption per square metre could be explained by more stringent energy efficiency
requirements for buildings, appliances and heating technologies, partly due to the progressive
implementation of the Energy Performance of Buildings Directive.
until 2020 and beyond, Figure 18 (https://ec.europa.eu/energy/sites/ener/files/documents/2014_report_2020-
2030_eu_policy_framework.pdf). 16 See Odyssee-Mure http://www.odyssee-mure.eu/publications/efficiency-by-sector/household/household-
eu.pdf. 17 See Odyssee-Mure database: http://www.indicators.odyssee-mure.eu/online-indicators.html. The increase in
Italy is due to a revision of the biomass consumption in recent years according to the Odyssee-Mure (2015):
Energy Efficiency Trends and Policies in Buildings.
https://ec.europa.eu/energy/sites/ener/files/documents/2014_report_2020-2030_eu_policy_framework.pdf

7
Member States recently prepared a first long-term renovation strategy for their entire building
stock, as required by Article 4 of the EED.18
Although some strategies were missing certain
information, for example on non-residential buildings, investment costs and sources of
funding, the quality of the long-term renovation strategies is expected to improve in the next
update which is due in 2017.
To improve the quality of renovation, installers and craftsmen need to be trained and their
skills in new and more efficient technologies that could replace existing equipment and
processes in construction and renovation needs to be increased. The implementation of
national qualification and training roadmaps developed under the EU 'BUILD UP Skills'
project have started in 21 Member States in 2013 and 2014 already.19
In addition, other
national training measures have been described in the NEEAPs but further, targeted efforts
are needed in this area.
Energy efficiency in the residential sector benefits from a wide range of policy actions, such
as regulatory and financial/fiscal measures, as well as information- and awareness-raising
measures, voluntary agreements, infrastructure investment (smart-metre roll outs), market-
based instruments, and others. Regulatory measures mostly relate to the implementation of the
Energy Performance of Buildings Directive, including minimum energy performance
requirements and certificates for new and existing buildings and inspections of water boilers
and air conditioning systems, and the Ecodesign Directive, including energy efficiency
standards for appliances and equipment.
Financial and fiscal measures that support energy efficiency improvements include grants and
subsidies. A few Member States (France, Germany, Greece, the Netherlands and Portugal)
offer loan programmes. Tax relief on energy efficiency upgrades for households is reported
for Denmark, Finland, France, Germany, Greece, Italy, the Netherlands and Portugal. Six
Member States (Austria, Denmark, Estonia, Germany, the Netherlands and Sweden) have put
in place energy taxes that aim to change behavioural and investments in energy efficiency.
Smart metres are being rolled out to residential customers in Austria, Cyprus, Denmark,
Finland, France, Greece, Ireland, Latvia, Malta and the United Kingdom.
The energy efficiency obligation schemes focus mostly on the residential sector to achieve the
1.5 % annual end-use energy savings required by Article 7 of the EED. In total, 16 countries
have adopted or plan to adopt an energy efficiency obligation scheme. Most Member States
have chosen to apply the allowed exemptions to achieve the maximum permitted reduction of
25 % (except for Denmark, Portugal and Sweden).20
This reduces the amount of energy
savings which will be achieved by 2020. The Commission also recognises a weak
implementation of this article in some countries as many Member States rely on old measures,
the implementation of the notified measures are delayed, expected savings are overestimated
or overlapping effects of different policies are not taken into account correctly. Therefore, the
Commission will follow the further implementation of this article closely.
Member States need to better inform consumers about energy efficiency options and to further
improve the investment conditions for private consumers to accelerate the currently very low
renovation rates for the existing building stock in Europe. Targeted measures are needed in
18 The long-term renovation strategies of Member States are published under
http://ec.europa.eu/energy/en/topics/energy-efficiency-directive/buildings-under-eed. 19 See www.buildupskills.eu. 20 The EED allows for certain exemptions to lower the required amount of 1.5 % of annual end-use energy
savings, to exclude the energy used in industrial activities listed in Annex I to Directive 2003/87/EC from the
calculation of the baseline, to count savings from early actions or savings in the energy transformation,
distribution and transmission sector under Article 7(2) EED.

8
this sector as households have a lower responsiveness to increasing energy prices than e.g.
energy-intensive industry. In addition, more focused measures are needed for vulnerable
consumers to address fuel poverty effectively and to improve living standards, for example,
measures such as interest-free loans and addressing the tenant-landlord dilemma would be
beneficial.
4.3. Services sector
The final energy consumption of the service sector increased in absolute terms from 144 Mtoe
in 2005 to 153 Mtoe in 2013 (6 %), However, energy consumption grew more slowly than the
added value over the same period (11 %). Overall, the energy intensity of the EU services
sector (normalised with heating degree days) decreased by 4 % between 2005 and 2013,
mainly in Austria (20 %), Hungary (26 %), Ireland (37 %) and Portugal (21 %) which is a
very positive trend. However, Bulgaria, Croatia, Finland, Greece, Italy, Luxembourg and
Spain increased their energy intensity in 2013 compared to 2005 levels.
Most of the regulatory measures applied in the residential sector also apply in the services
sector.
As the services sector is expected to grow, Member States will need to tackle its challenges
further with appropriate measures to continue the positive trend of its decreasing energy
intensity across the EU.
4.4. Public sector
Article 5(1) of the EED requires Member States to renovate 3 % of the total floor area of
heated and cooled buildings owned and occupied by central government, or to achieve
equivalent savings per year. 18 Member States will implement the requirements of Article 5
through alternative measures (such as measures that create incentives for occupants to change
their behaviour); the others have opted for the default approach of renovating 3 % of the total
floor area. Member States are obliged to report in their Annual Reports the total building floor
area of buildings which did not meet the requirements of Article 5(1) of the EED and the
renovated floor area or the amount of energy savings achieved under Article 5(1) and 5(6) of
the EED in the previous year. Most Member States provided some information on this in their
2015 Annual Reports; Greece, France, Hungary, the Netherlands and Slovenia did not provide
any information on this.21
Data on the total building floor area of the buildings which did not
meet the energy performance requirements under Article 5 were provided in most of the times
but data on the savings through the renovations (or alternative measures) of buildings owned
by the central government which are obligatory from 1 January 2014 on were missing or
unclear in most of the Annual Reports. Therefore, is not possible yet to assess if Member
States fulfilled their obligations in 2014 in line with Article 5 EED but the Commission will
follow the proper implementation closely.
Under Article 6 EED, Member States must ensure that central governments purchase only
products, services and buildings that have a high energy-efficiency. All Member States have
presented the measures needed to ensure that this happens, but measures to encourage other
public bodies to do likewise were missing in the NEEAPs for Belgium, Italy and Spain. The
Commission has launched a study to assess the effectiveness of this provision. Interim results
show that energy efficiency requirements in public procurement are not fully understood by
all procurement agents and that the transposition of the requirements of Article 6 EED is not
yet finalised in some countries. According to Member States, other barriers include:
21 See http://ec.europa.eu/energy/en/topics/energy-efficiency/energy-efficiency-directive/national-energy-
efficiency-action-plans.
9
authorities’ lack of skills and practical know-how on energy efficient public procurement;
lack of clear guidance and a shortage of practical toolkits; and unclear criteria for public
procurement assessments. The Commission will therefore look into ways to better assist
Member States in implementing this provision.
4.5. Transport sector
The final energy consumption in transport22
of the EU-28 decreased from 370 Mtoe in 2005 to
349 Mtoe in 2013 (-6 %). This reflects an increase of 4 % during 2005-2007 but a rapid
decrease since then (-9 % for 2007-2013).
About 40 % of the 2007-2013 reduction is estimated to be due to the economic crisis, with
stabilisation of passenger traffic and a fall in freight traffic. The remaining 60 % mostly
originates from improvements in the energy efficiency of passenger cars, driven by stricter
CO2 standards and targeted transport policies in Member States (which were also notified in
some cases as transport measures under Article 7 EED to reduce final energy consumption).23
The highest reductions in final energy consumption in the transport sector were registered in
Greece, Ireland and Spain in the period 2005-2013. Consumption increased slightly in
Croatia, Finland and Germany and a considerable increase was recorded in Lithuania, Malta,
Poland, Romania, Slovakia and Slovenia.24
In 2013, the share of collective passenger transportation increased in half of the Member
States: Austria, Belgium, Croatia, Czech Republic, Finland, Greece, Hungary, Luxembourg,
the Netherlands, the United Kingdom, Portugal, Slovenia, Spain and Sweden. In the rest of
the Member States the share of passenger cars increased.25
Regarding freight transport,
Austria, Belgium, Denmark, Finland, Germany, Italy, the Netherlands, Portugal, Romania,
Sweden and the United Kingdom increased the share of railway and inland waterways freight
transport in 2013 compared to 2005 levels.
Member States support efficiency in both private and public transport through improvement
of vehicle efficiency and reduced CO2 emissions compliant to the EU CO2-standards, shift
towards more environmentally friendly means of transport (e.g. rail or other means of public
transport), consumer information and behaviour.
For public transport, Bulgaria, Czech Republic, Denmark, France, Italy, Latvia, Portugal,
Sweden and the United Kingdom reported measures targeting rail transport in their NEEAPs.
Energy efficiency requirements for taxis have been established in Denmark. The extension of
metro transport has been reported by Bulgaria, Czech Republic, Denmark, Greece and Italy.
The promotion of modal shift and encouragement to use public transport or cycling and
walking has been mentioned by Belgium, Ireland and Portugal. Private transport measures
include improvements in car fleet efficiency, measures supporting the use of electric,
hydrogen or more fuel-efficient cars, developing bicycle lanes etc. Financial incentives to buy
22
Excluding pipeline transport. 23 Odyssee-Mure (2015): Trends and policies for energy savings and emissions in transport (available at:
http://www.odyssee-mure.eu/publications/br/energy-efficiency-in-transport.html). 24 Most of the increase originated from the road transport. Comparison between Member States have to be
undertaken with caution because final energy consumption is based on the fuels sold rather than on the fuel used
on the territory of a country. Therefore, factors other than energy efficiency come into play e.g. the degree to
which a given Member State is a ‘transit country’ for road transport or a hub for aviation. Official statistics (e.g.
on the split of final energy by passenger and freight transport) are not available at this stage for providing
meaningful energy intensity indicators but data availability will be further explored in the future. 25 No data was available for Cyprus and Malta.
10
energy efficient vehicles are provided by Croatia, Luxemburg and Spain (for electric cars) and
the Netherlands, while Denmark offers tax incentives for electric and hydrogen car owners
and owners who change to lower fuel consumption vehicles. Behaviour measures are also
mentioned for Finland, the Netherlands (driver training) and the United Kingdom. The shift of
freight transport towards more environmentally friendly modes such as rail, maritime
transport and inland waterways is also planned in France.
4.6. Generation sector
The decrease of primary energy consumption during the past years was due to a decrease in
final energy consumption, the implementation of the European emission trading system and a
structural change in the power generation sector. In particular, structural changes from
thermal power generation towards more renewable energy sources took place in the last years.
Efficiency in the generation sector is key to achieving the 2020 energy efficiency targets.
Energy efficiency in the generation sector contributes strongly to security of supply and
decarbonisation. Besides the European emission trading system targeted energy efficiency
policies can increase energy efficiency in this sector e.g. through the increase of the share of
heat and electricity produced with high-efficiency combined heat and power plants (CHP),
district heating and cooling, as well as renewable energies.
Member States have increased their efforts with regard to renewable energy in recent years. In
2013, the combined EU share of renewable energy reached 15 % and the estimate for 2014
indicates a 15.3 % share which contributed to a reduction in primary energy consumption as
most sources of renewable energy have 100 % transformation efficiency.26
Article 24(6) of the EED requires Member States to provide information on heat and
electricity produced from thermal power plants and, in particular, from CHP. For EU-28, the
heat produced from CHP plants decreased from 46 Mtoe in 2005 by 9 % to 42 Mtoe in 2013.
Given the efficiency gains and contribution to industrial productivity, additional effort is
needed from Member States to increase the share, in particular, of high-efficiency CHP
plants.
Article 14 of the EED sets a framework to trigger investment in efficient district heating and
cooling. A positive trend can be observed in nine Member States, where the transformation
output from district heating plants increased on average between 2005 and 2013.
Nevertheless, in the remaining 12 Member States with district heating, a decreasing trend can
be observed.27 Therefore, to fully exploit the energy-efficiency potential in the generation
sector, the full implementation of Article 14 and the comprehensive assessments Member
States are required to undertake by end 2015 (analysing their potential for applying high-
efficiency cogeneration and efficient district heating and cooling) are of major importance.
26 See Renewable energy progress report COM(2015) 293 final. 27 No data is available for Cyprus, Greece, Ireland, Italy, Malta, Portugal and Spain.

11
Box 1: Good examples in Member States
4.7. State of transposition of the EED
Legal transposition of the EED is still not completed in many Member States, which prevents
some from reaching their indicative national 2020 targets, stops energy efficiency markets
from developing properly and prevents consumers and market actors from exploiting the full
benefits of energy efficiency. The full and proper implementation of the existing energy
efficiency legislative framework is key for achieving the EU-28's energy and climate targets
for 2020. To this end, the Commission has launched infringement procedures to ensure full
and correct transposition. Stronger efforts are required in this respect.
The Commission has so far sent 27 letters of formal notice and 20 reasoned opinions to
Member States for not notifying to the Commission all the national legislation necessary to
transpose each of the EED requirements. In addition, the Commission initiated bilateral
contacts with all 28 Member States requesting a substantial level of information on the
implementation of Article 7 of the EED.
4.8. Financing
The energy efficiency market has strong investment potential, but is still small, fragmented,
(deemed) risky, and (in particular as regards deep building renovations or efficiency
investments going beyond 3 years payback) relies predominantly on direct or indirect
subsidies.
Some Member States have embedded their ambitious national energy efficiency targets in
comprehensive long-term strategies like the German National Action Plan on Energy Efficiency (NAPE)
or the recently adopted bill on the transition énergétique in France.
The National Fund for Environmental Protection created in Poland successfully supports many energy
efficiency projects in various sectors and includes training aspects and the involvement of local and
regional authorities which helps create broad support for energy efficiency at all levels.
Romania has implemented an ‘Improving Energy Efficiency in Low-Income Households and
Communities programme’ in recent years to address fuel poverty effectively. This has helped some
160 000 people in Romania to live in more energy efficient apartment blocks, with lower heating bills. A
similar programme 'Better Energy Warmer Homes' has been established in Ireland.
Many Member States have established successful strategies to reduce in particular their primary energy
consumption: Malta is improving its generation sites and invests in new efficient generation capacities;
the British government supports through its heating strategy the deployment of new district heating in
cities that currently lack it; and Italy, Belgium and Germany have developed broad support-schemes for
highly-efficient CHP.
Belgium, Denmark, Finland, Ireland, Luxembourg, the Netherlands, Portugal, Sweden and the United
Kingdom have already established voluntary energy efficiency agreements to reduce energy
consumption and increase the competitiveness in the industry sector. Austria has created a successful
'Green Building Cluster' to increase productivity, competitiveness and innovation of companies in the
buildings sector in Lower Austria. In Sweden, for example, companies can receive a five year tax
exemption on electricity, if they participate in the voluntary scheme, which requires them to carry out an
energy audit, to implement an energy management system and to implement the measures identified in
the audit with a repayment period less than three years.
Bulgaria, Czech Republic, Denmark, France, Italy, Latvia, Portugal, Sweden and the United Kingdom
have already reported measures, for example, which target rail transport through improvements in the
rail infrastructure, electrification of railways and increasing the use of passenger railway systems.

12
The European Structural and Investment Funds (ESIF) are the largest EU financing source in
this area. In the last multi-annual financial framework (2007-2013), the EU allocated around
EUR 6.1 billion (2 % of the total European Regional Development Fund (ERDF)/Cohesion
Fund) to the ‘Energy efficiency, co-generation, energy management’ priority theme. More
than half of this EU funding (EUR 3.4 billion) was earmarked for energy efficiency in public
and residential buildings. In 2007-2013, 90 % of ESIF support for energy efficiency was
provided through grants, with loans representing only 8 % of EU support.
Energy efficiency also represents a high share of the available funding for the financial period
2014-2020. Out of EUR 45 billion, it is estimated that EUR 13.3 billion will be used to
support energy efficiency in public and residential buildings, helping almost 1 million
households. In addition, EUR 3.4 billion will be allocated to support energy efficiency in
businesses, with a focus on small and medium firms, leading to over 50 000 companies with
improved energy performance. However, implementing these funds will require high quality
projects and the mobilisation of private finance to address the investment needs for energy
efficiency (over EUR 100 billion a year28
). Therefore, the ESIF comes with a new narrative:
Grants should be used only to finance the funding gap, i.e. project investment costs that
cannot be covered by the expected energy savings within a reasonable timeframe, or to
address social issues, e.g. energy poverty. Rather than grants, financial instruments should be
used to reduce financing costs for projects that are close to being bankable. Public and private
funds must work together – to attract private capital and deliver more and larger energy
efficiency investments.29
In 2014-2020, the EU is aiming to double the use of financial
instruments in the form of loans, guarantees or equity. This change is expected to encourage
private financing and to help small-scale projects that predominate in the area of energy
efficiency.
Moreover, the creation of the European Fund for Strategic Investments (EFSI) in 2015
provides additional funding for Member States and project promoters to upscale and tune up
energy efficiency schemes (including those co-financed by the ESIF) – in particular by
pooling projects under larger investment operations.
The overall market framework has improved for consumer loans and mortgages, but key
issues related to energy efficiency financing still persist. In the EU, investment is influenced
by macro-economic conditions and the low-interest rate policy of the European Central Bank
(ECB). Since most European banks do not offer specific products for energy efficiency
investments, it can be assumed that the interest rates applied for loans that also finance energy
efficiency measures are following the downward trend of bank interest rates, as pursued by
the ECB. For instance, the latest ECB statistics shows that loans to households for
consumption (with collateral and/or guarantees) in August 2015 are rated in the range
3,30 % – 4,53 % (depending whether it is a floating or fixed rate). These rates have decreased
by around 22 % over the last year. There is a lack of market confidence in up-scaled energy
efficiency investment, as a specific ‘asset class‘. Such investment and its financing needs to
be based on wider fundamentals, including the ‘freed‘ cash flow of operators (due to lower
energy costs) and increased asset value (due to its higher energy performance), and
underpinned by a predictable long-term investment framework.
28 See www.eefig.eu. 29
Grants should be only used where commercial financing would not work (low income groups, social housing,
energy poor). Grants should be combined with commercial finance so that final financing products are attractive
for the market.

13
4.9. Final energy savings in 2016 required by the Energy Services Directive
2006/32/EC
Directive 2006/32/EC required Member States to set – and aim to achieve – a national
indicative energy savings target of at least 9 % of final energy savings in 2016. Most of the
provisions in this Directive have been replaced by more precise provisions in the EED.
However, the requirements related to the 9 % target will not be repealed until 2017. So
Member States were required to provide information on their 2016 saving target in their 2014
NEEAPs: 19 Member States state that the required savings will be achieved by 2016; for 7
Member States it is not clear from the NEEAPs if the saving target will be achieved.30
5. CONCLUSION
The report demonstrates that Member States, in addition to a range of EU policy measures
(e.g. eco-design, labelling, EU ETS, car standards), have introduced energy efficiency
measures in the industry, residential, service, transport and generation sectors. The NEEAPs
show that most Member States have increased their effort and either strengthened existing
energy efficiency measures or introduced new ones.
Having in mind that the EU-28 needs to reduce primary energy consumption annually on
average by 11.9 Mtoe (2.7 Mtoe expressed in final energy consumption) from the 2013 level
to achieve its 2020 targets, it can be concluded that – despite the achievements of previous
years – additional efforts are needed in particular in the buildings, transport and generation
sectors. The performance indicators 2005-2013 used in this report to analyse progress on
energy efficiency show big variations between Member States – nevertheless, most have
improved at European level. The main exceptions are an increase in final energy consumption
from 2012 to 2013 and a decrease in heat generated by CHP plants between 2005 and 2013.
Even though some Member States increased their indicative energy efficiency targets
expressed in primary energy consumption recently (to a combined total of 17.6 %), the EU-
28 as a whole falls short of the required 20 % level. To close the remaining gap towards the
2020 target expressed in primary energy consumption, Member States should accelerate their
efforts in order to achieve their national energy efficiency targets for 2020 or to go beyond
them. It is worth noting that some Member States – Austria, Belgium, France, Germany,
Malta, the Netherlands, Sweden and the United Kingdom – have already set themselves
particularly ambitious targets. Croatia, Finland, Greece and Romania, which have set less
ambitious targets for 2020 in light of expected GDP growth in 2014-2020, could benefit from
assessing again how an increased level of energy efficiency could increase their security of
supply, competitiveness and sustainability.
Many Member States have established successful strategies to reduce their primary energy
consumption. However, Belgium, Estonia, France, Germany, the Netherlands, Poland and
Sweden will all need to reduce their primary energy consumption at a higher rate in 2014-
2020 than in the period 2005-2013 to meet their indicative primary energy consumption
targets by 2020.
For final energy consumption, the analysis in this report shows a decreasing trend in most
Member States from 2005 onwards. Besides energy efficiency policies the economic crisis
has of course contributed to this trend. Austria, Belgium, Estonia, France, Germany,
Lithuania, Malta and Slovakia have set themselves final energy consumption targets in 2020
that require rates of final energy consumption reduction in 2014-2020 which are higher than
30 The final NEEAPs of Hungary and Romania were notified in 2015 only. Therefore, a detailed analysis has not
yet taken place.

14
the reduction rate achieved in 2005-2013. These countries will depend on a strong
implementation of their Article 7 EED obligation schemes or alternative measures that enable
consumers to save final energy and money in the short and long term.
Looking at the sectors on Member State level, the overall positive trend in final energy
intensity in industry in most Member States is encouraging. However, with regard to energy
intensity, there is a seven-fold difference between the Member State with the highest and
lowest energy intensity in industry. There could be scope for Cyprus, Ireland, Greece,
Hungary and Latvia to draw on positive examples in other Member States to reverse their own
increasing trend in final energy intensity in industry.
In the residential sector, most Member States reduced energy demand in recent years by
implementing energy efficiency measures targeting this sector. This helps households to
achieve the same comfort level for less money. Consumers could benefit from a stronger
focus on policies to reduce the energy consumption in the residential sector in Belgium,
Estonia, Italy, Latvia, Malta, Poland, Romania and Slovenia where the energy consumption
per capita increased on average over the past years. In general, to empower consumers to
reduce their energy consumption, all Member States need to better inform them about energy
efficiency options and further improve investment conditions for them to accelerate the
currently very low renovation rates for the existing building stock in Europe. In addition,
more focused measures are needed for consumers to address fuel poverty effectively.
As the services sector is expected to grow, targeted energy efficiency measures could help
counterbalance the increase of final energy consumption in this sector and continue the
sector's positive trend of decreasing energy intensity at EU level. In particular, Cyprus,
Belgium, Finland France, Greece, Italy, Luxembourg and Spain could try to set up or increase
the intensity of appropriate measures to counterbalance the recent increase in energy intensity
in their services sector.
The shift towards a higher use of collective transportation for passengers and share of railway
and inland waterways for freight transport needs to be encouraged through further efforts in
the transport sector. Despite recent progress on energy efficiency and the reduction in
transport energy demand, transport's overall high share in final energy consumption at EU-28
level makes further energy efficiency action needed to meet the 2020 objectives. Therefore,
the Commission recommends that Member States implement forcefully the transport
measures described in their NEEAPs and take further action to decrease energy consumption
in the transport sector. Member State action for promoting alternative fuels, vehicles/vessels
and deploying the related infrastructure (following the requirements of the Directive
2014/14/EU) should further support energy efficiency improvements in transport. A
Communication on actions needed to decarbonise the transport sector has been announced by
the Commission in the Energy Union Roadmap and will further complement Member States
efforts.
In general, Member States need to increase their energy efficiency efforts to ensure that they
achieve their indicative targets by 2020 or go even beyond them to ensure that the European
Union meets its 20 % reduction target by 2020. This underlines the need to fully implement
the European legislative framework for energy efficiency. This enables energy efficiency
service markets to develop and the removal of existing market barriers for energy efficiency
investments. But also the implementation of the legislative framework related to greenhouse
gas reductions e.g. in the non-ETS sector or the recently adopted Market Stability Reserve for
the ETS sector are key as the two policy areas are interlinked and are reinforcing each other.
With a view to the 2030 targets, the Commission will assess in 2016 how the energy
efficiency framework can be further improved, building on the already-reviewed product

15
efficiency framework and with a view to the significant contribution of (i) the Energy
Performance of Buildings Directive and (ii) the Energy Efficiency Directive (especially its
Article 7). This review should help all stakeholders (national governments, regions, local
authorities, energy efficiency companies, financial institutions, consumers, etc.) exploit cost-
efficient energy saving potentials in the long-term with regard to the 2030 and 2050 EU
climate and energy targets and objectives.
The Commission will continue to closely follow Member States' progress towards their
indicative national energy efficiency targets for 2020 and the implementation of the EED and
update its assessment annually as part of the State of the Energy Union.
The Commission invites the European Parliament and Council to express their views on this
assessment.

16
ANNEX I
Table 1: Indicative national energy efficiency target for 2020
Member State
Absolute level of energy consumption in 2020 [Mtoe] as notified by Member States
in 2013, in the NEEAP 2014 or in a separate notification to the European
Commission in 2015
PRIMARY energy consumption FINAL energy consumption
Austria 31.5 25.1
Belgium 43.7 32.5
Bulgaria 16.9 8.6
Croatia 11.5 7.0
Cyprus 2.2 1.8
Czech Republic 39.6 25.3
Denmark 17.8 14.8
Estonia 6.5 2.8
Finland 35.9 26.7
France 219.9 131.4
Germany 276.6 194.3
Greece 24.7 18.4
Hungary 24.1 14.4
Ireland 13.9 11.7
Italy 158.0 124.0
Latvia 5.4 4.5
Lithuania 6.5 4.3
Luxembourg 4.5 4.2
Malta 0.7 0.5
Netherlands 60.7 52.2
Poland 96.4 71.6
Portugal 22.5 17.4
Romania 43.0 30.3
Slovakia 16.4 9.0
Slovenia 7.3 5.1
Spain 119.8 80.1
Sweden 43.4 30.3
United Kingdom 177.6 129.2
Sum of indicative targets
EU-28 1526.9 1077.5
EU-28 target 2020 1483 1086
Status: 07/10/2015
17
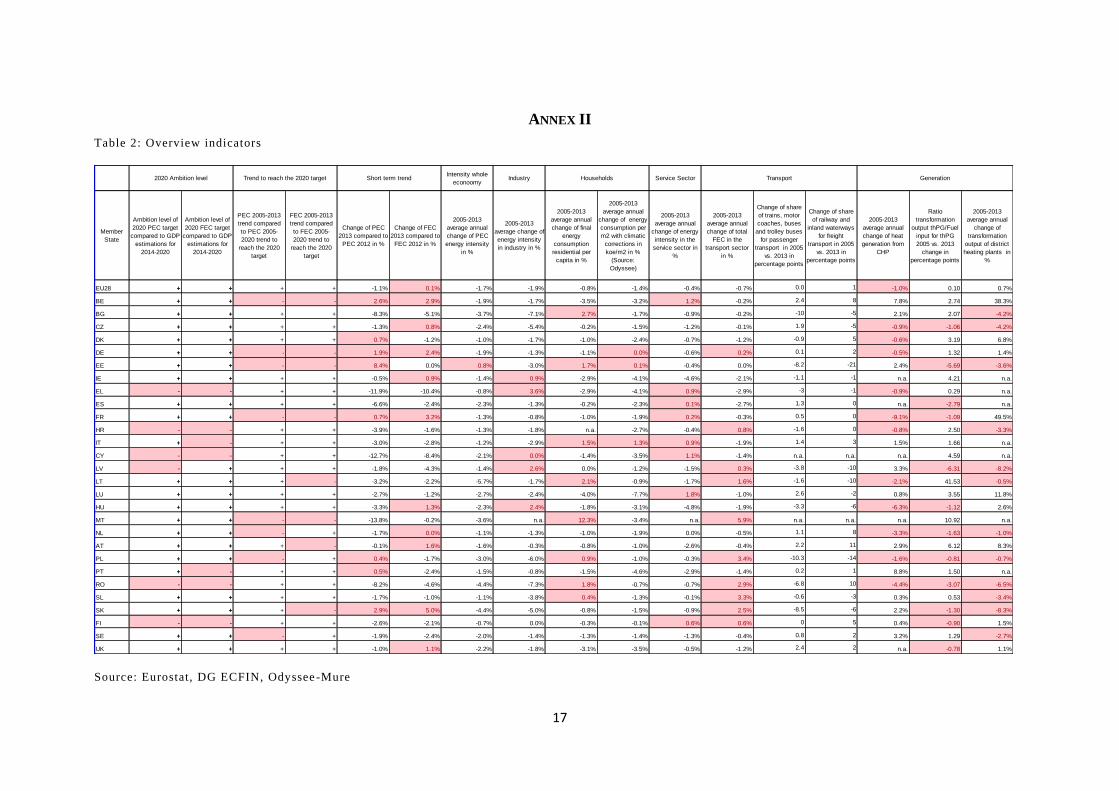
ANNEX II
Table 2: Overview indicators
Source: Eurostat, DG ECFIN, Odyssee -Mure
Intensity whole
econoomyIndustry Service Sector
Member
State
Ambition level of
2020 PEC target
compared to GDP
estimations for
2014-2020
Ambition level of
2020 FEC target
compared to GDP
estimations for
2014-2020
PEC 2005-2013
trend compared
to PEC 2005-
2020 trend to
reach the 2020
target
FEC 2005-2013
trend compared
to FEC 2005-
2020 trend to
reach the 2020
target
Change of PEC
2013 compared to
PEC 2012 in %
Change of FEC
2013 compared to
FEC 2012 in %
2005-2013
average annual
change of PEC
energy intensity
in %
2005-2013
average change of
energy intensity
in industry in %
2005-2013
average annual
change of final
energy
consumption
residential per
capita in %
2005-2013
average annual
change of energy
consumption per
m2 with climatic
corrections in
koe/m2 in %
(Source:
Odyssee)
2005-2013
average annual
change of energy
intensity in the
service sector in
%
2005-2013
average annual
change of total
FEC in the
transport sector
in %
Change of share
of trains, motor
coaches, buses
and trolley buses
for passenger
transport in 2005
vs. 2013 in
percentage points
Change of share
of railway and
inland waterways
for freight
transport in 2005
vs. 2013 in
percentage points
2005-2013
average annual
change of heat
generation from
CHP
Ratio
transformation
output thPG/Fuel
input for thPG
2005 vs. 2013
change in
percentage points
2005-2013
average annual
change of
transformation
output of district
heating plants in
%
EU28 + + + + -1.1% 0.1% -1.7% -1.9% -0.8% -1.4% -0.4% -0.7% 0.0 1 -1.0% 0.10 0.7%
BE + + - - 2.6% 2.9% -1.9% -1.7% -3.5% -3.2% 1.2% -0.2% 2.4 8 7.8% 2.74 38.3%
BG + + + + -8.3% -5.1% -3.7% -7.1% 2.7% -1.7% -0.9% -0.2% -10 -5 2.1% 2.07 -4.2%
CZ + + + + -1.3% 0.8% -2.4% -5.4% -0.2% -1.5% -1.2% -0.1% 1.9 -5 -0.9% -1.06 -4.2%
DK + + + + 0.7% -1.2% -1.0% -1.7% -1.0% -2.4% -0.7% -1.2% -0.9 5 -0.6% 3.19 6.8%
DE + + - - 1.9% 2.4% -1.9% -1.3% -1.1% 0.0% -0.6% 0.2% 0.1 2 -0.5% 1.32 1.4%
EE + + - - 8.4% 0.0% 0.8% -3.0% 1.7% 0.1% -0.4% 0.0% -8.2 -21 2.4% -5.69 -3.6%
IE + + + + -0.5% 0.9% -1.4% 0.9% -2.9% -4.1% -4.6% -2.1% -1.1 -1 n.a. 4.21 n.a.
EL - - + + -11.9% -10.4% -0.8% 3.6% -2.9% -4.1% 0.9% -2.9% -3 -1 -0.9% 0.29 n.a.
ES + + + + -6.6% -2.4% -2.3% -1.3% -0.2% -2.3% 0.1% -2.7% 1.3 0 n.a. -2.79 n.a.
FR + + - - 0.7% 3.2% -1.3% -0.8% -1.0% -1.9% 0.2% -0.3% 0.5 0 -9.1% -1.09 49.5%
HR - - + + -3.9% -1.6% -1.3% -1.8% n.a. -2.7% -0.4% 0.8% -1.6 0 -0.8% 2.50 -3.3%
IT + - + + -3.0% -2.8% -1.2% -2.9% 1.5% 1.3% 0.9% -1.9% 1.4 3 1.5% 1.66 n.a.
CY - - + + -12.7% -8.4% -2.1% 0.0% -1.4% -3.5% 1.1% -1.4% n.a. n.a. n.a. 4.59 n.a.
LV - + + + -1.8% -4.3% -1.4% 2.6% 0.0% -1.2% -1.5% 0.3% -3.8 -10 3.3% -6.31 -8.2%
LT + + + - -3.2% -2.2% -5.7% -1.7% 2.1% -0.9% -1.7% 1.6% -1.6 -10 -2.1% 41.53 -0.5%
LU + + + + -2.7% -1.2% -2.7% -2.4% -4.0% -7.7% 1.8% -1.0% 2.6 -2 0.8% 3.55 11.8%
HU + + + + -3.3% 1.3% -2.3% 2.4% -1.8% -3.1% -4.8% -1.9% -3.3 -6 -6.3% -1.12 2.6%
MT + + - - -13.8% -0.2% -3.6% n.a. 12.3% -3.4% n.a. 5.9% n.a. n.a. n.a. 10.92 n.a.
NL + + - + -1.7% 0.0% -1.1% -1.3% -1.0% -1.9% 0.0% -0.5% 1.1 8 -3.3% -1.63 -1.0%
AT + + + - -0.1% 1.6% -1.6% -0.3% -0.8% -1.0% -2.6% -0.4% 2.2 11 2.9% 6.12 8.3%
PL + + - + 0.4% -1.7% -3.0% -6.0% 0.9% -1.0% -0.3% 3.4% -10.3 -14 -1.6% -0.81 -0.7%
PT + - + + 0.5% -2.4% -1.5% -0.8% -1.5% -4.6% -2.9% -1.4% 0.2 1 8.8% 1.50 n.a.
RO - - + + -8.2% -4.6% -4.4% -7.3% 1.8% -0.7% -0.7% 2.9% -6.8 10 -4.4% -3.07 -6.5%
SL + + + + -1.7% -1.0% -1.1% -3.8% 0.4% -1.3% -0.1% 3.3% -0.6 -3 0.3% 0.53 -3.4%
SK + + + - 2.9% 5.0% -4.4% -5.0% -0.8% -1.5% -0.9% 2.5% -8.5 -6 2.2% -1.30 -8.3%
FI - - + + -2.6% -2.1% -0.7% 0.0% -0.3% -0.1% 0.6% 0.6% 0 5 0.4% -0.90 1.5%
SE + + - + -1.9% -2.4% -2.0% -1.4% -1.3% -1.4% -1.3% -0.4% 0.8 2 3.2% 1.29 -2.7%
UK + + + + -1.0% 1.1% -2.2% -1.8% -3.1% -3.5% -0.5% -1.2% 2.4 2 n.a. -0.78 1.1%
Trend to reach the 2020 target Households TransportShort term trend Generation2020 Ambition level