Utility Maximization, Choice, and Preference Fuad Aleskerov (State ...

The Behavior Analyst Today Consolidated Volume 10, Number 3 & 4
440
Efficiency of Forced Choice Preference Assessment: Comparing Multiple Presentation Techniques
Cheryl J. Davis, Michele D. Brock, Kristin McNulty, Mary L. Rosswurm, Benjamin Bruneau & Thomas Zane
Abstract
Determining effective reinforcers for individuals with disabilities is imperative for skill acquisition and behavior reduction. Various methodologies exist to determine reinforcer preference, and past research has shown that results vary across different techniques. The purpose of the current study was to assess which presentation methods were most efficient both in terms of time to complete the assessment and the identification of stimuli that functioned as reinforcers (i.e., strengthened responding). Six participants, aged 8-12 with autism and related disorders, demonstrated preferences of stimuli using different presentation methods. Researchers then made these stimuli contingent upon specific responses to determine which functioned as reinforcers. Presentation methods for four participants had similar results, suggesting that any presentation method can be utilized. Two participants had differing preference hierarchies. The high preference items of four participants were tested to see if highly chosen items functioned as reinforcers. High preference items functioned as a reinforcer for three of the four participants, regardless of presentation method. Keywords: autism, preference assessment, reinforcement
The preferences of individuals with developmental disabilities have been studied since Ferrari
and Harris (1981) investigated the reinforcing properties, limits, and motivating potentials of sensory stimuli among children with autism. Over the past twenty-eight years, research has improved preference assessment methods and enabled practitioners to more accurately assess preference.
Graff and Ciccone (2002) defined preference assessments as those methods that ... “… effectively
identify functional reinforcers for individuals with developmental disabilities” (p. 85). Penrod, Wallace, and Dyer (2008) wrote that “preference assessments produce a relative ranking of stimulus preferences that is based on the relative amount of time with which the stimuli were manipulated or the number of times one stimulus was chosen relative to other stimuli” (p.177).
Accurately identifying the preferences of individuals with severe disabilities is essential to their
skill acquisition and personal well-being. According to Parsons and Reid (1990), although the need to make choices is essential to one’s well-being, persons with developmental disabilities do not receive as many opportunities to make choices when compared to their typical counterparts. The identification of preferred items and activities that may serve as reinforcers for these individuals is critical when developing programming that will be the most effective at increasing desired skills while reducing challenging behaviors.
Many different methods have been utilized and developed to assess preference. Variations across
methods comprise three major factors : (1) how the stimuli are presented to the individual in order for a preference to be demonstrated, (2) the nature of the stimuli being presented, and (3) whether or not the individual has access to the selected item immediately upon selection.
With regard to how stimuli are presented during a preference assessment, there are distinctly
different procedures, including parent or caregiver surveys (questionnaires about what the individual likes), single stimulus presentation (when one item is presented at a time and engagement time is measured, Pace, Ivancic, Edwards, Iwata, & Page, 1985), multiple stimulus presentation with or without
The Behavior Analyst Today Consolidated Volume 10, Number 3 & 4
441
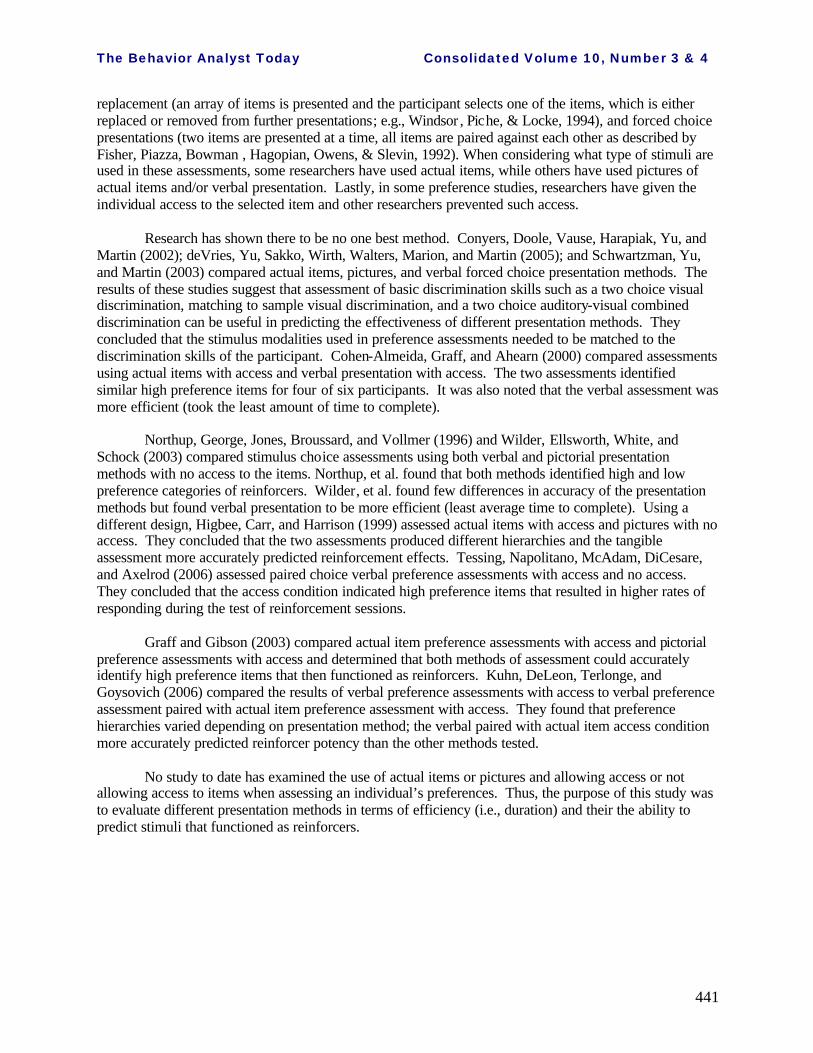
replacement (an array of items is presented and the participant selects one of the items, which is either replaced or removed from further presentations; e.g., Windsor , Piche, & Locke, 1994), and forced choice presentations (two items are presented at a time, all items are paired against each other as described by Fisher, Piazza, Bowman , Hagopian, Owens, & Slevin, 1992). When considering what type of stimuli are used in these assessments, some researchers have used actual items, while others have used pictures of actual items and/or verbal presentation. Lastly, in some preference studies, researchers have given the individual access to the selected item and other researchers prevented such access.
Research has shown there to be no one best method. Conyers, Doole, Vause, Harapiak, Yu, and
Martin (2002); deVries, Yu, Sakko, Wirth, Walters, Marion, and Martin (2005); and Schwartzman, Yu, and Martin (2003) compared actual items, pictures, and verbal forced choice presentation methods. The results of these studies suggest that assessment of basic discrimination skills such as a two choice visual discrimination, matching to sample visual discrimination, and a two choice auditory-visual combined discrimination can be useful in predicting the effectiveness of different presentation methods. They concluded that the stimulus modalities used in preference assessments needed to be matched to the discrimination skills of the participant. Cohen-Almeida, Graff, and Ahearn (2000) compared assessments using actual items with access and verbal presentation with access. The two assessments identified similar high preference items for four of six participants. It was also noted that the verbal assessment was more efficient (took the least amount of time to complete).
Northup, George, Jones, Broussard, and Vollmer (1996) and Wilder, Ellsworth, White, and
Schock (2003) compared stimulus choice assessments using both verbal and pictorial presentation methods with no access to the items. Northup, et al. found that both methods identified high and low preference categories of reinforcers. Wilder, et al. found few differences in accuracy of the presentation methods but found verbal presentation to be more efficient (least average time to complete). Using a different design, Higbee, Carr, and Harrison (1999) assessed actual items with access and pictures with no access. They concluded that the two assessments produced different hierarchies and the tangible assessment more accurately predicted reinforcement effects. Tessing, Napolitano, McAdam, DiCesare, and Axelrod (2006) assessed paired choice verbal preference assessments with access and no access. They concluded that the access condition indicated high preference items that resulted in higher rates of responding during the test of reinforcement sessions.
Graff and Gibson (2003) compared actual item preference assessments with access and pictorial
preference assessments with access and determined that both methods of assessment could accurately identify high preference items that then functioned as reinforcers. Kuhn, DeLeon, Terlonge, and Goysovich (2006) compared the results of verbal preference assessments with access to verbal preference assessment paired with actual item preference assessment with access. They found that preference hierarchies varied depending on presentation method; the verbal paired with actual item access condition more accurately predicted reinforcer potency than the other methods tested.
No study to date has examined the use of actual items or pictures and allowing access or not
allowing access to items when assessing an individual’s preferences. Thus, the purpose of this study was to evaluate different presentation methods in terms of efficiency (i.e., duration) and their the ability to predict stimuli that functioned as reinforcers.

The Behavior Analyst Today Consolidated Volume 10, Number 3 & 4
442
Method
Participants and Setting Six participants with a diagnosis of autism, PDD-NOS, mental retardation, and related disorders participated in the study. All participants attended a private day school that adhered to the principles of Applied Behavior Analysis (ABA). Assessments were conducted in the participants’ classrooms with familiar staff. Test of reinforcement were conducted in a separate room. Participants were selected for the study because they had similar diagnoses, ages, and skills. Thomas, Shawn, Dorothy, and Mitch (ages 9-11) were diagnosed with autism and mental retardation or related disabilities. Thomas, Dorothy, and Mitch primarily used speech to communicate, while Shawn used a combination of pictures and gestures. Mary and Herb (ages 8 and 11) were diagnosed with PDD-NOS with mental retardation or global developmental delays. Both used speech to communicate. Parents, teachers, and ABA counselors (staff) also participated in the study by completing preference assessment surveys and questionnaires. Procedure The general procedure involved soliciting information from staff and parents about which items the participants may have preferred, conducting four forced choice preference assessments, and conducting tests of reinforcement. Phase 1: Identification of stimuli to test
The purpose of this phase was to compile a list of preferred activities/toys and edib les that could serve as stimuli for use in forced choice preference assessments for each participant. The dependent variable was the number of times any one item was listed across all completed surveys.
One parent and all classroom staff completed a stimulus preference assessment survey for each participant. The survey was an open-ended response form where staff and parents listed items they thought the student liked to eat, drink, smell, listen to, play with, hold, read, and activities in which the participant liked to take part. Researchers then compiled the responses and the most frequently listed items were selected for inclusion in the preference assessments for each participant.
Research has found that food items consistently rank higher in preference assessments than activities (DeLeon, Iwata, & Roscoe, 1997, Bojak and Carr, 1999). Therefore, separate preference assessments were conducted for edibles and activities/toys. Each participant had eight items targeted in each preference assessment (see Table 1).
Table 1, Next Page!

The Behavior Analyst Today Consolidated Volume 10, Number 3 & 4
443
Table 1. Participant Stimuli
Thomas Pipe Cleaner Max The Minnow Tickles Dinosaur Legos Scooter Stethoscope Puzzle
Mary Barney Music “Ants Go Marching” Bouncing on beach ball Pretend laptop Having her hair put in a ponytail Teddy Bear Being chased Sesame Street music
Shawn Computer (Winnie the Pooh) Pin Toy Koosh Piano Toy Light-Up Toy TV (Winnie the Pooh) Squishy Rubber Toy Bouncing on Ball
Herb Hershey’s Kisses Pretzel Yoo-Hoo Skittle Marshmallow Sour Patch Kids Airhead Swedish Fish
Dorothy Water Hershey’s Kisses Coke M&M’s Smiley Fries Gummy Bears Goldfish Smartfood
Mitch Edible Apples Vanilla Ice Cream Pepsi Vanilla Frosting Pretzels Plain Potato Chips Rice Cakes Pears
Activity/Toy National Geographic Motorcycle Man Baseball Video Game Disney Book Koosh Sully TV Scooter
Phase 2: Forced Choice Preference Assessments There were two purposes for this phase. The first purpose was to systematically assess each participant’s preference for the stimuli included in their assessment to attain a preference hierarchy. The second purpose was to ascertain the most efficient method in terms of time to complete. We measured two dependent variables in this phase. One was the percentage of presentations the participant chose any one given stimuli during a forced choice preference assessment and the amount of time each type of assessment took to administer.

The Behavior Analyst Today Consolidated Volume 10, Number 3 & 4
444
Staff conducted four different preference assessment conditions, which were randomized across each of the six participants. The types of assessments were actual item with access, actual item with no access, picture with access, and picture with no access. Each assessment contained eight items. Edibles and activities/toys were not included in the same assessment. Three participants took part in activity/toy assessments, one participant took part in both edible and activity/toy assessments, and two participants took part in edible assessments. We presented each item with each of the other items in a systematically randomized order that counterbalanced for side preference and ensured each item was paired an equal number of times with every other item. A total of 56 trials were completed per assessment. Sessions were 10 trials each with at least 30 minutes between sessions. The criterion to terminate a session was two consecutive trials where the participant made no choice or engaged in challenging behaviors. All four assessment conditions were timed for five of the participants.
For two of the participants, a social story was utilized during the no access conditions in order to
increase the chances that they would be compliant during these conditions. The participants were made aware that they were not going to get the selected items, but that they could receive their choice of an edible or activity upon completion of the ten trials.
Actual Item with Access: In this condition, the experimenter presented the actual items,
verbally named the item, and instructed the participant to choose one. Once the participant made a choice, s/he earned access to the selected item. The participant consumed the edible or interacted with the activity for one minute.
Actual Item with No Access. In this condition the researcher presented the actual item, verbally
named the item, and instructed the participant to choose one. Once the participant made a choice, the teacher removed the item, allowing no access.
Picture with Access. In this condition the researcher presented pictures of the items, verbally
named the items, and instructed the participant to choose one. These pictures were either commercially available pictures or pictures of the actual items. All pictures had white backgrounds, were 2 inch squares, and were laminated. Once the participant made a choice, the actual item was presented. The participant consumed the edible or interacted with the activity for one minute.
Picture with No Access. In this condition the experimenter presented pictures of the items,
verbally named the items, and instructed the participant to choose one. Once the participant made a choice, both pictures were removed and the next trial was presented. No access to the items was allowed.
After all assessments were completed, a preference hierarchy was determined by dividing the
number of times each item was selected by the number of times it was presented, multiplied by 100, and then ranked.
Results.
Thomas chose the pipe cleaner most frequently across three of the four assessment conditions (see Figure 1). The scooter was one of Thomas’ most frequently chosen items (in the top two) in three of four conditions.

The Behavior Analyst Today Consolidated Volume 10, Number 3 & 4
445
Figure 1. Percentage of time Thomas chose items across conditions.
Shawn chose bouncing on the ball most frequently in the picture with access and actual item with
no access conditions (see Figure 2). All other items were variable in rank order across assessment conditions. In the activity assessment, Mitch chose the scooter, TV, and Disney Book most frequently across all four assessment conditions (see Figure 3). In the edible assessment, vanilla frosting and vanilla ice cream were two of Mitch’s three most frequently chosen items across all four assessment conditions (see Figure 4).
Figure 2. Percentage of time Shawn chose items across conditions.

The Behavior Analyst Today Consolidated Volume 10, Number 3 & 4
446
Figure 3. Percentage of time Mitch chose activity/toy items across conditions.
Figure 4. Percentage of time Mitch chose edible items across conditions.

The Behavior Analyst Today Consolidated Volume 10, Number 3 & 4
447
For Mary bouncing on the ball was the second most frequently chosen item in both the picture with access and actual item with access conditions (see Figure 5). Herb chose Hershey Kisses the most frequently in all assessments (see Figure 6). Marshmallow was chosen the second most frequently in the actual item with no access, picture with access, and the actual item with access conditions; although this item was chosen less than 80% of the time. Dorothy chose Smiley Fries most frequently, followed by Coke, across all assessment conditions (see Figure 7).
Figure 5. Percentage of time Mary chose items across conditions.
Figure 6. Percentage of time Herb chose items across conditions.

The Behavior Analyst Today Consolidated Volume 10, Number 3 & 4
448
Figure 7. Percentage of time Dorothy chose items across conditions.
All sessions for Thomas, Shawn, Mary, Herb, and Dorothy were timed. The timer was started just prior to the first trial and was stopped either when the item or pictures were removed (no access conditions) or after the participant sampled the item (access conditions). Preference assessment length varied based on both condition and type of assessment (activity/toy or edible). Picture with no access had the least average time to complete across both assessment types (edible, activity/toy, see figure 8). The slowest conditions were the actual item with access condition in the activity/toy assessments and the picture with access condition in the edible assessments.
Figure 8, Next Page!

The Behavior Analyst Today Consolidated Volume 10, Number 3 & 4
449
Average Time to Complete Activity/Toy Preference Assessments
0:00:00
12:00:00
24:00:00
36:00:00
48:00:00
60:00:00
72:00:00
84:00:00
96:00:00
Actual Item- Access Picture- Access Actual Item- No Access Picture- No Access
Type of Assessment
Min
ute
s
Average Time to Complete Edible Preference Assessments
0:00:00
4:48:00
9:36:00
14:24:00
19:12:00
24:00:00
28:48:00
33:36:00
1 2 3 4
Type of Assessment
Min
utes
Actual Item- Access Picture- Access Actual Item- No Access Picture- No Access
Figure 8. Average time to complete activity/toy and edible preference assessment condition for five participants.
Phase 3: Test of Reinforcement Effect The purpose of this phase was to assess if high preference items selected in each preference assessment condition functioned as reinforcers of behaviors for each participant. The dependent measure was the percentage of the time that the participant spent in the high preference, low preference, or control conditions.

The Behavior Analyst Today Consolidated Volume 10, Number 3 & 4
450
Tests of reinforcement were conducted for four of the six participants: Mitch, Shawn, Thomas, and Herb. One participant was lost to attrition before the test of reinforcement could be conducted and another had medical issues that precluded edible items from being tested. Items selected over 80% on each preference assessment were considered high preference items. If the participant did not choose one stimuli at least 80% of the time in one of the preference assessment conditions, the most frequently selected item in that assessment condition was chosen as the high preference item. These high preference items were then tested to determine if each item functioned as a reinforcer. The low preference item included in the test of reinforcement was an item that was the lowest in at least one condition and was chosen in the low end of the hierarchy across all assessment condition. For Mitch, who participated in both the activity/toy and edible preference assessments, tests of reinforcement were conducted separately for each type of assessment (one for edible and one for activity/toy).
Modeled after the work of Piazza, Fisher, Hagopian, Bowman and Toole (1996), the researchers
brought each participant (one at a time) into an empty room with three 2-foot squares of different colors (red, yellow and white) taped onto the floor. Two squares contained either a low preference or a high preference item. For the edible tests of reinforcement, multiple small portions of the stimuli were on one plate in each square. One square was always empty to serve as a control (empty plate in the edible tests). During tests of reinforcement for both activities/toys and edibles, the participant was only allowed access to the stimuli in the square if they remained in the corresponding square; while the participant was allowed to go anywhere in the room, access to the item was terminated if the participant left the area within the square. During that time, the participant was allowed to engage with activities while in the square or spend free time in the empty square or around the room. The direction in the activity/toy test of reinforcement was “go play in a square” and the direction in the edible test of reinforcement was “go eat what you want.” Trial length lasted two minutes for the activity/toy condition and 30 seconds for the edible condition. To account for side preference, items were counterbalanced (placed in different colored squares). Reliability.
Prior to conducting preference assessments, staff attended training on the procedures of the forced choice preference assessment. They completed a 1½ hour training describing different types of assessments and the implementation of the forced choice assessment. Staff practiced implementing the forced choice assessment with other staff and were observed by the trainer to ensure procedural fidelity.
Researchers conducted interobserver agreement on scoring of preferences (IOA) for Herb and
Dorothy. IOA was collected for an average of 56% of trials and 99% agreement was obtained (range 95% - 100%).
A researcher and a staff member conducted interobserver agreement regarding the selection of
items and time in each box. IOA was collected for an average of 67% of all assessment trials involving each participant. Agreement for both the item selected and the time in the box was 100%.
Results.
The activity/toy test of reinforcement for Shawn consisted of the following items: bouncing on a
ball, squishy toy, light up toy (all high preference), and Winnie the Pooh on the TV (low preference; see Figure 9). Shawn remained in the high preference square an average of 84% of measured intervals and in the low preference and control square in 0% of measured intervals. Shawn spent the rest of the time engaging in out of square behavior.

The Behavior Analyst Today Consolidated Volume 10, Number 3 & 4
451
Figure 9. Percentage of time in high preference, low preference, and no item square across sessions for test of reinforcement.
The activity/toy test of reinforcement for Thomas consisted of the following items: pipe cleaner,
scooter (both high preference), and puzzle (low preference). Thomas remained in the high preference square in an average of 17% of measured intervals, in the control square in an average of 83% of measured intervals, and the low preference square in 0% of measured intervals (see Figure 9).

The Behavior Analyst Today Consolidated Volume 10, Number 3 & 4
452
The edible test of reinforcement for Herb consisted of the following items: Hershey kisses (high
preference) and pretzels (low preference). Herb remained in the high preference square in an average of 26% of measured intervals and in the control and low preference square in 0% of measured intervals (see Figure 9). Herb spent the rest of the time engaging in out of square behavior, aggressing to the researcher.
The activity/toy test of reinforcement for Mitch consisted of the following items: scooter, TV
(both high preference), and baseball video game (low preference, see Figure 9). The edible test of reinforcement for Mitch consisted of the following items: vanilla ice cream, vanilla frosting (both high preference), and pears (low preference). During the activity/toy test of reinforcement, Mitch remained in the high preference square in an average of 40% of measured intervals, in the low preference square in an average of 4% of measured intervals, and in the control square in 0% of measured intervals. Mitch spent the rest of the time engaging in out of square behavior. During his edible test of reinforcement, he remained in the high preference square in 100% of measured intervals.
Discussion
This study found hierarchies of high preference items to be similar for most participants, regardless of preference assessment presentation method. The picture –no access condition was the most efficient method, with the briefest (average) time to complete. All presentation methods identified items that functioned as reinforcers. The results suggest that, for some participants, utilizing any of the four forced choice preference assessment conditions (picture – access, picture – no access, actual item – access, actual item – no access) can indicate potential reinforcers. This allows the most efficient method, picture – no access, to be utilized for some individuals. For others, more research is required to determine which method can be utilized the most efficiently.
These preference assessment findings correspond with that of Conyers et al. (2002), de Vries et al. (2005), Schwartzman et al. (2003), and Roscoe, Iwata, & Kahng, (1999) in that presentation methods affect results and that no one method is assured of obtaining the most accurate results for all participants; each individual needs to be evaluated to determine the best presentation method for that individual. As with Northup et al. (1996), Graff and Gibson (2003), and Wilder et al. (2003), different presentation methods identified high and low preference items regardless of access or presentation method. These findings are contrary to Higbee et al. (1999), who found that tangible assessments more accurately predicted reinforcement effects.
Staff were not accurate in determining what stimuli would function as reinforcers for some of the
participants. Other researchers have discovered this same phenomenon. This suggests that when determining what to use as reinforcing stimuli for learners, a wise course of action would be to do some sort of preference assessment with the learner, as opposed to relying solely on staff report. But since staff report would be a quick way of gathering such information, it is recommended that future research include a focus on how to teach staff to accurately tact stimuli that will in fact function as reinforcers.
Some participants did not respond favorably when items were removed in the no access
conditions. For instance, Mitch exhibited challenging behavior when the frosting was removed in the no-access condition. To counter this reaction, social stories were utilized for him and other participants. These stories explained that the participants might not gain access to the selected item, but that they could access an item at the end of each session.

The Behavior Analyst Today Consolidated Volume 10, Number 3 & 4
453
Selecting the items that might function as reinforcers is the first step; the actual assessment of their reinforcing effect is the second and most important task. In this study, the researchers tried several different tactics to test for reinforcer function. Each was fraught with problems, including participant resistance, lack of differential responding, and methodological impediments. Future researchers should consider studying this particular component of reinforcement preference assessment. Perhaps standardized protocols should be developed for each methodology, or some criteria with which to evaluate participants to determine which methodology might best be suited for participants with different skill levels.
Limitations of this study include small sample size,, brought on partly by the attrition of
participants prior to the implementation of all research phases (test for reinforcement). Additionally, although procedural fidelity was obtained on most sections of the methodology, it was not obtained on the implementation of preference assessments.
While there has been a tremendous amount of research on preference assessments over the last
three decades, there are opportunities for further investigation. Suggestions for further research include tracking changes in preferences over time in order to determine the optimal interval between preference assessments so as to identify any shifts in preference (Ciccone, Graff, & Ahearn, 2007). Also, it would be interesting to develop preference assessment procedures to allow the representation of stimuli such as praise and other complex activities that cannot be easily presented (Higbee et al., 1999). Further research should be conducted on assessing the conditions utilized in this study (actual item with access, picture with access, actual item with no access, and picture with no access to one another). Verbal presentation method should also be assessed as a presentation method, both with and without access. Additionally, 27% of reviewed studies did not test if the identified high preference items actually functioned as reinforcers or improved student performance, making this another area of possible study. Researchers could test different methods of determining if high preference items do indeed function as reinforcers.
References Bojak, S.L., & Carr, J.E. (1999). On the displacement of leisure items by food during multiple -stimulus reference assessments. Journal of Applied Behavior Analysis, 32, 515-518. Ciccone, F.J., Graff, R.B., & Ahearn, W.H. (2007) Long-term stability of edible preferences in ndividuals with developmental disabilities. Behavioral Interventions, 22, 223-228. Retrieved rom Wiley InterScience database. Cohen-Almeida, D., Graff, R. B., & Ahearn, W. H. (2000). A Comparison of verbal and tangible stimulus preference assessments. Journal of Applied Behavior Analysis, 33, 329-334. Conyers, C., Doole, A., Vause, T., Harapiak, S., Yu, D.C.T., & Martin, G.L. (2002). Predicting the relative efficacy of three presentation methods for assessing preferences of persons with developmental disabilities. Journal of Applied Behavior Analysis, 35, 49-58. DeLeon, I.G., Iwata, B. A., & Roscoe, E. M., (1997). Displacement of leisure reinforcers by food during preference assessments. Journal of Applied Behavior Analysis, 30, 475-484. de Vries, C., Yu, C.T., Sakko, G., Wirth, K.M., Walters, K.L., Marion, C., & Martin, G.L. (2005, March). Predicting the relative efficacy of verbal, pictorial, and tangible stimuli for assessing preferences of leisure activities. American Journal on Mental Retardation, 110, 145-154.

The Behavior Analyst Today Consolidated Volume 10, Number 3 & 4
454
Ferrari, M., & Harris, S.L. (1981). The limits and motivating potential of sensory stimuli as reinforcers for autistic children. Journal of Applied Behavior Analysis, 14, 339-343. Fisher, W., Piazza, C.C., Bowman, L.G., Hagopian, L.P., Owens, J.C., & Slevin I. (1992). A comparison of two approaches for identifying reinforcers for persons with severe and profound disabilities. Journal of Applied Behavior Analysis, 25, 491-498. Graff, R.B., & Ciccione, F.J. (2002). A post hoc analysis of multiple -stimulus preference assessment results. Behavioral Interventions, 17, 85-92. Retrieved from Wiley InterScience database. Graff, R.B., & Gibson, L. (2003). Using pictures to assess reinforcers in individuals with developmental disabilities. Behavior Modification, 27, 470-483. Higbee, T.S., Carr, J.E., & Harrison, C.D. (1999). The effects of pictorial versus tangible stimuli in stimulus-preference assessments. Research in Developmental Disabilities, 20, 63-72. Kuhn, D.E., DeLeon, I.G., Terlonge, C., & Goysovich, R. (2006). Comparison of verbal preference assessments in the presence and absence of the actual stimuli. Research in Developmental Disabilities, 27, 645-656. Northup J., Geroge, T., Jones, K., Broussard, C., & Vollmer, T.R.. (1996). A comparison of reinforcer assessment methods: The utility of verbal and pictorial choice procedures. Journal of Applied Behavior Analysis, 29, 201-212.
Pace, G. M., Ivancic, M. T., Edwards, G. L., Iwata, B. A. & Page, T. J. (1985). Assessment of stimulus preference and reinforcer value with profoundly retarded individuals. Journal of Applied Behavior Analysis, 18, 249-255. Penrod, B., Wallace, M.D., & Dyer, E.J. (2008). Assessing potency of high- and low-preference reinforcers with respect to response rate and response patterns. Journal of Applied Behavior Analysis, 41, 177-188. Parson, M.B. & Reid, D.H., (1990). Assessing food preferences among persons with profound mental retardation: providing opportunities to make choices. Journal of Applied Behavior Analysis, 23, 183-195. Piazza, C. C., Fisher, W. W., Hagopian, L. P. Bowman, L. G., & Toole, L. (1996). Using a Choice Assessment to Predict Reinforcer Effectiveness. Journal of Applied Behavior Analysis, 29, 1-9. Roscoe, E.M., Iwata, B.A., & Kahng, S. (1999). Relative versus absolute reinforcement effects: Implications for preference assessments. Journal of Applied Behavior Analysis, 32, 479-493. Schwartzman, L., Yu, D. C. T. & Martin, G.L. (2003). Choice responding as a function of choice presentation method and level of preference in persons with developmental disabilities. International Journal of Disability, Community & Rehabilitation, 1(3). Retrieved August 19, 2009, from http://www.ijdr.ca/VOL01_03_CAN/articles/schwartzman.shtml Tessing, J. L., Napolitano, D. A., McAdam, D. B., DiCesare, A., & Axelrod, S.(2006). The effects of providing access to stimuli following choice during vocal preference assessments. Journal of Applied Behavior Analysis, 39, 501-506.

The Behavior Analyst Today Consolidated Volume 10, Number 3 & 4
455
Wilder, D.A., Ellsworth, C., White, H., & Schock, K. (2003). A comparison of stimulus preference assessment methods in adults with schizophrenia. Behavioral Interventions, 18, 151-160. Windsor, J., Piche, L.M., & Locke, P.A. (1994). Preference testing: A comparison of two presentation methods. Research in Developmental Disabilities, 15(6), 439- 455. Author contact information Cheryl Davis , Consultant 10 East Main Street Southborough, MA 01772 978-505-1220 [email protected] Michele D. Brock, Kristin McNulty, Mary L. Rosswurm, Benjamin Bruneau Crossroads School for Children Thomas Zane Center for Applied Behavior Analysis Sage Graduate School Troy, New York
ADVERTISEMENT
ADVERTISING IN BAO Journals
If you wish to place an advertisement in any of our journals, you can do it by contacting us.
The prices for advertising in one issue are as follows:
1/4 Page: $50.00 1/2 Page: $100.00 Full Page: $200.00
If you wish to run the same ad in multiple issues for the year, you are eligible for the following discount:
1/4 Pg.: $40 - per issue 1/2 Pg.: $75 - per issue
Full Page: $150.00-per issue
An additional one time layout/composition fee of $25.00 is applicable
In addition to placing your ad in the journal(s) of your choice, we will place your ad on our website’s advertising section.
For more information, or place an ad, contact Halina Dziewolska by phone at (215) 462-6737 or e-mail at: [email protected]