Efficiency indicators of Railways in France - Home | ITF · 3 Efficiency indicators of Railways in...
25
Efficiency indicators of Railways in France Draft Discussion Paper Prepared for the Roundtable: Efficiency in Railway Operations and Infrastructure Management 18-19 November 2014, International Energy Agency, Paris, France Alain Bonnafous Yves Crozet Laboratoire d’Économie des Transports (LET) Lyon France November 2014
Transcript of Efficiency indicators of Railways in France - Home | ITF · 3 Efficiency indicators of Railways in...

Efficiency indicators of Railways
in France
Draft Discussion Paper
Prepared for the Roundtable:
Efficiency in Railway Operations and
Infrastructure Management
18-19 November 2014, International Energy Agency, Paris, France
Alain Bonnafous
Yves Crozet
Laboratoire d’Économie des Transports (LET)
Lyon France
November 2014
2
THE INTERNATIONAL TRANSPORT FORUM
The International Transport Forum at the OECD is an intergovernmental organisation with 54 member countries. It acts as a strategic think-tank, with the objective of helping shape the transport policy agenda on a global level and ensuring that it contributes to economic growth,
environmental protection, social inclusion and the preservation of human life and well-being. The International Transport Forum organizes an annual Summit of Ministers along with leading representatives from industry, civil society and academia.
The International Transport Forum was created under a Declaration issued by the Council of Ministers of the ECMT (European Conference of Ministers of Transport) at its Ministerial Session in May 2006 under the legal authority of the Protocol of the ECMT, signed in Brussels on 17 October 1953, and legal instruments of the OECD.
The Members of the Forum are: Albania, Armenia, Australia, Austria, Azerbaijan, Belarus, Belgium, Bosnia and Herzegovina, Bulgaria, Canada, Chile, People’s Republic of China, Croatia, Czech Republic, Denmark, Estonia, Finland, France, Former Yugoslav Republic of Macedonia, Georgia, Germany, Greece, Hungary, Iceland, India, Ireland, Italy, Japan, Korea, Latvia, Liechtenstein, Lithuania, Luxembourg, Malta, Mexico, Republic of Moldova, Montenegro, the Netherlands, New Zealand, Norway, Poland, Portugal, Romania, Russian Federation, Serbia, Slovak Republic,
Slovenia, Spain, Sweden, Switzerland, Turkey, Ukraine, United Kingdom and United States.
The International Transport Forum’s Research Centre gathers statistics and conducts co-operative research programmes addressing all modes of transport. Its findings are widely disseminated and support policymaking in member countries as well as contributing to the annual Summit.
Discussion Papers
The International Transport Forum’s Discussion Paper Series makes economic research, commissioned or carried out at its Research Centre, available to researchers and practitioners. The
aim is to contribute to the understanding of the transport sector and to provide inputs to transport policy design.
ITF Discussion Papers should not be reported as representing the official views of the ITF or of its member countries. The opinions expressed and arguments employed are those of the authors.
Discussion Papers describe preliminary results or research in progress by the author(s) and are published to stimulate discussion on a broad range of issues on which the ITF works. Comments on Discussion Papers are welcomed, and may be sent to:
International Transport Forum/OECD, 2 rue André-Pascal, 75775 Paris Cedex 16, France.
For further information on the Discussion Papers and other JTRC activities, please email: [email protected]
The Discussion Papers can be downloaded from: www.internationaltransportforum.org/jtrc/DiscussionPapers/jtrcpapers.html
The International Transport Forum’s website is at: www.internationaltransportforum.org
This document and any map included herein are without prejudice to the status of or sovereignty over any territory, to the delimitation of international frontiers and boundaries and to the name of any territory, city or area.

3
Efficiency indicators of Railways
in France
Professor Alain Bonnafous
Professor Yves Crozet
University of Lyon (Institute of Political Science)
Transport Economics Laboratory
1. Introduction
France is a key player in the European rail system, far outstripping all other countries in high-speed
rail travel, with 53 billion passenger-kilometres travelled in 2013. Because of the size of this market
segment, France is the European country with the greatest number of passenger-kilometres per year
(92.4 billion in 2013). In terms of freight, France lies in third place in Europe, with 32 billion tonne-
kilometres, behind Germany and Poland (with 112 and 40 billion tonne-kilometres in 2013). These
figures should be seen in the light of French public policy for rail in the last several years.
The success of the TGV is undeniable (Crozet 2013). Work started in September 1975 on the
first high-speed rail (HSR) line, between Paris and Lyon, and it was inaugurated in September
1981. New high-speed lines were opened in 1989 (towards the south-west), in 1993 (towards
the north), etc. The high-speed network now covers 2 000 km, and will reach over 2 600 km in
2017 with the opening of the four lines currently being built.
The regionalisation of intercity and local services was tested in 1997 and fully deployed in the
early 2000s. Since then, TERs (regional express trains) have seen traffic rise steeply (50%
between 2000 and 2013) as, to a lesser extent, have services in the Ile de France region (25%).
Rail freight has been far less successful. The French network carried 55 billion tkm in 2001,
but this figure scarcely reached 32 billion tkm in 2013. This weak performance contrasts
sharply with the ambitious public policy of the last fifteen years. The Grenelle Environment
Forum (2007–2010) oversaw the deployment of a costly freight plan that was no more
effective than its predecessors.
The main reason for exploring the differing trends of these three segments of the rail economy is to
highlight the fact that, in France and elsewhere, there exists more than one rail market. Performance
needs to be measured by type of activity, especially since the theory of network goods (Katz &
Shapiro 1987) and EU Directive 1991/440/EEC showed that infrastructure management should be
considered separately from the operation of trains. Regardless of its level of independence from rail
operators, the infrastructure manager is now a central player in rail performance. In the second part of
this report, we will therefore examine infrastructure performance and, since this is a highly capital-
intensive activity, the efficiency of capital.
Investment in infrastructure, especially rail infrastructure, largely falls to the public authorities. Even
more than in other network industries, in rail the government plays a central role. With the exception
of a handful of lines, rail infrastructure in Europe consists of state-owned monopolies. As a legacy of

4
prior decades of integrated monopoly, a country’s main rail operator is also generally owned by the
State. Even today, in France, the SNCF has a virtual monopoly over passenger traffic, and receives
subsidies for its various missions that total 9 billion euros. Its revenues in France come to 23 billion
euros. When the 4.2 billion euros paid in annual subsidies to the infrastructure manager is taken into
account, total rail subsidies amount to 13.2 billion euros1.
Given this State ubiquity, we cannot restrict our examination to the private sector. Neither the TOCs
nor the infrastructure manager are in the standard situation of business activities in which strategic
decisions are taken by the shareholders according to the profitability of invested capital. By no means
all rail transport services constitute business activities. A large part of the rail passenger transport
offering comes under the public service obligations defined by the EU regulation of that name
(European Commission, 2009). It is not appropriate, therefore, to talk about performance or efficiency
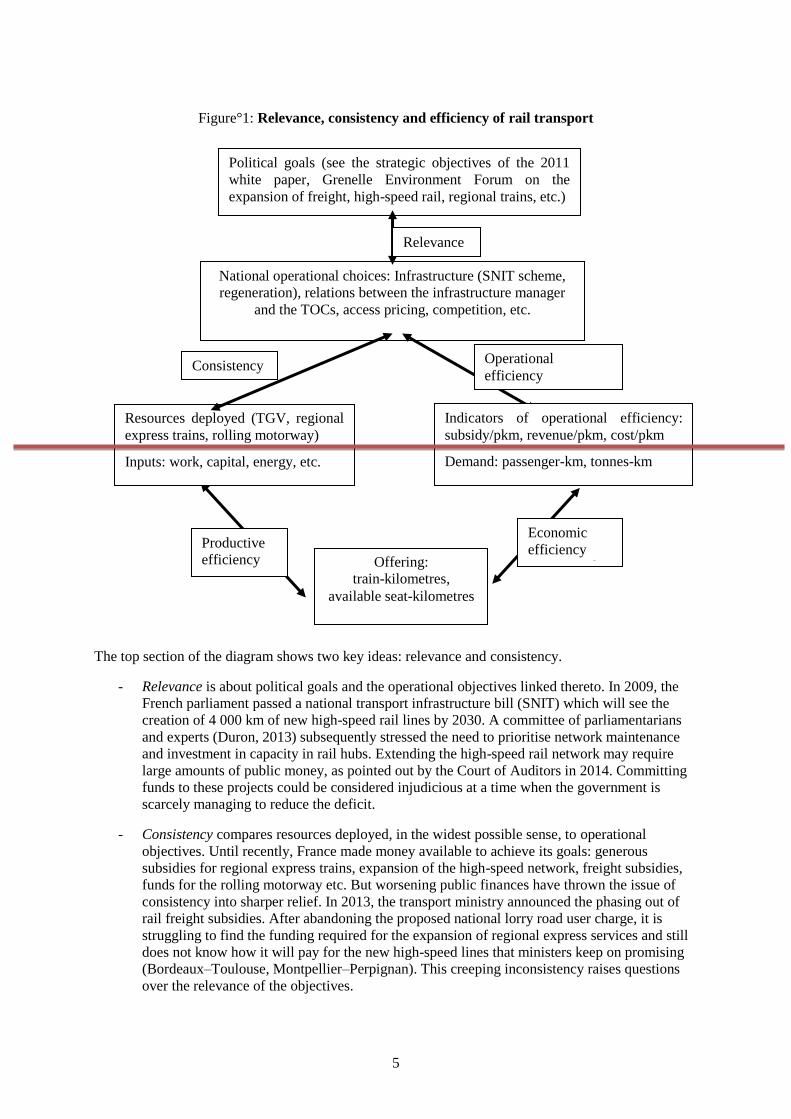
in unqualified terms. As shown in Figure 1, we need to define indicators that distinguish between
relevance, consistency and different kinds of efficiencies.
1 French rail transport subsidies are distributed as follows: infrastructure manager, 4.2 billion euros; regional
express trains, 3 billion euros; Ile-de-France, 1.2 billion euros; freight, 0.3 billion euros; SNCF
pension fund, 3.4 billion euros. (CCTN 2013 pp 29-31).
5
Figure°1: Relevance, consistency and efficiency of rail transport
The top section of the diagram shows two key ideas: relevance and consistency.
- Relevance is about political goals and the operational objectives linked thereto. In 2009, the
French parliament passed a national transport infrastructure bill (SNIT) which will see the
creation of 4 000 km of new high-speed rail lines by 2030. A committee of parliamentarians
and experts (Duron, 2013) subsequently stressed the need to prioritise network maintenance
and investment in capacity in rail hubs. Extending the high-speed rail network may require
large amounts of public money, as pointed out by the Court of Auditors in 2014. Committing
funds to these projects could be considered injudicious at a time when the government is
scarcely managing to reduce the deficit.
- Consistency compares resources deployed, in the widest possible sense, to operational
objectives. Until recently, France made money available to achieve its goals: generous
subsidies for regional express trains, expansion of the high-speed network, freight subsidies,
funds for the rolling motorway etc. But worsening public finances have thrown the issue of
consistency into sharper relief. In 2013, the transport ministry announced the phasing out of
rail freight subsidies. After abandoning the proposed national lorry road user charge, it is
struggling to find the funding required for the expansion of regional express services and still
does not know how it will pay for the new high-speed lines that ministers keep on promising
(Bordeaux–Toulouse, Montpellier–Perpignan). This creeping inconsistency raises questions
over the relevance of the objectives.
Political goals (see the strategic objectives of the 2011
white paper, Grenelle Environment Forum on the
expansion of freight, high-speed rail, regional trains, etc.)
National operational choices: Infrastructure (SNIT scheme,
regeneration), relations between the infrastructure manager
and the TOCs, access pricing, competition, etc.
Relevance
Resources deployed (TGV, regional
express trains, rolling motorway)
Consistency Operational
efficiency
Offering:
train-kilometres,
available seat-kilometres
Productive
efficiency
productive
Economic
efficiency
commerciale
Inputs: work, capital, energy, etc.
Indicators of operational efficiency:
subsidy/pkm, revenue/pkm, cost/pkm
Demand: passenger-km, tonnes-km

6
In this report, we will therefore remain mindful of this context in which the question of the relevance
and consistency of public policy is raised time and again. With this in mind, we will, in Section 2,
examine the different ways to assess the efficiency of rail transport services. And in Section 3, we will
turn to the efficiency of infrastructure management.
2. Efficiency of rail transport services
The lower section of Figure 1 shows two main kinds of efficiency. A third is shown to the top right. It
is worth examining in detail the reasons why we need to distinguish between them, beginning with
economic efficiency.
Economic efficiency compares technical outputs (train-kilometres) to economic outputs such
as passenger-kilometres and tonne-kilometres. A good level of productive output can be
associated with poor economic efficiency if supply exceeds demand. Occupancy rates are the
critical factor: when occupancy rates are high, economic outputs can be directly compared to
technical inputs such as capital and work.
Productive efficiency is based on traditional economic calculations of productivity, and looks
at the activity’s most basic ratio of output to input. Outputs can be either train-kilometres or
available seat- kilometres. Inputs can be the quantity of work or capital, measured with a
greater or lesser degree of complexity, resulting in the calculation of basic or far more
sophisticated indicators such as production frontiers.
Operational efficiency brings us to the standpoint of the public authorities who subsidise rail
transport services. The rather simplistic question is this: is it worth it? If the trains are full but
costs or subsidies per passenger-kilometre are very high, is the community getting value for
money? This idea has been much explored in the United Kingdom, and can be applied to
France with a little international benchmarking.
This section will examine each of these three categories. Using a few simple indicators, we will see
that the French rail system, when compared to those in neighbouring countries, seems as first sight to
be fairly economically successful in passenger transport, although not for freight (see 2.1). But if we
probe deeper, other indicators reveal weaknesses and insufficient improvement in productivity (see
2.2). This lacklustre performance increases pressure on public finances and ultimately leads to poor
operational efficiency that is closely linked to the organisational weaknesses in the French rail system
(see 2.3).

7
2.1 Strong economic efficiency, but only for passenger transport
As stated in the introduction, France, and more specifically the SNCF2, ranks first for rail passenger
services in Europe, with 92.4 billion passenger-kilometres. Its economic efficiency is undeniable,
since this figure was achieved with just 406 million train-kilometres, i.e. an average of 227 passengers
per train. By comparison, Deutsche Bahn trains only carry a little over 100 passengers per train on
average, which is just under the 130 passengers on Swiss railways. To understand this performance,
we need to look at rail traffic across different market segments.
Table 1: Rail passenger transport in France
Source: Les Comptes Transport de la Nation 2013 (national transport accounts), p.125
Translation:
In millions of passenger-kilometres; annual change in %
2013; Annual change
Long-distance rail transport
High-speed rail
Intercity services
Local rail services
Trains under regional council contracts
Ile-de-France commuter trains and RER
Total excluding Ile-de-France commuter trains and RER
Total
Including international services
Under government contract and non-contractual trains, excluding high-speed trains
Under regional council contract (excluding Ile-de-France and Corsica)
Including the RERs operated by the RATP and the T4 tram line.
This table shows that two thirds of traffic is carried by high-speed trains. So this economic efficiency
is the result of structural factors and has three major causes.
- First, depending on their destination, high-speed trains in France have between 450 and 1 000
available seats per train, which is far more than a regional train.
2 With the single exception of the Paris-Venice Thello train, all passenger services in France are operated by the
SNCF or its subsidiaries, such as Thalys and Eurostar. ICE trains between France and Germany are operated
under a partnership with the SNCF.

8
- Second, highly effective yield management delivers average occupancy rates of over 70% for
high-speed trains.
- Most important, however, is their high speed, which allows them to cover long distances and
automatically increases the number of passenger-kilometres.
But the TGV’s success has come at some cost for other intercity services, which saw traffic fall by
6.1% every year from 2008 to 2013. Since high-speed traffic only grew by 0.6% during this period,
despite additional services3, total long-distance traffic fell by 0.4% every year between 2008 and 2013.
This is partly due to poor economic conditions, but there are other reasons, which cast doubt over the
wisdom of the tout TGV strategy of creating a high-speed network across the entire country (Crozet
2010, Fressoz 2010, Cour des comptes (National Audit Office), 2014), especially since the price
elasticity of high-speed traffic is relatively low. Lower prices will not lead to a sharp rise in traffic
(Crozet & Chassagne, 2013) because of competition from air travel on many routes and the recent
growth of carpooling, which now accounts for almost 5% of long-haul traffic in France, i.e. the
equivalent of 2 000 high-speed trainloads every month! High-speed travel is therefore facing an
uncertain future in France. In order to increase the turnover generated by its 400 high-speed trains, the
SNCF is considering changing its offering in order, for example, to keep these trains on high-speed
lines only, with other trains, especially regional express trains, completing the terminal haul.
In fact, regional express trains saw the highest traffic growth (up 2% every year) in 2008-2013,
alongside Ile-de-France services (up 1.2% every year). For the former, however, economic efficiency
is weak (40 passengers on average per train), because many trains are small, and because occupancy
rates are low, at under 30% (Cour des Comptes, 2012). The Transilien commuter services in Ile-de-
France, on the other hand, have high-capacity trains which are often saturated during rush hour, and
occupancy rates are very high (over 70%). This reflects the findings of Banister and Ghivoni in 2012,
who showed that European countries that did not prioritise high-speed rail saw the highest traffic
growth. This indicates that rail transport is most appropriate for everyday mobility in urban and
periurban areas, which calls into question the expansion of high-speed rail both in France but also on a
European level, whereas the 2011 white paper forecasts a tripling of the high-speed network in Europe
by 2030 (Transforum 2014).
For passenger transport, then, the French rail system is not as successful as it appears at first sight.
This is even more striking in rail freight, in which the legacy operator has manifestly failed to perform,
despite high expectations. At the turn of this century, Jean-Claude Gayssot, the then transport minister,
set a target of 100 billion tonne-kilometres by 2015. By 2013, rail traffic had collapsed to 32 billion
tkm, just two thirds of which was generated by the SNCF. What happened? Did economic efficiency
fall because of deindustrialisation?
A report by the French Commission on Sustainable Development (Commissariat Général au
Développement Durable – CGDD, 2013) analysed freight by category, taking account of trends in
different sectors of industry before the 2008 financial crisis. This analysis offers no reasons for the
collapse in rail freight. Comparing rail freight to production in four key sectors reveals a complete
divergence between 2000 and 2006.
- Food industry: production up 3%, rail freight down 37%;
- Energy: production up 5%, rail freight down 34%;
- Manufactured goods: production up 3%, rail freight down 35%;
- Construction: production up 4%, rail freight down 13%.
As shown in Figure 2, freight traffic, and therefore economic efficiency, fell sharply despite rising
GDP and, at least until 2008, stable industrial output.
3 Opening of the East high-speed line in June 2007 and the Rhine-Rhone high-speed line in December 2011.

9
Figure 2: The decline of French rail freight (base 100: 2000)
Source: Eurostat.
Translation : Rail
Industrial output
GDP
The problem, then, is the relative competitiveness of the rail carrier, generally Fret SNCF, which was
almost the sole operator until 2007. Between 2004 and 2010, Fret SNCF’s average revenue per tonne-
kilometre rose by 11%, from 3.9 to 4.3 centimes, while traffic fell by 50%. During the same period,
Deutsche Bahn saw its average revenue fall by 8%, from 4.3 to 4 centimes per tonne-kilometre, but
traffic grew by 27% (CGDD 2013). We need to look more closely at the reasons for this loss of
efficiency, and they do not only concern freight.
50.060.070.080.090.0
100.0110.0120.0130.0140.0150.0
Ferroviaire
Industrie
PIB
10
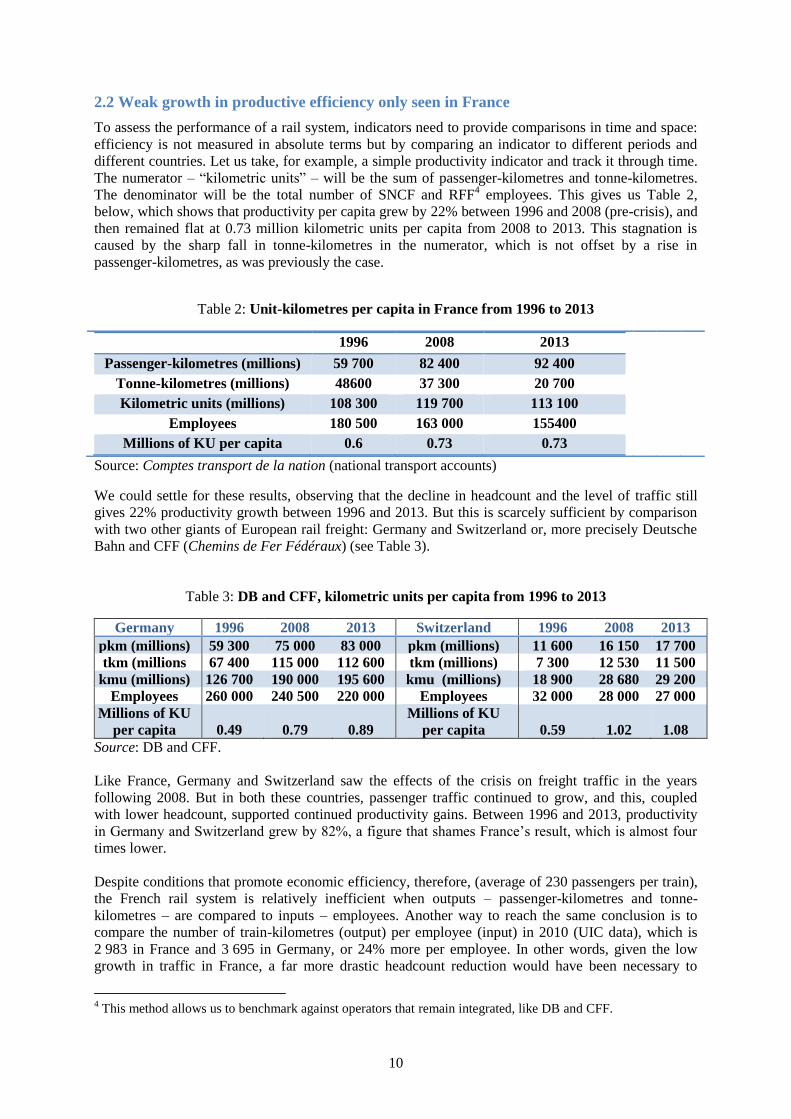
2.2 Weak growth in productive efficiency only seen in France
To assess the performance of a rail system, indicators need to provide comparisons in time and space:
efficiency is not measured in absolute terms but by comparing an indicator to different periods and
different countries. Let us take, for example, a simple productivity indicator and track it through time.
The numerator – “kilometric units” – will be the sum of passenger-kilometres and tonne-kilometres.
The denominator will be the total number of SNCF and RFF4 employees. This gives us Table 2,
below, which shows that productivity per capita grew by 22% between 1996 and 2008 (pre-crisis), and
then remained flat at 0.73 million kilometric units per capita from 2008 to 2013. This stagnation is
caused by the sharp fall in tonne-kilometres in the numerator, which is not offset by a rise in
passenger-kilometres, as was previously the case.
Table 2: Unit-kilometres per capita in France from 1996 to 2013
1996 2008 2013
Passenger-kilometres (millions) 59 700 82 400 92 400
Tonne-kilometres (millions) 48600 37 300 20 700
Kilometric units (millions) 108 300 119 700 113 100
Employees 180 500 163 000 155400
Millions of KU per capita 0.6 0.73 0.73
Source: Comptes transport de la nation (national transport accounts)
We could settle for these results, observing that the decline in headcount and the level of traffic still
gives 22% productivity growth between 1996 and 2013. But this is scarcely sufficient by comparison
with two other giants of European rail freight: Germany and Switzerland or, more precisely Deutsche
Bahn and CFF (Chemins de Fer Fédéraux) (see Table 3).
Table 3: DB and CFF, kilometric units per capita from 1996 to 2013
Germany 1996 2008 2013 Switzerland 1996 2008 2013
pkm (millions) 59 300 75 000 83 000 pkm (millions) 11 600 16 150 17 700
tkm (millions 67 400 115 000 112 600 tkm (millions) 7 300 12 530 11 500
kmu (millions) 126 700 190 000 195 600 kmu (millions) 18 900 28 680 29 200
Employees 260 000 240 500 220 000 Employees 32 000 28 000 27 000
Millions of KU
per capita 0.49 0.79 0.89
Millions of KU
per capita 0.59 1.02 1.08
Source: DB and CFF.
Like France, Germany and Switzerland saw the effects of the crisis on freight traffic in the years
following 2008. But in both these countries, passenger traffic continued to grow, and this, coupled
with lower headcount, supported continued productivity gains. Between 1996 and 2013, productivity
in Germany and Switzerland grew by 82%, a figure that shames France’s result, which is almost four
times lower.
Despite conditions that promote economic efficiency, therefore, (average of 230 passengers per train),
the French rail system is relatively inefficient when outputs – passenger-kilometres and tonne-
kilometres – are compared to inputs – employees. Another way to reach the same conclusion is to
compare the number of train-kilometres (output) per employee (input) in 2010 (UIC data), which is
2 983 in France and 3 695 in Germany, or 24% more per employee. In other words, given the low
growth in traffic in France, a far more drastic headcount reduction would have been necessary to
4 This method allows us to benchmark against operators that remain integrated, like DB and CFF.
11
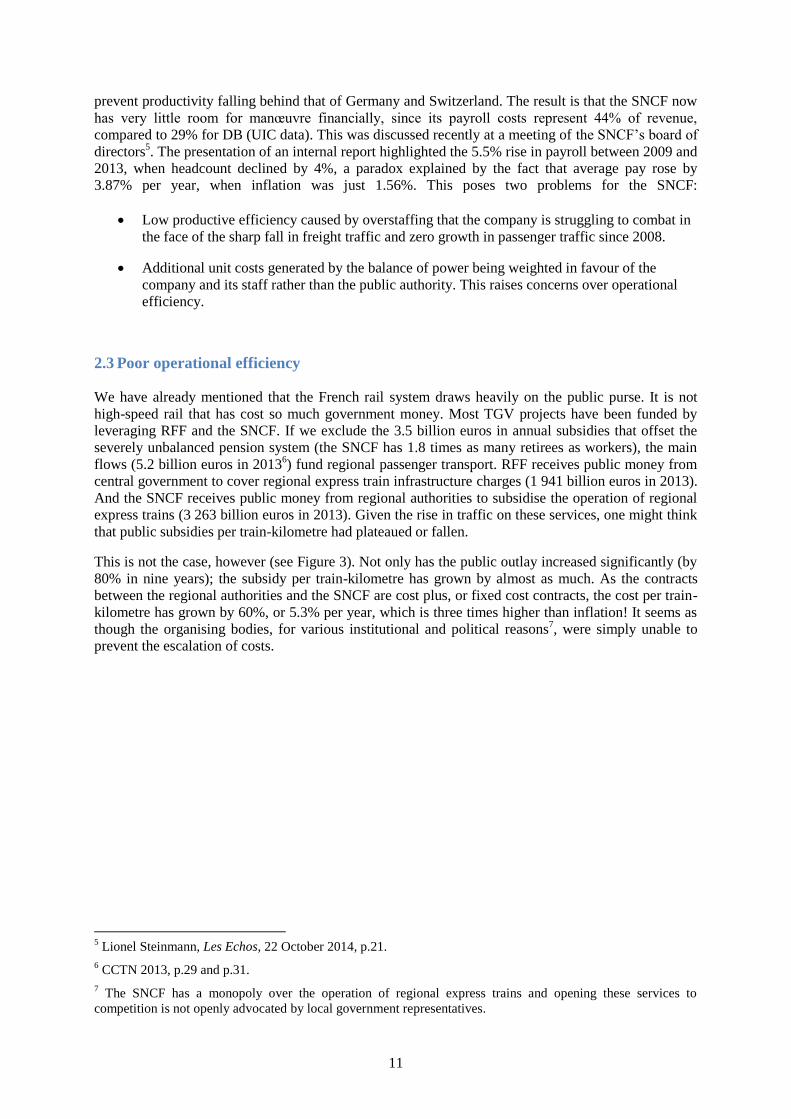
prevent productivity falling behind that of Germany and Switzerland. The result is that the SNCF now
has very little room for manœuvre financially, since its payroll costs represent 44% of revenue,
compared to 29% for DB (UIC data). This was discussed recently at a meeting of the SNCF’s board of
directors5. The presentation of an internal report highlighted the 5.5% rise in payroll between 2009 and
2013, when headcount declined by 4%, a paradox explained by the fact that average pay rose by
3.87% per year, when inflation was just 1.56%. This poses two problems for the SNCF:
Low productive efficiency caused by overstaffing that the company is struggling to combat in
the face of the sharp fall in freight traffic and zero growth in passenger traffic since 2008.
Additional unit costs generated by the balance of power being weighted in favour of the
company and its staff rather than the public authority. This raises concerns over operational
efficiency.
2.3 Poor operational efficiency
We have already mentioned that the French rail system draws heavily on the public purse. It is not
high-speed rail that has cost so much government money. Most TGV projects have been funded by
leveraging RFF and the SNCF. If we exclude the 3.5 billion euros in annual subsidies that offset the
severely unbalanced pension system (the SNCF has 1.8 times as many retirees as workers), the main
flows (5.2 billion euros in 20136) fund regional passenger transport. RFF receives public money from
central government to cover regional express train infrastructure charges (1 941 billion euros in 2013).
And the SNCF receives public money from regional authorities to subsidise the operation of regional
express trains (3 263 billion euros in 2013). Given the rise in traffic on these services, one might think
that public subsidies per train-kilometre had plateaued or fallen.
This is not the case, however (see Figure 3). Not only has the public outlay increased significantly (by
80% in nine years); the subsidy per train-kilometre has grown by almost as much. As the contracts
between the regional authorities and the SNCF are cost plus, or fixed cost contracts, the cost per train-
kilometre has grown by 60%, or 5.3% per year, which is three times higher than inflation! It seems as
though the organising bodies, for various institutional and political reasons7, were simply unable to
prevent the escalation of costs.
5 Lionel Steinmann, Les Echos, 22 October 2014, p.21.
6 CCTN 2013, p.29 and p.31.
7 The SNCF has a monopoly over the operation of regional express trains and opening these services to
competition is not openly advocated by local government representatives.

12
Figure 3: Regional government subsidies for regional express services in France
(indexed to 2002)
Source: Christian Desmaris, 2013.
It is interesting to compare this picture to what was happening in Switzerland over the same period.
Figure 4 shows total public contributions rising somewhat before falling off slightly, but the subsidy
per train-kilometre fell substantially (22%) because of the reduction of costs per train-kilometre.
Figure 4: Confederation subsidies to CFF in Switzerland (indexed to 2002)
Source: Christian Desmaris, 2013.
As also shown by the example of Germany, therefore, it is possible to cut the cost per train-kilometre.
The DB has had to face the arrival of new competition on the market, including the SNCF’s subsidiary
Kéolis! Although its rivals have only taken a small proportion of traffic in regional services (12% in
2012), unit costs per train-kilometre have recorded a significant fall, which can be broken down into
two separate phases.
Gains in market share made by DB’s competitors, in response to which DB improved
operating costs, management and the quality of rail service.
50.0
100.0
150.0
200.0
2002 2004 2006 2007 2008 2009 2010 2011
Public contribution Index, base 100 : 2002
Per train-kilometre - Index, base 100 en 2002
50.0
70.0
90.0
110.0
130.0
1999 2000 2002 2004 2006 2007 2008 2009 2010 2011
Public contribution Index, base 100 : 2000
Per train-kilometre - Index, base 100 en 2002

13
Market stabilisation based on copycat win-win approaches. For local authorities and the
taxpayer, fall in the level of subsidies (KCW – Beauvais, 2012).
In 15 years, Germany has seen passenger-kilometres grow by 55% for regional services, reaching 47
billion pkm), but train-kilometres have risen by just 26% (to 630 million tkm). A 26% cost reduction
for organising bodies has been measured across all contracts. Federal subsidies fell by 6% in real
terms between 1996 and 2009. During this period, the service offered by the Länder for one euro (in
real terms) has increased by 37%.
Our conclusion, at the end of this section, is that the efficiency indicators used for transport services
can be established for chronological analysis and to produce series crossed with data that is generally
published by UIC. Data for benchmarking network efficiency is far less accessible, as we shall see.
3. Network efficiency
The 1997 French rail reform saw responsibility for rail infrastructure entrusted to Réseau Ferré de
France (RFF), an industrial and commercial public undertaking (établissement public à caractère
économique et commercial – EPIC) which is completely independent from the SNCF but works in a
very unusual way: the infrastructure manager has to work with a delegated manager which is none
other than the SNCF. The SNCF therefore retains the departments responsible for network
maintenance and repairs (SNCF Infra) and traffic management, which is ensured by a special division
that was not properly transferred to RFF until 2010.
The infrastructure manager’s efficiency problems are quite unusual in this kind of system, insofar as
the efficiency of the delegated manager is clearly a factor.
3.1 The efficiency of basic operations
In theory, the 1997 French rail reform should promote efforts to manage the network well, since
responsibility for infrastructure management was clearly devolved to RFF. But the requirement to
subcontract to the SNCF posed problems that were, at first, formidable.
RFF toiled endlessly to change a procedure whereby it received a lump-sum invoice for network
maintenance and repairs from the SNCF and had great difficulty in obtaining details on the state of the
network and the maintenance operations carried out. After assuming full responsibility for
development investment, RFF was only gradually able to implement a sensible policy and full
ownership of major maintenance and renewal operations.
The limited reform of 2010, which put the SNCF division in charge of capacity allocation under RFF’s
authority, led to major change in the establishment of train paths, and, by extension, timetables. For
the first time in sixty years, the 2011 timetables were radically transformed, with the first introduction
of clock-face scheduling, increased availability of freight paths and improved management of
bottlenecks.
The progress made by the infrastructure manager in the exercise of its responsibility was recorded in a
contract between RFF and the government, covering the period from 2008 to 2012. A new contract has
been signed for 2013 to 2017. The first, now complete, demonstrates the progress made in the control
of network management and maintenance efficiency and of the main cost and revenue factors that
determine its financial position.
The 2008-2012 contract is based on four strategic objectives that are broken down into sub-objectives
that represent a total of 33 RFF commitments. These commitments are tracked in a performance chart
that is presented to the undertaking’s Board of Directors every year.
14
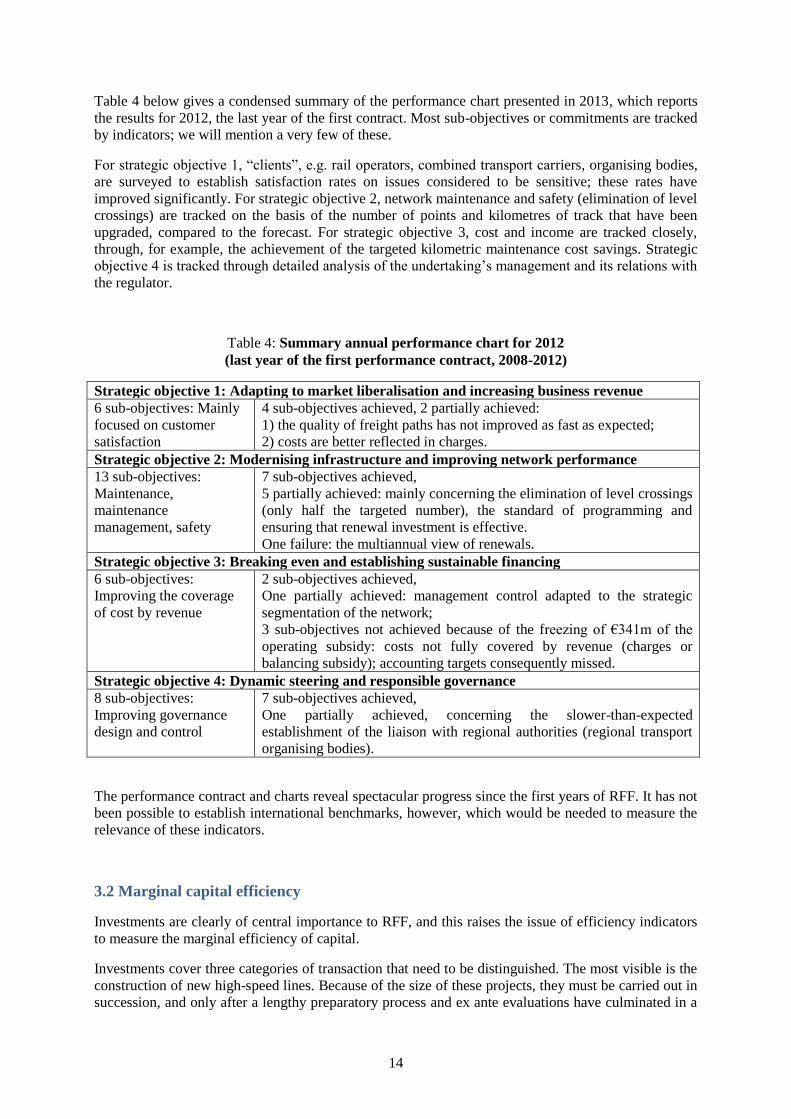
Table 4 below gives a condensed summary of the performance chart presented in 2013, which reports
the results for 2012, the last year of the first contract. Most sub-objectives or commitments are tracked
by indicators; we will mention a very few of these.
For strategic objective 1, “clients”, e.g. rail operators, combined transport carriers, organising bodies,
are surveyed to establish satisfaction rates on issues considered to be sensitive; these rates have
improved significantly. For strategic objective 2, network maintenance and safety (elimination of level
crossings) are tracked on the basis of the number of points and kilometres of track that have been
upgraded, compared to the forecast. For strategic objective 3, cost and income are tracked closely,
through, for example, the achievement of the targeted kilometric maintenance cost savings. Strategic
objective 4 is tracked through detailed analysis of the undertaking’s management and its relations with
the regulator.
Table 4: Summary annual performance chart for 2012
(last year of the first performance contract, 2008-2012)
Strategic objective 1: Adapting to market liberalisation and increasing business revenue
6 sub-objectives: Mainly
focused on customer
satisfaction
4 sub-objectives achieved, 2 partially achieved:
1) the quality of freight paths has not improved as fast as expected;
2) costs are better reflected in charges.
Strategic objective 2: Modernising infrastructure and improving network performance
13 sub-objectives:
Maintenance,
maintenance
management, safety
7 sub-objectives achieved,
5 partially achieved: mainly concerning the elimination of level crossings
(only half the targeted number), the standard of programming and
ensuring that renewal investment is effective.
One failure: the multiannual view of renewals.
Strategic objective 3: Breaking even and establishing sustainable financing
6 sub-objectives:
Improving the coverage
of cost by revenue
2 sub-objectives achieved,
One partially achieved: management control adapted to the strategic
segmentation of the network;
3 sub-objectives not achieved because of the freezing of €341m of the
operating subsidy: costs not fully covered by revenue (charges or
balancing subsidy); accounting targets consequently missed.
Strategic objective 4: Dynamic steering and responsible governance
8 sub-objectives:
Improving governance
design and control
7 sub-objectives achieved,
One partially achieved, concerning the slower-than-expected
establishment of the liaison with regional authorities (regional transport
organising bodies).
The performance contract and charts reveal spectacular progress since the first years of RFF. It has not
been possible to establish international benchmarks, however, which would be needed to measure the
relevance of these indicators.
3.2 Marginal capital efficiency
Investments are clearly of central importance to RFF, and this raises the issue of efficiency indicators
to measure the marginal efficiency of capital.
Investments cover three categories of transaction that need to be distinguished. The most visible is the
construction of new high-speed lines. Because of the size of these projects, they must be carried out in
succession, and only after a lengthy preparatory process and ex ante evaluations have culminated in a

15
decision taken at government level. Depending on the programme, financing can range from 1 to 3
billion euros per year, a figure that can rise by over 4 billion euros if we include transactions by
public-private partnerships.8 The corresponding efficiency indicators can be taken to be those resulting
from project evaluations, i.e. essentially internal socio-economic and financial profitability rates and
the net present value per euro of public money.
The second category concerns investment in network expansion, excluding high-speed lines, and this
mainly consists of network modernisation (centralised points, electrification, etc.) or extensions (port
services). They usually require financing of around 1 billion euros per year and the same socio-
economic and financial assessments apply as to new high-speed lines.
The third category consists of renewal investments that keep the different parts of the network in good
operational condition. When RFF was set up in 1997 and during its first years of operation, the rate of
coverage of full costs by charges was so poor (less than 20%) that these investments were kept
relatively low. An audit on the state of the network carried out by the Lausanne Ecole Polytechnique
Fédérale (Rivier and Putallaz, 2005), highlighted their inadequacy. Since then, a policy to reverse the
situation has pushed investments back up to around 2.5 billion euros per year. Neither RFF nor SNCF
Réseau have their own cash flow, so renewal investments are financed by a regeneration subsidy.
There are specific problems involved in evaluating these transactions, not all of which have been
resolved.
One of the main aims of the 1997 reform was to curb the rail system’s escalating debt. In theory, the
solution that has been implemented prevents this escalation and, de facto, dominates the issue of
marginal capital efficiency.
3.2.1 Article 4, and how it works
Article 4 of the decree that created RFF in 1997 contains a debt-control rule for the rail industry that
concerns new investments. It states that “RFF may not accept any project to invest in the national rail
network that has been assigned to a programme on the request of central government, local
government or a local or national public body, unless the petitioners have endowed it with financial
resources that will prevent any negative impact on the RFF’s accounts during the amortisation of the
investment.”
Under this rule, then, the funding of any new project must be assessed to determine the return on
investment. This discounted revenue gives the amount that the infrastructure manager (RFF and, now,
SNCF Réseau) is likely to commit and, by extension, the subsidies required. These financial resources
correspond to a public financing rate for the project sufficient to ensure that the financial profitability
of the infrastructure manager’s commitment covers both the amortisation of capital and a risk
premium. In short, projects must cover the weighted average cost of capital (WACC).
To take an example, if long-term rates on the financial market9 are 4%, and if the risk premium is also
estimated at 4%, the WACC for the funding secured by the public operator is 8%. As required by the
applicable rules, the infrastructure manager may not launch a project unless its profitability rate is
equal to or higher than 8%. If profitability is lower, additional funding is required to make up the
shortfall.
Meeting the “Article 4” obligation therefore involves a particularly strict evaluation of every project,
in addition to which the contracting authority – the network company, in the case of the rail industry –
must also carry out an assessment of the project’s socio-economic profitability. Under the official
8 PPPs currently concern three high-speed lines: Tours-Bordeaux and two partnership contracts for the Brittany-
Loire line and the Nimes-Montpellier bypass.
9 For the purposes of our example, we have taken rates applied during the first half of 2012 in countries rated
AAA or AA+ to long-term borrowings (20 to 35, or even 40, years).

16
instructions, the socio-economic net present value (NPV) and the ratio of NPV to subsidy must be
calculated for every project.
The issue of optimising investments and the marginal efficiency of capital is based on these
evaluations.
3.2.2 Optimal investment programming
We can only define the right strategy for the system’s efficiency, especially investment selection, if we
know what we want to achieve. Do we need to minimise subsidies by looking for the highest possible
financial profitability? Or, in the tradition of the public sector, should we be trying to maximise socio-
economic NPV?
Factoring in the budgetary constraint answers the question. The network company’s investments are
rarely self-financing and almost always require some level of subsidy. The public body providing the
subsidy will expect positive externalities in return which can be considered to reflect a change in well-
being and to be measured by socio-economic NPV. It therefore controls investment programming but
has a limited financing capacity. Chronologically, the sequence of subsidies is clearly dictated by
budgetary constraints. In theory, then, the public authorities are attempting to optimise investments
within specific constraints. Put simply, for a given programme duration, the exercise is to determine
which of the suggested projects will be selected and establish their optimum completion dates in such
a way as to maximise the programme’s socio-economic NPV for the amount of public money
available.
Subsidy rates naturally play a very important role in the issue of programming, since subsidies
represent the budgetary constraint. A project’s subsidy rate is given by the project’s inherent
profitability and the financial profitability required by the investor, in the case of its being subject, for
example, to an Article 4 obligation.
If we want to compare investment programmes subject to the same public financing constraint,
we just need to know the required subsidy and expected socio-economic NPV for the proposed
projects. In the early Nineties, this exercise was applied to a group of 17 proposed French motorways
(Bonnafous and Jensen, 2005). The results are instructive.
To compare competing programmes, several different orders for the completion of the projects
are tested, exhausting all available public money every year. The projects were ranked according to
several different orders of priority: decreasing order of socio-economic return rate, decreasing order of
financial return on investment, and decreasing ratio of NPV to public subsidy. The target function, i.e.
the NPV of the programme given according to this exercise, is calculated in each case. The exercise
was repeated for different levels of budget.
A first, counterintuitive, finding was that carrying out projects in decreasing order of financial
return gave higher overall NPV than ranking projects by decreasing socio-economic profitability. The
reason is simply that when projects are carried out in decreasing order of financial profitability they
can be launched faster because their higher financial profitability decreases the public money required.
For the same public subsidy, the socio-economic NPV is therefore higher. This welfare gain is further
improved by the financial profitability criterion when public money is limited, a result that has
obvious significance for developing countries, where there is greater pressure on public finances.
A less surprising finding is that ranking projects by decreasing order of NPV to public subsidy
ratio further improves a programme’s welfare gain, whatever the budgetary constraint. On failing to
find a clear demonstration in the literature, the authors offered to show that this order did determine
optimal programming.
A set of 17 projects with 17 different permutations gives around 1034
possibilities, so finding the
optimum order calls for a sophisticated combinatorial search algorithm used in experimental science to
deal with this level of complexity. The programmes examined naturally exhaust the available public

17
financing. These simulations determined a numerical optimum that corresponds to a programme that is
automatically aligned with the NPV-public subsidy ratio, which supports the principle of value for
money. These results are presented in Figure 5, in which the x-axis shows different financial
constraints based on <F>, an average value that has been empirically observed, and the y-axis shows
the additional welfare gain generated by a programme over and above that generated by a programme
in decreasing order of socio-economic profitability.
Figure 5: Additional welfare gain of programmes compared to the ranking by socio-economic
profitability when ranked by financial profitability (IRR), the numerical ideal and the NPV-
public subsidy ratio (o) under different financing constraints
Source: Bonnafous and Jensen, 2005.
This result has previously been formally demonstrated (Roy, 2005; Bonnafous et alii, 2006).
Under a few fairly weak conditions, it was shown that the NPV/public investment ratio was the
project-ranking criterion that maximised overall well-being within the budgetary constraint. This
demonstration appears in Annex 2 as an excellent illustration of the opportunity cost of public funds.
3.2.3 An indicator of the efficiency of the investment programme
Now that we have established an optimal standard, and observed that it is consistent with the value-
for-money criterion, we automatically find ourselves with an efficiency indicator insofar as we can
now easily establish a virtual optimal programme for any given period. For a duration of five years,
for example, which is the term of the last performance contract between the government and RFF
(2008-2012), we know, for the investments made:
- the chronological order of the subsidies given to these investments every year;
- the chronological order of the socio-economic NPV generated.
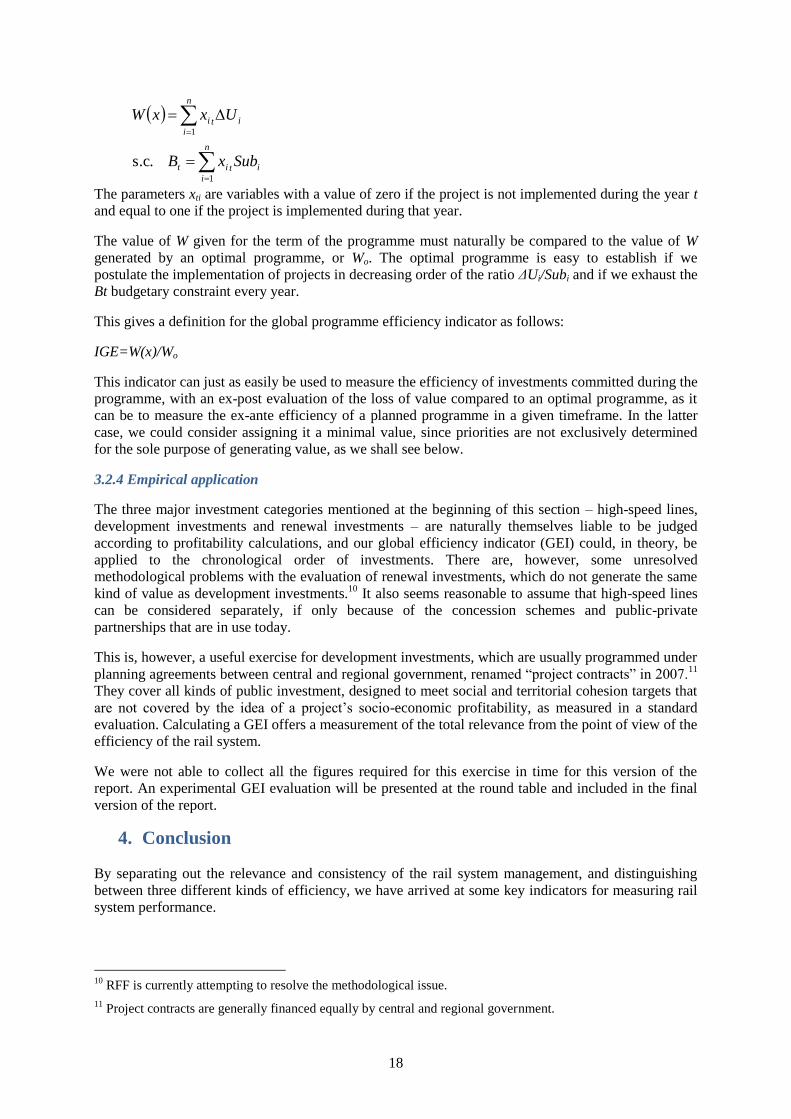
The decision-maker had to choose among n projects i characterised by their net present value ΔUi,
and their need for subsidies Subi, within a budget Bt limiting public spending to the year t. The well-
being function, W, generated by all projects implemented, can then be defined as follows:
18
n
i
itit
n
i
iti
SubxB
UxxW
1
1
s.c.
The parameters xti are variables with a value of zero if the project is not implemented during the year t
and equal to one if the project is implemented during that year.
The value of W given for the term of the programme must naturally be compared to the value of W
generated by an optimal programme, or Wo. The optimal programme is easy to establish if we
postulate the implementation of projects in decreasing order of the ratio ΔUi/Subi and if we exhaust the
Bt budgetary constraint every year.
This gives a definition for the global programme efficiency indicator as follows:
IGE=W(x)/Wo
This indicator can just as easily be used to measure the efficiency of investments committed during the
programme, with an ex-post evaluation of the loss of value compared to an optimal programme, as it
can be to measure the ex-ante efficiency of a planned programme in a given timeframe. In the latter
case, we could consider assigning it a minimal value, since priorities are not exclusively determined
for the sole purpose of generating value, as we shall see below.
3.2.4 Empirical application
The three major investment categories mentioned at the beginning of this section – high-speed lines,
development investments and renewal investments – are naturally themselves liable to be judged
according to profitability calculations, and our global efficiency indicator (GEI) could, in theory, be
applied to the chronological order of investments. There are, however, some unresolved
methodological problems with the evaluation of renewal investments, which do not generate the same
kind of value as development investments.10
It also seems reasonable to assume that high-speed lines
can be considered separately, if only because of the concession schemes and public-private
partnerships that are in use today.
This is, however, a useful exercise for development investments, which are usually programmed under
planning agreements between central and regional government, renamed “project contracts” in 2007.11
They cover all kinds of public investment, designed to meet social and territorial cohesion targets that
are not covered by the idea of a project’s socio-economic profitability, as measured in a standard
evaluation. Calculating a GEI offers a measurement of the total relevance from the point of view of the
efficiency of the rail system.
We were not able to collect all the figures required for this exercise in time for this version of the
report. An experimental GEI evaluation will be presented at the round table and included in the final
version of the report.
4. Conclusion
By separating out the relevance and consistency of the rail system management, and distinguishing
between three different kinds of efficiency, we have arrived at some key indicators for measuring rail
system performance.
10
RFF is currently attempting to resolve the methodological issue.
11 Project contracts are generally financed equally by central and regional government.
19
We are able to deal with and evaluate government decisions in terms of relevance and consistency,
especially in terms of investment, as described in section 3.2. And more generally, comparing
performance to public subsidy produces indicators that are useful for evaluating most rail activities.
The question of operational efficiency allows us to take the examination of subsidies further, with
simple indicators such as cost or level of subsidy per train or passenger-kilometre. These indicators are
most useful when benchmarking different rail operators and different countries. Similarly, we can use
straightforward indicators to evaluate productive efficiency and economic efficiency. What these
approaches have in common is the value for money approach or, if we turn the problem around, the
minimisation of cost for a given service.
Finally, this report is based on the French system, which has just been reformed and will be replaced
by a new system as of January 2015, under the law passed in 2014 (see Annex 3). The new system is
officially expected to generate productivity gains across the entire system. Many observers are
sceptical as to the outcome.

20
Bibliography
Auxiette J. (2013), Un nouveau destin pour le service public ferroviaire français : les propositions des
régions, report to the prime minister and transport minister, 68p.
D. Banister & M. Givoni (2012), High Speed Rail Development in the EU27: Securing the Potential, a
paper presented in Berkeley on 30 November 2012 during the high-speed rail seminar held by the
University of California, Berkeley.
Bianco J.L. (2013), report on the new French rail organisation, 30p.
Bonnafous A. & Jensen P. (2005), Ranking Transport Projects by their Socio-economic Value or
Financial Interest Rate of Return? Transport Policy, No. 12.
Bonnafous A., Jensen P., Roy W. (2006), Le cofinancement usager-contribuable et le partenariat
public-privé changent les termes de l’évaluation des programmes d’investissement public, Economie
et Prévision No. 4-5 (pp 175-176).
CCTN-CGDD (2014), National Transport Accounts, 2013, Volume 1, Commission des comptes
transport de la nation, references, www.statistiques.developpement-durable.gouv.fr.
CGDD (2013), Rail freight, examination of factors in French and German traffic, Etudes et
documents No. 87, July, 23p. www.statistiques.developpement-durable.gouv.fr.
Cour des comptes (National Audit Office) (2014), La grande vitesse ferroviaire, un modèle porté au-
delà de sa pertinence, Rapport public thématique, 172p. www.ccomptes.fr.
Cour des comptes (National Audit Office) (2009), Le transfert aux régions du transport express
régional (TER) : un bilan mitigé et des évolutions à poursuivre, public feature report, 150p.
www.ccomptes.fr.
Crozet Y., (2013), High Speed Rail performance in France: from appraisal methodologies to ex-post
evaluations, Discussion paper 2013-26 ITF-OCDE, prepared for the round table on the Economics of
Investment in High-Speed Rail, 18-19 December 2013, New Delhi, 34p,
www.internationaltransportforum.org.
Crozet Y. & Chassagne F., (2013), Rail access charges in France: Beyond the opposition between
competition and financing, Research in Transportation Economics, Volume 39, Issue 1, March 2013,
pp 247–254 http://dx.doi.org/10.1016/j.retrec.2012.06.021.
Crozet Y., Nash C. & Preston J., (2012), Beyond the quiet life of a natural monopoly: Regulatory
challenges ahead for Europe’s rail sector, Policy paper, CERRE, Brussels, December, 24p,
http://www.cerre.eu/new-policy-paper-regulatory-challenges-ahead-europes-rail-sector.
Crozet Y. & Raoul J.C., (2011) Transport ferroviaire, avis de tempête organisationnelle, in Revue
Transports No. 468.
Crozet Y. & Desmaris C., (2011), Le transport ferroviaire régional de voyageurs : un processus
collectif d’apprentissage, Recherche Transports Sécurité, Volume 27, No. 106, August 2011, pp143-
162.
Crozet Y., (2010), TGV, le temps des doutes, Revue Transport, April 2010.
Desmaris C. (2014a), La régionalisation ferroviaire en Suisse : la performance sans la compétition.
Un exemple pour la France ? Revue Politiques et Management Public. 31/1 January-March, pp23-45.
Desmaris C. (2014b). Une réforme du transport ferroviaire de voyageurs en Suisse : davantage de
performances sans concurrence ? Les Cahiers Scientifiques du Transport No. 65, pp67-97.
Direction générale des infrastructures, des transports et de la mer (2011), Schéma national des
infrastructures de transport (SNIT), 220p,
www.developpement-durable.gouv.fr/IMG/pdf/projet_de_SNIT_181011.pdf.

21
Duron P., 2013, Mobilité 21, pour un schéma national de mobilité durable, report to the minister for
transport, sea and fisheries, 88p, www.developpement-durable.gouv.fr/IMG/pdf/CM21.
EPFL 2012, report for RFF, network audit (Audits Rivier revisités) by Y. Putallaz & P. Tzieropoulos,
LITEP Doc 346-03, September, 33p.
European Commission (2001), European Transport Policy for 2010: Time to Decide, white paper,
COM (2001) 370
(http://ec.europa.eu/transport/themes/strategies/doc/2001_white_paper/lb_com_2001_0370_en.pdf).
European Commission (2011), Roadmap to a Single European Transport Area – Towards a
Competitive and Resource Efficient Transport System, white paper, COM (2011) 144 (http://eur-
lex.europa.eu/LexUriServ/LexUriServ.do?uri=COM:2011:0144:FIN:EN:PDF).
European Commission (2014a), EU transport in figures, Statistical pocketbook 2014, Publication
Office of the European Union.
European Commission (2014b), Staff Working document accompanying the Report from the
Commission to the Council and the European Parliament, Fourth report on monitoring development in
the rail market, {COM(2014) 353 final},
http://ec.europa.eu/transport/modes/rail/market/doc/swd%282014%29186_final_en.pdf.
EVES-Rail, 2012, Economic effects of vertical separation in the railway sector, report to CER
(Community of European Railway and Infrastructure companies), CER & innoV, Amsterdam, 188p.
Guihéry L. (2011), Transport ferroviaire régional en Allemagne : l’exemple de la région de Leipzig,
Recherche Transport Sécurité, 27/106· August, pp 163-177.
Katz M. & Shapiro C (1985), Network externalities, Competition and Compatibility, American
Economic Review, June, 75, 424-40.
Laffont J.-J. & Tirole J. (1991), The Politics of Government Decision-Making: A Theory of Regulatory
Capture. Quarterly Journal of Economics 106 (4), 1088-1127.
Mc Cullough G. (2005), US Railroad Efficiency: A Brief Economic Overview, working paper,
University of Minnesota, 2005, 12 pp.
Nash. C. (2009), When to Invest in High Speed Rail Links and Network? discussion paper,
International Transport Forum (ITF-OECD)18th Symposium, Madrid, 16-18 November, 24 p.
www.internationaltransportforum.org.
Rivier R., Putallaz Y. et al. (2005). Audit of the French national rail network. Rapport principal et
rapports détaillés sectoriels. EPFL, 2005.
Roy, W. (2005), Evaluation des programmes d’infrastructure: Ordre optimal de réalisation sous
contrainte financière, working paper, Laboratoire d’économie des transports, http://halshs.archives-
ouvertes.fr/halshs-00003971.
Taroux J.P. (2013), Bilans ex post d’infrastructures, analyse des coûts et des trafics, report and
documents, commissariat général à la stratégie et à la prospective, 14p.
http://www.strategie.gouv.fr/blog/wp-
content/uploads/2013/09/CGSP_Evaluation_socioeconomique_170920131.pdf.
UIC/IRU, Union internationale des Chemins de fer (2012), 2010, International Railways Statistics,
published by the International Railway Union’s statistics centre, www.uic.org/stat.
22
Annex 1: the SNCF Group and the SNCF and RFF industrial and commercial public
undertakings
The SNCF (Société nationale des chemins de fer français) was created when the railways were
nationalised in 1937, and for many years operated as a commercial undertaking in which the State was
the majority shareholder. Its status did not change until the early Eighties, during the wave of
nationalisations launched under François Mittérand’s presidency, when the SNCF became an
industrial and commercial public undertaking (EPIC). The infrastructure manager RFF (Réseau ferré
de France), which was set up in 1997, has the same status. These undertakings are under full
government control and therefore enjoy a de facto State guarantee. They cannot fail, and this allows
them to borrow on the financial markets at preferential rates. The SNCF’s main bank is the Banque de
France.
The SNCF industrial and commercial public undertaking, which operates in France, is just one part of
the SNCF group. In 2012, the SNCF group, which operates in 120 countries and employs 250 000
people, generated revenue of 33 billion euros. The group’s international activities account for just over
one quarter of this figure.
The group has five divisions:
-SNCF Infra, RFF’s delegated infrastructure manager: 5.5 billion euros in revenue
-SNCF Proximités: 12.2 billion euros in revenue, 17% of which is generated outside France, mainly
by Kéolis, a subsidiary dedicated to urban and regional passenger transport
- SNCF Voyages: 7.5 billion euros in revenue, dedicated to long-haul passenger transport (20% of
revenue generated outside France)
- Gares et Connexions: 1 billion euros in revenue, chiefly generated by the management of 3 029
stations in France
- SNCF Geodis: 9.5 billion euros in revenue. SNCF Geodis is dedicated to freight transport. Rail
transport only accounts for 17% of the total. Fret-SNCF – SNCF Geodis’s industrial and commercial
public undertaking – is part of SNCF Geodis. But it also has commercial subsidiaries such as
CAPTRAIN, which operates in Europe, VFLI, which operates mainly in France, VIIA and a
subsidiary dedicated to combined transport.
The development of private-sector subsidiaries, both in France and overseas, has allowed the SNCF to
move into new sectors: coach transport (IDbus), carpooling (IDvroom), online travel sales, hotel
bookings and car rental (Voyages-sncf. Com), etc.
Source: http://www.sncf.com/fr/portrait-du-groupe/un-groupe-de-service
23
Annex 2: Formal demonstration of the optimal order of project implementation
The theoretical model established by William Roy (2005) formally resembles the programme of
the consumer for discrete goods. Let us assume that the decision-maker has to choose among n
projects i, characterised by their net present value ΔUi, and their need for subsidies Subi, with ΔUi>0
and Subi >0 i=1,…,n. The objective function is the well-being function W generated by all the
projects, subject to the budget constraint B capping public spending. The optimisation programme can
then be written as follows:
,...,1 ,0 -1
,...,1 ,0
0
s.c.
1
1
nix
nix
SubxB
UxxWMax
i
i
n
i
ii
n
i
iix
The parameters xi are continuous variables, which have a zero value when the project is not
implemented and are equal to one when the project is fully implemented. We shall assume that it is
possible to implement project k partially, with parameter xk then ranging between 0 and 1.
The solution vector x* is therefore constituted by a value set 1 (projects to be implemented), a
value set 0 (projects not to be implemented), and a value ranging between 0 and 1 for the “borderline”
project k (which is very likely not to be completed if the constraint is totally inflexible). Assuming that
the projects are ranked by their implementation priority, we can write this solution vector as:
rejected projectsaccepted projects
0,.......,0,,1,........1* kxx
The Lagrangian of the optimisation problem is written as follows:
n
i
ii
n
i
ii
n
i
ii
n
i
ii
nnn
xxSubxBUx
xxL
1111
11,1
1
,...,,,...,,,...,
The Kuhn and Tucker conditions imply that at optimum:
n1,...,i ,0. iiii SubU
01
n
i
iiSubxB
0ii x et n1,...,i ,01 ii x
The economic interpretation of this optimisation is quite simple: is the variation in the
community surplus generated by a loosening of the public-funding availability constraint. Being equal
to the maximum surplus amount that the community can hope to obtain from an additional budgetary
unit, represents the opportunity cost of public funds. It is important to distinguish this opportunity
cost from the shadow cost of public funds, which results from the costs of collecting taxes and the
price distortions associated with raising taxes by an additional unit. It is therefore not by chance that
we are calling a scarcity coefficient: as the dual value of the budget constraint, it really is the signal
“price” of the scarcity of public funding.
For the projects accepted (indexed j), the Kuhn and Tucker conditions imply that:

24
– The constraint 0ix is not saturated, and therefore 0j
– The constraint 01 ix is saturated, and therefore 0j
Whence 0. jj SubU
j
j
Sub
U
The set of acceptable projects is therefore composed of those having a ΔUj/Subj ratio higher than
, the opportunity cost of public funds. For projects rejected or postponed (indexed l), the optimisation
conditions imply that:
– The constraint 0ix is saturated, and therefore 0l
– The constraint 01 ix is not saturated, and therefore 0l
Whence 0. ll SubU
l
l
Sub
U
In all, the projects indexed j selected and the projects indexed l not selected confirm the
fundamental relationship:
l
l
j
j
Sub
U
Sub
U
Accepted projects must always have a higher ΔU/Sub ratio than rejected projects. Here, then, is
the demonstration by numerical simulation presented in section II.2.: even if the decision-maker
ignores , he or she must prioritise projects with the highest “collective relevance per euro of
taxypayer’s money invested”. This result confirms the wisdom of the widely accepted effectiveness of
the value-for-money criterion.

25
Annex 3: The 2014 rail reform
On 4 August 2014, the French government’s official journal of legal notices published a new law
reorganising the French rail system, which will impact some of the changes made in 1997. In 2011,
faced with the poor performance of the French rail system (Crozet and Raoul, 2011) and the pressure
on the SNCF’s revenue from the rise in high-speed rail charges, the government held a rail conference
(Les Assises du ferroviaire). At the request of the SNCF, the conference focused on the transaction
costs involved in separating the infrastructure manager and the rail operator. The reform is based on
this work and on reports produced for the new administration since 2012 (Auxiette, 2013; Bianco,
2013). At the heart of the reform is the adoption of an institutional model based on the Deutsche Bahn
in Germany, where the infrastructure manager, DB Netz, is part of the rail holding company.
As of January 2015, we will have an infrastructure manager called SNCF-Réseau and a rail operator
called SNCF-Mobilité, with different entities for main lines, regional lines, stations and freight, etc.
This is where parallels with Germany end, because the new entity will not be a public limited
company, but an industrial and commercial public undertaking (EPIC). And there will not just be one
EPIC, but three. The two mentioned above will be subsidiary to a main EPIC that will handle the
strategic functions. Why three and not just one? And why no public limited company?
A single EPIC is not possible for financial reasons. Reconciling the RFF’s statement of financial
position, and all its liabilities – including over 33 billion euros in debt – with the SNCF’s income
statement amounts to an impossible consolidation. The SNCF’s surpluses, such as they are, cannot
support the financial costs of the debt and the RFF’s chronic deficit, largely caused by regeneration
costs. But the SNCF cannot receive balancing subsidies because it is in competition. To prevent this,
the State would have had to shoulder the rail debt twenty years ago, as it did in Germany, before
merging RFF with SNCF – an option it ruled out. Having a single EPIC would also infringe EU
regulations and the rules of the fourth rail package that requires complete separation – a so-called
“Chinese wall” – between the infrastructure manager and the rail operator.
So the three EPICs are there to ensure the financial separation of SNCF from RFF (no accounting
consolidation; the SNCF does not have to fund RFF’s deficit). They also help ensure the independence
of the infrastructure manager, as required by the EU. So the problem is this: what exactly does the
main EPIC do? Is it just a structure set up to co-ordinate the two separate entities and allow the
government to keep a watchful eye on the whole of the public unit and settle disagreements by, for
example, entrusting its chairmanship to a political personage? It looks as if we are headed instead for
an entity with over 10,000 employees, responsible both for finance and the management of human
resources (with rail worker status). The question of personnel is crucial, and a collective bargaining
agreement is planned for the rail industry that will define the HR framework applicable to these
employees. The unions are demanding that SNCF‘s competitors be forced to adopt the same practices
as the historic operator.
In its own way, in what it says and what it doesn’t say (it breathes not a word about competition!), the
rail reform bill reveals the limits of public policy in the French rail industry. In focusing on
institutional issues, such as the number and remit of the three EPICs, the reform skirts around such
organisational issues as the incumbent operator’s stranglehold on power (Laffont and Tirole, 1991).