Efficiency in the Vietnamese banking system: a DEA double ... · number of joint stock commercial...
31
1 Efficiency in the Vietnamese banking system: a DEA double bootstrap approach 1 Roman Matousek Kent Business School, University of Kent Thao Ngoc Nguyen 2 Nottingham Business School, Nottingham Trent University Chris Stewart School of Economics, History and Politics, Kingston University This study analyses bank efficiency in Vietnam from 1999 to 2009. We use a unique data sample that allows us to capture the development of the Vietnamese banking sector over the last decade. We apply an advanced methodological approach introduced by Simar and Wilson (2007) to examine bank efficiency in Vietnam. An integral part of the analysis is to explore the determinants of bank efficiency. The results indicate that large and very large banks are more efficient than small and medium sized banks with small banks having the lowest efficiency scores in the system. We also argue that banks with large branch networks and those that have been in existence for a long time are less efficient than other banks. Keywords: Banking; Efficiency; DEA; Two-stage double bootstrap method; Vietnam. 1. Introduction 1 We are grateful to the participants of the research seminars at British and Accounting Finance Association Conference in Nottingham on 9 th and 10 th September 2013; and Accounting and Finance in Emerging Economies Conference in London on 25 th October 2013, for their helpful suggestions. We would also like to thank Marianne Schulze-Ghattas for her helpful comments on an earlier version of this paper. Any remaining errors are the responsibility of the authors. 2 Corresponding author: Thao Ngoc Nguyen, Nottingham Business School, Nottingham Trent University, Burton street, Nottingham NG1 4BU, Email: [email protected] or [email protected], Direct Line: +44 (0) 11 5848 3878.
Transcript of Efficiency in the Vietnamese banking system: a DEA double ... · number of joint stock commercial...

1
Efficiency in the Vietnamese banking system: a DEA double bootstrap approach1
Roman Matousek Kent Business School, University of Kent
Thao Ngoc Nguyen2
Nottingham Business School, Nottingham Trent University
Chris Stewart School of Economics, History and Politics, Kingston University
This study analyses bank efficiency in Vietnam from 1999 to 2009. We use a unique data sample that
allows us to capture the development of the Vietnamese banking sector over the last decade. We apply
an advanced methodological approach introduced by Simar and Wilson (2007) to examine bank efficiency
in Vietnam. An integral part of the analysis is to explore the determinants of bank efficiency. The results
indicate that large and very large banks are more efficient than small and medium sized banks with small
banks having the lowest efficiency scores in the system. We also argue that banks with large branch
networks and those that have been in existence for a long time are less efficient than other banks.
Keywords: Banking; Efficiency; DEA; Two-stage double bootstrap method; Vietnam.
1. Introduction
1 We are grateful to the participants of the research seminars at British and Accounting Finance Association Conference in Nottingham on 9
th and 10
th September 2013; and Accounting and Finance in Emerging Economies Conference in London on
25th
October 2013, for their helpful suggestions. We would also like to thank Marianne Schulze-Ghattas for her helpful comments on an earlier version of this paper. Any remaining errors are the responsibility of the authors. 2 Corresponding author: Thao Ngoc Nguyen, Nottingham Business School, Nottingham Trent University, Burton street, Nottingham
NG1 4BU, Email: [email protected] or [email protected], Direct Line: +44 (0) 11 5848 3878.
ku34872
Typewritten Text
ku34872
Typewritten Text
ku34872
Typewritten Text
ku34872
Typewritten Text
ku34872
Typewritten Text
© 2016. This manuscript version is made available under the CC-BY-NC-ND 4.0 license http://creativecommons.org/licenses/by-nc-nd/4.0/
2
Vietnam has become one of Asia's economic success stories in recent years with average economic
growth of 7.8% per annum in the last decade. After the recent global financial crisis, economic growth
remains moderate and continues to come in below its potential. The Vietnamese banking system plays a
key role in the economic system. The banking system is a backbone of the Vietnamese economy and
contributes about 16% to 18% towards annual Gross Domestic Product (GDP). Despite the relatively long
transition process of the banking system, Vietnamese banks are still undercapitalized. The regulatory
reforms are rather slow, which remains a problem for its further development. Vietnamese banks operate
in a challenging business environment that is characterized by tight credit margins and a large volume of
non-performing loans (Dinh and Kleimeier, 2007; KPMG, 2013; SBV, 2014 and WB, 2014). 3
Efficiency at the unit level has become a contemporary major issue, due to the increasingly intense
competition, globalization, technological innovation and increased deregulation Therefore it is important
for banking regulators and market analysts to have sufficient relevant information that aids in the
identification of actual or potential problems in the banking systems and individual banks. Such
information is also valuable in order to compare competitiveness and efficiency of banking systems. If
there is significant inefficiency in the sector, in general, and in different groups of banks, in particular,
there may be room for structural changes, increased competition and mergers and acquisitions to
enhance the efficiency and productivity of the banking system, and to speed up a country’s financial
development and economic growth (Bonin et al., 2005; Fries and Taci, 2005; Staikouras et al., 2008;
Huang et al., 2015 and Ghosh, 2015).
3 On 1
st March 2012, the plan on the restructuring of the system of credit institutions was approved by the Prime Minister under Decision
No. 254/QD-TTg. The State Bank of Vietnam Governor later signed Decision No. 734/QD-NHNN setting the plan of action for the banking sector to implement Decision No. 254. These decisions are to prevent collapse and keep banking operations under state control. The process of reorganizing, strengthening and restructuring the credit institution system helps minimize losses and expenses incurred by the state budget for tackling the problems of the system.

3
There have been a few empirical studies that estimate bank efficiency in Vietnam (Nguyen, 2007; Nguyen
and De Borger, 2008). We contribute to this empirical literature by using an extensive panel data set of 48
Vietnamese commercial banks during the period from 1999 to 2009. Such a large sample and relatively
long period allow us to capture the changes over the financial crisis. No previous study of Vietnam uses
such an extensive data set that covers before and during the global financial crisis.
The objective of our study is threefold. First, we analyse bank efficiency in Vietnam by applying an
advanced semi-parametric two stage method introduced by Simar and Wilson (2007). This approach
enables us to obtain more reliable evidence compared to previous studies analysing bank efficiency
(Barros et al., 2008). Second, we identify the determinants of bank efficiency. Third, we provide a
detailed analysis of bank efficiency for different ownership structures and bank size.
Our results from the Simar and Wilson (2007) approach indicate that large and very large banks are more
efficient than small and medium sized banks. Non-state owned commercial banks are more efficient than
state owned commercial banks assuming overall efficiency. The number of branches and the number of
years since establishment both have a negative and significant effect on efficiency.
The paper is structured as follows. The next section details developments in the Vietnamese banking
system in the period from 1986 to 2009 while section 3 provides a brief review of the previous empirical
literature on bank efficiency. Section 4 focuses on methodology and data. Empirical results are presented
in section 5 and section 6 provides a conclusion of the main findings.
2. The Vietnamese banking system during 1986-2009
From 1986 the Vietnamese banking system was transformed from a mono to two-tier banking system.
The two-tier banking system has the State Bank of Vietnam as the central bank (tier 1) and four
specialised state owned banks (tier 2). Order No. 218/CT dated 23rd July 1987 was the first decision on the
State Bank of Vietnam operation mechanism and organisation apparatus, turning the State Bank of
Vietnam's branches into public commercial banks. After that, the Council of Ministers promulgated the
Decision No. 53/HDBT on 26th March 1988. The first round of the reform had been completed with the
launching of new business accounting mechanisms. This reform linked banking change to inflation
4
control. The state management of money, credit and banking services was clearly detached. The State
Bank of Vietnam was only in charge of state management functions and all other banking institutes doing
business. The function of the State Bank of Vietnam involved the monetary, credit and banking operation
of the entire country so as to stabilise the value of the currency and promote economic growth. State
owned banks became more independent and, in principle, more responsibility for their profits and losses
that were not transferred to the State Bank of Vietnam as before (Kousted et al., 2005: 12). On 1st
October 1990, the Decree-Laws on the State Bank and Decree-Laws on Banks, Credit Operatives and
Finance Companies came into force and was the second round of reform, which led to the first
appearance of joint stock commercial banks, joint venture commercial banks and branches of foreign
banks.
In Table 1, we show a dynamic growth of commercial banks in Vietnam. With extended networks in
almost all provinces and larger cities, state owned commercial banks have a competitive edge in providing
banking services. Although joint stock commercial banks increased their numbers immediately after their
appearance in 1990 (in 2009 there were 37 joint stock commercial banks), the leading positions in the
market still belonged to state owned commercial banks. Three out of five state owned commercial banks
accounted for 45% of customer deposits, 41% of total assets and 51% of customer loans of the banking
system in 2009 (Nguyen and Stewart, 2013). State owned commercial banks were originally sector
departments under the State Bank of Vietnam, with specified lending programmes to state owned
enterprises which were based on government policies.
Non-state owned commercial banks consist of joint stock commercial banks, branches of foreign banks,
joint venture commercial banks and foreign commercial banks4. Unlike state owned commercial banks a
number of joint stock commercial banks make profits due to good performance. Joint stock commercial
banks have achieved average returns on equity between 15% and 30% from 1999 to 2009. Being less than
15 years old, joint stock commercial banks are relatively young and they can be divided into three groups:
(1) the top five large urban banks; (2) a smaller group of banks that are either growing rapidly or have
established a niche; and (3) twelve small rural joint stock commercial banks. The top five urban banks are,
Techcombank, Sacombank, VIBBank, Asia Commercial Bank, and East Asia Commercial Bank. The smaller
4 Foreign commercial banks normally transformed out of branches of foreign banks. Data on assets, loans and deposits of branches of foreign
banks are very small compared to other banks. Therefore, in our application, non-state owned commercial banks consist of joint stock commercial banks, joint venture commercial banks and one foreign commercial bank.

5
urban joint stock commercial banks include HabuBank, Viet A Bank and Saigon Bank. Small rural
commercial banks were all transformed into city commercial banks at the end of 2010, such as, An Binh
Bank, Saigon-Hanoi Bank, Petrolimex Group Bank, Dai A Bank, etc. These banks developed throughout the
country, not just in rural areas, and with help from big business and foreign investors they also performed
well in the 2000s. The number of branches of foreign banks increased from 18 banks in 1995 to 48 banks
in 2009. However, each foreign bank normally has one branch in either Hanoi or Ho Chi Minh City. Hence,
their assets, loans and deposits are very small compared to state owned commercial banks, joint stock
commercial banks and joint venture commercial banks. Despite Foreign Direct Investment in US dollar
terms growing by a factor of eight between 1990 and 2005, foreign companies are still hesitant in
deciding whether or not to choose domestic banks when they enter this new market. The number of joint
venture commercial banks has increased slightly from four to six banks between 1995 and 2009. The first
foreign commercial bank (being HSBC) had a license to set up a wholly foreign-owned bank from 2008
(Nguyen and Stewart, 2013).
The credit growth rate of the banking system increased to 37.8% in 2007 and peaked at an alarming 63%
in the first quarter of 2008 (WB, 2008: 3). This has been the highest growth rate within the past decade.
When the inflation rate and trade balance deficit had become more serious, the government applied a
traditional tightening of monetary policy in order to reduce money supply circulation, which affected the
banking system. Compulsory measures were necessary for banks to reorganise and strengthen their
organisations.
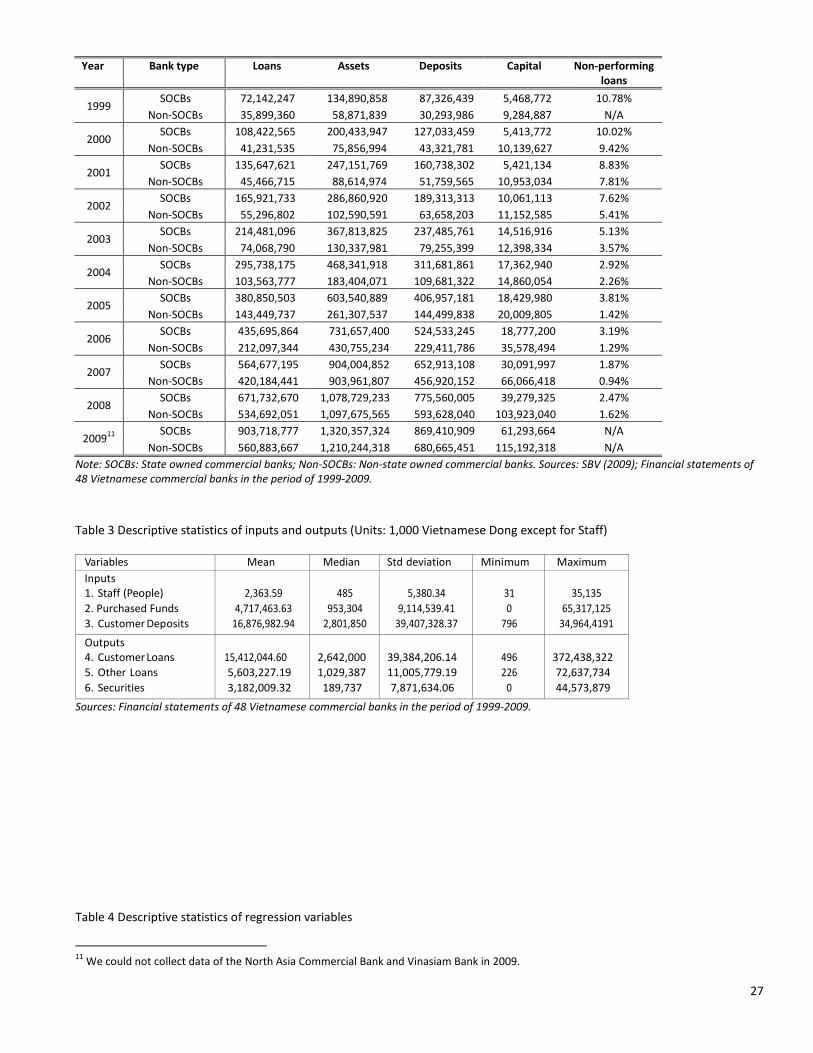
Table 2 shows data on loans, assets, deposits, capital and non-performing loans of the Vietnamese
banking system (state owned commercial banks and non-state owned commercial banks) from 1999 to
2009. On the whole, loans, assets, deposits and capital increased gradually over the period. Vietnamese
banks were burdened by a high volume of non-performing loans, particularly during the 1990s; however
these generally decreased from 1999 to 2009. Non-performing loans of non-state owned commercial
banks are typically lower than those of state owned commercial banks.
In terms of regulation, the State Bank of Vietnam aims to create a banking supervision development
(following Basel) from 2010 onwards. Meanwhile, the coverage, measures and procedures of banking
supervision and monitoring are to be reformed in accordance with the development of internet

6
technologies and banking technology. This will be done by applying key principles of international
standards on banking supervision (Basel I and Basel II). The old capital adequacy ratio standards for banks
in Basel I and Basel II are 8% and 12%, respectively. The capital adequacy ratio for the Vietnamese
commercial banks is to be adjusted to 9% (as Circular No. 13/TT-NHNN dated 20th May 2010 of the State
Bank of Vietnam).
3. Literature review
Empirical research on bank efficiency in transition economies has been intensive in last decade. Bonin et
al. (2005) applied a stochastic frontier approach to analyse the effects of bank ownership on bank
efficiency and concluded that foreign banks are more cost-efficient than other banks. Fries and Taci
(2005) also employed a stochastic frontier approach to investigate efficiency in 15 transition countries.
They concluded that foreign banks show higher cost efficiency compared with domestic banks and that
state-owned commercial banks exhibit the lowest efficiency among the group analysed. They stressed
that cost efficiency of small- and medium- sized domestic banks differ significantly from foreign and state-
owned banks. Staikouras et al. (2008) analysed the cost efficiency by applying a stochastic frontier
approach in six transition European countries over the period 1998-2003. They concluded that foreign
banks and banks with higher foreign bank ownership involvement show higher efficiency. Huang et al.
(2015) applied metafrontier directional technology distance function under a stochastic framework to
examine and compare bank efficiencies of 17 Central and Eastern European countries from 1995 to 2007.
They found that the estimated technology gap dominates technical efficiencies. Using data for 2000–
2012, Ghosh (2015) utilized the natural experiment of the Arab Spring to examine its impact on the risks
and returns of the Middle East and North Africa banks. The analysis indicated that the Arab Spring
lowered bank profitability by roughly 0.2% and raised bank risk by 0.4% points.

7
In Vietnam, after the transition in 1986 the empirical research on bank efficiency used a small
unrepresentative number of banks and covered only a short time period. The problem of data collection
made it difficult for researchers to investigate the issue through non-parametric methods. The research of
Nguyen (2007) measured efficiency by employing data envelopment analysis (DEA). His research has been
applied to a sample of only 13 banks in Vietnam over the period of 2001-2003. Nguyen and De Borger
(2008) considered single bootstrap efficiency and the Malmquist Index for 15 banks for the period of
2003-2006. No previous study has explicitly applied the double bootstrap method of Simar and Wilson
(2007) on the Vietnamese banking system, our paper does. Vietnam’s economy in general and the
banking system in particular faced difficult times in 2001 and 2008 (Global crisis). By restricting time
spans, previous studies could not provide a comparative analysis of efficiency before and during the
global financial crisis. In contrast, our more extensive data set is available before and during the global
financial crisis period (1999 – 2009) and therefore can assess the impact of the crisis on efficiency.
In addition, the previous research on Vietnamese banking efficiency did not consider state owned
commercial banks as dominant in the banking system. The efficiency scores of banks by type (state owned
commercial banks and non-state owned commercial banks) and asset size (small, medium, large and very
large banks) have not been previously considered, whereas we do. Further, it has been suggested by
various writers that researchers can adopt any measure of output for the financial firm as long as the
measure is consistent with the researcher’s goal (Sealey and Lindley, 1977: 1252). Previous research on
the Vietnamese banking system that has used core labour and deposits as inputs includes Nguyen (2007)
and Nguyen and De Borger (2008). Nguyen (2007) employed the two outputs of interest and non-interest
income and Nguyen and De Borger (2008) added consumer loans as an output. However, due to limited
data, neither of these papers employed purchased funds data as an input or business loans data as an
output, which we do. Our research is the first to estimate level of bank efficiency in Vietnam using all the
required inputs and outputs as suggested by the intermediation approach (Berger and Mester, 1997).
Nguyen (2007) argued that the average cost efficiency of their sample of banks was about 60.6%, and the
average annual growth of the Malmquist index5 was negative, being –2.2% over the study period.
Conversely, total factor productivity increased by 5.7% between 2001 and 2003, while total factor
productivity in 2003 was 15.1% higher than in 2002. This total factor productivity improvement was
5 The Malmquist index is an extension of DEA.
8
achieved primarily by greater technical efficiency and, to some extent, by technological advancement. He
also argued that the technical efficiency of the Vietnamese banking system declined from 0.912 in 2001
to 0.895 in 2002. Nguyen and De Borger (2008) found that the productivity of Vietnamese banks tended
to decrease over their (small) sample period, except for the year 2005 – although the bootstrapping
results indicate that the productivity change between 2004 and 2005 was not significant. However,
neither Nguyen (2007) or Nguyen and De Borger (2008) considered the impacts of explanatory variables
on the inputs and outputs, whereas we do.
The Simar and Wilson (2007) DEA bootstrap procedure for estimating efficiency has been applied recently
by, for example, Barros et al. (2008), Brissimis et al. (2008) and Wijesiri et al. (2015). In the first stage, DEA
is used to estimate the relative efficiency scores in the sample using, alternatively, constant returns to
scale (Charnes et al., 1978) and variable returns to scale (Banker et al., 1984). In the second stage, the
Simar and Wilson (2007) procedure is applied to bootstrap the DEA scores with a truncated regression.
Using this approach enables us to obtain more reliable evidence compared to previous studies analysing
bank efficiency (Barros et al., 2008). Firstly, the true efficiency score is not observed directly, rather it is
empirically estimated. Secondly, the empirical estimates of the efficiency frontier are obtained based on
the chosen sample of banks, thereby ruling out some efficiency production possibilities not observed in
the sample (Simar and Wilson, 2007). Thirdly, the DEA two-stage procedure also depends upon other
explanatory variables, which are not taken into account in the first-stage efficiency estimation. This
implies that the error term must be correlated with the second-stage explanatory variables. Fourthly, the
domain of the efficient score is restricted to the zero-one interval, which should be taken into account in
the second-stage estimation stage. The method introduced by Simar and Wilson (2007) overcomes these
difficulties by adopting a procedure based on a double bootstrap that enables consistent inference within
models and explains efficiency scores while simultaneously producing confidence intervals (Barros et al.,
2008: 3-4). Therefore, bias-corrected double bootstrap efficiency methods are preferred for inference
(Simar and Wilson, 2007).
Based on Simar and Wilson’s (2007) double bootstrap procedure, Barros et al. (2008) investigated
commercial banks operating in thirteen EU countries between 1993 and 2003. They found that legal
tradition and foreign ownership have implications for public policy. Competition can be enhanced by
policies designed to increase foreign bank penetration. Further, location does not affect performance

9
significantly. Instead efficiency is explained by bank size and the relative importance of a bank’s
traditional activities. Brissimis et al. (2008) employed Simar and Wilson’s (2007) bootstrap procedure to
examine 364 banks from ten newly acceded EU countries between 1994 and 2005. Their results indicate
that both banking sector reform and competition exert a positive impact on bank efficiency, while the
effect of reform on total factor productivity growth is significant only toward the end of the reform
process. The effect of capital and credit risk on bank performance is in most cases negative, while it
seems that higher liquid assets reduce efficiency. Wijesiri et al. (2015) examined 36 microfinance
institutions in Sri Lanka. The results from the first stage indicate that many microfinance institutions do
not escape criticism of financial and social inefficiency. The second stage regression reveals that age and
capital-to-assets are significant determinants of financial efficiency whereas age, type of institution and
return-on-assets are the crucial determinants of social efficiency.
4. Methodology and data
As discussed above we apply Simar and Wilson’s (2007) method in a two-stage procedure to estimate
efficiency in the Vietnamese banking system. In the first stage, we adopt DEA to estimate the relative
efficiency scores in the sample using, alternatively, constant returns to scale and variable returns to scale.
In the second stage, we apply the Simar and Wilson (2007) procedure to bootstrap the DEA scores with a
truncated bootstrapped regression. We use both Algorithms 1 and 2 of Simar and Wilson (2007), which
are discussed in the Appendix. The bias-corrected Algorithm 2 is preferred and used for inference (Simar
and Wilson, 2007). Explanatory variables (assets, non-performing loans, branch networks, the number of
years since establishment and city banks) are also included in the second stage for estimation. Efficiency
scores are investigated using asset size (small, medium, large and very large banks) and bank type (state
owned commercial banks, joint stock commercial banks and joint venture commercial banks). We
investigate, using the semi-parametric model of Simar and Wilson (2007), the level of efficiency of the
Vietnamese banking system as a whole and for the sub-samples: state owned commercial banks and non-
state owned commercial banks (joint stock commercial banks, joint venture commercial banks and
foreign commercial banks). This is the first time that an extensive panel data set has been employed to
examine efficiency in the Vietnamese banking system. Our data set includes 48 Vietnamese commercial
banks over the period 1999 to 2009.

10
4.1 Input and output specification
There is no simple solution to the problem of input and output specification; reasonable arguments can
be made for all approaches. There are two main approaches to the input and output specification of
financial institutions, that is, the production approach and the intermediation approach (Matthews and
Thompson, 2008). The production approach considers that banks produce accounts of various sizes by
processing deposits and loans, incurring in capital and labour costs. Inputs are measured as operating
costs and output is measured as number of deposits and loans accounts. The intermediation approach
considers banks as transforming deposits and purchased funds into loans and other assets. Inputs are
expressed as total operating costs plus interest costs and deposits while output is measured in money
units.
These two approaches have been applied in different ways depending on the availability of data and the
purpose of the study. We assume that the Vietnamese banking system behaves as the transformer of
deposits and purchased funds into customer loans and other loans. Therefore, we use the intermediation
approach classified by Berger and Mester (1997). This choice is also due to the availability of data. All the
data are indices of bank i in year t. Inputs are: (i) staff, measured by the number of employees; (ii)
purchased funds are deposits from the State Bank of Vietnam and other banks in the system; and (iii)
customer deposits (or core deposits), which are described as total deposits from corporate and private
customers. Outputs include: (i) customer loans, which are total loans for the corporate and private
sectors; (ii) other loans: all other loans except customer loans; and (iii) securities, defined as investment
and trading securities of the bank (Berger and Mester, 1997). Table 3 reports the characteristics of inputs
and outputs. The first column lists the names of the variables while columns 2 to 6 reports various
statistics including the mean, median, standard deviation, minimum value and maximum value.
4.2 Bootstrap two-stage procedure
In the first stage, the technical efficiency of banks is estimated, using DEA in order to establish which bank
is the most efficient. Their rankings are based on productivity in the period 1999-2009. In the second

11
stage, the Simar and Wilson (2007) procedure is used to bootstrap the DEA scores with a truncated
bootstrapped regression (Barros et al., 2008 and Wijesiri et al., 2015).
Stage 1 Consider the jth bank with outputs and inputs Yrj, Xij (that are all positive) where Ur and Vi are the variable
weights to be determined by the solution of the problem below (Charnes et al., 1978: 430).
Max
m
i
ii
s
r
rr
XV
YU
1
0,
1
0,
0 (1)
Subject to:
1
1
,
1
,
m
i
jii
s
r
jrr
XV
YU
; j = 1, 2,…, n (2)
0, ir VU ; r = 1, 2, …, s; i = 1, 2, …, m
The true efficiency score, 𝛿0, is not observed directly, rather it is empirically estimated. Many studies have
used a two-stage approach, where efficiency is estimated in the first stage, and then the estimated
efficiencies (or ratios of estimated efficiencies, Malmquist indices, and many others) are regressed on
covariates (typically different from those used in the first stage) that are viewed as environmental
variables (Simar and Wilson, 2007; Barros et al., 2008 and Wijesiri et al., 2015). Simar and Wilson (2007)
criticised this two-stage method because the DEA efficiency estimates are biased and serially correlated,
therefore invalidating conventional inferences in the second stage. Simar and Wilson (2007) proposed a
procedure, based on a double bootstrap, which provides a confidence interval for the efficiency estimates
and yields consistent inferences for factors explaining efficiency.
Stage 2
In this study, to implement the bootstrap procedure for DEA we assume that the original data is
generated by a data generating process and that we are able to simulate this process by using a new
(pseudo) data set that is drawn from the original data set (step 3.3 in Algorithm 2, which is discussed in
12
the Appendix). We then re-estimate the DEA model with this new data (steps 4 and 5 in Algorithm 2 – see
the Appendix). By repeating this process 2000 times6 (step 2 in Algorithm 1 and step 6 in Algorithm 2 –
see the Appendix) we are able to derive an empirical distribution of these bootstrap values (Balcombe et
al., 2008 and Wijesiri et al., 2015). One hundred bootstrap replications are used to compute the bias-
corrected estimates ti ,
(step 3 in Algorithm 2 below)7. The efficiency scores, 𝛿𝑖,𝑡, of bank i obtained in
the first stage are regressed on explanatory variables in the second stage. However, these second-stage
estimates are inconsistent and biased and a bootstrap procedure is needed to overcome this problem
(Efron and Tibshirani, 1993). The second stage regression is given by:
iiti z
, (3)
Or, equivalently:
tititititititititi AGELNBRLNNLCLLNTALNCITYCOAROA ,,7,6,5,4,3,2,10, )()()()(
(4)
Where: 𝛿𝑖,𝑡 represents the efficiency score, estimated in stage 1, and the other independent variables are
environmental covariates. When using Algorithm 2, 𝛿𝑖,𝑡 is replaced by ti ,
. Following Berger and Mester
(1997), we employ seven explanatory variables in the second stage to determine the factors explaining
bank efficiencies. The two financial variables are: (1) profit before tax divided by total assets (ROA) and (2)
total costs divided by total assets (COA). Five other characteristics of banks are also considered. CITY is a
dummy variable that is equal to one if a bank is transformed from a rural commercial bank to a city
commercial bank and zero otherwise. This variable aims to capture efficiency related to transforming
banks. LN(TA) is the natural logarithm of total assets and LN(BR) is the natural logarithm of total branches
and these provide information about the relationships between efficiency and assets as well as efficiency
and branch networks, respectively. LN(AGE) is the natural logarithm of the number of years the bank
existed before 2009. Lastly, LN(NLCL) is the natural logarithm of the ratio of non-performing loans to
6 This number of bootstrap replications is used to construct estimated confidence intervals in the two algorithms. Confidence-interval
estimation is tantamount to estimating the tails of distributions, which necessarily requires more information. Hall (1986) suggested 1,000 replications for estimating confidence intervals. We followed Simar and Wilson (2007) and use 2,000 replications in our simulations. More accurate estimates can be achieved with a larger number of replications. However, the calculation time also rises when number of replications increase (Simar and Wilson, 2007: 44). 7 Simar and Wilson (2007: 44) found that 100 replications are sufficient to compute the bias-corrected estimates which require only
computation of a mean and then a difference.
13
customer loans. More details of environmental variables can be found in Berger and Mester (1997).
Summary statistics on these variables over our sample are presented in Table 4.
Percentile bootstrap confidence intervals of the coefficients estimated in the second stage regression can
be constructed as follows:
1)(Pr ,, jjj UpperLowerob
where is some small value representing the probability of a Type I error (for example, 05.0 for a 5% level of significance) and 10 .
jLower , and jUpper , are calculated using the empirical intervals
obtained from the bootstrap values, thus:
1)(Pr * abob jj
where
bUpper jj, and
aLower jj, .
4.3. Data
We have collected a unique dataset for Vietnamese commercial banks. Our dataset includes 48
Vietnamese commercial banks over the period 1999 to 2009. The data has been collected from the State
Bank of Vietnam and through the annual reports of individual banks. This data set accounts for more than
90% of total customer loans, total customer deposits and total assets. Five of the 48 banks are state
owned commercial banks, five are joint venture commercial banks, one is a foreign commercial bank and
the remaining 37 are joint stock commercial banks. Several banks established in 2008 and 2009 are
included in the data. The number of records each year ranged from a low of 17 banks in 1999 to a high of
46 in 2009. Banks also have differing frequencies of years in the data, see Table 1. There are sixteen banks
with data for all years; twelve banks with 4–8 years of data; fourteen banks with 5–7 years of data and
five banks with 2–4 years of data (of which three banks were established in 2008 and one bank was
founded in 2006). Only one bank (which was transformed from a branch of a foreign bank to a foreign
commercial bank in 2008) has one year of data.
5. Empirical results
14
5.1. Efficiency scores
In Table 5 we present our estimated efficiency scores. The top half of the table reports scores based upon
constant returns to scale (CCR) and the lower half gives efficiency measures using variable returns to scale
(BCC). The average initial technical efficiency score
ti, for the whole system is 0.74 assuming constant
returns to scale and 0.81 assuming variable returns to scale. From these initial estimates, we apply both
Algorithms 1 (to obtain *
,ti ) and 2
ti , using Simar and Wilson’s (2007) method. The two bootstrapping
methods produce similar results. Simar and Wilson (2007) pointed out that Algorithm 2 involves only a
small increase in computational burden over Algorithm 1 and that the improved performance of
Algorithm 2 justifies its use. Results based on Monte Carlo simulation suggest that we should prefer the
results from Algorithm 2 over those from Algorithm 1 (Simar and Wilson, 2007). Hence, we favour these
bias-corrected double bootstrap scores and use them for inference.
The average double bootstrap technical efficiency score obtained from Algorithm 2
ti , for the whole
system is 0.68 assuming constant returns to scale (CCR) and 0.75 assuming variable returns to scale (BCC).
In 1999 efficiency scores for the whole system were the lowest for the period we cover, being 0.54 (CCR)
and 0.58 (BCC). These scores steadily rose to 0.82 (CCR) and 0.90 (BCC) by 2009 demonstrating a
substantial increase in the efficiency of the banking system over the period – the peak scores are 0.83 for
the CCR measure in 2007 and 0.90 for the BCC measure in 2009. From the column headed “Number of
efficient banks” in Table 5 both CCR and BCC measures indicate that only one bank (being the Export
Import Commercial Bank) out of a total of seventeen banks was on the efficient frontier in 1999.
According to the CCR (BCC) efficiency measure 8 (21) out of 46 banks were on the efficient frontier in
2009. This confirms the general increase in banking efficiency over the period. The BCC score measures
pure technical efficiency reflecting management skills and its average score is higher than for the CCR
measure.8 On the other hand the CCR score measures overall technical efficiency. The ratio of the CCR
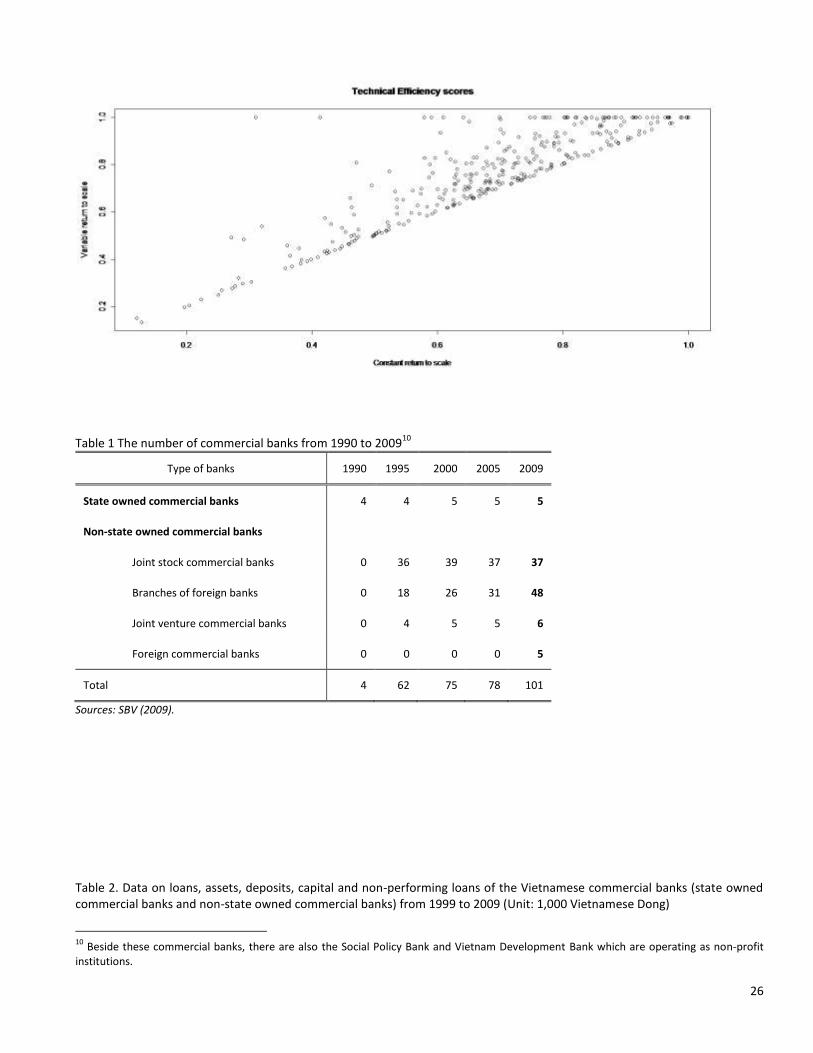
8 While the DEA CCR and BCC measures indicate some differences in efficiency patterns there is a clear general positive correlation between
them, as illustrated in Figure 1.

15
and BCC measures enables the estimation of scale efficiency that reflects both managerial skills and scale
effects.
Efficiency in the whole banking system did not unambiguously rise every year: the two exceptions being
2001–2002 and 2007–2008. Between 2001 and 2002 the CCR efficiency score remained unchanged at
0.59 (although the BCC measure rose from 0.64 to 0.67). Nguyen (2007) also found that Vietnamese
banking efficiency did not rise in this period, indeed, his results indicated a decline from 0.912 in 2001 to
0.895 in 2002. His results were based upon input and output data for thirteen commercial banks whereas
our results are based on a much larger sample of 25 – 27 banks in this period. We therefore believe our
results to be more reliable and infer that Nguyen (2007) exaggerates the decline in efficiency in this
period. Nevertheless, we find that the number of banks on the efficient frontier fell from 4 (5) in 2001 to
0 (3) in 2002 according to the CCR (BCC) measure. We note that during this period of the development of
the banking system there was a passage of banking reform in 2002 which could have affected bank
efficiency. Further, non-performing loans still accounted for 7.06% of total loans in 2002 before sharply
plummeting to 4.74% in 2003 (SBV, 2009).
The CCR (BCC) efficiency score fell from 0.83 (0.89) in 2007 to 0.80 (0.88) in 2008. Prior to 2006 the
average growth of GDP was 7.8% per year. GDP growth was 8.5% and 6.2% in 2007 and 2008,
respectively. The banking system had provided a great capital source for the economy, making up
approximately 16% – 18% of GDP annually, which was almost equivalent to 50% of the total investment
capital of the whole country. However, the global financial crisis that began at the end of 2007 and the
beginning of 2008 appears to have had an impact on the efficiency scores. The banking system
encountered many difficulties, resulting from a loss of balance in the source and use of funds, and the
rapid increase in credit growth. Moreover, tightening monetary policy caused many banks to become
weaker. After 2008, the Vietnamese economy, in parallel with the global economy, recovered and this is
reflected in the 2009 efficiency scores. The CCR (BBC) score increases from 0.80 (0.88) in 2008 to 0.82
(0.90) in 2009.
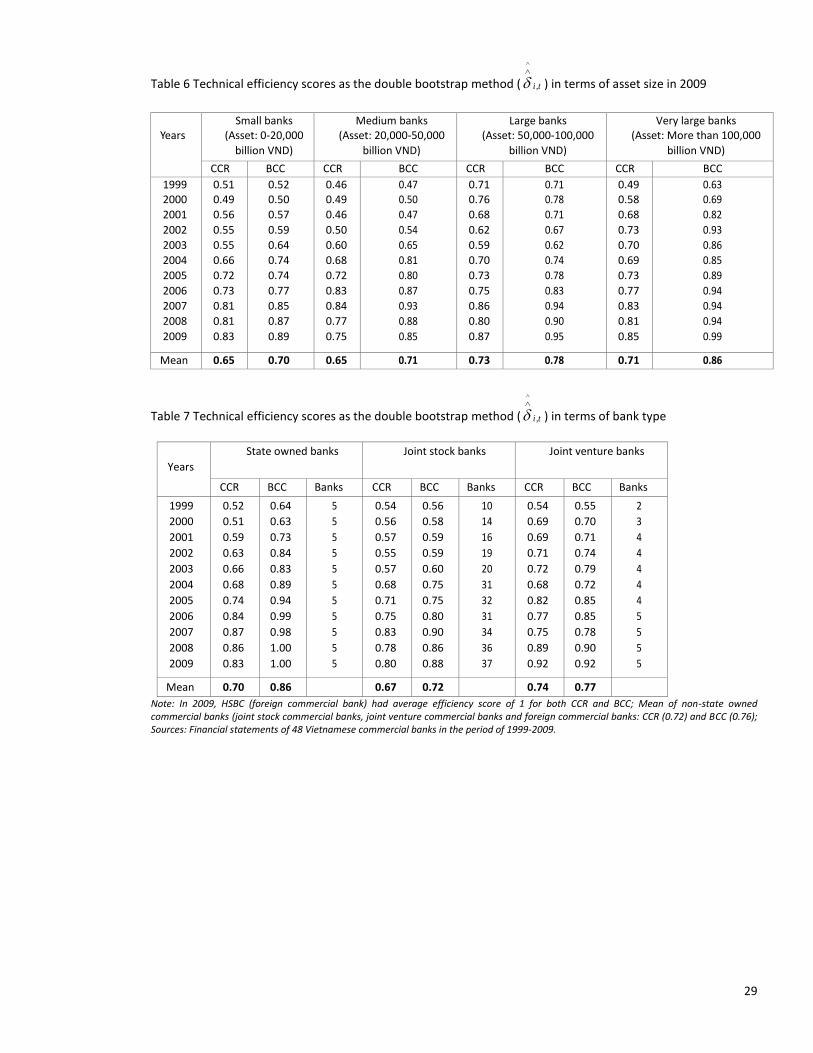
Tables 6 and 7 report ti ,
average efficiency scores categorised by asset size and bank type. In Table 6,
total assets in 2009 are used to group banks into small (assets less than 20,000 billion Vietnamese Dong),

16
medium (assets from 20,000 to 50,000 billion Vietnamese Dong), large (assets from 50,000 to 100,000
billion Vietnamese Dong) and very large (assets more than 100,000 billion Vietnamese Dong) categories.
The results indicate that large and very large banks are more efficient than small and medium banks
because they generally have larger values of .
Very large banks include the four biggest state owned commercial banks and two biggest joint stock
commercial banks (namely the Asia Commercial Bank and Sacombank) in terms of customer loans, total
assets and customer deposits. Large banks comprise the five big joint stock commercial banks:
Techcombank, Export-Import Bank, Military Bank, Maritime Banks, and Vibbank. Medium banks contain
the remaining state owned commercial banks, and the five other joint stock commercial banks. Small
banks are all of the joint venture commercial banks and newly established banks. Large banks have the
highest average CCR efficiency measure (being 0.73) throughout the 11 years. The CCR average efficiency
score of very large banks (0.71) is lower than that of large banks but their BCC average score is much
higher (being 0.86 compared to 0.78). Three banks in the very large group, including the Bank for Foreign
Trade, Asia Commercial Bank and Sacombank, received awards from foreign organisations regarding their
business. Small banks and medium sized banks have average efficiency scores that are similar (both are
0.65 according to the CCR measure and 0.70 and 0.71, respectively, for the BCC measure). Medium sized
banks and large banks were strongly affected by the crisis in 2008 with their efficiency scores falling
substantially between 2007 and 2008. The CCR (BCC) efficiency score of medium sized banks declined
from 0.84 (0.93) in 2007 to 0.77 (0.88) in 2008 and 0.75 (0.85) in 2009. Large bank CCR efficiency scores
fell from 0.86 (0.94) to 0.80 (0.90) between 2007 and 2008 although they recovered to 0.87 (0.95) in
2009. The crisis had a more modest impact on very large banks with CCR efficiency scores falling from
0.83 to 0.81 between 2007 and 2008 while the BCC measure remained unchanged at 0.94 during the
same period. Small bank efficiency was not adversely affected by the crisis with the CCR measure
unchanged at 0.81 between 2007 and 2008 and the BCC score rising from 0.85 to 0.87 in this period. Both
small and very large banks efficiency scores rose (according to both measures) between 2008 and 2009.
Small banks and medium sized banks generally have lower efficiency scores than large and very large
banks.
ti ,

17
In Table 7 we present efficiency measures by bank type. It is evident that joint venture commercial banks
have the highest average CCR score of 0.74 followed by state owned commercial banks with a score of
0.70 and joint stock commercial banks with a score of 0.67. However, state owned commercial banks
have the highest average efficiency score according to the BCC measure, being 0.86, followed by joint
venture commercial banks with a score of 0.77 and joint stock commercial banks with a score of 0.72.
Joint stock commercial banks are by far the most numerous in the banking system and their average score
seems to be affected by some small and inefficient banks. Non-state owned commercial banks (joint stock
commercial banks, joint venture commercial banks and foreign commercial banks) have an average CCR
(BCC) efficiency score of 0.72 (0.76), see the footnote of Table 7, while the corresponding score for state
owned commercial banks is 0.70 (0.86). This indicates that the state owned commercial banks have
higher managerial skills (what BCC measures) if they are less efficient assuming overall technical efficiency
(what CCR measures) compared with non-state owned commercial banks.
In the first period where bank efficiency of the whole banking system did not rise (being 2001 – 2002) we
find the following patterns by bank type. Joint stock commercial banks were the only bank type whose
efficiency did not rise between 2001 and 2002, the CCR efficiency score fell from 0.57 in 2001 to 0.55 in
2002 while the BCC score remained unchanged at 0.59 in this period. Hence, joint stock commercial banks
are primarily responsible for the decline in the overall banking system’s efficiency at this time.
Nevertheless, the efficiency scores of state owned commercial banks and joint venture commercial banks
only rose gradually in this period, suggesting a more general malaise in efficiency at this time.
In the global financial crisis period of 2007 – 2008 there is clear evidence that the efficiency scores of joint
stock commercial banks declined and some evidence, if ambiguous, that state owned commercial banks
efficiency deteriorated. The CCR (BCC) efficiency scores of joint stock commercial banks declined sharply
from 0.83 (0.90) to 0.78 (0.86) between 2007 and 2008. The CCR efficiency measure of state owned
commercial banks fell from 0.87 in 2007 to 0.86 in 2008 whereas the BCC score rose from 0.98 in 2007 to
1.00 in 2008. However, unlike the other two bank types the efficiency score for state owned commercial
banks did not recover in 2009 with the CCR measure falling to 0.83 – the BCC measure remained
unchanged at 1.00. This suggests that state owned commercial banks delayed recovery from the crisis
was not due to weakness of managerial skills (BCC) rather it was because of their leading role in the
economy of deposits and loans weakening. In contrast, joint venture commercial banks’ CCR (BCC)
18
efficiency score dramatically increased from 0.75 (0.78) in 2007 to 0.89 (0.90) in 2008. These episodes
confirm the general relative weakness of joint stock commercial banks in terms of efficiency.
Table 8 shows the efficiency scores of each of the 48 Vietnamese banks averaged over the period 1999 to
2009, assuming constant returns to scale (CCR), variable returns to scale (BCC) and scale efficiency. Only
two joint stock commercial banks (being the TienPhong Bank and BaoViet Bank) and one foreign
commercial bank (HSBC Vietnam) are on the efficient frontier (with an efficiency score of 1.00) during our
sample period. It should be noted that TienPhong Bank and BaoViet Bank were both established in 2008
while HSBC Vietnam transformed from a branch of a foreign bank to a foreign commercial bank in 2009.
While other longer established banks have been on the efficient frontier in some years their average
scores are lower than those of the newly found banks. As discussed above, during the periods 2001–2002
and 2007–2008 almost all banks efficiency scores fell. While some banks are efficient in certain years the
average scores over the whole period indicate that all banks are relatively inefficient (or have experienced
periods of relative inefficiency).
5.2. Regression results on environmental variables
In this section, we regress the favoured DEA efficiency scores on our environmental variables (using the
model specified in (4) except with ti ,
as the dependent variable) and obtain the coefficients shown in
the second (CCR) and third (BCC) columns of Table 9.9
Regarding the control variables, profit before tax divided by total assets (ROA) has a positive and
significant coefficient at the 5% level for both measures of efficiency. This implies that banks with a high
ratio of profit over assets are likely to be more efficient than others. Total costs divided by total assets
(COA) is not a significant determinant of efficiency for both the CCR and BCC measures. Thus, banks with
9 We do not believe that the results reported in Table 9 are subject to the adverse effects of multicollinearity for the following reasons. First,
the variance inflation factors (VIF) of the models’ 7 regressors are less than 10 which, according to Klein’s rule of thumb, suggest that none are highly collinear. Second, the two most likely variables to be subject to multicollinearity are LNTA and LNBR because they have the highest VIFs: for LNTA VIF = 3.97 and for LNBR VIF = 3.85. These covariates having the only pairwise simple correlation coefficient that exceed 0.8 (being 0.82) confirms this – only 3 pairings have correlation coefficients greater than 0.3. Since both LNTA and LNBR are statistically significant when CCR is the dependent variable this suggests that multicollinearity is not making significant variables appear insignificant (which is the main adverse consequence of multicollinearity). When BCC is the dependent variable LNBR is significant, suggesting that this variable has not been adversely affected by multicollinearity, however LNTA is insignificant. We believe the insignificance of LNTA is not the result of multicollinearity because LNTA is not adversely affected by multicollinearity when CCR is the dependent variable and because LNBR is not subject to the adverse effects of multicollinearity. Third, multicollinearity is known to be a small sample problem and our sample size of 379 observations is sufficiently large to diminish any adverse effects of multicollinearity on our results.

19
relatively high costs are no more or less efficient than those with lower costs. Total assets (LNTA) and the
variable that identifies institutions that transformed from rural to city commercial banks (CITY) both have
a positive and significant coefficient in the regression for the CCR efficiency score, however, neither are
significant determinants of the BCC efficiency score. Hence, raising total assets appears to be an effective
tool for increasing overall technical bank efficiency (which CCR measures) if not managerial skills (which
BCC measures). Further, the ten or so institutions that transformed from rural commercial banks to city
commercial banks in the 2000s have also significantly raised overall technical bank efficiency if not
managerial skills. The non-performing loans variable (LNNLCL) is an insignificant determinant of both
measures of efficiency. In contrast, the number of branches (LNBR) and the number of years since
establishment (LNAGE) both have negative and significant coefficients in the equations for both efficiency
measures. This indicates that banks with a relatively small number of branch networks (such as joint
venture commercial banks or newly established banks) and those that have been in existence for a
comparatively short period of time are more efficient than older banks and those with larger branch
networks.
6. Conclusions
The results of our analysis suggest that the average technical efficiency score for the whole Vietnamese
banking system using the traditional method is 0.74 for the constant returns to scale measure and 0.81
with the variable returns to scale measure. These values are 0.68 and 0.75, respectively, after applying
Simar and Wilson’s (2007) superior double bootstrap method. These more accurate estimates indicate a
lower level of efficiency compared with the traditionally used method. We find that while bank efficiency
generally rose over the period it did not increase every year, for example, between 2001 and 2002 as well
as 2007 and 2008. For 2001 – 2002 our finding is consistent with the results obtained by Nguyen (2007) in
the sense that overall efficiency (CCR) does not rise, although we do not observe the clear decline in
efficiency that he identifies. We believe our inference is more accurate because it is based on a
substantially larger sample of banks and a superior estimation method. Between 2007 and 2008, a period
that has not been examined previously, we find that efficiency declined according to both measures (CCR
and BCC) and attribute this to the effect of the global financial crisis on the banking system.

20
In terms of asset size, large and very large banks are, on average, more efficient than small and medium
sized banks. Regarding bank type, joint venture commercial banks exhibit greater overall efficiency (CCR
measure) than state owned commercial banks that, in turn, are more efficient than joint stock
commercial banks. However, the ranking according to the BCC measure, which distils managerial skills, is
that state owned commercial banks are the most efficient, followed by joint venture commercial banks
and then joint stock commercial banks. Non-state owned commercial banks (being joint stock commercial
banks, joint venture commercial banks and foreign commercial banks) are more efficient than state
owned commercial banks assuming overall efficiency. The average BCC efficiency scores of state owned
commercial banks (0.86) are higher than for non-state owned commercial banks (0.76) suggesting the
former exhibit superior efficiency in terms of managerial skills. However, the average CCR efficiency
measure of non-state owned commercial banks (0.72) is higher than that of state owned commercial
banks (0.70) indicating that the former have, on average, greater overall technical efficiency than the
latter.
The Simar and Wilson (2007) double bootstrap efficiency scores are then regressed on environmental
variables to identify the main determinants of efficiency. Generally, banks with greater total assets and
those that transformed from rural to city commercial banks significantly raise overall efficiency (the CCR
measure), if they have no significant impact on managerial skills (the BCC measure). Banks with a greater
ratio of profit before tax to total assets are significantly more efficient than those with a lower ratio for
both efficiency measures. The number of branches and the number of years since establishment both
have a negative and significant effect on (both measures of) efficiency. Hence, banks with fewer branch
networks (such as joint venture commercial banks or newly established banks) and those that have been
in existence for a shorter period of time are more efficient than other banks. The non-performing loans,
costs divided by total assets and profit before tax divided by total assets variables are not significant
determinants of either measure of efficiency.
A number of policy implications arise out of this paper. The first policy implication concerns the small
banks (in terms of asset size) in the system. The results indicate that large and very large banks are more
efficient than small and medium sized banks with small banks having the lowest efficiency scores in the
system. This suggests that efficiency can be raised by restructuring the banking system to reduce the
number of smaller, less efficient banks. Moreover, banks with large branch networks and those that have
21
been in existence for a long time are less efficient than other banks. This also aligns with recent policies
from the State Bank of Vietnam to promote mergers and acquisitions, increasing the financial autonomy
of banks. The State Bank of Vietnam has targeted 6 to 7 mergers and acquisitions in the banking sector in
2014, and a 50% reduction in the number of commercial banks in the period of 2015-2017 (WB, 2014).
Our results also indicate that non-state owned commercial banks exhibit greater overall technical
efficiency (based on the CCR measure) than state owned commercial banks. Thus, the State Bank of
Vietnam could improve efficiency by considering policies to enhance the development of the non-state
owned commercial banks in the system. The recent restructuring plan allows the State Bank of Vietnam
to intervene in weak credit institutions, leading to the quick and thorough handling of these credit
institutions. The State Bank of Vietnam also focuses on non-performing loans of state owned commercial
banks with various measures, including deciding the real estate market, solving inventories for
enterprises and promoting the restructuring of state enterprises (SBV, 2014).
We stress the limitations of our study. Although, we have set up a unique database, there is a possibility
to collect data of the branches of foreign banks even though they account for only a small percentage of
the banking system in terms of loans, deposits and assets. The full data might help us to provide more
exact results of the efficiency scores. The next step should be to investigate bank efficiency of newly set
up commercial banks and the “old” banks. This considers not only ownership structure matters but also
the differences in terms of bank efficiency between “new” and “old” banks.
References

22
Balcombe, K., Fraser, I., Latruffe, L., Rahman, M. and Smith, L. (2008). An application of the DEA double bootstrap to examine sources of efficiency in Bangladesh rice farming. Applied Economics, 40, 1919-1925.
Banker, R.D., Charnes, A. and Cooper, W.W. (1984). Some models for estimating technical and scale inefficiencies in Data Envelopment Analysis. Management Science, 30(9), 1078-1092.
Barros, C.P., Caporale, G.M. and Abreu, M. (2008). Productivity drivers in European banking: Country effects, legal tradition and market dynamics. London: Brunel University.
Berger, A.N. and Mester, L.J. (1997). Inside the Black Box: What explains differences in the in the institutions? Journal of Banking and Finance, 895-947.
Bonin, P.J., Hasan, I. and Wachtel, P. (2005). Bank performance, efficiency and ownership in transition countries. Journal of Banking and Finance, 29, 31–53.
Brissimis, S.N., Delis, M.D. and Papanikolaou, N.I. (2008). Exploring the nexus between banking sector reform and performance: Evidence from newly acceded EU countries. Journal of Banking and Finance, 32, 2674-2683.
Charnes, A., Cooper, W.W. and Rhodes, E. (1978). Measuring the efficiency of decision making units. European Journal of Operational Research, 2, 429-444.
Dinh, T.T.H. and Kleimeier, S. (2007). A credit scoring model for Vietnam's retail banking market. International Review of Financial Analysis, 16, 471-495.
Efron, B. and Tisbhirani, R.J. (1993). An introduction to the bootstrap. New York: Chapman and Hall. Fries, S. and Taci, A. (2005). Cost efficiency of banks in transition: Evidence from 289 banks in 15 post-
communist countries. Journal of Banking and Finance, 29, 55–81. Ghosh, S. (2015). Political transition and bank performance: How important was the Arab Spring? Journal
of Comparative Economics, 1-11. Hall, P. (1986). On the number of bootstrap simulations required to construct a confidence interval. The
Annals of Statistics, 1453–62. Huang, T.H.; Chiang, D.L. and Tsai, C.M. (2015). Applying the new metafrontier directional distance
function to compare banking efficiencies in Central and Eastern countries. Economic Modelling, 44, 188-199.
Kousted, J., Rand, J., Tarp, F., Nguyen, D.T., Nguyen, V.H., Ta, M.T. and Luu, D.K. (2005). From mono bank to commercial bank: Financial sector reforms in Vietnam. Singapore: Institute of Southeast Asian Studies.
KPMG. (2013). Vietnam Banking Survey. Hanoi: KPMG. Matthews, K. and Thompson, J. (2008). The economics of banking. Chichester: John Wiley & Sons, Ltd. Nguyen, T.N. and Stewart, C. (2013). Concentration and efficiency in the Vietnamese banking system
between 1999 and 2009: A structural model approach. Journal of Financial Regulation and Compliance, 21(3), 269-283.
Nguyen, V. (2007). Measuring efficiency of Vietnamese commercial banks: An application of Data Envelopment Analysis (DEA). In K. Nguyen, & T. Le, Technical efficiency and productivity growth in Vietnam. Hanoi: Publishing House of Social Labour.
Nguyen, X.Q. and De Borger, B. (2008). Bootstraping efficiency and Malmquist productivity indices: An application to the Vietnamese commercial banks. Taiwan: Academia Sinica.
SBV. (2009). Annual Report. Hanoi: SBV. SBV. (2014). Annual Report. Hanoi: SBV. Sealey, JR, C.W. and Lindley, J.T. (1977). Inputs, outputs and a theory of production and cost at depository
financial institutions. The Journal of Finance, XXXII(4), 1251-1266.
23
Simar, L. and Wilson, P.W. (2007). Estimation and inference in two-stage, semi-parametric models of production processes. Journal of Econometrics, 136, 31-64.
Staikouras, C., Mamatzakis, E., Koutsomanoli-Filippaki, A. (2008). Cost efficiency of the banking industry in the South Eastern European region. Journal of International Financial Markets, Institutions and Money, 18(5), 483-497.
WB. (2008). Taking stock: An update on Vietnam's recent economic developments in 2008. Hanoi: Annual Consultative for Vietnam.
WB. (2014). Taking stock: An update on Vietnam's recent economic developments in 2014. Hanoi: Annual Consultative for Vietnam.
Wijesiri, M., Vigano, L. and Meoli, M. (2015). Efficiency of microfinance institutions in Sri Lanka: a two-stage double bootstrap DEA approach. Economic Modelling, 47, 74-83.
Appendix

24
I.I. Algorithm 1 Step 1 Using original data of outputs, Yrj, and inputs, Xij, (that are all positive) compute DEA efficiency
scores i
Step 2 Use the method of maximum likelihood to obtain an estimate
of β as well as an estimate
of
in the truncated regression of i
on zi (equation (3)) using m<n observations where 1^
i .
Step 3 Loop over the next three steps ([3.1]-[3.3]) 2000 times to obtain a set of bootstrap estimates2000
1
**,
bb
:
[3.1] For each i=1,...,m, drawi from the ),0(
2^
N distribution with left-truncation at )1(^
iz
[3.2] Again for each i=1,...,m, compute iii z
*
[3.3] Use the maximum likelihood method to estimate the truncated regression of *
i on zi, yielding
estimates ^*
*^
,
Step 4 Use bootstrap values in A (step 3) and the original estimates ^^
, to construct estimated
confidence intervals for each element of β and for .
I.I. Algorithm 2 Step 1 Using original data of outputs, Yrj, and inputs, Xij, (that are all positive) compute DEA efficiency
scores i
.
Step 2 Use the method of maximum likelihood to obtain an estimate
of β as well as an estimate
of
in the truncated regression of i
on zi using m<n observations where 1^
i .
Step 3 Loop over the next four steps ([3.1]-[3.4]) 100 times to obtain a set of bootstrap estimates100
1
^*^*
,
bb
:
[3.1] For each i=1,...,m, draw i from the ),0(2^
N distribution with left-truncation at )1(^
iz
[3.2] Again for each i=1,...,n, compute iii z
*
[3.3] Set )/(, ***
iiiiii yyxx
for all i=1,2,...n.

25
[3.4] Compute the new technical efficiency ^*
i by replacing ],...[],,...,[ **
1
***
1
*
nn xxXyyY
Step 4 For each i=1,...,n, compute the bias corrected estimator i
using bootstrap estimates in step 3.4
and the original i
Step 5 Use the maximum likelihood method to estimate the truncated regression of i
on zi, yielding
estimates
, Step 6 Loop over the next three steps ([6.1]-[6.3]) 2000 times to obtain a set of bootstrap estimates
2000
1
** ,
bb
K :
[6.1] For each i=1,...,n, draw i from the ),0(
N distribution with left-truncation at )1(
iz
[6.2] Again for each i=1,...,m, compute iii z
**
[6.3] Use the maximum likelihood method to estimate the truncated regression of **
i on zi, yielding
estimates
**
,
Step 7 Use bootstrap values in K (step 6) and the original estimates
, to construct )1( estimated
confidence intervals for each element of β and for
Figure 1 Scatter plot of DEA-CCR and DEA-BCC efficiency scores
26
Table 1 The number of commercial banks from 1990 to 2009
10
Type of banks 1990 1995 2000 2005 2009
State owned commercial banks 4 4 5 5 5
Non-state owned commercial banks
Joint stock commercial banks 0 36 39 37 37
Branches of foreign banks 0 18 26 31 48
Joint venture commercial banks 0 4 5 5 6
Foreign commercial banks 0 0 0 0 5
Total 4 62 75 78 101
Sources: SBV (2009).
Table 2. Data on loans, assets, deposits, capital and non-performing loans of the Vietnamese commercial banks (state owned commercial banks and non-state owned commercial banks) from 1999 to 2009 (Unit: 1,000 Vietnamese Dong)
10
Beside these commercial banks, there are also the Social Policy Bank and Vietnam Development Bank which are operating as non-profit institutions.
27
Year Bank type Loans Assets Deposits Capital Non-performing loans
1999 SOCBs 72,142,247 134,890,858 87,326,439 5,468,772 10.78%
Non-SOCBs 35,899,360 58,871,839 30,293,986 9,284,887 N/A
2000 SOCBs 108,422,565 200,433,947 127,033,459 5,413,772 10.02%
Non-SOCBs 41,231,535 75,856,994 43,321,781 10,139,627 9.42%
2001 SOCBs 135,647,621 247,151,769 160,738,302 5,421,134 8.83%
Non-SOCBs 45,466,715 88,614,974 51,759,565 10,953,034 7.81%
2002 SOCBs 165,921,733 286,860,920 189,313,313 10,061,113 7.62%
Non-SOCBs 55,296,802 102,590,591 63,658,203 11,152,585 5.41%
2003 SOCBs 214,481,096 367,813,825 237,485,761 14,516,916 5.13%
Non-SOCBs 74,068,790 130,337,981 79,255,399 12,398,334 3.57%
2004 SOCBs 295,738,175 468,341,918 311,681,861 17,362,940 2.92%
Non-SOCBs 103,563,777 183,404,071 109,681,322 14,860,054 2.26%
2005 SOCBs 380,850,503 603,540,889 406,957,181 18,429,980 3.81%
Non-SOCBs 143,449,737 261,307,537 144,499,838 20,009,805 1.42%
2006 SOCBs 435,695,864 731,657,400 524,533,245 18,777,200 3.19%
Non-SOCBs 212,097,344 430,755,234 229,411,786 35,578,494 1.29%
2007 SOCBs 564,677,195 904,004,852 652,913,108 30,091,997 1.87%
Non-SOCBs 420,184,441 903,961,807 456,920,152 66,066,418 0.94%
2008 SOCBs 671,732,670 1,078,729,233 775,560,005 39,279,325 2.47%
Non-SOCBs 534,692,051 1,097,675,565 593,628,040 103,923,040 1.62%
200911
SOCBs 903,718,777 1,320,357,324 869,410,909 61,293,664 N/A
Non-SOCBs 560,883,667 1,210,244,318 680,665,451 115,192,318 N/A
Note: SOCBs: State owned commercial banks; Non-SOCBs: Non-state owned commercial banks. Sources: SBV (2009); Financial statements of 48 Vietnamese commercial banks in the period of 1999-2009.
Table 3 Descriptive statistics of inputs and outputs (Units: 1,000 Vietnamese Dong except for Staff)
Variables Mean Median Std deviation Minimum Maximum
Inputs 1. Staff (People)
2. Purchased Funds
3. Customer Deposits
2,363.59
4,717,463.63
16,876,982.94
485
953,304
2,801,850
5,380.34
9,114,539.41
39,407,328.37
31
0
796
35,135
65,317,125
34,964,4191
Outputs 4. Customer Loans
5. Other Loans
6. Securities
15,412,044.60
5,603,227.19
3,182,009.32
2,642,000
1,029,387
189,737
39,384,206.14
11,005,779.19
7,871,634.06
496
226
0
372,438,322
72,637,734
44,573,879
Sources: Financial statements of 48 Vietnamese commercial banks in the period of 1999-2009.
Table 4 Descriptive statistics of regression variables
11
We could not collect data of the North Asia Commercial Bank and Vinasiam Bank in 2009.

28
Variables Mean Median Std deviation Minimum Maximum
Raw data
1. ROA
2. COA
0.01
0.07
0.01
0.06
0.02
0.06
-0.09
0
0.30
1.24
Other characteristics 4. CITY (Dummy)
5. LNTA
6. LNNLCL
7. LNBR
8. LNAGE
0.18
15.43
-4.28
3.27
2.68
0
15.29
-4.28
3.22
2.77
0.39
1.96
1.14
1.52
0.48
0
8.57
-8.81
0
0
1
20
0
7.74
3.09
Sources: Financial statements of 48 Vietnamese commercial banks in the period of 1999-2009.
Table 5: Technical efficiency average scores for the whole Vietnamese banking sector: ^
,ti , *
,ti and ti ,
^
,ti *
,ti Algorithm 1,
*
,ti Confidence interval
ti ,
Algorithm 2, ti ,
Confidence interval
Number of banks
Number of efficient banks
CCR Lower bound Upper bound Lower bound Upper bound
1999 0.58 0.52 0.48 0.64 0.54 0.46 0.63 17 1 2000 0.66 0.55 0.50 0.67 0.56 0.47 0.66 22 1 2001 0.67 0.59 0.57 0.68 0.59 0.56 0.67 25 4 2002 0.66 0.56 0.52 0.67 0.59 0.52 0.66 27 0 2003 0.68 0.60 0.55 0.69 0.60 0.52 0.68 28 2 2004 0.75 0.67 0.62 0.77 0.68 0.61 0.77 39 2 2005 0.78 0.70 0.66 0.82 0.72 0.66 0.81 41 4 2006 0.80 0.73 0.70 0.86 0.76 0.68 0.85 41 7 2007 0.87 0.78 0.76 0.92 0.83 0.75 0.91 44 9 2008 0.86 0.77 0.74 0.90 0.80 0.72 0.90 46 8 2009 0.87 0.79 0.76 0.92 0.82 0.75 0.92 46 8
Mean 0.74 0.66 0.62 0.78 0.68 0.61 0.77 34.18 4.18
^
,ti *
,ti Algorithm 1,
*
,ti Confidence interval
ti ,
Algorithm 2, ti ,
Confidence interval
Number of banks
Number of efficient banks
BCC Lower bound Upper bound Lower bound Upper bound
1999 0.65 0.56 0.50 0.68 0.58 0.50 0.67 17 1 2000 0.68 0.59 0.54 0.71 0.60 0.51 0.70 22 2 2001 0.72 0.64 0.62 0.73 0.64 0.61 0.72 25 5 2002 0.72 0.64 0.60 0.75 0.67 0.60 0.74 27 3 2003 0.75 0.68 0.63 0.77 0.68 0.60 0.76 28 4 2004 0.84 0.76 0.72 0.87 0.77 0.71 0.87 39 5 2005 0.87 0.77 0.72 0.88 0.78 0.72 0.87 41 8 2006 0.89 0.80 0.77 0.90 0.83 0.75 0.89 41 10 2007 0.93 0.84 0.82 0.94 0.89 0.81 0.93 44 18 2008 0.92 0.83 0.82 0.95 0.88 0.80 0.95 46 13 2009 0.95 0.87 0.83 0.96 0.90 0.83 0.96 46 21
Mean 0.81 0.73 0.69 0.83 0.75 0.68 0.82 34.18 8.18 Sources: Financial statements of 48 Vietnamese commercial banks in the period of 1999-2009.
29
Table 6 Technical efficiency scores as the double bootstrap method ( ti ,
) in terms of asset size in 2009
Years Small banks
(Asset: 0-20,000
billion VND)
Medium banks (Asset: 20,000-50,000
billion VND)
Large banks (Asset: 50,000-100,000
billion VND)
Very large banks (Asset: More than 100,000
billion VND)
CCR BCC CCR BCC CCR BCC CCR BCC
1999 2000
2001
2002
2003
2004
2005
2006
2007
2008
2009
0.51 0.49
0.56
0.55
0.55
0.66
0.72
0.73
0.81
0.81
0.83
0.52 0.50
0.57
0.59
0.64
0.74
0.74
0.77
0.85
0.87
0.89
0.46 0.49
0.46
0.50
0.60
0.68
0.72
0.83
0.84
0.77
0.75
0.47 0.50
0.47
0.54
0.65
0.81
0.80
0.87
0.93
0.88
0.85
0.71 0.76
0.68
0.62
0.59
0.70
0.73
0.75
0.86
0.80
0.87
0.71 0.78
0.71
0.67
0.62
0.74
0.78
0.83
0.94
0.90
0.95
0.49 0.58
0.68
0.73
0.70
0.69
0.73
0.77
0.83
0.81
0.85
0.63 0.69
0.82
0.93
0.86
0.85
0.89
0.94
0.94
0.94
0.99
Mean 0.65 0.70 0.65 0.71 0.73 0.78 0.71 0.86
Table 7 Technical efficiency scores as the double bootstrap method ( ti ,
) in terms of bank type
Years
State owned banks
Joint stock banks
Joint venture banks
CCR BCC Banks CCR BCC Banks CCR BCC Banks
1999
2000
2001
2002
2003
2004
2005
2006
2007
2008
2009
0.52
0.51
0.59
0.63
0.66
0.68
0.74
0.84
0.87
0.86
0.83
0.64
0.63
0.73
0.84
0.83
0.89
0.94
0.99
0.98
1.00
1.00
5
5
5
5
5
5
5
5
5
5
5
0.54
0.56
0.57
0.55
0.57
0.68
0.71
0.75
0.83
0.78
0.80
0.56
0.58
0.59
0.59
0.60
0.75
0.75
0.80
0.90
0.86
0.88
10
14
16
19
20
31
32
31
34
36
37
0.54
0.69
0.69
0.71
0.72
0.68
0.82
0.77
0.75
0.89
0.92
0.55
0.70
0.71
0.74
0.79
0.72
0.85
0.85
0.78
0.90
0.92
2
3
4
4
4
4
4
5
5
5
5
Mean 0.70 0.86 0.67 0.72 0.74 0.77
Note: In 2009, HSBC (foreign commercial bank) had average efficiency score of 1 for both CCR and BCC; Mean of non-state owned commercial banks (joint stock commercial banks, joint venture commercial banks and foreign commercial banks: CCR (0.72) and BCC (0.76); Sources: Financial statements of 48 Vietnamese commercial banks in the period of 1999-2009.

30
Table 8 Technical efficiency average scores as the double bootstrap method ( ) for the Vietnamese banking
system from 1999 to 2009 ID Bank in groups DEA-CCR DEA-BCC DEA-Scale Index
1
2
3
4
5
6
7
8
9
10
11
12
13
14
15
16
17
18
19
20
21
22
23
24
25
26
27
28
29
30
31
32
33
34
35
36
37
38
39
40
41
42
43
44
45
46
47
48
State Owned Commercial Banks (5 banks) Bank for Agriculture and Rural Development
Bank for Investment and Development
Mekong Housing Bank
Bank for Foreign Trade of Vietnam
Vietnam Bank for Industry and Trade
Joint Stock Commercial Banks (37 banks)
Asia Commercial Bank
Saigon Thuong Tin Commercial Bank(*)
Technological and Commercial Bank Vietnam
Export Import Bank
Military Commercial Bank
Dong A Commercial Bank
Saigon Commercial Joint Stock Bank(**)
Vietnam International Commercial Bank(*)
Hanoi Building Commercial JS Bank
Maritime Commercial Bank
South East Asia Commercial Bank(**)
Vietnam Prosperity Commercial Bank
Southern Commercial Bank
Saigon Bank for Industry and Trade
Orient Commercial Bank(*)
North Asia Commercial Bank(**)
Housing Development Commercial Bank(*)
Nam A Commercial Bank(*)
Vietnam Tin Nghia Commercial Bank(**)
Gia Dinh Commercial Bank(**)
Kien Long Commercial Bank(*)
First Commercial Bank(***)
An Binh Commercial Bank(**)
Saigon-Hanoi Commercial Bank(**)
Ocean Commercial Bank(**)
Viet A Commercial Bank(*)
Nam Viet Commercial Bank(**)
Global Petro Commercial Bank(**)
Petrolimex Group Commercial Bank(*)
Great Trust Commercial Bank(**)
Great Asia Commercial Bank(**)
Western Commercial Bank(*)
Mekong Development Bank(*)
Lien Viet Bank (***Established in 2008)
Tien Phong Bank (***Established in 2008)
Vietnam Thuong Tin Bank(***Established in 2006)
Bao Viet Bank(****Established in 2008)
Joint Venture Commercial Banks (5 banks)
Indovina Bank
Shinhanvina Bank(*)
VID Public Bank
Vinasiam Bank(*)
Vietnam Russia Bank(**)
Foreign Commercial Bank (1 bank)
HSBC Vietnam(****Established in 2009)
0.57
0.76
0.66
0.83
0.69
0.82
0.63
0.66
0.79
0.81
0.54
0.91
0.58
0.79
0.73
0.93
0.56
0.49
0.61
0.53
0.87
0.71
0.52
0.80
0.75
0.45
0.88
0.82
0.71
0.89
0.61
0.82
0.81
0.72
0.64
0.83
0.76
0.72
0.94
1.00
0.88
1.00
0.80
0.76
0.67
0.85
0.67
1.00
0.86
0.91
0.76
0.93
0.86
0.89
0.75
0.72
0.84
0.86
0.63
0.93
0.66
0.82
0.78
0.96
0.62
0.57
0.67
0.60
0.90
0.74
0.56
0.81
0.78
0.49
0.88
0.90
0.76
0.98
0.66
0.89
0.90
0.93
0.70
0.87
0.79
0.73
0.94
1.00
0.90
1.00
0.81
0.83
0.68
0.86
0.79
1.00
0.65
0.83
0.87
0.89
0.79
0.92
0.83
0.92
0.92
0.94
0.87
0.98
0.90
0.96
0.94
0.96
0.91
0.87
0.93
0.91
0.96
0.96
0.93
0.99
0.95
0.92
0.99
0.91
0.94
0.90
0.93
0.91
0.91
0.78
0.91
0.95
0.96
0.97
0.99
1.00
0.97
1.00
0.98
0.92
0.98
0.98
0.83
1.00
Note: (*) Banks with data from 8 to 10 years; (**) Banks with data from 5 to 7 years; (***) Banks with data from 2 to 4 years; (****) Banks with data of only one year.
ti ,

31
Table 9 Determinants of CCR and BCC efficiency ( ) for the Vietnamese banking system
Overall technical efficiency (CCR)
Pure technical efficiency (BCC)
C -0.403* (-2.254)
-0.824*** (-4.418)
ROA 1.669** (2.082)
1.712** (2.05)
COA -0.467 (-1.794)
-0.348 (-1.283)
CITY 0.156*** (4.271)
0.506 (1.159)
LNTA 0.079*** (6.467)
0.164 (1.129)
LNNLCL -0.012 (-0.996)
-0.012 (-0.928)
LNBR -0.065*** (-4.277)
-0.064*** (-4.012)
LNAGE -0.096*** (-3.454)
-0.083*** (-2.877)
Observations 379 379 Note: The variables’ coefficients and t-statistics (in brackets) are reported in the table; *** denotes significance at the 1% level, ** indicates significance at the 5% level and * represents significance at the 10% level. Sources: Financial statements of 48 Vietnamese commercial banks in the period of 1999-2009.
ti ,