EFFICIENCY IN ELECTRICITY GENERATION
30
EFFICIENCY IN Report drafted by: EURELECTRIC “Preservation of Resources” Working Group’s “Upstream” Sub-Group in collaboration with VGB July 2003 ELECTRICITY GENERATION
Transcript of EFFICIENCY IN ELECTRICITY GENERATION

EFFICIENCY IN
Report drafted by: EURELECTRIC “Preservation of Resources” Working Group’s “Upstream” Sub-Group in collaboration with VGB July 2003
ELECTRICITY GENERATION

2
Efficiency in Electricity Generation July 2003 This report has been drafted by: EURELECTRIC “Preservation of Resources” Working Group’s “Upstream” Sub-Group in collaboration with VGB Members of the Drafting Team: EURELECTRIC Upstream Sub-Group: Livio HONORIO, Chairman (PT) Jean-Guy BARTAIRE (FR), Rolf BAUERSCHMIDT (DE), Tapio OHMAN (FIN), Zoltan TIHANYI (HU), Hans ZEINHOFER (AT), John F. SCOWCROFT (EURELECTRIC), Vasco DE JANEIRO (EURELECTRIC) VGB: Hartmut KRUGER (DE), Hans-Joachim MEIER (DE), Daniel OFFERMANN (DE), Ulrich LANGNICKEL (DE) The Union of the Electricity Industry - EURELECTRIC, formed as a result of a merger in December 1999 of the twin electricity industry associations, UNIPEDE and EURELECTRIC, is the sector association representing the common interests of the European electricity industry and its worldwide affiliates and associates. Its mission is to contribute to the development and competitiveness of the electricity industry and to promote the role of electricity in the advancement of society. Union of the Electricity Industry - EURELECTRIC Boulevard de l’Impératrice, 66 – B-1000 Brussels Tel: +32 2 515 1000 - Fax: +32 2 515 1010 E-mail: [email protected] Website: www.eurelectric.org VGB PowerTech was founded in Leuna (East Germany) in 1920. It is a voluntary association of power as well as heat generating utilities. Its main objective is joint support and improvement of operational safety, availability, efficiency and environmental compatibility of power plants (fossil-fired, nuclear, renewables) both in operation or under construction. Further, VGB is involved in standardization as well as in elaboration of technical guidelines and regulations in the field of thermal power plants. Within the framework of its legal possibilities, VGB supports the work on the mandatory pressure vessel- and steam boiler regulations and nuclear regulations in Germany and also in the European Union. VGB PowerTech e.V. Postfach 10 39 32, D-45039 Essen Klinkestraße 27 - 31, D-45136 Essen Tel: +49 201 81280 - Fax: +49 201 81283 E-Mail: [email protected] Website: www.vgb.org Copyright © Union of the Electricity Industry – EURELECTRIC, VGB July 2003 – Ref. 2003 – 030 - 0548 All rights reserved

3
TABLE OF CONTENTS I. INTRODUCTION 4 II. ELECTRICITY GENERATION: main purpose 4 III. EFFICIENCY IN ELECTRICITY GENERATION BASED ON
THERMAL PROCESSES 4 3.1 Introduction 4 3.2 Power plant efficiency 7 3.2.1 Converting oil into electricity 7 3.2.2 Converting coal into electricity 7 3.2.3 Converting natural gas into electricity 8 3.2.4 Converting biomass and biogas into electricity 8 3.2.5 Converting nuclear energy into electricity 9 3.2.6 Converting geothermal energy into electricity 10 3.2.7 Converting thermal energy into electricity and useful heat in CHP units 10
IV. EFFICIENCY IN NON-THERMAL ELECTRICITY GENERATION BASED ON RENEWABLE RESOURCES 11 4.1 Introduction 11 4.2 Converting solar energy into electricity 11 4.3 Converting wind energy into electricity 12 4.4 Converting hydro energy into electricity 12 4.5 Converting energy from the ocean into electricity 12
V. EFFICIENCY IN DECENTRALISED GENERATION TECHNOLOGIES 12
VI. IMPACTS ON THE ENVIRONMENT 14 6.1 Fossil and nuclear fuels 14 6.2 Renewable energy sources 15 6.3 Comparison of specific CO2 emissions 15
VII. POWER PLANT SCALES AND GENERATION COSTS 16 VIII. ELECTRICITY GENERATION INDICATORS IN THE EU 18
8.1 EU-15 electricity generation mix 20 8.2 Candidate countries electricity generation mix 20
IX. THE BENEFITS OF IMPROVING EFFICIENCY 20 9.1 Effects of slight efficiency improvement 22
X. FINAL REMARKS AND NEXT STEPS 23
XI. GLOSSARY 24

4
I. INTRODUCTION This report gathers state-of-the-art knowledge on energy efficiency in electricity generation based on thermal processes, on renewable energy sources and on distributed generation technologies. The aim of the report is to support policy analysis made not only by electricity companies’ analysts but also by policymakers, consultants and other stakeholders. The efficiencies presented in this report are related to the most recent generation technologies on the market or expected to be available in the near future. The report is the result of collaborative work between the Union of the Electricity Industry-EURELECTRIC and VGB PowerTech’s experts. The report is divided into two distinct parts: one on energy efficiency values in electricity generation (Chapter III, IV and V), which is the core of the report, and the other part on related issues such as impacts on the environment (Chapter VI), power plant scales and generation costs (Chapter VII), indicators (Chapter VIII) and benefits of improving energy efficiency (Chapter IX). II. ELECTRICITY GENERATION: main purpose Electric energy generation is the conversion of other kinds of energy, mainly primary energy, into electrical energy.
Examples: Hydro power plant
The conversion of the water “mechanical” energy into electrical energy
Nuclear power plant
The conversion of the nuclear energy released by nuclear fuel into electrical energy
Fossil-fuel power plant
The conversion of the chemical energy of fossil fuel into electrical energy
Fuel Cell
The conversion of the chemical energy from an oxygenation controlled reaction directly into electrical energy
Generally, the process of generating electricity goes through several transformations, as there is little primary energy directly convertible into electricity. For instance, in a thermal power station the primary energy is converted to high temperature steam, as an intermediate heat source, then into mechanical energy in the turbines physically connected with the generators where the electric energy is produced. Direct energy conversion might represent greater efficiency since it means that electricity could be generated without intermediate equipment. III. EFFICIENCY IN ELECTRICITY GENERATION BASED ON THERMAL PROCESSES 3.1 INTRODUCTION In thermal power plants the steam is generated by burning fuels or from the heat released by nuclear fission or is extracted from underground geothermal reservoirs. The different energy resources used may be grouped as follows:
• Fossil fuels such as coal, oil, natural gas; • Fuels artificially prepared, such as hydrogen, alcohol and acetylene; • Converted fuels, such as methane and biogas; • Nuclear fuels • Geothermal steam

5
Fuels converting into electricity may also be grouped into solid, liquid and gaseous fuels, as follows: Solid fuels:
− Fuel wood 1 − Forest products 1 − Coal: anthracite; bituminous coal; sub-bituminous coal; lignite (brown coal) − Peat: peat is considered as a substance somehow between forest product and coal − Carbon wastes
Liquid fuels: These fuels result from refining crude oil:
− The lighter products first to distillate are liquefied petroleum gases (LPG) − The following distillate products will give gasoline, petrol and gas-oil − The residue, which is not distillate, is fuel-oil.
There are also on the market some mixtures of gas-oil and thick fuel-oil which result in: − Diesel-oil − Burner-oil − Thin fuel-oil
Other liquid fuels:
− Alcohol (especially ethanol) Gaseous fuels
− Natural gas is a mixture of hydrocarbons, chiefly methane (CH4) − Liquefied petroleum gases (LPG), butane; propane − Manufactured gas: derived from the industrial petrochemical process − Other fuel gases: hydrogen, acetylene, et al.
Fossil fuels Fuel is an organic substance used for its energy content. The energy content of a fossil fuel, before any treatment or conversion, corresponds to primary energy. A fuel is characterised, giving the common feature inherent to its heat energy generation, by the calorific value. Calorific value (GCV-Gross Calorific Value or NCV-Net Calorific Value) is the quantity of heat released by the complete combustion of a unit quantity of a fuel in a well-determined condition. Its calculation may, or not, take into account the vapour condensation of the water, determining the GCV or the NCV. Generation Efficiency The electric power plant efficiency η is defined as the ratio between useful electricity output from the generating unit, in a specific time unit, and the energy value of the energy source supplied to the unit, within the same time.2
1 Considered as renewable 2 The type of energy converted in a fuel-burning installation is variable. The output of the conversion process may either be electricity (power), heat or a mixture of both, which makes it difficult to define efficiency of the process (it is even more complex in a three-product system of electricity, heat and a high-quality syn-gas product, i.e. produced in gasification plants).
Different energy conversion processes have different thermodynamic limitations. Therefore, the term “efficiency” should only be used for one process with one energy source and one energy product, specifically referring to the output, i.e. “electrical efficiency”.
6
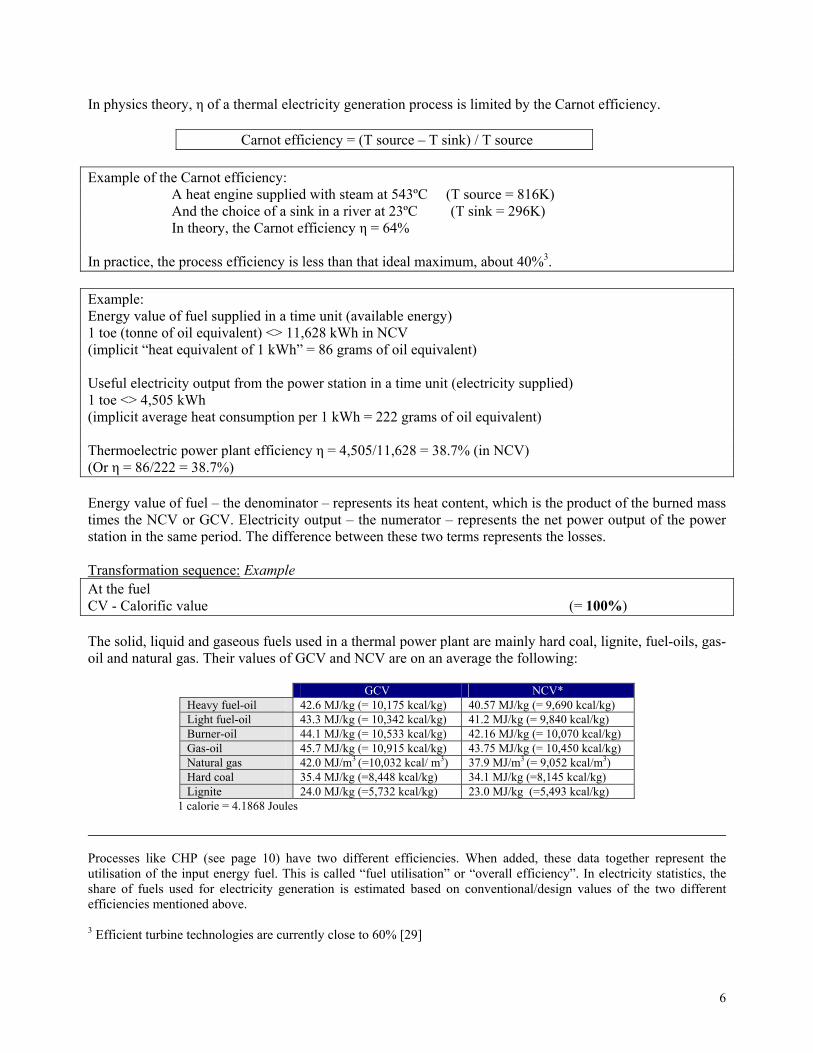
In physics theory, η of a thermal electricity generation process is limited by the Carnot efficiency.
Carnot efficiency = (T source – T sink) / T source Example of the Carnot efficiency:
A heat engine supplied with steam at 543ºC (T source = 816K) And the choice of a sink in a river at 23ºC (T sink = 296K) In theory, the Carnot efficiency η = 64%
In practice, the process efficiency is less than that ideal maximum, about 40%3. Example: Energy value of fuel supplied in a time unit (available energy) 1 toe (tonne of oil equivalent) <> 11,628 kWh in NCV (implicit “heat equivalent of 1 kWh” = 86 grams of oil equivalent) Useful electricity output from the power station in a time unit (electricity supplied) 1 toe <> 4,505 kWh (implicit average heat consumption per 1 kWh = 222 grams of oil equivalent) Thermoelectric power plant efficiency η = 4,505/11,628 = 38.7% (in NCV) (Or η = 86/222 = 38.7%) Energy value of fuel – the denominator – represents its heat content, which is the product of the burned mass times the NCV or GCV. Electricity output – the numerator – represents the net power output of the power station in the same period. The difference between these two terms represents the losses. Transformation sequence: Example At the fuel CV - Calorific value (= 100%) The solid, liquid and gaseous fuels used in a thermal power plant are mainly hard coal, lignite, fuel-oils, gas-oil and natural gas. Their values of GCV and NCV are on an average the following:
GCV NCV* Heavy fuel-oil 42.6 MJ/kg (= 10,175 kcal/kg) 40.57 MJ/kg (= 9,690 kcal/kg) Light fuel-oil 43.3 MJ/kg (= 10,342 kcal/kg) 41.2 MJ/kg (= 9,840 kcal/kg) Burner-oil 44.1 MJ/kg (= 10,533 kcal/kg) 42.16 MJ/kg (= 10,070 kcal/kg) Gas-oil 45.7 MJ/kg (= 10,915 kcal/kg) 43.75 MJ/kg (= 10,450 kcal/kg) Natural gas 42.0 MJ/m3 (=10,032 kcal/ m3) 37.9 MJ/m3 (= 9,052 kcal/m3) Hard coal 35.4 MJ/kg (=8,448 kcal/kg) 34.1 MJ/kg (=8,145 kcal/kg) Lignite 24.0 MJ/kg (=5,732 kcal/kg) 23.0 MJ/kg (=5,493 kcal/kg)
1 calorie = 4.1868 Joules
Processes like CHP (see page 10) have two different efficiencies. When added, these data together represent the utilisation of the input energy fuel. This is called “fuel utilisation” or “overall efficiency”. In electricity statistics, the share of fuels used for electricity generation is estimated based on conventional/design values of the two different efficiencies mentioned above. 3 Efficient turbine technologies are currently close to 60% [29]

7
Note: All figures are calculated for water and ash free fuels. For hard coal and lignite containing water and ashes the values are lower (e.g. lignite: water content 40-60% and ash content of 5%, NCV of 9.2 MJ/kg instead of 23 MJ/kg). * Generally in Europe, for calculating efficiency the NCV is applied Ref: VDI 4660 conversion factors for specific emissions from energy conversion systems The efficiency of a fossil fuelled power station with once-through water-cooling depends directly on the “Steam generator” efficiency and the “Turbine plant” efficiency. The losses occur in the steam generator (e.g. head losses, mass losses and steam cooling) when it passes from the steam generator to the turbine; these represent about 10%. At the turbine input CPST - Calorific power transmitted in the input steam to the turbine (= 90) The “Turbine” efficiency is the most influential factor of a power plant’s efficiency, and takes into account the fundamental heat rejected in the condenser (cold source). This efficiency is the difference between the ideal efficiency of the turbine and the sum of the losses – internal and external – of the turbine. At the generator input MPG - Mechanical power transmitted to the generator (= 40) The efficiency of a large electrical generator is typically 99%. At the generator output GEP - Gross electric power at the generator terminals (= 39) From the gross output without electrical power consumed by the station auxiliaries and the losses in “generator transformers” it is possible to obtain the net value. At the transmission grid input NEP - Net electric power supplied to the grid (= 36) η - Power station efficiency η = NEP/CV (= 36%) Losses CV-NEP (= 64%) 3.2 POWER PLANT EFFICIENCY This section indicates efficiency values for converting fuels into electricity in today’s average thermal power plant. It is important to note that these values do not represent fuel or power plant availability, but efficiency as defined in part 3.1. 3.2.1 CONVERTING OIL INTO ELECTRICITY Steam turbine fuel-oil power plant 38 to 44%
Ref: Figures agreed through peer review between EURELECTRIC and VGB experts 3.2.2 CONVERTING COAL INTO ELECTRICITY An appropriate coal to be used in a thermal power station is “steam coal”. Conventional power plants with pulverized coal firing have efficiencies as follows:

8
Steam turbine coal-fired power plant 39 to 47% Ref: VGB 3.2.2.1 CONVERTING COAL IN NEW COAL COMBUSTION TECHNOLOGIES INTO ELECTRICITY Coal and other non-gaseous fossil fuels can also be converted into electricity (and heat in CHP power plants) in combined gas-steam-cycle if the fuel is gasified in advance. Such IGCC (Integrated Gasification Combined Cycle) power plants offer large potential for higher efficiencies. On the other hand, these plants are very complex and difficult to operate, which reduces flexibility and availability. Other advanced techniques concentrate on special firing systems like fluidised bed combustion (FBC; attractive for medium scale and low-quality coal) and increased steam parameters (600°C, 270 bar and more; affords new materials). Currently, there are four main available “Clean Coal Combustion Technologies” [28] in various sizes: Pulverised coal boilers with ultra-critical steam parameters Up to 47%
Ref.: Nordjyllandsvaerket power plant 47% with sea water cooling (Denmark) Atmospheric Circulating Fluidised Bed Combustion (CFBC) > 40%
Ref: Gardanne power plant (France) Pressurised Fluidised Bed Combustion (PFBC) > 40%
Ref: Cottbus: 74 MWe. 220 th. (Germany) Coal fired IGCC > 43%
Ref: Buggenum: 43% (Netherlands); Puertollano (330 MWe); 45% (Spain) 3.2.3 CONVERTING NATURAL GAS INTO ELECTRICITY In the case of gas turbines: Large gas turbine (MW range) up to 39%
Ref: Gas turbine World Handbook, 2000/2001 3.2.3.1 CONVERTING NATURAL GAS INTO ELECTRICITY IN COMBINED CYCLE In the case of CCGT (Combined Cycle Gas Turbine processes) power is generated more efficiently than in a simple gas turbine cycle: the hot exhaust gases of the gas turbine are used to produce steam that generates electricity in a steam turbine cycle. Large gas fired CCGT power plant up to 58%
Ref.: Mainz-Wiesbaden “GuD” plant (“GuD” – Gas and Steam / Siemens) 3.2.4 CONVERTING BIOMASS AND BIOGAS INTO ELECTRICITY Biomass results from the joint combustion of organic materials of vegetal or animal origin, and also including materials resulting from their transformation. Biogas is a mixture resulting from the anaerobic fermentation of organic materials.
Biomass and biogas 30-40%
Biomass gasification combined cycle power plant 40%
Ref: Energy from Biomass, Principles and Applications [15]

9
We may consider as main sources of biomass the following: forest; waste materials from forestry and sewage; skin and residues from agro-industrial activities; residues from agricultural plantation; sewage from animal wastes; urbane waste; energy farm. Waste-to-energy Utilisation of waste for power generation should be treated as “Renewable” because it prevents the use of exhaustible fuels. Moreover, it reduces the need for waste landfills and related methane emissions. The incineration of biomass and organic waste is CO2 neutral, because the carbon dioxide that is released into the atmosphere practically offsets the CO2 absorbed by biomass during its growth.
Waste-to-electricity power plant 22 to 28%
Ref: VGB 3.2.5 CONVERTING NUCLEAR ENERGY INTO ELECTRICITY As far as nuclear energy is concerned, the fact that the fission of one gram of U235 releases approximately 24 MWh or 1 MWday (MWd) of thermal energy makes it convenient to use the concept of combustion rate, also known as “burn-up”, which is expressed in MWdays per tonne of heavy metal4 (MWd/tHM). Over the past 30 years, burn-up has steadily increased: for light water reactors, the most common type in the western world, it has moved from 33,000 to around 65,000 MWd/tHM and is expected to increase further. The total thermal energy released by nuclear fuel is proportional to the burn-up it reaches at the end of its reactor life5. One fuel assembly containing typically 460 kg of uranium and reaching a burn-up of 65,000 MWd/tU would therefore release 65,000 MWd/tU x 0.46 tU x 24h/d = 717,600 MWh of thermal energy over its reactor life. The thermal efficiency of a nuclear power station is defined in exactly the same way as for any other thermal plant: it is the efficiency of the thermodynamic cycle by which the heat generated by the fuel is converted into steam through steam generators. The thermal efficiency of a conventional nuclear power station is around 33%. Nuclear power plant 33% to 36%
Ref: Figures agreed through peer review between EURELECTRIC and VGB experts Therefore, to generate 1,000 MW of electrical power (MWe) in a nuclear plant it is needed around 3,000 MW of thermal power from the fission reaction. One day generating and fuel consumption: For a generating capacity of 1,000 MWe, the energy output in one day is: (1 x 10⁹ J/s) x (86,400 s) = 0,864 x 1014 J Each day fuel consumption: 1,000 MWe coal-fired power plant burns about 8,000 tons of coal; 1,000 MWe nuclear power plant has to undergo fission of about 3.2 kg mass of U235.
4 Heavy metal referring to the fissionable material composing the fuel 5 The relation between the burn-up achievable and the initial heavy metal content of the fuel assembly is more complex

10
3.2.6 CONVERTING GEOTHERMAL ENERGY INTO ELECTRICITY Geothermal energy comes from the thermal earth inner activity, mainly where there is volcano activity. The deposits of heat may be exploited with almost constant power supply. Once steam reaches earth surface through wells, it is used to produce electricity, in some cases used for non-electric purposes (e.g. building heating), or saving energy otherwise produced through conventional methods. Inside geothermal plants steam supplies power to move the turbines producing electricity. Waste water derived from steam is then injected in deep wells in order to keep a constant pressure level and to avoid steam pollution. In some areas of the world, including Europe, geothermal energy plays a leading role. The type of use – heating or power generation – depends on the quantity and quality (level of temperature) of the geothermal source. In some regions, it has been produced commercially in the range of hundreds of MW for many decades [EU Blue Book on Geothermal Resources]. Geothermal power plant up to 15% for 190°C
Ref: EGEC / Geothernet The efficiency of existing organic Rankine Cycle plants generally range from 10% to 15.5% for resources at 100°C to 160°C and is slightly higher (17%) for temperatures up to 190°C with a two-phase geothermal fluid [quote from EGEC / Geothernet]. Advanced cycles like the Kalina Cycle offer large potential but are not commercially available. Regarding the high density and the constant availability of the energy source – that is, for a renewable technology, only comparable with hydro – the focus is not on increasing efficiencies but at reducing costs. Just for heating purposes the use of heat pumps is very attractive, especially if the temperature of the geothermal source is not very high (low quality). Heat pumps require external energy input like electricity but are able to generate much more heat (at medium quality) than the quantity included in the fuel for generating this electricity. For domestic heating, even the upper ground or ambient air suffices as geothermal source. 3.2.7 CONVERTING THERMAL ENERGY INTO ELECTRICITY AND USEFUL HEAT IN CHP UNITS In the case of Combined Heat and Power (CHP), or co-generation, part of the converted thermal energy is used for generating useful heat: either by utilising the low-temperature steam at the steam-turbine exit for district heating or branching off a certain amount of steam directly from the steam turbine i.e. for process heat. This reduces the electrical efficiency slightly (~14 % of extracted heat for district heating), but the input fuel energy is better used in total. The loss of electrical output results from the pressure difference by condensing steam at back pressure instead of vacuum conditions. For high temperature steam extraction, the loss is higher. For example, a 112 MW (electric) plant operating in a mode without heat extraction has an electrical efficiency of 36.3%. By producing 152 MW additional heat the overall efficiency increases to 84.9%.
Example: Power of gas turbine 69,100 kW Power of back-pressure steam turbine 44,700 kW Auxiliary power consumption 1,400 kW Net power output of plant 112,400 kW Heat input gas turbine 230,000 kW Heat input supplementary firing 79,600 kW Process steam output 152,000 kW Electrical efficiency 36.3 % Thermal efficiency of heat production (only) 48.6 % Overall efficiency 84.9 %
The “overall efficiency” is higher than the electrical efficiency and results from adding the efficiency of the generated heat (= useful heat / energy of fuel supplied). The overall efficiency is therefore defined as:

11
Overall efficiency = (Electrical Power Output + Useful Heat Output) / Total Fuel Input. Comparing separated heat and power supply to CHP or two different CHP solutions on the basis of overall efficiencies is possible with the same amount of electricity and heat at uniform temperature levels6. CHP applications provide potential for better fuel utilisation especially if the volume of heat demand is high and relatively constant (in the summer period too), as in industry or in some northern regions of Europe. Examples for CHP power stations in Finland show highest figures for heat output and overall efficiency compared to others and in contrast to other countries, without any subsidies being provided. IV. EFFICIENCY IN NON-THERMAL ELECTRICITY GENERATION BASED ON RENEWABLE RESOURCES 4.1 INTRODUCTION Renewable energies are sources of energy that renew themselves constantly through natural processes and, seen on a human-time scale, will never run out. Renewable energies come from three primary sources: solar radiation; heat from inner earth; tidal power. These three sources can be used either directly or indirectly, in particular the form of biomass, wind, wave energy and ambient heat. Renewable energy sources (RES) can be converted into electricity, heat and also fuel. 4.2 CONVERTING SOLAR ENERGY INTO ELECTRICITY Solar systems for electricity generation purposes are based on the concentration of sunlight. There are three different concentration solar power systems: parabolic trough systems; solar power tower; parabolic dish technology using a stirling motor Their efficiency values are the following: Parabolic trough 14 – 18%
Power tower 14 – 19%
Dish stirling 18 – 23%
Ref: Figures agreed through peer review between EURELECTRIC and VGB experts Solar energy may also be used directly to produce electricity (photovoltaic effect) that involves photovoltaic cells and, sometimes, grouped on photovoltaic panels. Although it is difficult to generate a high output solar energy compared with fossil fuel or nuclear energy, solar energy is of major importance because it is a non-polluting and renewable energy source. The efficiency value of photovoltaic cells is the ratio of the electrical energy produced by the cells to the incident solar radiant energy.
Photovoltaic cells Up to 15%
Ref: VGB
6 Directly comparing different CHP applications, or comparing CHP with separate heat and power generation could be misleading, if the quality of the energy converted is not taken into account (2nd law of thermodynamics). For pure electricity production, the thermodynamic limits have to be considered and for pure heat production this comparison does not show a benefit for CHP, since simple heating boilers, i.e. for domestic heating, have a comparable or even higher quality in “overall efficiency” than CHP units.

12
4.3 CONVERTING WIND ENERGY INTO ELECTRICITY Energy derived from the wind results from the solar energy on the different stratum of the atmosphere. A typical turbine with 40 meters blade diameter and an 8 m/s wind speed, extract about 400 kW from the air of which about 35% can be converted into electric power. Wind turbine Up to 35%
Ref: VGB - this figure is a maximum because it does not increase with the total performance. Even 4 MW off-shore converters will not exceed 35%. Example: German coast on-shore: up to 2,500 hours per year; off-shore: up to 4,500 hours per year. 4.4 CONVERTING HYDRO ENERGY INTO ELECTRICITY The electrical efficiency of a hydroelectric power station depends mainly on the type of water turbine. The electricity generated by moving water comes from large hydroelectric power plants and also from smaller ones, such as: mini-power and micro-power plants. It is worth mentioning that more than 90% of total hydro power generated in the EU comes from large hydro. The installed capacity of a small hydroelectric power plant is generally a few MW (<5 MW with an efficiency between 80 and 85 %).
Large hydro power plant Up to 95%
Small hydro power plant Up to 90%
Ref: VGB 4.5 CONVERTING ENERGY FROM THE OCEAN INTO ELECTRICITY Tidal energy results from submarine turbines moving from the rise and fall of sea level due to the gravitational forces of the moon and sun. A dam is used to store the water and a turbine to enable useful energy production. Tidal power plant Up to 90%
Ref: Electricité de France (EDF) V. EFFICIENCY IN DECENTRALISED GENERATION TECHNOLOGIES Short-term energy-storage technologies such as mechanical flywheel, chemical batteries and fuel cells, magnetic superconducting, electric ultra-capacitor, can be incorporate in a multi-energy system7. Applications with high electrical demands and lower heat demands will be suited to fuel cells. Electrical efficiencies are as follows: Protons Exchange Membrane Fuel Cell (PEMFC) 40 %
Phosphoric Acid Fuel Cell (PAFC) 40 %
Solid Oxide Fuel Cell (SOFC) 46 % (aimed > 60%, pressurized)
Melted Carbonates Fuel Cell (MCFC) 52 % (aimed: 65 %)
Ref: VGB
7 A study [35] considered the following storage technology: batteries (lead-acid and advanced), flywheels (low speed and high speed), ultracapacitors, compressed air energy storage, superconducting magnetic energy storage, pumped hydro electric storage, and hydrogen storage.

13
Fuel cells produce electricity, heat and water. The waste heat recovered from the fuel cells may be used (e.g. for building heating) with effects in the increase of overall efficiency of the system. The overall efficiency is at around 85 to 95%. Microturbines Small and micro-turbines (up to 100 kW) 17 to 22%
Ref: Capstone As micro turbines, diesel/gas motors are often used for decentralised CHP applications:
Diesel engine as decentr. CHP unit, electrical share 20% to 40% and above 45% at large scale
Ref: Figures agreed through peer review between EURELECTRIC and VGB experts The graph below summarises the efficiency in various generation technologies:
Efficiency in Electricity Generation
0
10
20
30
40
50
60
70
80
90
100
Large
hydro
power
plant
Small hy
dro pow
er plan
t
Tidal p
ower
plant
Large
gas f
ired C
CGT power
plant
Melted
carbo
nates f
uel ce
ll (MCFC)
Pulveris
ed coa
l boil
ers w
ith ul
tra-cr
itical
steam
param
eters
Solid o
xide fu
el ce
ll (SOFC)
Coal fire
d IGCC
Atmos
pheric
Circ
ulatin
g Flui
dised
Bed Com
busti
on (CFBC)
Pressu
rised
Fluidise
d Bed
Com
bustio
n (PFBC)
Biomas
s gas
ificatio
n combin
ed cy
cle po
wer plan
t
Proton
s exc
hange
membra
ne fue
l cell
(PEMFC)
Phosp
oric a
cid fu
el ce
ll (PAFC)
Large
gas t
urbine
(MW ra
nge)
Steam tu
rbine co
al-fired
power
plant
Steam tu
rbine fu
el-oil
power
plant
Wind tu
rbine
Nuclear p
ower p
lant
Biomas
s and
biog
as
Waste-to
-electric
ity po
wer plant
Diesel e
ngine a
s dec
entra
lised C
HP unit (
electr
ical s
hare)
Solar d
ish st
irling
Small an
d micr
o turb
ines (
up to
100 kW
)
Photov
oltaic
cells
Geotherm
al po
wer pla
nt
Solar p
arabolic
troug
h
Solar p
ower tow
er
Effic
ienc
y (%
)
Efficiency (%)

14
VI. IMPACTS ON THE ENVIRONMENT 6.1 FOSSIL AND NUCLEAR FUELS The impacts on the environment due to the use of fossil fuels in thermal power plants are the following: emissions of gases causing acidification (e.g. sulphur dioxides and nitrogen oxides), greenhouse gas emissions (e.g. carbon dioxide, methane, sulphur hexafluoride, etc), ashes and dust emissions to air. Example: 1,000 MW of generation capacity, 6,600 full load hours per annum = 6.6 TWh electricity production per annum result in the following emissions (the diversity of fuel mixes in each country gives different average values):
Ref: VGB The table below shows relative power plant emissions per unit of electricity generated in the UK [29]:
Fuel Source SO2 NOx CO2 Coal (average UK) 1.00 1.00 1.00 Coal (typically imported) 0.55 1.00 1.00 Coal (incorporating fuel emission control) 0.10 0.60 1.05 Heavy Fuel-Oil 1.20 0.75 0.85 Natural Gas 0.00 0.25 0.50
For example, considering the CO2 intensity8, the values may range from 32 gCO2/kWh – in a system with Nuclear + Hydro + Biomass + Wind – to 1,000 gCO2/kWh – in a system based exclusively on coal. The table below contains the total SO2, NOX and CO2 emissions in the European Union.
Gas (kt) 1980 1990 2000 2005 2010 2020 SO2 12,214 8,424 3,115 2,259 1,736 1,059 NOx 3,214 2,672 1,653 1,400 1,268 1,053 CO2 894,342 888,562 862,676 832,352 847,068 891,369
Ref: Eurprog, EURELECTRIC 8 Pulverised coal plant with desulphurisation – assuming CO2 emissions of 961 gCO2/kWh; a co-generation installation with CO2 emissions of 399-434 gCO2/kWh [26]
Hard Coal Lignite Oil Gas-CC Nuclear El. Efficiency % 42.0% 40.0% 44.0% 57.0% 34.0% Fuel Consumpt. t/a 2,000,000 7,600,000 1,289,768 920,000 20 Oxygen Cons. t/a 3,800,000 4,800,000 3,270,047 1,600,000 0 CO2 emiss. t/a 5,200,000 6,600,000 4,496,314 2,200,000 0 SO2 emiss t/a 3,800 4,300 3,134 1,200 0 NOx emiss t/a 3,800 4,300 3,134 3,500 0 Dust emiss t/a 600 640 470 200 0 Radioactivity kBq/a 80 90 0 0 52,800 Ash t/a 150,000 950,000 2,000 0 0 Gypsum t/a 75,000 110,000 220,000 0 0

15
Lignite Hard Coal
Natural Gas
Nucl.Power
SolarPower
WindPower
IGCC
FuelOil
OilPowerPlant
HydroPower
PhotovoltaicPlant
Site:
Germ. Equa-torialAreas
Site:
CoastalArea
1.02
0.91
0.830.79 0.76
0.58
0.47
0.36
0.02 0.006
0.19
0.14 0.02
Emissions in kg CO2/kWhOperationFuel SupplyConstructionSteam
PowerPlant
Gas-TurbineCycle
Carbon Dioxyde Emissions per kWh
IGCC
SteamCycle
Steam-TurbineCycle
Gas+SteamComb.Cycle
PWR1300MW
Run-of-RiverPlant
according to Siemens / Voss / VDI-GET 1999
6.2 RENEWABLE ENERGY SOURCES To illustrate the environmental benefits associated with a non-polluting source an example is provided. Considering a 10 MW wind farm with an average production of 23.5 GWh/year, compared with an alternative thermal production, the avoided emissions of SO2, NOx, CO2 and ashes, are as follows:
Wind Farm 10 MW; 6,5-7 m/s; 23,5 GWh/year - avoided emissions: Considering an alternative thermal production:
SO2
NOx
CO2
Ashes and particles
Based on fuel-oil 127 t 60 t 19,000 t 6.5 t Based on Coal 183 t 122 t 25,000 t 1,400 t
Ref: Jorge A Gil Saraiva, 1996 [10] Power plants using renewable energy sources do not emit greenhouse gases and other emissions during operation. On the other hand, except for hydro and geothermal power, the net output of such a plant is comparably small, because the energy input (e.g. solar radiation, wind) is not constant and its density is low. Therefore, the expenditure of energy and materials for plant construction per electricity generated is high. 6.3 COMPARISON OF SPECIFIC CO2 EMISSIONS For an overall comparison of specific CO2 emissions (i.e. kg CO2/kWh) a full “Life-Cycle Balance”, including site erection and fuel supply, is necessary. The graph below shows that the specific emissions cannot be neglected for solar power; on the other hand, nuclear power is very competitive in this sense. Finally, carbon dioxide emissions are not the only criterion for climate change issues. Some other greenhouse gases like methane have higher Global Warming Potential (GWP) than CO2. Therefore, gas pipeline leakages for example could have a considerable impact on the Life-Cycle Balance of gas-based power supply, but they are difficult to assess (2% to 8%).

16
Note that the values presented in the graph below differ from the values “Intensity CO2 emissions from Thermal Electricity Generation” in the table in page 18, because they refer to specific CO2 emissions not only per thermal electricity generation but per total electricity generation.
CO2 emissions per electricity generation in the European Union
0
200
400
600
800
1000
1200
1400
Aus
tria
Bel
gium
Ger
man
y
Den
mar
k
Spa
in
Finl
and
Fran
ce
Gre
at B
ritai
n
Gre
ece
Irela
nd
Italy
Luxe
mbo
urg
Net
herla
nds
Portu
gal
Sw
eden
Sw
itzer
land
Nor
way
Cze
ch R
ep.
Pol
and
Slov
akia
ktCO
2/TW
h
19902000
Ref: Eurprog, EURELECTRIC [Luxembourg, 1999 = 7,197 ktCO2/TWh, data from 2000 not available] VII. POWER PLANT SCALES AND GENERATION COSTS The following table gives an idea of the typical power plant scale.
Type Scale (kW) Nuclear Plant 1,300,000 Coal Plant 500,000 Gas Turbine, Combined-cycle 250,000 Gas Turbine, Single-cycle 100,000 Industrial Co-generation Plant 50,000 Wind Turbine 1,000 Micro-turbine 50 Residential Fuel Cell 7 Household Solar Panel 3 Stirling Engine 1
Ref: Figures agreed through peer review between EURELECTRIC and VGB experts Total costs of electricity generation per kWh generated comprise the specific costs for capital investment, operation & maintenance and fuel. Regarding full life-cycle balance decommissioning and external effects of emissions (e.g. health, climate) have to be included, although external costs are difficult to assess: • The total costs of fossil based power generation vary from 3 to 4 eurocent/kWh at current fuel prices,
even for natural gas in combined cycle generation. Although investment costs are very low for gas based plants, gas prices vary considerably from time to time in comparison to hard coal and lignite (in some countries fuel tax has to be added). External costs: significant emission reductions are being achieved, but there still remains a negative impact, especially CO2, that studies show to be 20%, and in some pessimistic view up to 60% of the total costs.

17
• In general, nuclear systems have in total, competitive costs when compared with fossil fuel generation systems. The investment costs are higher, but today most of these plants only produce for fuel costs and therefore are attractive. The latest design studies like the European Pressurised Water Reactor [EPR] have been completed under the prerequisite to be competitive to coal and even gas at total costs. The external costs are low due to near zero emissions; however, the nuclear waste issue should also be taken into account.
• Hydro and geothermal power are – if at large scale – the only renewable sources providing sufficient
energy density and availability to generate power at attractive costs. If investments are paid, large hydro power plants have the lowest total costs, i.e. less than 2 eurocent/kWh. External costs are difficult to estimate (i.e. displacing CO2-emitting plants) but comparatively low.
• Wind turbines, biomass and solar thermal power plants have total costs of at least 5 eurocent/kWh under
optimum conditions. At normal conditions, 10 eurocent/kWh can easily be exceeded. This counts as well for small hydro plants (< 5 MW).
• Total costs from photovoltaic power generation are high: 35 eurocent/kWh can be exceeded even under
sunny conditions. To give an example: in Germany photovoltaic power is subsidised around 50 eurocent/kWh, which covers approximately only half of the total costs for photovoltaic application in this country. External costs are relatively small compared to this dimension, but comparable to those of gas-fired power plants.
A key factor for a sustainable – that means ecologically, economically and socially compatible – power supply is the cost of saved kgCO2/kWh. Several studies show [Wagner, Munich, 1997] that this can be done through measures that are relatively cheap to realise – i.e. retrofitting advanced turbine blades – when related to increased power output. In comparison, erecting wind converters could cost up to 10 times more per tCO2 reduced and photovoltaic systems over 100 times more (see graph below). Consequently, the most cost-effective CO2 abating technique is improving conventional power supply.
Of. 12.01.02 1
0
50
100
150
200
Retrofi
t
new G
TCC
Nucl. P
P (EPR)
Hydro
Adv. C
oal T
echn
.
CO2-Seq
uestr
.wind
photo
volt.
€ / t
avo
ided
CO
2
Source: medium values of figures based on • own calculations including external costs after Voss, 2001, and other publications, see VGB PowerTech, and • collected data following Wagner, 1998, Pruschek, Göttlicher (Coal-PP with CO2-Sequestration, study), 1999/2001
Costs of CO2-Emissions avoided by specific measures
> 1000

18
VIII. ELECTRICITY GENERATION INDICATORS IN THE EU The following table presents indicators that characterise some electricity generation aspects in the EU Member States. Two series of values are presented in the table below: one related to 1985 and the other to 1999.
Some indicators 1985 > 1999
Energy intensity (Gross Inland Consumption/ GDP) toe/1990 MEUR
Import dependency (%)
Electricity Generated/ Capita kWh/inhabitant
Intensity CO2 emissions from Thermal Electricity Generation tCO2 emissions from power generation/ GWh Non-Nuclear thermal electricity generated
AUSTRIA 1985>1999 220.5 186.5 65.3 66.1 5,913.9 7,458.8 541 619 BELGIUM 1985>1999 329.6 313.3 69.3 76.5 5,813.5 8,263.8 838 590 DENMARK 1985>1999 213.8 160.2 77.6 -13.6 5,679.6 7,305.9 928 748 FINLAND 1985>1999 297.2 261.2 59.2 51.7 10,139.7 13,439.3 699 587 FRANCE 1985>1999 251.5 230.9 54.1 51.9 6,226.7 8,856.8 846 740 GERMANY 1985>1999 315.0 228.1 42.1 59.2 6,706.5 6,768.4 944 809 GREECE 1985>1999 308.4 341.9 60.7 66.1 2,791.8 4,725.6 1,009 852 IRELAND 1985>1999 322.4 202.7 60.1 83.1 3,414.1 5,888.5 757 733 ITALY 1985>1999 182.9 180.3 82.0 80.9 3,281.4 4,607.6 672 580 LUXEMBOURG 1985>1999 448.1 269.6 99.0 97.3 2,560.2 2,374.1 1,205 385 NETHERLANDS 1985>1999 320.9 260.6 5.8 29.7 4,342.1 5,480.9 599 600 PORTUGAL 1985>1999 297.2 351.3 75.2 89.9 1,908.3 4,331.7 697 655 SPAIN 1985>1999 235.9 238.9 60.6 76.6 3,314.4 5,302.4 907 761 SWEDEN 1985>1999 290.6 244.8 42.2 35.1 16,421.4 17,535.3 1,105 455 UNITED KINGDOM 1985>1999 312.9 252.6 -15.4 -20.3 5,257.7 6,163.5 886 618 Ref: 2001-Annual Energy Review, January 2002 – European Commission [9]
Data from 1999 EU-15 USA Japan Average Thermal Efficiency 39.9% 33.3% 44.9% Consumption/GDP [toe/MEUR] 231.3 396.2 198.2
CO2 emissions/capita [tCO2/inhabitant] 8.2 20.7 9.1
Import dependency 47.6% [686.6 Mtoe]
24.9% [565.2 Mtoe]
79.4% [409.2 Mtoe]
Ref: 2001-Annual Energy Review, January 2002 – European Commission [9]

19
Reference Year: 1999 Countries with electricity generated/capita >7500 kWh/inhabitant
Import Dependency (%)
0
10
20
30
40
50
60
70
80
90
BEL FIN FR SWE
Energy Intensity [toe/1990 MEUR]
0
50
100
150
200
250
300
BEL FIN FR SWE
Intensity CO2 emissions from Thermal Electricity Generation (tCO2/GWh)
0
100
200
300
400
500
600
700
800
BEL FIN FR SWE
Countries with electricity generated/capita 5500-7500 kWh/inhabitant
Import Dependency (%)
-40
-20
0
20
40
60
80
100
AT DK GER IRL UK
Energy Intensity [toe/1990 MEUR]
0
50
100
150
200
250
AT DK GER IRL UK
Intensity CO2 emissions from Thermal Electricity Generation
(tCO2/GWh)
0
100
200
300
400
500
600
700
800
AT DK GER IRL UK
Countries with electricity generated/capita < 5500 kWh/inhabitant
Import Dependency (%)
0
10
20
30
40
50
60
70
80
90
100
GR IT LUX NL PT ES
Energy Intensity [toe/1990 MEUR]
0
50
100
150
200
250
300
350
GR IT LUX NL PT ES
Intensity CO2 emissions from Thermal Electricity Generation
(tCO2/GWh)
0
100
200
300
400
500
600
700
800
GR IT LUX NL PT ES
Ref: 2001-Annual Energy Review, January 2002 – European Commission [9]

20
8.1 EU-15 ELECTRICITY GENERATION MIX The thermal power plants based on non-renewable resources represent 85.2% of the total electricity generation in the European Union.
Electricity Generation in the EU-15 Year 2000 Conventional thermal 51.8% Nuclear 33.4% Hydro & other renewables 14.8% EU-15 Electricity Generation in the year 2000 = 2,448.6 TWh
Ref: Eurostat 8.2 ACCESSION COUNTRIES ELECTRICITY GENERATION MIX The generation mix of the future EU Members States (e.g. Estonia, Latvia, Lithuania, Malta, Cyprus, Czech Republic, Slovakia, Hungary, Poland, Slovenia) which will enter the European Union in 2004, is the following:
Electricity Generation in future 10 EU Member States Year 2000
Conventional thermal 75.9% Nuclear 17.9% Hydro & other renewables 6.2% Future 10 EU Member States Electricity Generation in the year 2000 = 302,1 TWh
Ref: Eurprog (data from Malta and Estonia was not available) IX. THE BENEFITS OF IMPROVING EFFICIENCY Considering the scarcity of non-renewable energy resources such as: gas-oil, light fuel-oil, heavy fuel-oil, anthracite, coal, butane, natural gas - and the environmental impacts associated with the use of such resources, such as acidification and climate change, there is a need to consider the analysis of the following resources: − Renewable energy sources: Solar energy, hydro power, tidal power, geothermal power, biomass, wind
energy
− Direct energy conversion: Fuel cells, magneto hydrodynamic generators, thermionic converters, semiconductor thermoelectric converters
− CHP supply and combined cycle: Combined Heat and Power, Combined Cycle Power Station
− Multi-energy systems: combining traditional grid power with new technologies (fuel cells, others)9
− Advanced combustion technologies and efficient process: Integrated Gasification Combined Cycle,
Fluidised bed combustion, Flue Gas desulphurisation process
− Bio-fuel: Methane, Biogas, Bio-diesel − Nuclear
For these resources it is necessary to identify their availability, their potential for technical improvement and the way to promote their implementation.
9 One example of a multi-energy system could be a combination of a grid power, fuel cells, flywheel energy storage, and diesel engine generator for achieving the quality, availability, and system efficiency desired by the customer from its energy source [4]

21
It is also important to measure the progress for each country on a regular basis, i.e. every four-five years, with performance indicators, concerning the efficiency process, renewable and combined heat and power contributions, greenhouse gas reductions, such as: − Overall efficiency of power plants (%) − Electricity RES and CHP as share of total electricity production (%) − Overall CO2 emissions
Main Issues on Preservation of Resources on the Supply-Side
Renewables
Direct energy conversion Multi-energy systems
CHP supply and combined cycle
Better combustion technologies and
efficient processes
Bio-fuels 4-5 year reporting performance indicators Nuclear
POWER GENERATION
22
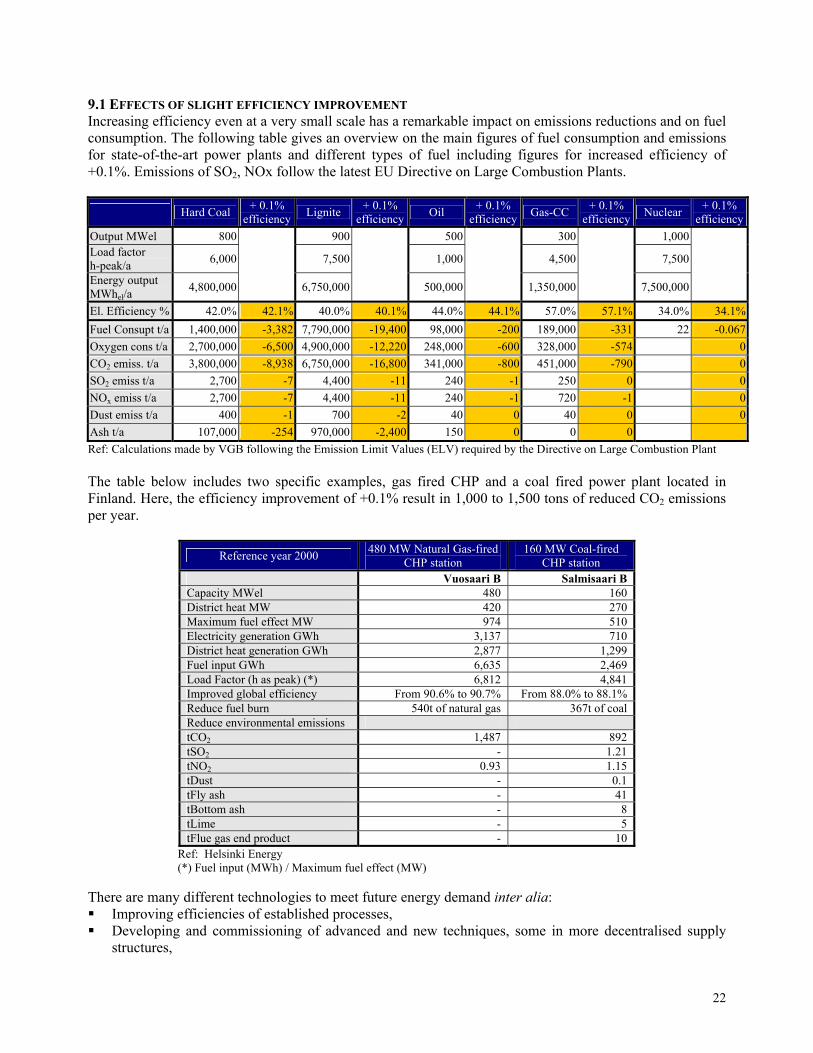
9.1 EFFECTS OF SLIGHT EFFICIENCY IMPROVEMENT Increasing efficiency even at a very small scale has a remarkable impact on emissions reductions and on fuel consumption. The following table gives an overview on the main figures of fuel consumption and emissions for state-of-the-art power plants and different types of fuel including figures for increased efficiency of +0.1%. Emissions of SO2, NOx follow the latest EU Directive on Large Combustion Plants.
Hard Coal + 0.1% efficiency Lignite + 0.1%
efficiency Oil + 0.1% efficiency Gas-CC + 0.1%
efficiency Nuclear + 0.1% efficiency
Output MWel 800 900 500 300 1,000Load factor h-peak/a 6,000 7,500 1,000 4,500 7,500
Energy output MWhel/a 4,800,000 6,750,000 500,000 1,350,000 7,500,000
El. Efficiency % 42.0% 42.1% 40.0% 40.1% 44.0% 44.1% 57.0% 57.1% 34.0% 34.1%Fuel Consupt t/a 1,400,000 -3,382 7,790,000 -19,400 98,000 -200 189,000 -331 22 -0.067Oxygen cons t/a 2,700,000 -6,500 4,900,000 -12,220 248,000 -600 328,000 -574 0CO2 emiss. t/a 3,800,000 -8,938 6,750,000 -16,800 341,000 -800 451,000 -790 0SO2 emiss t/a 2,700 -7 4,400 -11 240 -1 250 0 0NOx emiss t/a 2,700 -7 4,400 -11 240 -1 720 -1 0Dust emiss t/a 400 -1 700 -2 40 0 40 0 0Ash t/a 107,000 -254 970,000 -2,400 150 0 0 0 Ref: Calculations made by VGB following the Emission Limit Values (ELV) required by the Directive on Large Combustion Plant The table below includes two specific examples, gas fired CHP and a coal fired power plant located in Finland. Here, the efficiency improvement of +0.1% result in 1,000 to 1,500 tons of reduced CO2 emissions per year.
Reference year 2000 480 MW Natural Gas-fired CHP station
160 MW Coal-fired CHP station
Vuosaari B Salmisaari B Capacity MWel 480 160 District heat MW 420 270 Maximum fuel effect MW 974 510 Electricity generation GWh 3,137 710 District heat generation GWh 2,877 1,299 Fuel input GWh 6,635 2,469 Load Factor (h as peak) (*) 6,812 4,841 Improved global efficiency From 90.6% to 90.7% From 88.0% to 88.1% Reduce fuel burn 540t of natural gas 367t of coal Reduce environmental emissions tCO2 1,487 892 tSO2 - 1.21 tNO2 0.93 1.15 tDust - 0.1 tFly ash - 41 tBottom ash - 8 tLime - 5 tFlue gas end product - 10
Ref: Helsinki Energy (*) Fuel input (MWh) / Maximum fuel effect (MW) There are many different technologies to meet future energy demand inter alia: Improving efficiencies of established processes, Developing and commissioning of advanced and new techniques, some in more decentralised supply
structures,

23
Fuel switching and replacing old power plants with stations state-of-the-art. To estimate the impacts on the environment, not only fuel consumption and emissions at the operating period of a power plant need to be calculated, but also construction of the site, fuel supply and decommissioning have to be taken into account. A full Life-Cycle Balance may show in detail that not every new or advanced technique is of advantage. X. FINAL REMARKS AND NEXT STEPS • Coal and other fossil fuels dominate world-wide power supply due to their cost-effective usage in large
central units – both industrialised countries and developing countries. Though a high standard of fossil fuel conversion techniques has been achieved up to now, further improvement of classical processes is possible, i.e. through advanced steam parameters with new materials. Emission abatement through efficiency improvement at coal fuelled power plant is comparably cheap and therefore has great effects on fuel consumption and environmental impacts.
• Nuclear power avoids large-scale greenhouse gas emissions. Consequently, expanding its use may
compensate for fossil fuel power emissions, especially in industrialised countries, which are typically able to raise high capital costs.
• Renewable energy and advanced conversion techniques such as fuel cells will be the future pillar of the
fuel mix for power supply – with considerable potential for resource preservation. Much effort will have to be made to reduce costs and to optimise the full life cycle.
• CHP applications have great potential for better fuel utilisation. However, extending CHP has to be
calculated carefully for every individual case in comparison to efficient but separate power and heat generation, especially if there is no constant heat demand for the heat load generated.
• Distributed power plants of small scale, especially fuel cells, will contribute more and more to power
supply and might contribute to fuel preservation due to their specific high efficiency. Large units will be necessary for economically feasible long term base power supply. Therefore, the two power supply concepts are not competitors but rather complementary.
• For some fuels such as coal, large power plants represent the only way for ecological and economically
efficient utilisation. In contrast to gas and oil, coal resources are distributed over many regions of the world and there are vast reserves which could last for hundreds of years.
24
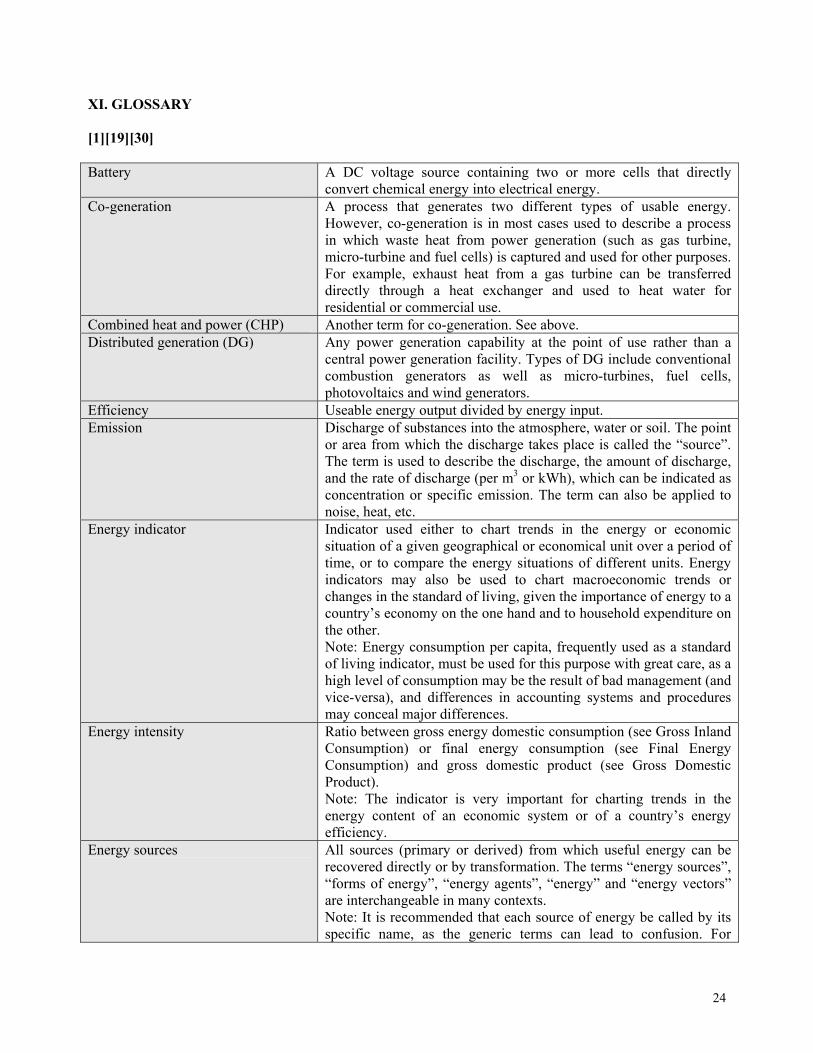
XI. GLOSSARY [1][19][30] Battery A DC voltage source containing two or more cells that directly
convert chemical energy into electrical energy. Co-generation A process that generates two different types of usable energy.
However, co-generation is in most cases used to describe a process in which waste heat from power generation (such as gas turbine, micro-turbine and fuel cells) is captured and used for other purposes. For example, exhaust heat from a gas turbine can be transferred directly through a heat exchanger and used to heat water for residential or commercial use.
Combined heat and power (CHP) Another term for co-generation. See above. Distributed generation (DG) Any power generation capability at the point of use rather than a
central power generation facility. Types of DG include conventional combustion generators as well as micro-turbines, fuel cells, photovoltaics and wind generators.
Efficiency Useable energy output divided by energy input. Emission Discharge of substances into the atmosphere, water or soil. The point
or area from which the discharge takes place is called the “source”. The term is used to describe the discharge, the amount of discharge, and the rate of discharge (per m3 or kWh), which can be indicated as concentration or specific emission. The term can also be applied to noise, heat, etc.
Energy indicator Indicator used either to chart trends in the energy or economic situation of a given geographical or economical unit over a period of time, or to compare the energy situations of different units. Energy indicators may also be used to chart macroeconomic trends or changes in the standard of living, given the importance of energy to a country’s economy on the one hand and to household expenditure on the other. Note: Energy consumption per capita, frequently used as a standard of living indicator, must be used for this purpose with great care, as a high level of consumption may be the result of bad management (and vice-versa), and differences in accounting systems and procedures may conceal major differences.
Energy intensity Ratio between gross energy domestic consumption (see Gross Inland Consumption) or final energy consumption (see Final Energy Consumption) and gross domestic product (see Gross Domestic Product). Note: The indicator is very important for charting trends in the energy content of an economic system or of a country’s energy efficiency.
Energy sources All sources (primary or derived) from which useful energy can be recovered directly or by transformation. The terms “energy sources”, “forms of energy”, “energy agents”, “energy” and “energy vectors” are interchangeable in many contexts. Note: It is recommended that each source of energy be called by its specific name, as the generic terms can lead to confusion. For

25
example, “new energy” can be applied to energy sources that have been exploited more systematically or with the help of more sophisticated techniques. Likewise, “conventional energy” which often refers to fossil fuels and partly to electrical energy is a very relative concept, and one which changes with time. As for “renewable energy sources”, they may be continually renewable (permanent flux), renewable in short cycles (annual, for example), over a period of one or more generations; or may be partly or completely renewable. The names “energy flux” and “energy stock” are sometimes used to distinguish between “renewable energy sources” and “non-renewable energy sources. Furthermore, some terms such as “soft energy sources” or “hard energy sources” which do not correspond to any physical reality have a sociological rather than technical or economic meaning. All these generic terms can thus be used validly with a very indicative and qualitative meaning.
Final energy consumption Energy consumed by the final user for all energy purposes (1) Fuel cell A device that generates a relatively small amount of electricity from
fuels through an electro-chemical process rather than from combustion. In the most common case, a catalyst strips electrons from hydrogen proton and oxygen in the air to produce water and heat as a by-product. Hydrogen fuel cells are characterised as having high electrical efficiencies with zero harmful emissions.
Gas turbine An engine (based upon the jet engines used on aircraft) used to power electrical generators in major power plants. Gas turbines run on natural gas and are characterised by having low investment costs, short construction time, no need for thermal cycle cooling, low environmental impact and very low maintenance requirements. Power output can vary from a couple of megawatts to several hundred megawatts.
Gross domestic product Total production of goods and services by the subjects of a country and foreigners within national borders (2)
Gross inland energy consumption Gross consumption minus bunkers: final energy consumption plus energy sector’s own consumption and losses.
Higher heating value (Gross calorific value)
Quantity of heat liberated by the complete combustion of a unit volume or weight of a fuel in the determination of which the water produced is assumed completely condensed and the heat recovered.
Level of energy dependency Quotient of net energy imported and the total amount of energy consumed within a given geographical or economic unit, for a given time period, e.g. one year. It is also possible to calculate this ratio for a specific energy source. It is also possible to work out the level of energy independence, which is the quotient of primary energy production divided by total energy consumption within a geographic or economic unit. This gives a rough indication of the coverage of needs by primary energy production. a) These two levels are not complementary in that changes in stocks may mean that the two percentages, when added together, do not equal 100%. b) When a country is a net exporter of energy, the level of energy dependency may be negative.
Lower heating value (net calorific Quantity of heat liberated by the complete combustion of a unit

26
value) volume or weight of a fuel in the determination of which the water produced is assumed to remain as a vapour and the heat not recovered.
Micro-grid A group of power generators, connected with intelligent switchgear and remote controls to supply the electricity demands of local users. A typical micro-grid might have an output of about 10 MW.
Micro-turbine A small turbine-engine powered electric generation plant. Like the larger gas turbine used in major power generating facilities, micro-turbines also have one moving part: the turbine shaft. Micro-turbines are very low maintenance, efficient, fairly quiet and come in various outputs ranging from 30kW to 75 kW. Micro-turbines can run on numerous fuels and can also be linked together to provide outputs of several megawatts.
Net energy of an energy-producing installation
The gain in energy obtained from an energy-production installation during an assumed lifespan; in other words, the amount of energy produced during that period, all the energy required for the construction, operation and subsequent dismantling of the installation.
Performance of consumer equipment The ratio of the useful energy produced by the consumer equipment to the energy supplied to it. Note: A distinction is made between theoretical performance in set conditions and actual performance in real conditions. The second level of performance is generally lower than the first.
Photovoltaic(s) (PVs) Pertains to the direct conversion of light into electricity. Photovoltaic cell Component commonly called a solar cell that can convert light
energy into electrical energy. Cells can be combined to form an array to provide greater overall output.
Pollutant Any physical or chemical characteristic or material present in environmental media (air, water, soil), emitted either by human activities or by natural processes, and adversely affecting man or the environment.
Photovoltaic module A number of photovoltaic cells electrically interconnected in either series or parallel and mounted together, usually in a sealed unit of convenient size for shipping, handling and assembling into panels and/or arrays. The term “module” is often used interchangeably with the term “panel”.
Uninterruptible power supply (UPS) A device that supplies back-up power to electronic equipment. When an electrical surge, sag or outage is sensed, can instantly switch from grid-supplied power to a back-up power supply such as a battery. The end result is a constant, clean supply of power to the end-using equipment. UPS’s come in sizes ranging from units that can supply a couple of hundred watts to a laptop, to units that supply megawatts of power to entire data centres.
NOTES:
1. Own consumption by energy industries: The consumption of self-produced and of purchased energy by energy producers and transformers in operating their installations, (e.g. heating, light).

27
Note: For hydraulic pumping, the balance resulting from pumping (difference between electricity produced and electricity consumed for pumping) is generally ascribed to the consumption by the electricity sector; the consumption by auxiliaries is included in this entry.
2. Gross National Product (GNP): Total productions of goods and services by the subject of a country
at home and abroad. In national income accounting, it is a measure of the performance of nation’s economy, within a specific accounting period (usually a year). 2.1 The concepts and measuring relevance are increasingly being brought into question because, as
a monetary measure, many welfare transactions are not taken into account (such as the shadow economy, exchange of goods or services, household work).
2.2 As a rule the GNP is simultaneously drawn up and presented in three aspects: its formation,
distribution, and consumption. 2.3 The nominal GNP (market price) is fundamentally distinguished from the real GNP (prices of
the base year), with the sole purpose of recording the quantitative changes.
Equivalences Typical reference values 1 kWh = 0,860 Mcal 1 cal = 4,1868 Joules 1 tonne of Oil = 10 000 Mcal 1 tonne of Coal = 7 000 Mcal 1 tonne of Natural Gas = 10 790 Mcal
Heat equivalent of 1 kWh 1 kWh = 86 gram Oil equivalent 1 kWh = 123 gram Coal equivalent 1 kWh = 79.7 gram Natural Gas equivalent
Electricity equivalent of 1 tonne of Fuel 1 tonne of Oil <> 11 628 kWh 1 tonne of Coal <> 8 140 kWh 1 tonne of Natural Gas <> 12 547 kWh
Note: The unit “toe” (tonne of oil equivalent) is commonly used to compare the energy content of different fuels.

28
References [1] World Energy Council: Energy Dictionary – 1992 [2] Sears and Zemansky’s – University Physics with Modern Physics. Young & Freedman –Tenth edition - 2000 [3] Waste to Energy in the Great Lisbon. Armando Manuel de Jesus Branco. The International UIE/EDP Conference “Electricity for a sustainable urban development” – Lisbon 1/4November 2000 [4] The trend and the Benefits of Multi-Energy Services for a New Generation of Industrial and Commercial Customers. Ben Banerjee, Arshad Mansoor, Art Mannion. The International UIE/EDP Conference “Electricity for a sustainable urban development” – Lisbon 1/4November 2000 [5] National Strategies for Management of Fluctuations in Wind Power and CHP .The case of Denmark. Henrik Lund. The International UIE/EDP Conference “Electricity for a sustainable urban development” – Lisbon 1/4November 2000 [6] Roof-and facade integration of PV systems in a laboratory building, renovation of the ECN building 31 with PV. Tjerk Reijenga and Henk Kaan. The International UIE/EDP Conference “Electricity for a sustainable urban development” – Lisbon 1/4November 2000 [7] Hybrid distributed generation systems using renewable. Energy sources to enhance fuel cell technologies. Annette Von Jouanne, Alan Wallace, Alexandre Yokochi. The International UIE/EDP Conference “Electricity for a sustainable urban development” – Lisbon 1/4November 2000 [8] The value of micro-generation in liberalised electricity markets. Andrew Wright. The International UIE/EDP Conference “Electricity for a sustainable urban development” – Lisbon 1/4November 2000 [9] 2001-Annual Energy Review, January 2002 – European Commission [9] [10] Parques Eólicos em Portugal: da ideia à realização . Jorge A Gil Saraiva – Revista Energia Solar Jan/Jun96 [11] Energia Nuclear. Mitos e Realidades. Jaime Oliveira e Eduardo Martinho - Edição de O MIRANTE 2000 [12] Photovoltaic Technologies and Their Future Potential (A Thermie Programme Action – For the Commission of the European Communities. Directorate-General XVII for Energy 1993) [13] Les photopiles en quête de punch. Sylvain Le Gall. – Sciency&Vie –Mars 2001 [14] Le Gaz naturel remonte le courant. Jean Bernard. - Sciency&Vie –Mars 2001 [15] Energy from Biomass, Principles and Applications (A Thermie Programme Action – European Commission. Directorate-General for Energy DGXVII) [16] L’hydrogène tombera-t-il pile? Riadh Elloumi et Nicolas Forget – Sciency&Vie –Mars 2001 [17] Renewable Energy The federal Minister for Research and Technology (BMFT) - Bonn, Dec 1992

29
[18] New Renewable Energy Norwegian Developments, July 1998 [19] Dicionário de Terminologia Energética APE (Associação Portuguesa de Energia ) 3ª edição , 2001 [20]”A new unit for Finland” by Risto Tarjanne and Sauli Rissanen – Nuclear Enginnering International – January 2001 [21]”Boiling Point” by James Luckey –Energy Markets –November 2000 [22]”Photovoltaics: technology overview” – M.ª Green – Energy Policy – November 2000 (Special Issue “The viability of Solar Photovoltaics”) [23]”Keynote Address on Technology Innovation in a Competitive Environment”, Richard E. Balzhiser – Electric Power Research Institute (Conference IEA/EDF/UNIPEDE “New Electricity 21: Designing a Sustainable Electric System for the Twenty-First Century” – Paris 22/24 May 1995) [24]”Rapporteur’s Report on Workshop 3: Power Producers and Global Climate Change Issues” Jeffrey Skeer –International Energy Agency (Conference IEA/EDF/UNIPEDE “New Electricity 21: Designing a Sustainable Electric System for the Twenty-First Century” – Paris 22/24 May 1995) [25]Global Warming Reduction Through Generation Efficiency Improvements, A.F.Armor-Fossil Power Plants and G.T.Preston-Electric Power Research Institute (Conference IEA/EDF/UNIPEDE “New Electricity 21: Designing a Sustainable Electric System for the Twenty-First Century” – Paris 22/24 May 1995) [26] “The contribution of Energy efficiency and Renewables to the reduction of CO2 Emissions” –José António Paredes and Ignacio Mateo –Union Eléctrica Fenosa (Conference IEA/EDF/UNIPEDE “New Electricity 21: Designing a Sustainable Electric System for the Twenty-First Century” – Paris 22/24 May 1995) [27] “Biomass for Electricity” – P.Barlucci, G.Neri and G.Trebbi – ENEL (Conference IEA/EDF/UNIPEDE “New Electricity 21: Designing a Sustainable Electric System for the Twenty-First Century” – Paris 22/24 May 1995) [28] “Overview of current and future Clean Coal Technologies: A utility point of view” –Alain Darthenay -EDF (Conference IEA/EDF/UNIPEDE “New Electricity 21: Designing a Sustainable Electric System for the Twenty-First Century” – Paris 22/24 May 1995) [29] “Competitive Energy Markets: The Effective Route to improving the Environment” – Dr D.J. Swinden – UK (Conference IEA/EDF/UNIPEDE “New Electricity 21: Designing a Sustainable Electric System for the Twenty-First Century” – Paris 22/24 May 1995) [30] Schroder Salomon Smith Barney “The new Electric Economy. Powering the future”- May 2001 [31] Arthur D. Little White Paper “Reliability and Distributed Generation” – 2000 [32] www.hexis.ch [33] W.A.Benesch “Planning New Coal-fired Power Plants” – VGB PowerTech, June 2001

30
[34] K.Huttenhofer , A.Lezuo “ Cogeneration Power Plant Concepts Using Advanced Gas Turbines” –VGB PowerTech, June 2001 [35] Susan M Schoenung “MPS Review Energy Storage. The long and short of it” – May2001 Modern Power Systems [36] Gas turbine World Handbook, 2000/2001 [37] Mainz-Wiesbaden “GUD” plant (“GUD” – Gas and Steam/Siemens) [38] Nordjyllandsvaerket [39] Puertollano