Efficacy of Ultraviolet Light and Antimicrobials to … · performed and suspect colonies were...
129
Efficacy of Ultraviolet Light and Antimicrobials to Reduce Listeria monocytogenes in Chill Brines By Priti P. Parikh Dissertation submitted to the faculty of the Virginia Polytechnic Institute and State University in partial fulfillment of the requirements for the degree of Doctor of Philosophy in Food Science and Technology Approved: Robert C. Williams, Chair Kumar Mallikarjunan Joseph D. Eifert Joseph E. Marcy November 1, 2007 Blacksburg, Virginia Keywords: Listeria monocytogenes, ultraviolet light, brine, citric acid, dimethyl dicarbonate, hydrogen peroxide Copyright 2007, Priti Parikh
Transcript of Efficacy of Ultraviolet Light and Antimicrobials to … · performed and suspect colonies were...

Efficacy of Ultraviolet Light and Antimicrobials to Reduce Listeria monocytogenes in Chill Brines
By
Priti P. Parikh
Dissertation submitted to the faculty of the Virginia Polytechnic Institute and State University in partial fulfillment of the requirements for the degree of
Doctor of Philosophy in
Food Science and Technology
Approved: Robert C. Williams, Chair Kumar Mallikarjunan Joseph D. Eifert Joseph E. Marcy
November 1, 2007 Blacksburg, Virginia
Keywords: Listeria monocytogenes, ultraviolet light, brine, citric acid, dimethyl dicarbonate, hydrogen peroxide
Copyright 2007, Priti Parikh

Efficacy of Ultraviolet Light and Antimicrobials to Reduce Listeria monocytogenes in Chill Brines
by Priti P. Parikh
ABSTRACT
Chill brines used in ready-to-eat meat processing may be an important source of post-
processing contamination by Listeria monocytogenes. The purpose of this study was to
determine the efficacy of ultraviolet light (UV) in combination with antimicrobials to reduce L.
monocytogenes in fresh and used chill brines. Three different antimicrobials were used in
combination with UV; citric acid (CA, 0.2 and 0.5%), dimethyl dicarbonate (DMDC, 250 and
500 ppm), and hydrogen peroxide (HP, 2000 and 4000 ppm).
For fresh brine studies, brine (8.0% w/v NaCl) was prepared and inoculated with a
cocktail of three L. monocytogenes strains (approximately 6 log CFU/mL). Brine was treated
with UV alone, antimicrobials alone, and combination of UV and antimicrobials. Moreover, to
observe the effect of treatment temperature and brine circulation through the UV system on
survival of listeriae cells, inoculated brine was circulated through the system without any
treatment that served as control for all the treatments. For UV treatment, inoculated brine
solution was exposed to UV in an Ultraviolet Water Treatment Unit (Model: AMD 150B/1/2T
D; Aquionics Inc., Peak output: 254 nm) fitted with an inline chiller to maintain brine
temperature of -1°C. Samples were withdrawn at regular intervals for 120 minutes. When L.
monocytogenes population was no longer detectable via direct plating on MOX, enrichment was
performed and suspect colonies were confirmed using API-Listeria. For antimicrobial-only (i.e.,
no UV) treatments, a specific concentration of antimicrobial was added in inoculated brine and
samples were taken for 120 minutes. For the brine that received combination of UV and

iii
antimicrobial treatments, UV was turned on once a specific concentration of antimicrobial was
added in inoculated brine and samples were withdrawn at regular intervals for 120 minutes.
When treated with UV alone, L. monocytogenes population decreased from
approximately 6 log CFU/mL to below the detection limit (i.e., 1 log CFU/mL) in 15 minutes
with the reduction rate of 0.87 log CFU/mL per minute. However, cells were detectable by
enrichment through 120 minutes. The highest rate of decline (0.90 log CFU/mL per minute) was
achieved by the combination of UV and 500 ppm DMDC (UV+500 ppm DMDC), which was
not significantly different from the reduction rates of UV and UV+0.5% CA. UV+500 ppm
DMDC reduced L. monocytogenes to the detection limit in 15 minutes and the organism was not
detected by enrichment after 60 minutes. Though the reduction rate of UV+0.5% CA was not
significantly lower than the rate of UV+500 ppm DMDC (P>0.05), the former treatment resulted
in non-detectable levels more quickly (45 minutes) than the latter (60 minutes). Thus, based on
enrichment studies UV+0.5% CA was the most effective treatment in reducing the population of
L. monocytogenes in fresh brine. Moreover, when brine was treated with 0.5% CA alone the
population decreased to below detection limit in 15 minutes with the rate significantly lower than
UV+500 ppm DMDC and UV+0.5% CA (P<0.05). However, L. monocytogenes was not
detectable by enrichment from 60 minutes. To summarize, through enrichment studies we
observed that UV+0.5% CA, UV+500 DMDC, and 0.5% CA Control were more effective than
other treatments in reducing the listeriae population to a non-detectable level.
Spent brine is recycled brine that was obtained from a frankfurter processor after its
maximum usage. Results of spent brine studies showed that when brine was treated with
UV+4000 ppm HP and UV+2000 ppm HP, L. monocytogenes population decreased to the
detection limit in 45 minutes and was not detected by enrichment from 120 minutes. These

iv
treatments were observed to be the most effective treatments with a reduction rate of 0.12 log
CFU/mL per minute. The reduction rate of some other treatments such as, UV+250 and 500
ppm DMDC, UV+0.2% and 0.5% CA, and UV alone was not significantly different from
UV+4000 and 2000 ppm HP. However, the population was detected through enrichment up to
120 minutes in all other treatments.
The results of these studies indicate that combinations of UV and antimicrobial may be
more effective than either treatment alone (except 0.5% CA treatment) to process fresh chill
brines. However, the antimicrobials and UV were less effective for controlling L. monocytgoenes
in spent brine; presumably due to the presence of organic matter.

v
ATTRIBUTION
Author Priti Parikh is the major contributor and writer of the manuscripts in chapter four and
chapter five of this dissertation. Co-authors Dr. Robert Williams, Ph.D., Food Science,
University of Tennesse, 2001, Committee Chair, and Prof. Joseph Marcy, Ph.D., Food Science
and Technology, North Carolina State University, 1980; Joseph Eifert, Ph.D., Food Science,
Virginia Tech, 1994; Kumar Mallikarjunan, Ph.D., Biological Engineering, University of
Guelph, 1993, Committee members, provided advice, supervision, funding, and laboratory
support.
Parikh, Williams, Marcy and Eifert are with Dept. of Food Science and Technology, Virginia
Tech, Blacksburg, VA 24061 and Mallikarjunan is with Dept. of Biological Systems
Engineering, Virginia Tech, Blacksburg, VA 24061.

vi
DEDICATION
I dedicate this dissertation to my parents
Drs. Kishor and Ranjan Shastri, and
my wonderful husband, Dr. Pratik Parikh

vii
ACKNOWLEDGEMENTS
I joined the Department of Food Science and Technology (FST) at Virginia Tech in
Spring 2005. It might not be a long time for me being in this wonderful department, but a lot of
things have happened in this short time. I initially was enrolled in the Masters program at FST
and then changed my status from M.S. to Ph.D. after a year. There are many people who helped
me take that decision and I would always be grateful to all of them. So let me take this
opportunity to thank everyone who directly or indirectly helped me fulfill my dream.
First, I would like to express my deepest gratitude to my major professor Dr. Robert
Williams without whom I would have never thought of pursuing a Ph.D. degree. He showed
more confidence in me than I had when I was given an option of joining a Ph.D. program. He
was always there to help me when I was confused whether it was in research or in life. I truly
enjoyed the times when he would try to learn my language (Gujarati/Hindi) and then experiment
it with Joell. He has been a great mentor who would not only give you a freedom or flexibility in
terms of work, but also would support you and make you laugh whenever needed. I also thank
my committee members, Dr. Eifert, Dr. Marcy, and Dr. Mallikarjunan who supported me and
guided me whenever needed. I specially thank Dr. O’Keefe who was always willing to help me
with some random chemistry questions and let me use his laboratory whenever I needed.
I truly thank Joell and Walter for everything they did for me. Had Joell not helped me, I
would have not received my spent brine along with other lab supplies and without Walter I could
have not run the UV machine. So without their support I could have not finished my degree on
time. I also thank Govind and Leslie for all their help with media preparation and cleaning the
UV system that I used. Many thanks to all the graduate students at FST who made my tough
journey so pleasant. Very special thanks to my close friend and roommate, Supriya

viii
Ratnaparkhe, who took care of me as an elder sister during the last (but crucial) year of my
journey. I remember that during my prelims she did all the household work and cooking so that I
get enough time to study. I will never forget this wonderful person who used to make me laugh
like anything, especially when I was stressed with my work.
I also thank my parents (Drs. Kishor and Ranjan Shastri), parents-in-laws (Dr. Jitesh
Parikh and Smita Parikh), brother, sister, brother-in-laws, uncle, and ant for their moral support
and all the prayers. Their blessings and prayers have helped me thrive in many discouraging
moments. I truly realized the value of my “family” when I left India, my country. But I am glad
that my beloved husband, Dr. Pratik Parikh, was always with me whenever I needed him. He is
one of the most important persons in my life. He not only showed me the other side of the
world, but also different face of life! He gave me new, but exciting life. I am glad that up on
graduation I am going to join him again in Atlanta (after a year of separation due to education)
and continue enjoying this exciting life with him forever!

ix
TABLE OF CONTENTS
ABSTRACT.................................................................................................................................... ii ATTRIBUTION...............................................................................................................................v ACKNOWLEDGEMENTS.......................................................................................................... vii LIST OF TABLES......................................................................................................................... xi LIST OF FIGURES ...................................................................................................................... xii INTRODUCTION ...........................................................................................................................1 PROBLEM STATEMENT..............................................................................................................6 LITERATURE REVIEW ..............................................................................................................11 A. Listeria monocytogenes .......................................................................................................11 Characteristics of the Organism............................................................................................11 Characteristics of the Disease ...............................................................................................12 Foodborne outbreaks.............................................................................................................12 Susceptibility to Various Environmental Conditions ...........................................................14 Contamination of Ready-to-Eat (RTE) Products..................................................................17
B. Ultraviolet radiation ..............................................................................................................20 Effect of UV on microorganisms..........................................................................................20 Efficacy and Applications.....................................................................................................22 UV Inactivation of Listeria monocytogenes .........................................................................23
C. Chemical Preservatives.........................................................................................................25 Citric Acid (CA) ...................................................................................................................25 Dimethyl Dicarbonate (DMDC) ...........................................................................................27 Hydrogen Peroxide (HP).......................................................................................................28
REFERENCES ..............................................................................................................................31 EFFICACY OF UV AND ANTIMICROBIALS IN REDUCING THE NUMBER OF LISTERIA MONOCYTOGENES IN FRESH CHILL BRINE.........................................................................47 ABSTRACT...............................................................................................................................48 INTRODUCTION .....................................................................................................................49 MATERIALS AND METHODS...............................................................................................51 RESULTS ..................................................................................................................................58 REFERENCES ..........................................................................................................................66

x
REDUCING THE NUMBER OF LISTERIA MONOCYTOGENES IN RECYCLED SPENT CHILL BRINE USING ULTRAVIOLET LIGHT AND ANTIMICROBIALS...........................74 ABSTRACT...............................................................................................................................75 MATERIALS AND METHODS...............................................................................................79 RESULTS ..................................................................................................................................86 DISCUSSION............................................................................................................................88 REFERENCES ..........................................................................................................................92
CONCLUSION............................................................................................................................100 FUTURE WORK.........................................................................................................................102 APPENDIX A: REGRESSION ANALYSES ............................................................................104 VITA............................................................................................................................................117

xi
LIST OF TABLES
Literature Review
TABLE 1: Most Commonly Recognized Foodborne Pathogens…………………………………1 TABLE 2: USDA Regulations for Recycled Brines (USDA)……………………………………9 TABLE 3: Monitoring of the Recycled Brine Solution Used for Cooked Products (USDA)……9 TABLE 4: Monitoring of the Recycled Brine Solution Used for Raw or Heat-Treated, Raw Not Fully Cooked Products (USDA)…………………………………………………………………10
Results
TABLE 4.1: Fate of Listeria monocytogenes during Ultraviolet Light Treatment of Fresh Brine Containing Citric Acid (0.2 and 0.5%), Dimethyl Dicarbonate (250 and 500ppm), and Hydrogen Peroxide (2000 and 4000ppm) in a Recirculating Brine Chiller System………………………...70 TABLE 5.2: Listeria monocytogenes Inactivation during Ultraviolet Light Treatment of Spent/Used Brine Containing Citric Acid (0.2 and 0.5%), Dimethyl Dicarbonate (250 and 500ppm), and Hydrogen Peroxide (2000 and 4000ppm) in a Recirculating Brine Chiller System……………………………………………………………………………………………96

xii
LIST OF FIGURES
Literature Review
FIGURE 1: Meat and poultry recalls due to L. monocytogenes………………………………...13
FIGURE 2: Electromagnetic Spectrum…………………………………………………………21
Materials and Method
FIGURES 4.1 and 5.1: Ultra-Violet Water Treatment Unit (Aquionics Inc., Erlanger, KY)..........................................................................................................................................53, 82
Results
FIGURE 4.2: Inactivation of Listeria monocytogenes through UV alone and combination of UV with DMDC (250 and 500 ppm) treatments in Fresh Brine……………………………………..71 FIGURE 4.3: Inactivation of Listeria monocytogenes through UV alone and combination of UV with CA (0.2 and 0.5%) treatments in Fresh Brine………………………………………………72 FIGURE 4.4: Inactivation of Listeria monocytogenes through UV alone and combination of UV with HP (2000 and 4000 ppm) treatments in Fresh Brine……………………………………….73 FIGURE 5.2: Inactivation of Listeria monocytogenes through UV alone and combination of UV with HP (2000 and 4000 ppm) treatments in Spent Brine……………………………………….97
FIGURE 5.3: Inactivation of Listeria monocytogenes through UV alone and combination of UV with CA (0.2 and 0.5%) treatments in Spent Brine………………………………………….98 FIGURE 5.4: Inactivation of Listeria monocytogenes through UV alone and combination of UV with DMDC (250 and 500 ppm) treatments in Spent Brine……………………………………..99

1
CHAPTER: I
INTRODUCTION
Microbiological safety of foods and foodborne illness are complex issues since there are
more than 200 known diseases that are transmitted through foods. Primary causative agents of
foodborne illness are viruses, bacteria, parasites, microbial toxins, and prions. Table 1 lists some
of the most commonly known foodborne pathogens.
Table 1. Most Commonly Recognized Foodborne Pathogens
Bacteria Virus Parasite Molds
Listeria monocytogenes Norovirus Giardia lamblia Aspergillus spp.
Salmonella spp. Rotavirus Cryptosporidium
parvum
Penicillium spp.
Campylobacter spp. Astrovirus Toxoplasma
gondii
Fusarium spp.
Escherichia coli
O157:H7 Hepatitis A virus Cyclospora
cayetanensis
Staphylococcus aureus Trichinella
spiralis
Clostridium perfringens
The symptoms of these foodborne illnesses range from mild gastroenteritis to life-
threatening neurologic, hepatic, and renal syndromes. Center for Disease Control and Prevention
(CDC) has estimated approximately 76 million illnesses, 325,000 hospitalizations, and 5,000
deaths in the U.S. each year, out of which approximately 14 million illnesses, 60,000
hospitalizations, and 1,800 deaths were due to known foodborne pathogens. Moreover, CDC
recognized Salmonella, Listeria monocytogenes, and Toxoplasma gondii as leading causes of
death since they were responsible for 1,500 deaths each year; i.e., more than 75% of deaths
caused by known pathogens when they accounted for only approximately 11% of total cases of
foodborne illness (58).

2
It is, therefore, mandatory for food processors to implement pathogen reduction strategies
accepted by regulatory agencies, such as U.S. Department of Agriculture (USDA) and Food and
Drug Administrations (FDA), to ensure microbiological safety of foods. There are several
technologies that have been in use in industry to process foods to increase their shelf life and
improve microbial safety of foods.
Traditional Food Processing/Preservation Technologies
Foods are processed using various processing technologies to reduce or remove any
potential pathogen or biological hazard that might be introduced while handling or processing.
Foods can be processed with or without the application of heat. Traditional food processing
technologies, such as pasteurization and heat sterilization, use heat/thermal treatment to kill or
inactivate microbiological contaminant. Pasteurization is relatively a mild heat treatment
technique in which food is heated to a temperature lower than 100°C (32). This process is used
to minimize potential health hazard through destruction of non-spore forming pathogenic micro-
organisms. It also kills 99-99.9% spoilage micro-organisms and inactivates enzymes, in turn
extending the shelf life of a product (60). In contrast, heat sterilization is a severe heat treatment
technique in which foods are heated at sufficiently high temperatures for prolonged time-periods
to destroy microbial and enzyme activity. As a result, sterilized foods are shelf-stable with more
than six months of shelf life (32). A sterilized product may contain a viable spore that cannot
grow due to environmental conditions, such as low pH, low water activity, etc., and still be
commercially sterile (60).
Even with a long history of use of heat in food processing, it has some limitations. Heat
alters or destroys components of foods that are responsible for their individual flavor, color,

3
taste, or texture, and as a result they are perceived to have lower quality and value (32). As
consumers increasingly perceive fresh foods or minimally processed foods as healthier as
compared to heat-treated foods, the industry is now developing alternative processing
technologies. Alternative processing technologies have minimal process-induced changes in
sensory and nutritional characteristics of the foods. Therefore, alternative processing
technologies are now being used to effectively destroy any microbial threat, and to maintain the
quality and storage-stability of foods (1).
Alternative Processing Technologies
Alternative processing technology is also referred to as “non-thermal.” These
technologies include ultra violet light, high pressure processing, irradiation, pulse electric field,
etc. Ultraviolet (UV) energy is a non-ionizing radiation that has germicidal properties at
wavelength ranging from 200-280 nm. This UV range is also referred to as UV-C (10, 50).
Food treated with high pressure processing is exposed to a high hydrostatic pressure up to 1000
MPa for few minutes (39). Gamma radiations and electron beams are commonly known as
ionizing radiations that generate doses of 2-10 kGy (30). Pulsed electric field treatment delivers
pulses at high electric field intensity, 5-55 kV/cm, for a few milliseconds (48).
Among all these technologies, UV-C radiation has the advantage that it does not produce
chemical residues, by-products, and residual effect. Moreover, it is a simple dry and cold
process (5, 61) that is inexpensive and requires very low maintenance as it does not need energy
as a treatment medium (43). The Food and Drug Administration has approved the use of UV
treatment for pathogen reduction in water. The use of UV is a promising bactericidal alternative
for other applications since it does not undesirably affect the color, flavor, odor, or taste of the

4
product (100). Moreover, UV radiation does not produce undesirable by-products and is
effective against a wide spectrum of microorganisms (19). Thus, there is an increasing interest in
using UV-C light for food disinfection due to its advantages over other treatments (83). Since
the UV has a high potential in disinfection of foods at a relatively low cost with several other
advantages, we have considered using UV in this research. However, there a limitation of using
UV-C that is its poor penetration ability. To overcome this UV light source must be placed as
close as possible to the target in the processing system (43).
It is worth noting that most of the alternative processing technologies achieve the
equivalent of pasteurization, but not sterilization (51). Therefore, to improve food safety
antimicrobial agents have been used along with traditional and alternative food processing
technologies.
Antimicrobial Agents
Antimicrobial agents are naturally occurring or artificially developed agents that
have the potential of improving the microbial safety of foods (24). Some of these substances are
organic acids, hydrogen peroxide, dimethyl dicarbonate, nitrites, sodium chloride, sulfites, etc.
Several research studies have shown that the use of antimicrobial agents can improve the
efficacy of food processing technologies that use UV, pulse electric field, heat, or other
antimicrobial agents. For example, Quicho (2005) illustrated that UV in combination with
hydrogen peroxide or dimethyl dicarbonate is an effective treatment for producing a 5-log or
greater reduction of E. coli O157:H7 in apple cider (76). Combination treatments of 3 ppm
ozone with 1% citric acid showed greater antimicrobial effect on indigenous microorganisms in
enoki mushrooms than either 3 ppm ozone or 1% citric acid alone (70). Pol et al. (2000) showed

5
that pulsed-electric field treatment enhances the bactericidal effect of nicin against Bacillus
cereus (74). Phillips and Duggan (2002) showed the synergistic effect of nicin with high
temperature and various concentration of citric acid to reduce the population of A. butzleri in
culture (73). The addition of nisin in combination with sodium lactate significantly enhanced the
effect of sodium lactate against A. butzleri (72). This study also showed that when 500 UV/mL
nisin was added in combination with lactic and citric acid then no viable cells were detected after
30 min incubation; whereas citric acid or lactic acid alone took 7.5 h and 30 h, respectively, to
reach to non-detectable level. Such a combination of two or more treatments used to obtain a
more effective method of food preservation is also referred to as multiple hurdle technology (38).
This research, therefore, mainly focuses on the use of multiple hurdle technology that
combines a non-thermal process, such as UV, with antimicrobials to improve the microbial
safety of food.

6
CHAPTER II
PROBLEM STATEMENT
The Department of Health and Human Services in the United States has launched a
comprehensive, nationwide health promotion and disease prevention agenda named “Healthy
People 2010.” The program objectives are designed to improve the health of all people in the
first ten years of the 21st century. The primary focus areas of the initiative include improved
food safety in the United States and a reduction in the incidence of foodborne diseases caused by
Listeria monocytogenes, Campylobacter, E. coli O157:H7, and Salmonella (62).
Over the last 25 years, listeriosis has been recognized as a major foodborne disease.
Listeriosis is a foodborne disease caused by a Gram positive organism, Listeria monocytogenes.
There are approximately 2000 cases of listeriosis reported every year in the United States, with
approximately 500 fatalities (60). Moreover, the economic burden of listeriosis has been
estimated to be $255 million per year and associated food recalls were estimated to cost $15
million in 1985 through 1987 (8). Even though the statistics show that the incidence of
listeriosis has declined, outbreaks and contaminated product recalls continue to occur (14). It is,
therefore, very important to eliminate this pathogen from foods because of the high risk, fatality
rate, and cost of listeriosis.
L. monocytogenes can be found in a wide variety of raw and processed foods. Milk and
dairy products, various meats and meat products such as beef, pork, fermented sausages, fresh
produce such as radishes, cabbage, seafood and fish products have all been associated with
Listeria contamination. Foods such as soft cheeses, hot dogs and seafood have been implicated
in several outbreaks of human listeriosis (79). L. monocytogenes is a significant problem for the

7
food industries due to its ability to survive and grow under adverse conditions (e.g., low
temperature, pH, water activity, etc.) that are not tolerated by other non-spore forming foodborne
pathogens (60). However, Listeria is not resistant to typical food processes such as cooking,
pasteurization, or drying. So, it is primarily an environmental (i.e., food processing
environmental) contaminant responsible for post-processing contamination of products.
Samelis and Metaxopoulos (1999) studied the occurrence and distribution of listeriae in a
meat processing plant and determined the major sources and routes of contamination. They
isolated L. monocytogenes and other Listeria spp. from 51% and 49% of frozen raw meat
samples that were taken from several incoming lots. As a result, listeriae colonized at certain
processing sites where raw materials were handled and stringent hygienic conditions were not
applied (82). In an extensive review, Tompkin (2002) noted that foods that have been involved
in human listeriosis cases typically contain >1000 CFU/g or mL. Moreover, outbreak strains
typically have become established in the food processing environment and as a result a lot of
food gets contaminated frequently (89). Consequently, L. monocytogenes is predominantly
problematic in ready-to-eat foods; i.e., foods that are not going to be cooked by consumer.
Due to high risk of listeriosis and low infective dose, there is a “zero tolerance” policy for
L. monocytogenes in ready-to-eat (RTE) foods in the U.S. Since this organism can grow at
temperatures as low as 1°C, it poses a serious food safety hazard in refrigerated RTE products.
Among RTE foods, meat and poultry products are the leading vehicles for human listeriosis (47).
RTE meat products, such as frankfurters that have received heat treatment followed by cooling in
brine before packaging, may provide a more favorable environment for growth of L.
monocytogenes because of the decreased competitive micro-flora and high salt tolerance of this
organism (27).

8
Frankfurter processing
Frankfurters are among the most important sausage products in the U.S. Generally, they
are made from finely ground cured beef, pork, turkey and/or chicken that is called a frankfurter
meat emulsion. The emulsion is pumped to a casing that is automatically twisted to form links.
The links are then cooked by passing through hot water or steam and then hung for smoking, or
smoking may precede the final cook (75). During this process, frankfurters are heated to an
internal temperature of 155°F to set the emulsion and produce the desired color (81). The
inability of L. monocytogenes to withstand such a high temperature reduces the risk of its
survival in frankfurters when contamination occurs in the raw ingredients. However, if the
processing environment is contaminated by Listeria, then frankfurters can become contaminated
after processing and provide an adequate pH, water activity, and nutrients for the growth of this
pathogen. In the past, frankfurters have been linked to several outbreaks. It has also been
noticed that sometimes frankfurters are eaten without reheating to a sufficient temperature (16).
There are several phases of frankfurter processing where contamination with Listeria is
more likely. For example, cellulose casing that is used to form the shape of frankfurters is
mechanically peeled off with a knife after cooking, and cooked frankfurters are transferred by
conveyors. So if the knife, conveyor, or any of the packaging materials are contaminated with
Listeria, then cooked RTE frankfurters may be contaminated with this organism (81, 90).
Another potential point in the process where L. monocytogenes contamination may occur
is during product cooling. Chill brine is used to quickly cool thermally processed RTE products
such as frankfurters, deli meats, fish, cheese, etc., or raw products. This treatment provides two
microbiological benefits. First, it assures adequate shelf life by preventing growth of spoilage
microorganisms. Second, it helps improve microbial safety of foods by preventing growth of

9
pathogenic organisms that may survive thermal processing (59). However, products often
introduce heat and nutrients to brine allowing L. monocytogenes and other organisms to survive,
grow, and spread in brines. It has been studied that contamination of frankfurters by L.
monocytogenes can occur during the cooling step when the frankfurters are sprayed with chilled
salt brines before packaging (59). Chill brine is often recycled, which helps reduce the costs of
processors. It is, therefore, very essential to maintain the microbial safety of chill brine
especially when it is recycled. The USDA has set limits for maximum usage of chill brines
based on the type of casing and salinity and temperature of the brine. Under certain conditions
brines may be used for up to four weeks. Table 2 summarizes the required temperature and salt
concentration for recycling of chill brine used for heat treated products (91). USDA also
recommends that food processing industries or establishments perform the ongoing monitoring
of the recycled brine solution, as illustrated in Tables 3 and 4, that is used for cooked and raw or
heat-treated products (91).
Table 2: USDA regulations for recycled chill brines (91) (USDA)
Maintenance Conditions for Brine Used for Heat Treated Products
Duration of Use Minimum salt concentration (%) Maximum temperature
One production shift None None
Up to 24 hours 5 40°F (4.4°C)
Up to 1 week 9 28°F (-2.2°C)
Up to 4 weeks 20 10°F (-12.2°C)
Table 3: Monitoring of the Recycled Brine Solution Used for Cooked Products (USDA)
Analysis Frequency Action level
Total Plate Count Daily > 2500 CFU/mL
Total Coliform Weekly Positive
Fecal Coliform Weekly Positive

10
Table 4: Monitoring of the Recycled Brine Solution Used for Raw or Heat-Treated, Raw
Not Fully Cooked Products (USDA)
Analysis Frequency Action level
Total Plate Count Daily > 5000 CFU/mL
Total Coliform Weekly >10 CFU/mL
Fecal Coliform Weekly Positive
L. monocytogenes can survive and grow at high salt concentration (around 10-12%) and
low temperatures (up to 0°C) and thus chill brine can harbor this organism once contaminated.
Several studies have shown that contamination of RTE products increases after brining and the
most contaminated sites of the processing plant are the brining and post-brining areas (4, 42).
Thus, it is very important to prevent L. monocytogenes survival in brines especially when they
are recycled.
Previous studies have shown that UV is effective for reducing the population of various
microorganisms in brine, water and certain other foods (9, 19, 37, 49, 56, 80, 94, 95).
Antimicrobial agents such as citric acid, hydrogen peroxide, and dimethyl dicarbonate are
effective under certain conditions. Therefore, this study is designed to determine the efficacy of
UV and chemical preservatives for the reduction of L. monocytogenes in chill brines.

11
CHAPTER: III
LITERATURE REVIEW
A. Listeria monocytogenes
Characteristics of the Organism
The genus Listeria comprises six recognized species including, Listeria
monocytogenes, Listeria ivanovii, Listeria innocua, Listeria seeligeri, Listeria welshimeri,
and Listeria grayi. Although all of these species are pshychrotrophic and widely spread in
the environment, only L. monocytogenes, and L. ivanovii are known to be pathogenic. L.
monocytogenes is a human pathogen whereas L. ivanovii is primarily an animal pathogen.
However, the ability to lyse red blood cells differentiates L. monocytogenes from non-
pathogenic Listeria spp.
L. monocytogenes is a Gram-positive, motile, non-spore forming, rod shaped
bacterium. It can multiply at temperatures approximately 0°C and it can survive even at
freezing temperature. It is micro-aerophilic and it can grow in the presence of 10-12%
sodium chloride. Certain strains may grow at water activity as low as 0.90. Heat resistance
of L. monocytogenes increases as the water activity of the food decreases. Therefore, it
creates problems for food manufacturers who use low water activity and heat treatments to
maintain safety (60).

12
Characteristics of the Disease
As mentioned earlier, the disease caused by L. monocytogenes is called listeriosis. In
the US, approximately 2,000 people become seriously ill with listeriosis each year and
around 500 of these people die. L. monocytogenes causes disease in certain high-risk groups
including, pregnant women, neonates, the elderly, and immunocompromised adults.
Occasionally, listeriosis occurs in healthy adults. A person infected with L. monocytogenes
usually shows flu-like symptoms initially; i.e., fever, muscle aches, and sometimes
gastrointestinal symptoms such as nausea or diarrhea. In non-pregnant adults, L.
monocytogenes can also enter in the bloodstream and cause septicemia. If the infection
spreads to the nervous system, then it can cause meningitis and meningoencephalitis. The
mortality rate of Listeria infection is 20-25%. Infected pregnant women generally only
display mild flu-like symptoms. However, infection during pregnancy can lead to
miscarriage, premature delivery, infection of the newborn with serious long-term
consequences, or even stillbirth (31, 60).
Foodborne outbreaks
The first outbreak of Listeria was documented in 1981 in Canada. The source of this
outbreak was coleslaw. Subsequently, many of the Listeria foodborne outbreaks that have
been reported in the US and other countries have been linked to deli turkey meat, coleslaw,
Mexican-style cheese, and soft cheese (60). Moreover, L. monocytogenes has triggered a
number of recalls for poultry and meat products from 1994-2001 (Figure 1).

13
There were 35 Listeria recalls have been reported to USDA FSIS (Food Safety and
Inspection Service) from 2005 to 2006 (92). These recalls were mainly for various fully cooked
chicken products, frozen egg rolls, ready-to-eat meat products, and sausage products. In October
2002, a multistate outbreak of L. monocytogenes infection with 46 culture-confirmed cases,
seven deaths, and three stillbirths or miscarriages was reported in eight northeastern states of the
US. As a result of this outbreak, Pilgrim’s Pride Foods (PA) recalled 27.4 million lbs. of fresh
and frozen ready-to-eat turkey and chicken products (considered as the largest poultry recall in
history) and Jack Lambersky Poultry Company (NJ) recalled around 4.2 million lbs. of fresh and
frozen, ready-to-eat poultry products (13). During October 2000 – January 2001, an outbreak of
listeriosis associated with homemade Mexican-style cheese was reported in North Carolina. In
this outbreak twelve cases were identified including 10 pregnant women and resulted in five
stillbirths, three premature deliveries, and two infected newborns (18). There was also a ten state
outbreak of listeriosis between May and November reported in 2000. Eight perinatal and 21
nonperinatal cases were reported. From early August 1998 to January 1999, at least 50 illnesses
Figure 1: Meat and poultry recalls due to L. monocytogenes from 1994-2001
(data from (35))

14
caused by L. monocytogenes (serotype 4b) were reported by 11 states (17). In 1994 listeriosis
outbreak attributed to contaminated chocolate milk was reported among people who attended a
picnic in Illinois. In this outbreak forty-five people were found who had symptoms that met the
case definition for illness due to L. monocytogenes, and cultures of stool from 11 people yielded
the organism and four persons were hospitalized. The most common symptoms were diarrhea
(present in 79 percent of the cases) and fever (72 percent). The disease causing strain was
isolated from a valve connected to the chocolate milk filler and a drain under the filler (23). In
1985, contaminated Mexican-style cheese caused listeriosis outbreak in California. There were
142 cases reported in eight months (15).
Susceptibility to Various Environmental Conditions
1. Temperature
The optimum temperature for the growth of L. monocytogenes is approximately 30°C,
whereas it can grow at a temperature ranged from 0°C to 45°C. Temperatures higher than 50°C
inactivate this organism and thus, pasteurization or thermal processing of the foods help
eliminate this organism (60).
L. monocytogenes can survive even at freezing temperature and thus creates problems
with frozen foods, although survival and injury during frozen storage depend on the substrate
and the rate of freezing (60). Therefore, it is necessary to control storage temperature to
minimize the growth of this pathogen. Glass and Doyle (1989) showed that L. monocytogenes
can survive on various types of meat products, such as bologna, wieners, sliced chicken and
turkey, and sausages, which are stored at 4.4°C. The growth rate however depends on the type
of product and the highest proliferation was found on poultry products (40). Another study

15
illustrated that 65.6% of Canadian retail wieners inoculated with L. monocytogenes supported the
growth of this pathogen when stored under vacuum at 5°C for up to 28 days (57). However, at
lower temperature the replication of bacteria slows down. Papageorgiou and others reported
generation times of L. monocytogenes ranged from 16.2 to 20.2 h in whey cheeses that were
significantly longer than those observed at 12°C, which ranged from 5.1 to 5.8 h. At 22°C, the
generation time ranged from 1.7 to 2.7 h (68).
2. pH
L. moncytogenes encounters a low pH environment in acidic foods, during gastric
passage, and in the phagosome of the macrophage (38). Like temperature, L. monocytogenes can
grow at a wide range of pH; typically reported as 5.6 – 9.6. Moreover, recent studies show that
the organism can initiate growth in laboratory media at pH values as low as 4.4 (60). This
pathogen responds to and survives at so low pH by utilizing a number of stress adaptation
mechanisms. Exposure of L. monocytogenes to mild acidic pH of 5.5 causes the acid tolerance
response (ATR), wherein the cells are resistant to severe acidic conditions (65). It has been
observed that the minimum pH supporting the growth of L. monocytogenes is dependent upon
the temperature of incubation, available nutrients, moisture content, and composition of the food
product (47). Parish and Higgins (1989) studied the survival of L. monocytogenes strains in
low pH model broth system. They observed growth in the broth at pH 4.5 and higher for all
strains during incubation at 30°C, but not at pH 4.0 or lower (69).

16
3. Salt Concentration
The use of salt to lower the water activity is one of the methods of food preservation used
by food industries. However, the ability of this organism to adapt and survive in high salt
concentrations makes it difficult to control in foods (38). L. monocytogens can grow in the
presence of 10-12% sodium chloride, and it grows to a high population in moderate salt
concentrations (6.5%). This organism can survive for longer periods at higher salt concentration.
And, its survival is significantly increased by lowering the temperature (60). Hudson (1992)
studied the efficacy of high sodium chloride concentrations to destroy the population of L.
monocytogenes and showed that the pathogen would grow at refrigeration temperature when salt
concentration is relatively low (6%). Population could be reduced in the presence of high salt
concentration (26%), but not in practical time periods for use in the food industry (46).
4. Water Activity
The optimum water activity for the growth of L. monocytogenes is ≥ 0.97. For most
strains of L. monocytogenes, the minimum water activity for the growth is 0.90. However, the
organism can survive for longer period of time at water activity values as low as 0.83. Since
thermal resistance of the organism increases with the decreased water activity, great care should
be taken by manufactures that rely on the low water activity and thermal treatment for the
preservation of food products (60).
Tapia de Daza et al. studied the effect of solute and temperature on water activity for
growth of L. monocytogenes strain Scott A and Brie 1. They used glycerol, NaCl, and sucrose to
reduce the water activity of Tryptic Soy Broth (TSB) to 0.90. They observed that both the

17
strains grew well at 30°C in glycerol supplemented TSB, but not in NaCl and sucrose
supplemented TSB. Also, increased effect of all the supplements was observed at 4°C. Thus,
the type of solute and osmotic conditions created by the solute affect the ability of L.
monocytogenes to grow (88).
Contamination of Ready-to-Eat (RTE) Products
Some RTE food products, such as frankfurters, delicatessen meat and poultry products,
and soft cheeses, pose high risk of listeriosis especially for susceptible population. Since 20% of
the refrigerators have temperatures of more than 50°F, it does not ensure the safety of RTE
products. Moreover, L. monocytogenes grow well at refrigeration temperature so this provides
increased risk of listeriosis from RTE foods (60). Therefore, it is very important to prevent any
contamination of RTE products with this organism.
Meat and Poultry Products
Growth of L. monocytogenes in meat and poultry products depends on the type of meat,
pH of the product, and the presence of other bacteria. L. monocytogenes grows better in poultry
than in other meats. It can grow rapidly in meat products, including vacuum-packed beef, at pH
values near 6.0 and little or no growth at pH values around 5.0. Moreover, it is very difficult to
remove or kill this organism once it is attached to the surface of raw meats (60). Therefore great
care should be taken while processing meat and poultry products. There are two primary modes
of contamination of products with L. monocytogenes, through infected animal or bird and post-
processing contamination.
Contamination of animal muscle tissue by L. monocytogenes can be caused in or on the
animal before slaughter. This pathogen concentrates and multiplies in kidney, lymph nodes,

18
liver, and spleen (60). Therefore, organ meat may get contaminated with listeriae cells if the
animal is infected. However, the pathogen is primarily a post-processing contaminant.
Therefore, it is possible to get contaminated finished poultry/meat products even though the birds
or animals were not infected with the organism. L. monocytogenes can enter in the food
processing plant since it is ubiquitous in nature, and contaminate the product through many
routes. Once established in the food-processing environment, this pathogen is very difficult to
remove and it becomes a source of recontamination of processed products. Lin et al. (2006)
studied the cross-contamination between processing equipment and deli meats by L.
monocytogenes. They showed that this organism can be transferred from a contaminated slicer
onto meats and can survive or grow better on uncured oven-roasted turkey than on salami or
bologna with preservatives (54).
Another major source of post-processing contamination of meat products is ‘brine.’
Brine is a recycled medium that is commonly used to cool cooked product and to add flavors.
Since, L. monocytogenes can grow at high salt concentration and low temperature; it can survive
in brines and the brine can be an important source of contamination of finished products.
Moreover, if the product is ready-to-eat, then the contamination can result in an outbreak or
recall. However, USDA has some regulations on reuse of brines as discussed before (Table 1).
Larson et al. reported the survival of L. monocytogenes in commercial cheese brines (5.6-24.7%
NaCl) collected from cheese factories in Wisconsin and northern Illinois at 4 and 12°C (53).
Greer et al. (2004) showed that recycled brines can harbor large population of spoilage bacteria
and L. monocytogenes and are an important source of contamination of moisture-enhanced pork
(42). Being able to control L. monocytogenes in chill brines may further extend their shelf-life,
dramatically reducing the cost of water, salt, brine disposal, and time consumed for replacing

19
batches of brine, without fear of increased pathogen risk (Ye et al., 2001). Gailey and others
(2003) studied the survival of L. monocytogenes in a simulated recirculating brine chiller system
and showed that very few cells were destroyed during the process. However, they also observed
the dilution effect during the study that indicated that if the system is regularly cleaned and
sanitized, then brine chiller system poses little danger of postcooking contamination (36).
Dairy Products
Unpasteurized or raw milk is a source of L. monocytogenes. A listeriosis outbreak in
1985 in California was associated with Mexican-style cheese that was made with unpasteurized
milk (15). Since high temperature kills this pathogen, pasteurization is used to process milk.
However, L. monocytogenes grows more rapidly in pasteurized milk than in raw milk at 7°C and
therefore post-process contamination is a major concern. Temperature abuse can then increase
listeria growth (60). In an outbreak associated with contaminated chocolate milk in Illinois,
listeria population increased to 109 CFU/mL. This gave the milk an off flavor, but people still
drank it (23).
Among dairy products, L. monocytogenes has also been associated with a variety of
cheeses. It can survive cheese manufacturing and ripening because of its resistance to low
temperature and high salt concentration. This organism concentrates in cheese curd during
manufacturing. However, the behavior of listeriae in the curd is influenced by the type of
cheese. For example, “during cheese ripening, L. monocytogenes can grow in Camembert
cheese, die gradually in Cheddar or Colby cheeses, or decrease rapidly during early ripening and
then stabilize in blue cheese” (60).

20
Seafood
L. monocytogenes has been isolated from fresh, frozen, and processed seafood products,
such as crustaceans, molluscan shellfish, and finfish (60). Gombas et al. studied the prevalence
of L. monocytogenes in RTE foods and observed that prevalence rate of seafood salads (4.7%)
and smoked seafood (4.3%) was highest among all the RTE products tested. Higher prevalence
rate, such as 7.3% (64) and 79% (28) was found in the U.S. for smoked fish that were obtained
from processing plants. Seafood that may pose high risk of listeriosis include, mollusks (such as
mussels, clams, and oysters), raw fish, lightly preserved fish products (such as salted, marinated,
fermented, and cold-smoked fish), and mildly heat-processed fish products and crustaceans (60).
B. Ultraviolet radiation
Effect of UV on microorganisms
UV processing includes the use of radiation from the ultraviolet region of the
electromagnetic spectrum to kill microorganisms. The wavelength for UV ranges from 100-400
nm (Figure 2).
This range is again divided into UV-A (from 315-400 nm), UV-B (from 280-315 nm),
UV-C (from 200-280 nm), and vacuum UV range. In general, the wavelength between 220 and
300 nm is considered germicidal against wide variety of microorganisms such as bacteria, virus,
protozoa, molds, yeast, and algae (10, 61, 85). However, the highest germicidal effect is obtained
between 250 to 270 nm and it decreases as the wavelength increases (5). Therefore, UVC at
wavelength of 254 nm, which is generated by low pressure mercury lamps, is used for
disinfection of surfaces, water, and foods. UV light has different penetration capacity in

21
different physical media. Therefore, bacteria suspended in air are more sensitive to UV-C light
than in liquid (10).
UV-C inactivates organisms mainly by DNA damage. DNA of microorganisms absorbs
the UVC that causes cross-linking between neighboring pyrimidine nucleoside bases (thymine
and cytosine) in the same DNA strand. And thus, DNA transcription and replication cease,
leading to cell death (60, 93). In addition, UV radiation cross-links aromatic amino acids at their
carbon–carbon double bonds. The resulting denaturation of proteins contributes to membrane
depolarization and abnormal ionic flow (51). UV inactivation of microorganisms is mainly
dependent on the UV dose and not the intensity of the light. Thus, low UV radiation intensity for
long exposure time would give the similar effect as high intensity for a short time (61). The UV
dose is usually measured in ‘mJ/cm2’ or ‘J/m2.’ Generally, the UV dose required to inactivate
viruses and molds is much higher than for bacteria. However, resistance of bacteria varies with
Figure 2: Electromagnetic Spectrum (43)

22
species and it also depends on their physical state (e.g., whether they are in the form of spores or
vegetative cells, and age). Spores are more resistant to UV than vegetative cells. Moreover,
vegetative cells are more resistant to UV just prior to active cell division, during lag phase. It
has also been found that microbial resistance to UV radiation increases in absence of oxygen (60,
93).
Efficacy and Applications
As mentioned earlier, the major limitation of using UV for foods is its inability to
penetrate. UV-C cannot penetrate deeply into solid foods rather it acts only on the surface and
has limited ability to penetrate in liquids. The penetration depth of UV-C in liquid media is very
short with the exception of a clear water (84). Therefore, to eliminate the same number of
organisms the required UV dose is different in agar medium and foods (87). The penetration of
UV light into juices is about 1 mm for the absorption of 90% of the light and so a turbulent flow
during liquid food processing is recommended (44). The penetration ability of UV-C light
depends on the type of liquid, soluble solids and suspended matter present in the liquid, and UV-
C absorption capacity of the liquid. Large suspended particles may also block the incidence of
light on the microbial load (10, 84).
UV light has been used to inactivate various microorganisms in different foods.
Exposure of shell eggs to UV light (254 nm) at 4350 µW/cm2 for 15 min reduced the aerobic
microbial population by 3 log units (50). Moreover, studies have shown that UV exposure does
not negatively affect the quality of the product (55). UV has been used as an alternative to
chlorine to disinfect drinking water and has shown effectiveness against a variety of
microorganisms (19). It has also been used to disinfect air and surfaces in hospitals and research
laboratories where aseptic environments are required. Moreover, in recent years, UV has been

23
used to treat packaging materials for aseptic packaging and to process juices (93). Warriner and
others (2000) demonstrated that UV inactivates the spores of Bacillus subtilis on packaging
surfaces. A number of studies have been done on use of UV to process various food products
(95). Rodriguez and Yousef (2005) inactivated Salmonella enterica serovar Enteritidis present
on shell eggs by UV radiation and ozone (80). Studies by Marquenie and others (2002) showed
that fungal growth on strawberries was significantly retarded using UVC dose of 0.05 J/cm2 and
higher (56). Wright and others examined the efficacy of UV light (254 nm) for reducing the
population of E. coli O157:H7 in unpasteurized cider. They observed that UV was effective in
reduction of this pathogen, but the dosages used in this study were not adequate to achieve the
required 5-log reduction (97). UV-C (253.7 nm) has also been effective in inactivating certain
foodborne pathogens such as Salmonella spp. and E. coli O157:H7 on fresh produce and fruits
(98) and on agar surfaces (99) at different dosage level. Harrington and Hills (1968) obtained
2.67 log reduction in total count by processing apple cider with UV and observed a good quality
shelf life during 35 days at 2.2°C (45). When a thin film of orange juice was treated with UV
system at 214.2 W/m2, the orange juice doubled the shelf life without changes in color and taste
(29).
UV Inactivation of Listeria monocytogenes
Very little research has addressed inactivation of L. monocytogenes by UV. Ozer and
Demirci (2006) studied the efficacy of pulsed UV-light to inactivate L. monocytogenes and E.
coli O157:H7 on raw salmon fillets. They demonstrated that about one log reduction of E. coli
O157:H7 or L. monocytogenes could be achieved with 60 second treatment at 8 cm distance
without affecting the quality of the product (66). Guerrero-Beltran and Barbosa-Canovas (2005)
studied the efficacy of UV in reducing the population of Saccharomyces cerevisiae, E. coli, and

24
L. monocytogenes in apple juice. They used double tube UV disinfection treatment in this study.
They found that S. cerevisiae was more resistant to the UV light treatment because the Duv
values were higher than that for L. innocua or E. coli. The log reduction obtained in this study
after 30 min of UV treatment was 1.34 ± 0.35, 4.29 ± 2.34 and 5.10 ± 1.12 for S. cerevisiae,
L.innocua and E. coli, respectively, at the highest flow rate (0.548 L/min). High microbial
reduction was also observed when a mixture of microorganisms was inoculated instead of
inoculating separately (44). Gailunas et al. (2003) showed that UV reduced the number of L.
monocytogenes by around 4.6 and 4.5 log in 7.9% w/w and 13.2% w/w brine, respectively.
Moreover, the temperature of the brine was increased by an average of 15.5°C in this study
where the initial average temperature of the brines was 10.3°C (37). A study by Kim and others
(2002) showed that UV irradiation was effective in reducing the number of selected pathogens
(e.g., L. monocytogenes, Salmonella Typhimurium, and Escherichia coli O157:H7) in peptone
water and on the surface of stainless steel chip. However, UV did not significantly reduce
pathogens inoculated on chicken meat surfaces with or without skin. Another study by Bintsis et
al. (2000) showed that long-wave UV light (UVA~365 nm) with the intensity of 45 W/m2 along
with psoralen (5 mg/l) was active against L. innocua (that was chosen as a surrogate L.
monocytogenes) in a physiologically neutral solution. Around 99.8% reduction was found over
the exposure of 60 seconds in laboratory trials in this study. Short-wave UV (100 µW/cm2)
decreased the number of L. monocytogenes on Tryptose Agar (TA) by seven orders of magnitude
in 4 minutes Moreover, age of the culture (48 vs. 24 hours) did not alter the sensitivity of
Listeria to this UV treatment (100).

25
C. Chemical Preservatives
Earlier chemical preservatives were used only for food preservation. However, within
the last several years interest in using chemicals as antimicrobial agents against foodborne
pathogens has increased. Organic acids and fatty acid esters, dimethyl dicarbonate, nitrites,
sulfites, etc. are some common chemical antimicrobial agents.
Citric Acid (CA)
There are various parameters that govern the survival and growth of microorganisms in
food. The acidity or pH of the food can affect the type and number of microorganism present in
a product. Thus, altering the pH or hydrogen ion concentration of food can lead to growth or
inhibition of an organism (26). Moreover, incorporation of acids into a food can shorten the
thermal process time of foods that are particularly sensitive to changes in sensory qualities, such
as texture or appearance. For example, okra, canned in brine containing acetic, citric, lactic,
malic, or tartaric acid to achieve an equilibrium pH of 4.3, was processed for 30 minutes in
boiling water. Acidification impaired the color, but enhanced the flavor of canned okra. All
acids would be effective antibotulinal agents at that pH level (63). There are various organic
acids that have been used as an antimicrobial agent in foods. For example, citric acid, acetic
acid, lactic acid, malic acid, etc.
Citric acid is a natural antimicrobial agent with a pleasant sour taste. It is affirmed as
Generally Recognized As Safe (GRAS) as a direct food substance when used in accordance with
good manufacturing practices, in the acid form (21CFR184.1033) and as the calcium (21 CFR
184.1195), potassium (21 CFR 184.1625), or sodium salt (21 CFR 184.1751). it is water highly
soluble and enhances the flavor of citrus-based foods. It is approved for use in ice cream,

26
sherbets and ices, beverages, salad dressings, fruit preserves, and jams and jellies. It is also used
as an acidulant in canned vegetables and dairy products (26).
Antimicrobial Properties of CA
The inhibitory capacity of citric, hydrochloric, acetic, lactic, propionic, and phosphoric
acid was compared in TSB for Yersinia enterocolitica based on concentration of acid, pH, and
degree of dissociation. A comparison of equimolar concentrations illustrated citric acid as the
most antimicrobial, followed by hydrochloric, lactic, phosphoric, propionic, and acetic acid (12).
Inhibition of L. monocytogenes was observed in the trypticase soy yeast extract (TSBYE) when
the pH of the broth was lowered to 4.0 with citric acid (21). Citric acid at the concentration of
0.5% was effective in complete destruction of viable cells of A. butzleri after 8 hour incubation
in Arcobacter selective broth at 30°C (72). Palumbo and Williams (1994) investigated organic
acid dips just prior to packaging as a secondary lethal step to destroy L. monocytogenes and
observed that combination of 2.5% acetic acid and citric acid restricted the growth and
development of L. monocytogenes on frankfurters stored vacuum-packaged at 5°C for up to 90
days (67). Through their studies, Sommers and others (2002) demonstrated that citric acid
enhanced the susceptibility of L. monocytogenes to radiation without compromising frankfurter
color, lipid oxidation, firmness, or antioxidant activity (86). Phelps et al. illustrated that addition
of 3% citric acid to orange juice caused a 2 log CFU/mL reduction in population of L.
monocytogenes within 48 hours at 4°C (71). Fischer et al. (1985) used a multiple-hurdle concept
and equilibrated hard-cooked eggs with 0.5%, 0.75%, or 1% citric acid and 0.2% sodium
benzoate for 30 days at 4°C or in 0.75% citric acid alone for 21 days at 4°C. They observed that
0.75% citric acid was sufficient to reduce inoculated population of Salmonella Typhimurium, Y.
enterocolitica, E. coli, and S. aureus (33).

27
Dimethyl Dicarbonate (DMDC)
Dimethyl dicarbonate (DMDC) is a colorless fruity-smelling liquid with a melting point
of 15.2°C and a boiling point of 123-149°C. It is slightly soluble in water and more soluble in
organic solvents. DMDC can be used as an ‘additive,’ to control microbial population, in
various beverages such as ready-to-drink tea, wine, and carbonated drinks in accordance with
regulations (21CFR172.133). It can be added at a maximum limit of 250 ppm in ready-to-drink
tea and various carbonated and non-carbonated beverages. However, in wines, dealcoholized
wine, and low alcohol wines its limit is 200 ppm. DMDC inactivates enzymes present in the
microbial cells. It is bactericidal at 30-400 µg/mL to a number of species including Acetobacter
pasterurianus, E. coli, Psedumonas aeroginosa, Staphylococcus aureus, various Lactobacillus
species, and Pediococcus cerevisiae (Hartman, 2003). The inactivation of microorganisms by
DMDC is related to the inactivation of the enzymes. Protein modification through reaction of
nucleophilic groups, such as imidazoles, amines, or thiols, can readily occur with the dicarbonate
(41).
Antimicrobial Properties of DMDC
Studies with DMDC are not very extensive. Fisher and Golden (1998) reported that
0.025% DMDC was most efficient at inactivating E. coli O157:H7 (P<0.05) at 4 and 10°C when
apple cider was treated with 0.025% DMDC, 0.045% sodium benzoate, 0.0046% sodium
bisulfite, and combination of the two latter treatments (34). E. coli O157:H7 population was
reduced from 7 log CFU/mL to undetectable levels at 4°C within 72 hours in apple cider and 48
hours in orange juice containing 250 ppm DMDC (52). Soaking cantaloupes for 3 minutes in a
10,000 ppm DMDC reduced the population of Salmonella from 5.01 log CFU/cm2 to
undetectable levels. Salmonella population was detected only by enrichment after a 3-minute

28
treatment with 5000 ppm DMDC (77). DMDC (75 and 150 ppm) was effective in reducing the
population of E. coli O157:H7 in apple cider by more than 6 log CFU/mL after 24 hour (76).
Combination of 500 ppm DMDC with ozone followed by refrigerated storage reduced the
number of E. coli O157:H7 and Salmonella by more than 5 log CFU/mL in apple cider and
orange juice (96). However, the same study showed that this treatment was not effective without
refrigerated storage.
Hydrogen Peroxide (HP)
Hydrogen peroxide is a very pale blue liquid that appears colorless in a dilute solution
and a slightly more viscous than water. It is considered to be GRAS and can be added directly to
certain foods for human consumption as an antimicrobial or bleaching agent (21CFR184.1366).
HP is a known natural disinfectant and preservative, present in milk, honey, and mucous
membranes of the mouth. The most prevalent theory regarding the mechanism of action of HP is
the formation of hydroxyl radicals. The hydroxyl radical is highly reactive with microbial
membrane lipids, DNA, and other cellular component. Another proposed method is that HP
reacts with chloride ions in the cell to produce a hypochlorite ion, a known toxin to microbial
cells, and a further reaction of HP and hypochlorite to form a superoxide. The hypochlorite and
superoxide have similar reactions with the microbial cells as the hydroxyl radical (22).
Antimicrobial Properties of HP
Hydrogen peroxide is active against wide range of organisms including yeast, bacteria,
fungi, viruses, and spores. And thus, one of the major applications of hydrogen peroxide is in
sterilizing containers for aseptic processing of foods; e.g., milk, juice, etc. (11). The addition of
hydrogen peroxide to milk was encouraged in hot climates where temperature, unsanitary

29
practices, and poor refrigeration are likely (25). Dominguez and others (1987) determined the
effect of the addition of hydrogen peroxide on L. monocytogenes present in raw and sterilized
milk. They demonstrated that in sterilized milk, 0.0495% hydrogen peroxide was sufficient to
product complete destruction of L. monocytogenes in 9 hours. However, in raw milk this
organism was less susceptible to hydrogen peroxide than milk micro flora. Bell et al. (1997)
used 1% acetic acid, 3% hydrogen peroxide, and 1% sodium bicarbonate, alone or in
combination, to spray wash beef carcass tissue. They showed that the combination wash of 1%
acetic acid with 3% hydrogen peroxide resulted in the greatest reductions of 3.97 and 3.69 log10
CFU/cm2 for E. coli on lean or adipose tissue, respectively. They also showed that this
combination of spray wash reduced L. innocua by 3.05 log10 CFU/cm2 on lean tissue and 3.52
log10 CFU/cm2 on adipose tissue (7). Lin C-M et al. (2002) studied the combined effect of
hydrogen peroxide with lactic acid and with mild heat against E. coli O157:H7, Salmonella
Enteritidis, and L. monocytogenes on lettuce. They reported that hydrogen peroxide and lactic
acid was effective to reduce population of E. coli O157:H7 and Salmonella Enteritidis by 4 log
CFU/g and of L. monocytogenes by 3 log CFU/g. However, sensory characteristics of lettuce
were compromised with the same treatment. Moreover, they also showed that the treatment of
lettuce with 2% hydrogen peroxide at 50°C for 60 seconds was effective in reducing population
of these pathogens (≤ 4 log of E. coli O157:H7 and Salmonella Enteritidis and 3 log of L.
monocytogenes) and maintaining high product quality. Treatment with 75 and 150 ppm HP in
combination with UV reduced E. coli O157:H7 population by 7.2 and 7.0 log CFU/mL,
respectively, in apple cider after 24 hours of incubation (76). Robbins et al. (2005) illustrated
that 3% HP solution reduced the initial concentration of L. monocytogenes Scott A planktonic
cells by 6.0 log CFU/mL after 10 min of exposure at 20°C, and a 3.5% HP solution reduced the

30
planktonic population by 5.4 and 8.7 log CFU/mL (complete elimination) after 5 and 10 min of
exposure at 20°C, respectively. They also observed that 5% HP reduced the number of cells
grown as biofilms by 4.14-log CFU per chip after 10 min of exposure at 20°C and in a 5.58-log
CFU per chip (i.e., complete elimination) after 15 min of exposure (78).

31
REFERENCES
1. Ahvenainen, R. 1996. New approaches in improving the shelf life of minimally processed
fruit and vegetables. Trends in Food Science & Technology. 7:179-187.
2. Anonymous. 2000. Water Disinfection Methods: A comarison of chlorination, ozone, and
UV technologies. In Pureflow Ultraviolet, Lawrenceville, GA.
3. Aquionics Inc. Date, Erlanger, KY, Aquionics Literature. Available at:
http://www.aquionics.com/literature.php Accessed September 2007.
4. Autio, T., Hielm, S., Miettinen, M., Sjoberg, A. M, Aarnisalo, K., Bjorkroth, J., Mattila-
Sandholm, T., Korkeala, H. 1999. Sources of Listeria monocytogenes Contamination in a Cold-
Smoked Rainbow Trout Processing Plant Detected by Pulsed-Field Gel Electrophoresis Typing.
Applied and Environmental Microbiology. 65:150-155.
5. Bachmann, R. 1975. Sterilization by intense ultraviolet radiation. The Brown Boveri
Review. 62:206-209.
6. Baldry, M. G. C. 1983. The Bactericidal, Fungicidal and Sporicidal Properties of
Hydrogen-Peroxide and Peracetic-Acid. Journal of Applied Bacteriology. 54:417-423.
7. Bell, K. Y., Cutter, C. N., Sumner, S. S. 1997. Reduction of foodborne micro-organisms
on beef carcass tissue using acetic acid, sodium bicarbonate, and hydrogen peroxide spray
washes. Food Microbiology. 14:439-448.

32
8. Bille, J., Catimel, B., Bannerman, E., Jacquet, C., Yersin, M. N., Caniaux, I., Monget, D.,
Rocourt, J. 1992. Api Listeria, a New and Promising One-Day System to Identify Listeria
Isolates. Applied and Environmental Microbiology. 58:1857-1860.
9. Bintsis, T., Litopoulou-Tzanetaki, E., Davies, R., Robinson, R. K. 2000. The
antimicrobial effects of long-wave ultra-violet light and furocoumarins on some micro-organisms
that occur in cheese brines. Food Microbiology. 17:687-695.
10. Bintsis, T., Litopoulou-Tzanetaki, E., Robinson, R. K. 2000. Existing and potential
applications of ultraviolet light in the food industry - a critical review. Journal of the Science of
Food and Agriculture. 80:637-645.
11. Block, S. S. 2001. Disinfection, Sterilization, and Preservation. Lippincott Williams and
Wilkins, Philadelphia, PA.
12. Brackett, R. E. 1987. Effects of various acids on growth and survival of Yersinia
enterocolitica Journal of Food Protection. 50:598-601.
13. Center for Disease Control and Prevention. 2002. Public health dispatch: Outbreak of
listeriosis, Northeastern United States. p. 51(42): 950.951. In, Morbidity and Mortality Weekly
Report.
14. Center for Disease Control and Prevention. Date, 2005, Listeriosis. . Available at:
www.cdc.gov/ncidod/dbmd/diseaseinfo/listeriosis_t.htm. Accessed August, 2007.

33
15. Centers for Disease Control and Prevention. 1985. Epidemiologic notes and reports
listeriosis outbreak associated with Mexican-style cheese, California. p. 34(24): 357.359. In,
Morbidity and Mortality Weekly Report.
16. Centers for Disease Control and Prevention. 1999. Multistate outbreak of listeriosis,
United States. p. 47(51): 1117.1118. In, Morbidity and Mortality Weekly Report
17. Centers for Disease Control and Prevention. 2000. Multistate outbreak of listeriosis,
United States, 2000. p. 49(50): 1129.1130. In, Morbidity and Mortality Weekly Report.
18. Centers for Disease Control and Prevention. 2001. Outbreak of listeriosis associated with
homemade Mexican-style cheese, North Carolina, October 2000-January 2001. p. 50(26):
560.562. In, Morbidity and Mortality Weekly Report.
19. Chang, J. C., S. F. Ossoff, D. C. Lobe, M. H. Dorfman, C. M. Dumais, R. G. Qualls, and,
and J. D. Johnson. 1985. UV inactivation of pathogenic and indicator microorganisms. Applied
and Environmental Microbiology. 49:1361-1365.
20. Clescerl, L. S., Greenberg, A. E., Eaton, A. D. (ed.). 1999. Standard Methods for the
Examination of Water and Wastewater -20th Edition. American Public Health Association, New
York, NY.
21. Conner, D. E., Scott, V. N., and Bernard, D. T. 1990. Growth, Inhibition, and Survival of
Listeria monocytogenes as Affected by Acidic Conditions. Journal of Food Protection. 53:650-
655.

34
22. Cords, B. R., Burnett, S. L., Hilgren, J., Finley, M., and Magnuson, J. 2005. Sanitizers:
Halogens, Surface-Active Agents, and Peroxides. p. 507-572. In P.M. Davidson, John N. Sofos,
and A. L. Branen (ed.), Antimicrobials in Foods (Third Ed.) CRC Press, Boca Raton, FL.
23. Dalton, C. B., C. C. Austin, J. Sobel, P. S. Hayes, W. F. Bibb, L. M. Graves, B.
Swaminathan, M. E. Proctor, and P. M. Griffin. 1997. An outbreak of gastroenteritis and fever
due to Listeria monocytogenes in milk. New England Journal of Medicine. 336:100-105.
24. Davidson, P. M. 1997. Chemical Preservatives and Natural Antimicrobial Compounds. p.
pp. 520-556. In M.P. Doyle, Beuchat, L. R., Montville, T. J. (ed.), Food Microbiology:
Fundamentals and Frontiers ASM Press, Washington, D.C.
25. Dominguez, L., J. F. F. Garayazabal, E. R. Ferri, J. A. Vazquez, E. Gomezlucia, C.
Ambrosio, and, and G. Suarez. 1987. Viability of Listeria monocytogenes in Milk Treated with
Hydrogen-Peroxide. Journal of Food Protection. 50:636-639.
26. Doores, S. 2005. Organic Acids. p. 91-142. In P.M. Davidson, John N. Sofos, and A. L. Branen (ed.), Antimicrobials in Foods, vol. 3. CRC Press, Boca Raton, FL.
27. Doyle, M. P., Beuchat, L. R., Montville, T. J. (ed.). 2001. Food Microbiology:
Fundamentals and Frontiers. ASM Press, Washington, DC.
28. Eklund, M. W., F. T. Poysky, R. N. Paranjpye, L. C. Lashbrook, M. E. Peterson, and G.
A. Pelroy. 1995. Incidence and Sources of Listeria monocytogenes in Cold-Smoked Fishery
Products and Processing Plants. Journal of Food Protection. 58:502-508.

35
29. Farid, M. M. C., X. C., and Dost, Z. 2001. Ultraviolet sterilization of orange juice. p.
1567-1572. In G.V.B.-C. J. Welti-Chanes, and J. M. Aguilera (ed.), Proceedings of the Eighth
International Congress on Engineering and Food Technomic Publications, Lan-caster, PA.
30. Farkas, J. 1998. Irradiation as a method for decontaminating food: A review.
International Journal of Food Microbiology. 44:189-204.
31. FDA, U. S. Date, January 2001, Draft assessment of the relative risk to public health
from foodborne Listeria monocytogenes among selected categories of ready-to-eat foods.
Available at: www.foodsafety.gov/~dms/lmrisksu.html. Accessed August, 2006.
32. Fellows, P. J. 2000. Processing by Application of Heat. p. 229-240. In, Food Processing
Technologies - Principles and Practice CRC Press LLC, Boca Raton, FL.
33. Fischer, J. R., D. L. Fletcher, N. A. Cox, and J. S. Bailey. 1985. Microbiological
Properties of Hard-Cooked Eggs in a Citric Acid-Based Preservative Solution. Journal of Food
Protection. 48:252-256.
34. Fisher, T. L., and D. A. Golden. 1998. Survival of Escherichia coli O157 : H7 in apple
cider as affected by dimethyl dicarbonate, sodium bisulfite, and sodium benzoate. Journal of
Food Science. 63:904-906.
35. Food Safety and Inspection Service - Recalls. Date, 2002, U.S. Meat and Poultry Recalls
1994-2001. Available at: http://www.fsis.usda.gov/oa/recalls/prelease/pr090-2002products.htm
Accessed April, 2005.

36
36. Gailey, J. K., J. S. Dickson, and W. Dorsa. 2003. Survival of Listeria monocytogenes in a
Simulated Recirculating Brine Chiller System. Journal of Food Protection. 66:1840-1844.
37. Gailunas, K. M. 2003. Use of UV for the Inactivation of Listeria monocytogenes and
Latic acid bacteria species in Recycled Chill Brines. M.S. Thesis. In Virginia Polytechnic
Institute and State University, Blacksburg, VA.
38. Gandhi, M., and M. L. Chikindas. 2007. Listeria: A foodborne pathogen that knows how
to survive. International Journal of Food Microbiology. 113:1-15.
39. Gervilla, R., V. Ferragut, and B. Guamis. 2000. High Pressure Inactivation of
Microorganisms Inoculated into Ovine Milk of Different Fat Contents. Journal of Dairy Science.
83:674-682.
40. Glass, K. A., and Doyle, M. P. 1989. Fate of Listeria monocytogenes in processed meat
products during refriegerated storage. Applied Environmental Microbiology. 55:1565-1569.
41. Golden, D. A., Worobo, R. W., and Ough C. S. 2005. Dimethyl Dicarbonate and Diethyl
Dicarbonate. p. 305-326. In P.M. Davidson, John N. Sofos, and A. L. Branen (ed.),
Antimicrobials in Foods (Third Ed.) CRC Press, Boca Raton, FL.
42. Greer, G. G., F. Nattress, B. Dilts, and L. Baker. 2004. Bacterial Contamination of
Recirculating Brine Used in the Commercial Production of Moisture-Enhanced Pork. Journal of
Food Protection. 67:185-188.

37
43. Guerrero-Beltran, J. A., and G. V. Barbosa-Canovas. 2004. Review: Advantages and
limitations on processing foods by UV light. Food Science and Technology International.
10:137-147.
44. Guerrero-Beltran, J. A., and G. V. Barbosa-Canovas. 2005. Reduction of Saccharomyces
cerevisiae, Escherichia coli and Listeria innocua in apple juice by ultraviolet light. Journal of
Food Process Engineering. 28:437-452.
45. Harrington, W. O., and Hills, C. H. 1968. Reduction of the microbial population of apple
cider by ultraviolet irradiation. Food Technology. 22:117-120.
46. Hudson, J. A. 1992. Efficacy of high sodium chloride concentrations for the destruction
of Listeria monocytogenes. Letters in Applied Microbiology. 14:178-180.
47. Jay, J. M., Loessner, M. J., Golden, D. A. 2005. Foodborne Listeriosis. p. 591-611. In,
Modern Food Microbiology Springer Science and Business Media, Inc, New York, NY.
48. Jeantet, R., Baron, F., Nau, F., Roignant, M., Brule, G. 1999. High Intensity Pulsed
Electric Fields Applied to Egg White: Effect on Salmonella Enteritidis Inactivation and Protein
Denaturation. Journal of Food Protection. 62:1381-1386.
49. Kim, T., J. L. Silva, and T. C. Chen. 2002. Effects of UV Irradiation on Selected
Pathogens in Peptone Water and on Stainless Steel and Chicken Meat. Journal of Food
Protection. 65:1142-1145.

38
50. Kuo, F. L., Ricke, S. C., Carey, J. B. 1997. Shell Egg Sanitation: UV Radiation and Egg
Rotation to Effectively Reduce Populations of Aerobes, Yeasts, and Molds. Journal of Food
Protection. 60:694-697.
51. Lado, B. H., Yousef, A. E. 2002. Alternative Food-Preservation Technologies: Efficacy
and Mechanisms. Microbes and Infection. 4:433-440.
52. Lakins, C. 2002. Inactivation of Escherichia coli O157:H7 and Salmonella spp. in Apple
Cider and Orange Juice by Chemical Preservatives and Ozone. M.S. Thesis. In University of
Tennessee, Knoxville.
53. Larson, A. E., E. A. Johnson, and J. H. Nelson. 1999. Survival of Listeria monocytogenes
in commercial cheese brines. Journal of Dairy Science. 82:1860-1868.
54. Lin, C.-M., K. Takeuchi, L. Zhang, C. B. Dohm, J. D. Meyer, P. A. Hall, and M. P.
Doyle. 2006. Cross-Contamination between Processing Equipment and Deli Meats by Listeria
monocytogenes. Journal of Food Protection. 69:71-79.
55. Maneerat, C., Y. Hayata, N. Muto, and M. Kuroyanagi. 2003. Investigation of UV-A
Light Irradiation on Tomato Fruit Injury during Storage. Journal of Food Protection. 66:2168-
2170.
56. Marquenie, D., C. W. Michiels, A. H. Geeraerd, A. Schenk, C. Soontjens, J. F. Van Impe,
and B. M. Nicolai. 2002. Using survival analysis to investigate the effect of UV-C and heat
treatment on storage rot of strawberry and sweet cherry. International Journal of Food
Microbiology. 73:187-196.

39
57. McKellar, R. C., R. Moir, and M. Kalab. 1994. Factors influencing the survival and
growth of Listeria monocytogenes on the surface of Canadian retail wieners. Journal of Food
Protection. 57:387-392.
58. Mead, P. S., Slutsker, L., Dietz, V., McCaig, L. F., Bresee, J. S., Shapiro, C., Griffin, P.
M., and Tauxe, R. V 1999. Food-related illness and death in the United States. In, Emerging
Infectious Diseases, vol. 5, 607-625.
59. Miller, A. J., Call, Jeffrey E., Eblen, B. Shawn 1997. Growth, Injury, and Survival
Potential of Yersinia enterocolitica, Listeria monocytogenes, and Staphylococcus aureus in Brine
Chiller Conditions. Journal of Food Protection. 60:1334-1340.
60. Montville, T. J., Matthews, K. R. 2005. Food Microbiology – An Introduction. American
Society for Microbiology Press, Washington DC.
61. Morgan, R. 1989. UV "green" Light Disinfection. Dairy Industries International. 54:33-
35.
62. National Center for Health Statistics. Date, 2000, Healthy People 2010. Available at:
www.cdc.gov/nchs/hphome.htm#Healthy%20People%202010. Accessed August 2007.
63. Nogueira, J. N., Cantarelli, P. R., Gallo, C. R., Moreno, I. A. M., Matsuura, F. C. A. U.,
and Tiba, M. A. 1997. Effect of calcium addition and acidification on the quality characteristics
of canned okra (Hibiscus esculentus L.). Archivos Latino Americanos de Nutricion. 47:62-65.

40
64. Norton, D. M., M. A. McCamey, K. L. Gall, J. M. Scarlett, K. J. Boor, and, and M.
Wiedmann. 2001. Molecular studies on the ecology of Listeria monocytogenes in the smoked
fish processing industry. Applied and Environmental Microbiology. 67:198-205.
65. O'Driscoll, B., Gahan, G. C., Hill, C. 1996. Adaptive Acid Tolerence Response in
Listeria monocytogenes: Isolation of an Acid-tolerant Mutant which Demonstrates Increased
Virulence. Applied and Environmental Microbiology. 62:1693-1698.
66. Ozer, N. P., and A. Demirci. 2006. Inactivation of Escherichia coli O157:H7 and Listeria
monocytogenes inoculated on raw salmon fillets by pulsed UV-light treatment. International
Journal of Food Science & Technology. 41:354-360.
67. Palumbo, S. A., and A. C. Williams. 1994. Control of Listeria monocytogenes on the
surface of frankfurters by acid treatments. Food Microbiology. 11:293-300.
68. Papageorgiou, D. K., M. Bori., and A. Mantis. 1996. Growth of Listeria monocytogenes
in whey cheeses Myzithra, Anthotyros, and Manouri during storage at 5, 12, and 22°C. Journal
of Food Protection. 59:1193-1199.
69. Parish, M. E., and D. P. Higgins. 1989. Survival of Listeria monocytogenes in low pH
model broth systems. Journal of Food Protection. 52:144-147.
70. Park, S. Y., M. Y. Yoo, J. H. Choi, S. D. Ha, K. D. Moon, and D. H. Oh. 2005.
Microbiological quality enhancement of minimally-processed enoki mushrooms using ozone and
organic acids. Food Science and Biotechnology. 14:803-807.

41
71. Phelps, K., Koontz, J., Sumner, S., Golden, D., Hackney, C., and Zoecklin, B. . 2000.
Organic acids and hydrogen peroxide inhibit microbial viability in fresh juices,. p. pp.52. In,
Abstract, (P045) in Program and Abstract Book Annual Meeting of International Association of
Food Protection.
72. Phillips, C. A. 1999. The effect of citric acid, lactic acid, sodium citrate and sodium
lactate, alone and in combination with nisin, on the growth of Arcobacter butzleri. Letters in
Applied Microbiology. 29:424-428.
73. Phillips, C. A., and J. Duggan. 2002. The effect of temperature and citric acid, alone, and
in combination with nisin, on the growth of Arcobacter butzleri in culture. Food Control.
13:463-468.
74. Pol, I. E., Mastwijk, H. C., Bartels, P. V., Smid, E. J. 2000. Pulsed-electric Field
Treatments Enhances the Bactericidal Action of Nisin Against Bacillus cereus. Applied and
Environmental Microbiology. 66:428-430.
75. Potter, N. N., Hotchkiss, J. H. 1995. Food Scinece. Chapman and Hall, New York, NY.
76. Quicho, J. M. 2005. Efficacy of Ultraviolet Light in Combination with Chemical
Preservatives for the Reduction of Escherichia coli in Apple Cider. M.S. Thesis. In Virginia
Polytechnic Institute and State University, Blacksburg, VA.
77. Rash, V. A. 2003. Physical and Chemical Treatments for Control of Salmonella on
cantaloupe rinds. M.S. Thesis. In University of Tennessee, Knoxville.

42
78. Robbins, J. B., C. W. Fisher, A. G. Moltz, and S. E. Martin. 2005. Elimination of Listeria
monocytolgenes biofilms by ozone, chlorine, and hydrogen peroxide. Journal of Food
Protection. 68:494-498.
79. Rocourt, J., Cossart, P. 1997. Listeria monocytogenes. p. 337-352. In M.P. Doyle,
Beuchat, L. R., Montville, T. J. (ed.), Food Microbiology - Fundamentals and Frontiers
American Society for Microbiology (ASM) Press, Washington D.C.
80. Rodriguez-Romoand, L. A., and A. E. Yousef. 2005. Inactivation of Salmonella enterica
Serovar Enteritidis on Shell Eggs by Ozone and UV Radiation. Journal of Food Protection.
68:711-717.
81. Romans, J. R., Costello, William J., Carlson, Wendell C. 1994. The Meat We Eat.
Interstate Publishers, Danville, IL.
82. Samelis, J., and J. Metaxopoulos. 1999. Incidence and principal sources of Listeria spp.
and Listeria monocytogenes contamination in processed meats and a meat processing plant. Food
Microbiology. 16:465-477.
83. Sastry, S. K., Datta, A. K., and Worobo, R. W. 2000. Ultraviolet light. Journal of Food
Science, Supplement. 65:90-92.
84. Shama, G. 1999. Ultraviolet light. p. 2208-2214. In R.K. Robinson, Batt, C., and Patel, P.
(ed.), Encyclopedia of Food Microbiology - 3 Academic Press, London, UK.
85. Sizer, C. E., and V. M. Balasubramaniam. 1999. New intervention processes for
minimally processed juices. Food Technology. 53:64-67.

43
86. Sommers, C. H., X. Fan, A. P. Handel, and K. Baxendale Sokorai. 2003. Effect of citric
acid on the radiation resistance of Listeria monocytogenes and frankfurter quality factors. Meat
Science. 63:407-415.
87. Sumner, S. S., E. A. Wallner-Pendleton, G. W. Froning, and L. V. E. Stetson. 1996.
Inhibition of Salmonella typhimurium on Agar Medium and Poultry Skin by Ultraviolet Energy.
Journal of Food Protection. 59:319-321.
88. Tapia de Daza, M. S., Y. Villegas, and A. Martinez. 1991. Minimal water activity for
growth of Listeria monocytogenes as affected by solute and temperature. International Journal
of Food Microbiology. 14:333-337.
89. Tompkin, R. B. 2002. Control of Listeria monocytogenes in the Food-Processing
Environment. Journal of Food Protection. 65:709-725.
90. Tompkin, R. B., V. N. Scott, D. T. Bernard, W. H. Sveum, and K. S. Gombas. 1999.
Guidelines to prevent post-processing contamination from Listeria monocytogenes. Dairy, Food
and Environmental Sanitation. 19:551-562.
91. U.S. Department of Agriculture. Date, 2000, Sanitation performance standards
compliance guide Available at: http://www.fsis.usda.gov/oppde/rdad/frpubs/sanitationguide.htm.
Accessed August, 2007.
92. U.S. Department of Agriculture. 2007. Available at:
www.fsis.usda.gov/FSIS_Recalls/Open_Federal_Cases/index.asp. In, Food Safety and
Inspection Service - Recalls.

44
93. U.S. Food and Drug Administration. 2000. Kinetics of Microbial Inactivation for
Alternative Food Processing Technologies - Ultraviolet Light. In Center for Food Safety and
Applied Nutrition.
94. U.S. Food and Drug Administration. June 2000. Kinetics of Microbial Inactivation for
Alternative Food Processing Technologies - Ultraviolet Light. In Center for Food Safety and
Applied Nutrition.
95. Warriner, K., Rysstad, G., Murden, A., Rumsby, P., Thomas, D., Waites, W. M. 2000.
Inactivation of Bacillus subtilis spores on packaging surfaces by u.v. excimer laser irradiation.
Journal of Applied Microbiology. 88:678-685.
96. Williams, R. C., Sumner, S. S., Golden, D. A. 2005. Inactivation of Escherichia coli
O157: H7 and Salmonella in apple cider and orange juice treated with combinations of ozone,
dimethyl dicarbonate, and hydrogen peroxide. Journal of Food Science. 70:M197-M201.
97. Wright, J. R., Sumner, S. S., Hackney, C. R., Pierson, M. D., Zoecklein, B. W. 2000.
Efficacy of ultraviolet light for reducing Escherichia coli O157 : H7 in unpasteurized apple
cider. Journal of Food Protection. 63:563-567.
98. Yaun, B. R. 2002. Efficacy to Ultraviolet Treatment for the Inhibition of Pathogens on
the Surface of Fresh Fruits and Vegetables. In, , vol. M.S. Thesis. Virginia Polytechnic Institute
and State University, VA., Blacksburg.
99. Yaun, B. R., Sumner, S. S., Eifert, J. D., Marcy, J. E. 2003. Response of Salmonella and
Escherichia coli O157 : H7 to UV energy. Journal of Food Protection. 66:1071-1073.

45
100. Yousef, A. H. E., and E. L. H. Marth. 1988. Inactivation of Listeria monocytogenes by
Ultraviolet Energy. Journal of Food Science. 53:571-573.

46
OBJECTIVES
Following are the primary objectives of this research work:
1) Study of the effect of combination of UV and antimicrobials such as citric acid (0.2 and
0.5%), dimethyl dicarbonate (250 and 500 ppm), and hydrogen peroxide (2000 and 4000
ppm) on reducing the number of L. monocytogenes in fresh brine.
2) Study of the effect of combination of UV and antimicrobials such as citric acid (0.2 and
0.5%), dimethyl dicarbonate (250 and 500 ppm), and hydrogen peroxide (2000 and 4000
ppm) on reducing the number of L. monocytogenes in recycled spent/used brine.

47
CHAPTER: IV
EFFICACY OF UV AND ANTIMICROBIALS IN REDUCING THE NUMBER OF
LISTERIA MONOCYTOGENES IN FRESH CHILL BRINE
Priti Parikh, Robert Williams, Kumar Mallikarjunan, Joseph Marcy, and Joseph Eifert
Keywords: Listeria monocytogenes, brine, UV, citric acid, dimethyl dicarbonate, hydrogen peroxide

48
ABSTRACT
Chill brines used during ready-to-eat meat processing may be an important source of
post-processing contamination by Listeria monocytogenes (LM). The purpose of this study was
to determine the efficacy of ultraviolet light (UV), antimicrobials such as, citric acid (CA, 0.2
and 0.5%), dimethyl dicarbonate (DMDC, 250 and 500 ppm), and hydrogen peroxide (HP, 2000
and 4000 ppm) alone and in combination with UV to reduce LM in chill brine. Fresh brine (8.0
% w/v NaCl) was inoculated with ~6 log CFU/ml LM cocktail, a specific antimicrobial was
added (during antimicrobial treatment), and the solution was exposed to UV-C (~53.8 mJ/cm2) at
-1°C in a circulating tank. Samples were withdrawn at regular intervals for 120 minutes. When
LM was no longer detectable via direct plating on MOX, enrichment was performed and
colonies were confirmed using API-Listeria. Based on LM population reduction rate,
UV,UV+500 ppm DMDC, and UV+0.5% CA were found the most effective treatments that
required >120, 60, and 45 minutes, respectively, to reach non-detectable level in brine. Thus,
based on time UV+0.5% CA was the most effective treatment. Though the reduction rate
achieved by 0.5% CA was significantly lower than these treatments, it was as effective as
UV+500 ppm DMDC to reach non-detectable level. UV+ 4000 ppm HP required 90 minutes
and so was not as effective as UV+500 ppm DMDC and UV+0.5% CA. Higher concentrations
of antimicrobials were found more effective than lower concentrations. This work indicates that
combinations of UV and antimicrobial may be more effective than either treatment alone except
0.5% CA for the reduction of LM in fresh brines.

49
INTRODUCTION
Listeria monocytogenes is a halotolerant, Gram-positive, non-spore forming, rod shaped
bacterium. It is a foodborne pathogen that causes the illness listeriosis. This organism can grow
at temperatures as low as 1.1°C, pH as low as 4.4, and water activities as low as 0.90 (18). Over
the last 25 years, listeriosis has been recognized as a major foodborne disease. The economic
burden of listeriosis has been estimated to be $255 million per year and associated food recalls
were estimated to cost $15 million in 1985 through 1987 (5). Moreover, there are approximately
2000 cases of listeriosis reported every year in the United States, with approximately 500
fatalities (20). L. monocytogenes is a significant problem for the food industries due to its ability
to survive and grow under adverse conditions (e.g., low temperature, pH, water activity, etc.) that
are not tolerated by other non-spore forming foodborne pathogens. However, Listeria is
susceptible to typical food processes such as cooking, pasteurization, or drying. So, it is
primarily an environmental (i.e., food processing environment) contaminant responsible for post-
processing contamination of products. Consequently, L. monocytogenes is predominantly
problematic in ready-to-eat foods; i.e., foods that are not going to be cooked by consumer.
Because of the high risk, fatality rate, and cost of listeriosis, it is very important to reduce the
risk of this pathogen from foods.
Since L. monocytogenes is an environmental contaminant, it is largely associated with
food recalls. FSIS reported 8 recalls from January to October 2007 and 34 recalls in a 24 month
period starting 2005 (25). These recalls were mainly related to various ready-to-eat meat
products, fully cooked chicken products, frozen egg rolls, and sausage products. There are
several areas of processing plants where post-processing contamination of products may occur;
e.g., slicing, packing, re-bagging, and cooling the product with chilled brine solution. Chill brine

50
is used to quickly cool thermally processed ready-to-eat products such as frankfurters, deli
meats, fish, cheese, etc. to prevent bacterial growth. The USDA has set limits for maximum
usage of chill brines based on the salinity and temperature of the brine. Brines may be used for
up to four weeks provided that the concentration of salt is 20% with the maximum usage
temperature of 10°F (24). L. monocytogenes can survive at high salt concentration (~10-12%)
and low temperatures (up to 0°C) and, thus, chill brine can harbor this organism once
contaminated. Several studies have shown that contamination of ready-to-eat products increases
after brining and the most contaminated sites of the processing plant are the brining and post-
brining areas (2, 15). Thus, it is very important to prevent L. monocytogenes survival in brines.
Previous studies have shown that UV is effective for reducing the population of various
microorganisms in water and certain foods (6, 11, 17, 19, 22, 26, 27). Antimicrobial agents such
as citric acid, hydrogen peroxide, and dimethyl dicarbonate are effective antimicrobial agents
under certain conditions. Therefore, this study is designed to determine the efficacy of UV and
antimicrobials alone and in combination for the reduction of L. monocytogenes in fresh chill
brines.

51
MATERIALS AND METHODS
Culture Preparation
Three strains of L. monocytogenes, Scott A, V7, and L-CDC were used for this study.
These strains were obtained from the culture collection at the Department of Food Science and
Technology, Virginia Polytechnic Institute and State University. Prior to inoculum preparation,
each strain was confirmed using the following method: a portion of each stock culture was
transferred to 10 mL of trypic soy broth supplemented with 0.6% yeast extract (TSBYE) and
incubated at 35°C for 24 hours. One loopful (10 µL) of 24 h culture was streaked onto Modified
Oxford (MOX) agar (Oxford Medium Base and Modified Antibiotic Supplement; Difco, Becton,
Dickinson and Company, Franklin Lakes, NJ) for isolation and incubated at 35°C for 48 hours.
A presumptive positive colony was selected and streaked again on MOX agar plate that was
incubated at 35°C for 24 hours. API Listeria strip was inoculated with a colony from the second
MOX plate to confirm the identity of the isolate. Once the strain was verified, the confirmed
colony of L. monocytogenes was transferred from MOX to 25 mL of sterile TSBYE and stock
cultures were prepared for the remaining studies.
Stock culture Preparation
Confirmed colony of L. monocytogenes was transferred from MOX to 25 mL TSBYE.
After 20-22 hours incubation of this broth at 35°C, it was centrifuged and the pallets were
obtained. Pallets were re-suspended in fresh sterile TSBYE broth and an equal part of this
resuspended culture was combined with sterile TSBYE containing 50% glycerol. This mixture
of culture then was mixed well and dispensed 1-1.5mL volume in cryules. These cryules then

52
stored at -76°C at the Department of Food Science and Technology. This procedure was used to
make stock culture of each strain, Scott A, V 7, and L-DCD, of L. monocytogenes.
Inoculum Preparation
The stock culture that was prepared was used to prepare inoculum. Before inoculation,
the stock cultures were kept in a water bath for few minutes to quickly thaw the culture. A
loopful of each purified strain (from stock culture) was transferred separately to TSBYE (25 mL)
and incubated at 35°C for 20-22 hours. Twenty mL of each culture was transferred to a
centrifuge tube and the mixed culture was then centrifuged, the spent medium was decanted, and
the pellet was suspended in 60 mL sterile brine (8% NaCl w/w). Inoculated brine (60 mL) was
added to 60 L of test brine to achieve approximately 106 CFU/mL initial population.
Brine Preparation
Unused (fresh) chill brine was used in this study. Fresh brine solutions were prepared in
the laboratory no more than 24 hours prior to use. All equipment and containers used for brine
preparation were cleaned using HC-10 Chlorinated Kleer-Mor high foaming caustic cleaner
(EcoLab, St. Paul, MN) and sanitized with Ster-Bac Quaternary Ammonium Sanitizer (200 ppm;
EcoLab, St. Paul, MN) to prevent any contamination of brine prior to inoculation. Each
container was thoroughly rinsed with tap water to remove any residue of cleaner or sterilizer that
may affect the survival of listeriae cells in brine during the treatment. Fresh brines were
prepared by dissolving 4.8 kg of Cargill Top-Flow Evaporated Salt (99.8% purity) (Cargill Inc.,
Minneapolis, MN) into 60 L of tap water to achieve a concentration of 8% w/v NaCl. Each brine
solution was placed in a refrigerated room (4°C) before use.

53
Brine Analysis
Brine was analyzed for its initial pH, salt concentration and background micro-flora. Before
adding the inoculum to the brine, a 50 mL brine sample was taken, serially diluted using 0.1%
peptone, and plated on Tryptic Soy Agar (TSA). Plates were incubated at 35°C for 48 hours to
count the background micro-flora. The salt concentration of brines was measured using
hydrometer.
Ultraviolet Light Treatment
An Ultra-Violet Water Treatment Unit (Aquionics Inc., Erlanger, KY), model number
AMD 150B/1/2T D was used for this research (Figure 4.1). The system is effective in the most
challenging applications including treating super cooled water, hot water, poor transmission
fluids, such as brine, and high dose situations (1).
Figure 4.1: Ultra-Violet Water Treatment Unit

54
The brine was treated by passing it through a stainless steel chamber containing single, broad
spectrum, medium pressure UV lamp. The lamp was mounted in a quartz sleeve and fitted
within the chamber allowing brine to pass the sleeve on all sides. A diameter of the lamp quartz
was 20.5 mm and the arc length was 280 mm. The UV system was additionally connected with
an in-line chiller unit (GCI Icewagon) to keep the brine temperature of 30°F (-1°C) during
processing. Moreover, entire UV treatment system was kept in a 4°C laboratory in order to
allow the brine to remain chilled. After the UV exposure, some of the brine would return to a
reservoir directly and some would return to reservoir via chiller. Thus, it was continually
pumped through the UV system during the entire treatment time.
Brine prepared as described above was then exposed to UV at a peak output of 254 nm with
an approximate UV dose of 53.8mJ/cm2. Since the brine was prepared using the Blacksburg
municipal water supply, it contained chloramines. In order to decompose chloramines, the brine
was first placed in the reservoir of the system and recycled with UV exposure. The UV lamp
was then turned off and a 50 mL sample was taken for analysis of background microflora. Then
the brine was inoculated with the cocktail of three L. monocytogenes strains and circulated to
mix. The approximate inoculum was 6.0 log CFU/mL. The inoculated brine then was exposed
to UV for up to two hours with the flow rate of 198 L/min. Samples (50 mL) were taken at 0, 1,
5, 15, 30, 45, 60, 75, 90, 105, and 120 minutes and analyzed for L. monocytogenes. All the
samples were taken in sterile 90 mL specimen containers (Fisher Scientific, Inc) to avoid sample
contamination. To see the effect of the UV system flow and temperature, inoculated brine was
circulated through the system with the lamps turned off that served as control for all the
treatments.

55
After each run, the UV system was cleaned using HC-10 Chlorinated Kleer-Mor high
foaming caustic cleaner (EcoLab, St. Paul, MN) and sanitized with Ster-Bac Quaternary
Ammonium Sanitizer (200 ppm; EcoLab, St. Paul, MN) to destroy any remaining listeriae cells
and to prevent any contamination of next batch of brine.
Antimicrobial Treatment
Inoculated brine was treated with antimicrobial agents, such as citric acid (0.1% and
0.2%), hydrogen peroxide (2000 ppm and 4000 ppm), and dimethyl dicarbonate (DMDC) (250
ppm and 500 ppm) in the absence of UV. The concentration of each antimicrobial was selected
through a preliminary study. Brine was inoculated with approximately 6.0 log CFU/mL L.
monocytogenes cocktail and circulated for one minute. Respective antimicrobial agent was then
added and zero-minute sample was taken. Brine was circulated through the system with added
antimicrobial for 120 minutes. Samples were withdrawn at the same interval as UV treatment
and were analyzed for detection of L. monocytogenes
Combination of UV and antimicrobial Treatment
Brine inoculated with the test organism was also treated with combination of UV and
antimicrobial agents. For this treatment, a specific antimicrobial in a specific concentration was
added in inoculated brine and a sample was withdrawn that was called zero-minute sample.
Immediately after that the UV was turned on and brine was processed with UV and added
antimicrobial for 120 minutes. Samples were taken at the same interval as UV treatment and
were subjected to microbiological analysis for L. monocytogenes.

56
Microbiological analysis
Samples of test brines were serially diluted using 0.1% peptone and plated on to duplicate
MOX agar plates followed by 48 hours incubation at 35°C. Typical black colonies were
considered as presumptive for L. monocytogenes. After incubation, colonies were counted and
results were reported in CFU/mL. An enrichment procedure was also performed to detect the
cells once population reach to detection limit (1.00 log CFU/mL) and are no longer recoverable
by direct plating. For this purpose, 50 mL Brain Heart Infusion (BHI; Difco, Becton Dickinson
and Company, Franklin Lakes, NJ) broth was inoculated with the 10 mL brine sample followed
by 48 hours incubation at 35°C. After 24 hours, a loop-full of culture from BHI was streaked on
MOX plates followed by 48 hours incubation at 35°C. Then, results were reported in presence
or absence of L. monocytogenes in the samples. Typical colonies on MOX were confirmed using
Listeria API.
Statistical Analysis
Each experiment of UV and combination of UV and each antimicrobial were replicated
three times for accurate results. The data of direct plating were analyzed using JMP statistical
software version 6.00 (SAS Institute; Cary NC). For these quantitative data, regression analysis
was performed to calculate slope and so the rate of L. monocytogenes reduction in brines. Since
the regression analysis was performed on each replication of all the treatments, there are more
than one statistical models of this study. An example of these models for one of the treatments
used in fresh and spent brine is described in detail in Appendix A. The mean rate of reduction
was then obtained using one way ANOVA, where the value of α equaled 0.05. The results of
enrichment studies were qualitative that described either presence or absence of L.

57
monocytogenes in samples. Therefore, they were used to illustrate Time (in minutes) to reach a
non-detectable level in brines, and therefore, the total processing time.

58
RESULTS
The results of brine analysis showed that the average pH value of fresh brine was 7.1
with average salt concentration of 8.0%. The results of total aerobic plate count illustrated that
population of background micro-flora (aerobic mesophiles) in fresh brine was generally non-
detectable; i.e., below 1.0 log CFU/mL.
The microbiological analysis of brine was performed to observe the trend of L.
monocytogenes inactivation through various treatments in brine. Through the experiments, two
types of data sets were generated, (i) quantitative data from the results of direct surface plating
and (ii) qualitative data through enrichment studies. Results of direct surface plating on MOX
are shown in figures 4.2, 4.3, 4.4, and 4.5. These results mainly explain the inactivation trend of
L. monocytogenes in response to all treatments.
Table 4.1 illustrates the fate of L. monocytogenes during the UV treatment of fresh brine
containing citric acid, dimethyl dicarbonate, and hydrogen peroxide. The average starting
population of L. monocytogenes for all treatments was 5.7 log CFU/mL of brine. The slope of all
treatments was negative, which suggests that the number of L. monocytogenes decreased with
time.
Based on the rate of reduction of L. monocytogenes, we can sort the treatments from the
highest to lowest rates. Note that there are treatments that have a rate of reduction that are not
significantly different than other treatments. Such treatments were grouped together and given
the same rank (i.e., same letter as a superscript in Table 4.1). The final ranking is as follows:
UV+500 ppm DMDC, UV, UV+0.5% and CA UV+0.2% CA; UV+250 ppm DMDC, UV+2000
ppm HP, 0.5% CA and UV+4000 ppm HP, 0.2% CA, 500 ppm DMDC, 250 ppm DMDC, 2000
ppm HP, 4000 ppm HP, and Control.

59
In contrast, based on the time (in minutes) to reach a non-detectable levels of L.
monocytogenes through the enrichment study, we can sort the treatments from the lowest to
highest required time as UV+0.5% CA; 0.5% CA and UV+500 ppm DMDC; UV+250 ppm
DMDC and UV+4000 ppm HP; UV+2000 ppm HP; 4000 ppm HP; followed by the remaining
treatments. Since the study was performed for 120 minutes, all treatments that required more
than 120 minutes were given the same rank.
Results of the control study showed that both low temperature and brine circulation
through the system did not have any negative effect on the survival of L. monocytogenes, and
that the population was constant throughout the 120-minute time-period. When fresh brine was
treated with UV alone, L. monocytogenes population decreased below the detection limit (i.e., <1
log CFU/mL) through surface plating in 15 minutes (Figure 4.2) with a reduction rate of 0.87 log
CFU/mL per minute (Table 4.1). However, L. monocytogenes was detectable by enrichment
throughout the 120-minute time-period. This shows that enrichment plays a significant role for
the selection of any method to maintain a zero tolerance policy of L. monocytogenes in ready-to-
eat products.
When UV treatment was combined with 500 ppm DMDC the population of L.
monocytogenes reduced from 6.10 log CFU/mL to below the detection limit through surface
plating in 15 minutes and achieved the highest rate of reduction (0.90 log CFU/mL per minute).
The reduction rate achieved by UV treatment was not significantly different from UV+500 ppm
DMDC. However, the latter treatment required only 60 minutes to reduce the listeriae
population to a non-detectable level through enrichment. On the other hand, when brine was
treated only with 500 ppm DMDC it required 90 minutes to reduce the population below
detection limit through direct surface plating (Figure 4.2) and more than 120 minutes to reduce

60
the population to a non-detectable level through enrichment (Table 4.1). Similarly, the
combination of UV and 250 ppm DMDC was more effective than either of the treatments alone.
UV+250 ppm DMDC and 250 ppm DMDC alone required 15 and 105 minutes, respectively, to
reduce the number of listeriae cells from 6.0 log CFU/mL to less than the detection limit (Figure
4.2). Moreover, cells were recovered until 75 and 120 minutes through enrichment with
UV+250 ppm DMDC and 250 ppm DMDC, respectively (Table 4.1). This confirms that
antimicrobial agents, such as DMDC, improve the efficacy of UV and that the multiple hurdle
technology works better than using one hurdle/barrier in pathogen reduction (14, 21).
The combination of UV with 0.5% CA reduced the listeriae population from 5.98 log
CFU/mL to less than the detection limit in 15 minutes (Figure 4.3) with a mean rate of decline of
0.79 log CFU/mL per minute (Table 4.1). The reduction rate of UV+0.5% CA treatment was not
significantly different from UV and UV+500 ppm DMDC treatments (P>0.05). However,
UV+0.5% CA required only 45 minutes in order to reach a non-detectable level through
enrichment, which was lower than the time required by UV+500 ppm DMDC. Therefore,
UV+0.5% CA may be better than UV+500 ppm DMDC to reduce the population of L.
monocytogenes in relatively short time.
The enrichment studies also showed that 0.5% CA treatment required as much time as
UV+500 ppm DMDC (60 minutes) to reach the non-detectable level. However, the reduction
rate of 0.5% CA Control (0.31 log CFU/mL per minute) was significantly lower than UV+500
ppm DMDC (0.90 log CFU/mL per minute). Thus, according to total time required to process
brine to achieve non-detectable level in brine, UV+0.5% CA was the most effective treatment.
In contrast, 0.2% CA did not improve the efficacy of UV and was not found to be one of the
effective treatments to process brine (Table 4.1).

61
It was also observed that UV+4000 ppm HP was not so effective when compared to
UV+500 ppm DMDC and UV+0.5% CA. Addition of HP reduced the rate achieved by UV
alone and so UV+HP took more time than UV to reduce the population below detection limit
through direct plating. UV+2000 ppm HP and UV+4000 ppm HP required 15 and 30 minutes,
respectively, to achieve a non-detectable level. However, they required shorter time, 90 and 105
minutes, respectively, to reach a non-detectable level through enrichment than UV alone (Figure
4). Moreover, enrichment studies showed that 4000 ppm HP alone required 120 minutes to
reach a non-detectable level in brine. Therefore, among all the antimicrobial treatments without
UV, 0.5% CA was the most effective treatment followed by 4000 ppm HP. With all other
antimicrobial treatments listeriae cells were recovered up to 120 minutes through enrichment.

62
DISCUSSION
L. monocytogenes has recently emerged as one of the major etiological agents of
foodborne disease. It has caused a significant problem with food recalls that has affected the
economy of the country (7-10, 25). Because of the high fatality rate and the low infective dose
of L. monocytogenes there is a zero tolerance policy of pathogen in ready-to-eat food products.
It has also been observed by USDA that L. monocytogenes is primarily associated with various
recalls of fully cooked, ready-to-eat, and frozen products. Since chill brine is used to quickly
cool thermally processed ready-to-eat products, it is a potential point in the process where L.
monocytogenes contamination may occur. However, not much work has been done on
processing of brine to reduce or remove this pathogen. Therefore, the main objective of this
study was to use a combination of non-thermal processes, such as UV and antimicrobials, to
reduce the population of L. monocytogenes in fresh chill brines.
This research showed that when fresh brine was treated with UV the L. monocytogenes
population decreased significantly, by 5.0 log CFU/mL, in 15 minutes of UV-exposure. This
finding is in accordance with Gailunas (2003) and Quicho (2005). Gailunas (2005) reported
reduction of around 4.0 log CFU/mL listeriae cells within 15 minutes in 7.9% and 13.2% brines
(13). Quicho (2005) observed 4.7 log CFU/mL reduction of E. coli in apple cider immediately
after UV exposure (21). However, cells were recovered up to 120 through enrichment. This
explains the sigmoidal curve produced by UV. Researchers have observed that UV reduces
microbial population exponentially and so produces a sigmoidal curve (3, 23, 28). This tailing
effect may be due to a lack of homogenous distribution of population in brine. The tailing effect
is also explained by multiple hit phenomenon described by Yousef and Marth (28). According to

63
this phenomenon multiple UV hit on a single cell or single UV hit on multiple cells produces a
sigmoidal survival curve. Addition of antimicrobials, however, reduced the tailing effect that
was observed by UV.
The addition of 500 ppm DMDC and 0.5% CA did not significantly affect the reduction
rate achieved by UV alone and required similar time to reduce the population below detection
limit through direct plating. However, enrichment studies showed that the combined treatment
of UV and 0.5% CA was the most effective in reducing the number of L. monocytogenes to a
non-detectable level in short time. This means that DMDC needs a bit more contact time than
CA to achieve similar results. When comparing the lower concentration levels of DMDC and
CA the reduction rate of UV+250 ppm DMDC was significantly lower than UV+0.2% CA.
However, the listeriae cells were recovered up to 120 minutes through enrichment with the latter
treatment, whereas former treatment required 90 minutes. Thus, DMDC was more effective than
CA at lower concentrations.
The addition of HP negatively affected the reduction rate achieved by UV and so UV+HP
required more time than UV to reduce the population below the detection limit through direct
plating. This may be due to HP’s UV absorption property. It is known that HP absorbs UV
when it ranges from 200-300 nm (16). This may have caused low UV availability to destroy
microbial cells. On the whole, the combination of UV and 4000 ppm HP was found relatively
less effective in fresh brine among other combinations of UV (i.e., UV with 500 ppm DMDC
and 0.5% CA). This may be explained by the instability of HP in brine solution and effect of pH
on antimicrobial property of HP. It has been studied that HP shows better antimicrobial activity
in acidic pH and slightly lower activity in neutral pH. However, HP’s overall effectiveness is
diminished at alkaline pH (12). Baldry (4) studied the effect of pH on antimicrobial properties

64
of HP and showed that 3% solution of HP killed Bacillus subtilis spores in 3 hours at pH 5.
However, the same solution required 6 hours at pH 6.5 and pH 8.0. Thus, a neutral pH (7.1) of
the brine may have reduced the antimicrobial property of HP in this study and so it was not
found as effective as UV+500 ppm DMDC and UV+0.5% CA.
When the combination of UV with lower concentration of HP (2000 ppm) was compared
to that of DMDC (250 ppm) and CA (0.2%) the reduction rate of UV+2000 ppm HP was
significantly lower than UV+0.2% CA (P>0.05) and was not significantly different from
UV+250 ppm DMDC. However, UV+2000 ppm HP required 105 minutes to reduce the
population below non-detectable levels, which was slightly higher than UV+250 ppm DMDC
(90 minutes) and lower than UV+0.2% CA (>120 minutes). Thus, though the reduction rate of
UV+0.2% CA was higher than the other two treatments, the latter treatments were found more
effective based on time. Among the lower concentrations of antimicrobials UV+250 ppm
DMDC was found slightly better than UV+2000 ppm HP; the latter was found slightly better
than UV+0.2% CA.
Overall, antimicrobial treatments alone were not as effective as the combination
of UV and antimicrobials except 0.5% CA that required 60 minutes to reach a non-detectable
level in brine. 0.5% CA treatment was found almost equally effective with and without UV.
Another antimicrobial that was found effective was 4000 ppm HP that required 120 minutes to
reach a non-detectable level. Thus, 0.5% CA and 4000 ppm HP may be effective to use alone in
reducing the L. monocytogenes population in fresh brine. In summary, this research showed that
a combination of UV and antimicrobials was more effective in reducing the population of L.
monocytogenes to a non-detectable level in brine than any of the treatment alone except the

65
treatment of 0.5% CA. Moreover, higher concentration of antimicrobials were, generally, more
effective than lower concentrations.

66
REFERENCES
1. Aquionics Inc. Date, Erlanger, KY, Aquionics Literature. Available at:
http://www.aquionics.com/literature.php Accessed September 2007.
2. Autio, T., Hielm, S., Miettinen, M., Sjoberg, A. M, Aarnisalo, K., Bjorkroth, J., Mattila-
Sandholm, T., Korkeala, H. 1999. Sources of Listeria monocytogenes Contamination in a Cold-
Smoked Rainbow Trout Processing Plant Detected by Pulsed-Field Gel Electrophoresis Typing.
Applied and Environmental Microbiology. 65:150-155.
3. Bachmann, R. 1975. Sterilization by intense ultraviolet radiation. The Brown Boveri
Review. 62:206-209.
4. Baldry, M. G. C. 1983. The Bactericidal, Fungicidal and Sporicidal Properties of
Hydrogen-Peroxide and Peracetic-Acid. Journal of Applied Bacteriology. 54:417-423.
5. Bille, J., Catimel, B., Bannerman, E., Jacquet, C., Yersin, M. N., Caniaux, I., Monget, D.,
Rocourt, J. 1992. Api Listeria, a New and Promising One-Day System to Identify Listeria
Isolates. Applied and Environmental Microbiology. 58:1857-1860.
6. Bintsis, T., Litopoulou-Tzanetaki, E., Davies, R., Robinson, R. K. 2000. The
antimicrobial effects of long-wave ultra-violet light and furocoumarins on some micro-organisms
that occur in cheese brines. Food Microbiology. 17:687-695.
7. Center for Disease Control and Prevention. 2002. Public health dispatch: Outbreak of
listeriosis, Northeastern United States. p. 51(42): 950.951. In, Morbidity and Mortality Weekly
Report.
8. Centers for Disease Control and Prevention. 1999. Multistate outbreak of listeriosis,
United States. p. 47(51): 1117.1118. In, Morbidity and Mortality Weekly Report

67
9. Centers for Disease Control and Prevention. 2000. Multistate outbreak of listeriosis,
United States, 2000. p. 49(50): 1129.1130. In, Morbidity and Mortality Weekly Report.
10. Centers for Disease Control and Prevention. 2001. Outbreak of listeriosis associated with
homemade Mexican-style cheese, North Carolina, October 2000-January 2001. p. 50(26):
560.562. In, Morbidity and Mortality Weekly Report.
11. Chang, J. C., S. F. Ossoff, D. C. Lobe, M. H. Dorfman, C. M. Dumais, R. G. Qualls, and,
and J. D. Johnson. 1985. UV inactivation of pathogenic and indicator microorganisms. Applied
and Environmental Microbiology. 49:1361-1365.
12. Cords, B. R., Burnett, S. L., Hilgren, J., Finley, M., and Magnuson, J. 2005. Sanitizers:
Halogens, Surface-Active Agents, and Peroxides. p. 507-572. In P.M. Davidson, John N. Sofos,
and A. L. Branen (ed.), Antimicrobials in Foods (Third Ed.) CRC Press, Boca Raton, FL.
13. Gailunas, K. M. 2003. Use of UV for the Inactivation of Listeria monocytogenes and
Latic acid bacteria species in Recycled Chill Brines. M.S. Thesis. In Virginia Polytechnic
Institute and State University, Blacksburg, VA.
14. Gandhi, M., and M. L. Chikindas. 2007. Listeria: A foodborne pathogen that knows how
to survive. International Journal of Food Microbiology. 113:1-15.
15. Greer, G. G., F. Nattress, B. Dilts, and L. Baker. 2004. Bacterial Contamination of
Recirculating Brine Used in the Commercial Production of Moisture-Enhanced Pork. Journal of
Food Protection. 67:185-188.
16. Ince, N. H. 1999. "Critical" effect of hydrogen peroxide in photochemical dye
degradation. Water Research. 33:1080-1084.

68
17. Kim, T., J. L. Silva, and T. C. Chen. 2002. Effects of UV Irradiation on Selected
Pathogens in Peptone Water and on Stainless Steel and Chicken Meat. Journal of Food
Protection. 65:1142-1145.
18. Larson, A. E., E. A. Johnson, and J. H. Nelson. 1999. Survival of Listeria monocytogenes
in commercial cheese brines. Journal of Dairy Science. 82:1860-1868.
19. Marquenie, D., C. W. Michiels, A. H. Geeraerd, A. Schenk, C. Soontjens, J. F. Van Impe,
and B. M. Nicolai. 2002. Using survival analysis to investigate the effect of UV-C and heat
treatment on storage rot of strawberry and sweet cherry. International Journal of Food
Microbiology. 73:187-196.
20. Montville, T. J., Matthews, K. R. 2005. Food Microbiology – An Introduction. American
Society for Microbiology Press, Washington DC.
21. Quicho, J. M. 2005. Efficacy of Ultraviolet Light in Combination with Chemical
Preservatives for the Reduction of Escherichia coli in Apple Cider. M.S. Thesis. In Virginia
Polytechnic Institute and State University, Blacksburg, VA.
22. Rodriguez-Romoand, L. A., and A. E. Yousef. 2005. Inactivation of Salmonella enterica
Serovar Enteritidis on Shell Eggs by Ozone and UV Radiation. Journal of Food Protection.
68:711-717.
23. Sastry, S. K., Datta, A. K., and Worobo, R. W. 2000. Ultraviolet light. Journal of Food
Science, Supplement. 65:90-92.
24. U.S. Department of Agriculture. Date, 2000, Sanitation performance standards
compliance guide Available at: http://www.fsis.usda.gov/oppde/rdad/frpubs/sanitationguide.htm.
Accessed August, 2007.

69
25. U.S. Department of Agriculture. 2007. Available at:
www.fsis.usda.gov/FSIS_Recalls/Open_Federal_Cases/index.asp. In, Food Safety and
Inspection Service - Recalls.
26. U.S. Food and Drug Administration. June 2000. Kinetics of Microbial Inactivation for
Alternative Food Processing Technologies - Ultraviolet Light. In Center for Food Safety and
Applied Nutrition.
27. Warriner, K., Rysstad, G., Murden, A., Rumsby, P., Thomas, D., Waites, W. M. 2000.
Inactivation of Bacillus subtilis spores on packaging surfaces by u.v. excimer laser irradiation.
Journal of Applied Microbiology. 88:678-685.
28. Yousef, A. H. E., and E. L. H. Marth. 1988. Inactivation of Listeria monocytogenes by
Ultraviolet Energy. Journal of Food Science. 53:571-573.

70
Table 4.1: Fate of Listeria monocytogenes during Ultraviolet Light Treatment of Fresh Brines Containing Citric Acid (0.2 and 0.5%), Dimethyl Dicarbonate (250 and 500ppm), and Hydrogen Peroxide (2000 and 4000ppm) in a Recirculating Brine Chiller System.
Treatment Mean Rate of Reduction
(Log CFU/mL per minute)
Average R2
Time (min.) to
Reach ND*
Control 4.5×10⁻⁴ a 0.21 >120
4000ppm HP 0.04 a 0.94 120
2000ppm HP 0.04 a 0.98 >120
250ppm DMDC 0.06 a 0.75 >120
500ppm DMDC 0.06 a 0.90 >120
0.2% CA 0.12 a 0.93 >120
UV + 4000ppm HP 0.16 a 0.74 90
0.5% CA 0.31 a,b 0.97 60
UV + 2000ppm HP 0.32 a,b 0.79 105
UV + 250ppm DMDC 0.32 a,b 0.75 90
UV + 0.2% CA 0.57 b,c 0.97 >120
UV + 0.5% CA 0.79 c 0.97 45
UV 0.87c 0.99 >120
UV + 500ppm DMDC 0.90 c 0.99 60
Means followed by the same letter are not significantly different at the 0.05 level (experiment wise), using Tukey’s HSD Test. *ND = Non Detectable level; the organism did not recover through enrichment.

71
01234567
015
30
45
60
75
90
105
120
Treatment Time (min.)
Listeria Population (Log CFU/ml)
UV+500 DMDC
500 DMDC Control
UV+250 DMDC
250 DMDC Control
UV
Control
Detection Lim
it
ND
Figure 4.2: Inactivation of Listeria monocytogenes through UV alone and combination of UV with DMDC (250 and
500 ppm) treatments in Fresh Brine. ND = Not Detected; the organism did not recover through direct surface plating.

72
01234567
015
30
45
60
75
90
105
120
Treatment Time (min.)
Listeria Population (Log CFU/ml)UV+0.5% CA
0.5% CA Control
UV+0.2% CA
0.2% CA Control
UV
Control
Detection Lim
it
ND
Figure 4.3: Inactivation of Listeria monocytogenes through UV alone and combination of UV with CA (0.2 and 0.5%)
treatments in Fresh Brine. ND = Not Detected; the organism did not recover through direct surface plating.

73
01234567
015
30
45
60
75
90
105
120
Treatment Time (min.)
Listeria Population (Log CFU/ml)
UV+4000 HP
4000 HP Control
UV+2000 HP
2000 HP Control
UV
Control
Detection Lim
it
ND
Figure 4.4: Inactivation of Listeria monocytogenes through UV alone and combination of UV with HP (2000 and 4000
ppm) treatments in Fresh Brine. ND = Not Detected; the organism did not recover through direct surface plating.
ND

74
CHAPTER: V
REDUCING THE NUMBER OF LISTERIA MONOCYTOGENES IN RECYCLED SPENT
CHILL BRINE USING ULTRAVIOLET LIGHT AND ANTIMICROBIALS
Priti Parikh, Robert Williams, Kumar Mallikarjunan, Joseph Marcy, Joseph Eifert
Keywords: Listeria monocytogenes, recycled brine, UV, citric acid, dimethyl dicarbonate, hydrogen peroxide

75
ABSTRACT
The U.S. Food Safety and Inspection Services (FSIS) reported several Listeria recalls in
the last 2 years. These recalls were mainly for various fully cooked, ready-to-eat, or frozen meat
and sausage products. Post-processing contamination of the products in a processing plant has
been identified as one of the major reasons for food contamination with Listeria; brining is one
such post-processing area. This study focused on the reduction of L. monocytogenes in
spent/used brine through the “multiple hurdle technology.” Spent (recycled) brine obtained from
a frankfurter processor was used in the study. Specifically, UV, antimicrobial agents, such as
citric acid (CA), hydrogen peroxide (HP), and dimethyl dicarbonate (DMDC), and their
combinations were used. Results of this study show that the combinations of UV and 2000 ppm
and 4000 ppm HP were the most effective treatments in reducing the Listeria population in a
relatively short time (120 minutes). Both these treatments were found to be more effective than
the treatments that used UV alone and HP alone. Additionally, all other treatments, such as the
combinations of UV and CA (0.2% and 0.5%), and UV and DMDC (250 ppm and 500 ppm)
were comparatively less effective. This may be due to the presence of organic matter in spent
brine, which may have reduced the penetration of UV and availability of antimicrobials for
microbial interaction.

76
INTRODUCTION
Listeria monocytogenes has been primarily associated with food recalls. The U.S. Food
Safety and Inspection Services (FSIS) recently reported 8 Listeria recalls in a 10-month period
starting January 2007; a total of 34 recalls were reported in a 24-month time period starting
2005. These recalls were mainly for various fully cooked, ready-to-eat, or frozen meat products,
and sausage products (25). An estimated cost of food recalls was $15 million in 1985 through
1987 (4). Thomsen el al. (22) measured the sales losses experienced by frankfurter brands
following a recall for L. monocytogenes. Their results indicate that sales of recalled brands
declined roughly 22% after a recall. Furthermore, this organism has about 25% fatality rate (18)
and has also been responsible for several foodborne outbreaks in the past (6-10).
One of the major reasons for food contamination with Listeria is post-processing
contamination of the products in a processing plant. For example, in frankfurter processing
cellulose casing is mechanically peeled off with a knife after cooking and then the cooked
frankfurters are transferred through conveyors. So if the knife, conveyor, or any of the
packaging materials are contaminated with Listeria, then the cooked ready-to-eat frankfurters
may be contaminated with this organism (20, 23). Moreover, this pathogen can survive in
adverse conditions, such as low pH, temperature, water activity, and high salt concentration. It
can, therefore, survive in contaminated ready-to-eat foods. Such a contamination may pose a
high risk as consumers do not cook these products before consumption. Furthermore, the risk of
foodborne listeriosis increases if the contaminated products are exposed to temperature abuse.

77
According to the U.S. Department of Agriculture (USDA), contamination of foods with
L. monocytogenes is a hazard that is likely to occur in all ready-to-eat meat and poultry products
that are exposed to post-lethality processing environment. The FSIS, therefore, issued an interim
final rule to protect consumers from foodborne listeriosis. According to this rule all ready-to-eat
meat manufacturers in the U.S. are required to adopt one of the three alternatives to effectively
control the risks posed by L. monocytogenes (16). These alternatives are the following: (i) the
use of a post-lethality treatment and an antimicrobial agent (or process) to suppress or limit the
growth of this microorganism; (ii) the use of a post-lethality treatment or an antimicrobial agent
(or process) to suppress or limit the growth of this microorganism; and (iii) controlling L.
monocytogenes in the post-lethality environments strictly through sanitary procedures. These
post-lethality processing environments, according to USDA, are the areas into which products
are routed after complete thermal treatments. These areas include slicing, peeling, dicing, re-
bagging, and brining (13).
Larson et al. (17) reported survival of L. monocytogenes in commercial cheese brines
where the concentration of salt (NaCl) ranged from 5.6 to 24.7%. That is, brine can harbor this
organism once contaminated. Several studies have also shown that contamination of ready-to-
eat products increases after brining and the most contaminated sites of the processing plant are
the brining and post-brining areas (2, 14). Thus, it is very important to prevent L.
monocytogenes survival in brines especially when they are recycled.
Chill brine is a concentrated salt solution that is used to quickly cool cooked ready-to-eat
products such as frankfurters, deli meats, fish, cheese, etc., to prevent bacterial growth. Chill
brine is often recycled, which helps reduce the cost of food processing. However, the USDA has
set some regulations on recycling of brine based on the salinity and temperature of brine. Under
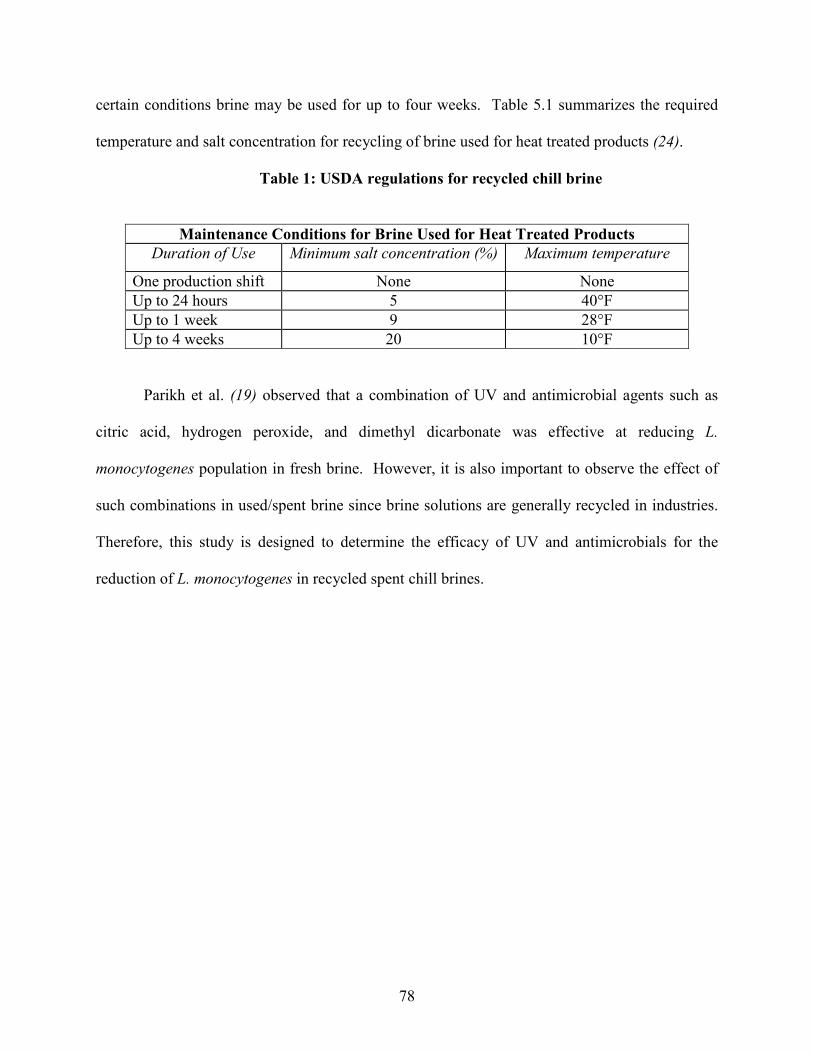
78
certain conditions brine may be used for up to four weeks. Table 5.1 summarizes the required
temperature and salt concentration for recycling of brine used for heat treated products (24).
Table 1: USDA regulations for recycled chill brine
Maintenance Conditions for Brine Used for Heat Treated Products
Duration of Use Minimum salt concentration (%) Maximum temperature
One production shift None None
Up to 24 hours 5 40°F
Up to 1 week 9 28°F
Up to 4 weeks 20 10°F
Parikh et al. (19) observed that a combination of UV and antimicrobial agents such as
citric acid, hydrogen peroxide, and dimethyl dicarbonate was effective at reducing L.
monocytogenes population in fresh brine. However, it is also important to observe the effect of
such combinations in used/spent brine since brine solutions are generally recycled in industries.
Therefore, this study is designed to determine the efficacy of UV and antimicrobials for the
reduction of L. monocytogenes in recycled spent chill brines.

79
MATERIALS AND METHODS
Culture Preparation
The L. monocytogenes strains that were used in this study were obtained from the culture
collection at the Department of Food Science and Technology, Virginia Polytechnic Institute and
State University. Cocktail of Scott A, V7, and L-CDC were used and each strain was confirmed
prior to use. Following method was used for strain confirmation: three tubes of 10 mL of
TSBYE (trypic soy broth supplemented with 0.6% yeast extract) was inoculated with a loopful
(10 µL) of each strain stock culture and incubated at 35°C for 24 hours. The culture then was
streaked onto Modified Oxford (MOX) agar (Oxford Medium Base and Modified Antibiotic
Supplement; Difco, Becton, Dickinson and Company, Franklin Lakes, NJ) for isolation and
incubated at 35°C for 48 hours. To obtain a pure culture, single presumptive positive colony was
selected and streaked again on MOX agar plate and was incubated at 35°C for 24 hours. The
isolate then was confirmed using API Listeria strip. After verification of each strain, the
confirmed colony of L. monocytogenes was transferred from MOX to 25 mL of sterile TSBYE
and stock cultures were prepared, which was used for the remaining studies.
Stock culture Preparation
TSBYE (25 mL) was inoculated with confirmed colony of L. monocytogenes and
incubated for 20-22 hours 35°C. The broth was then centrifuged to obtain pallets. Pallets were
re-suspended in fresh sterile TSBYE broth and an equal part of this resuspended culture was
combined with sterile TSBYE containing 50% glycerol and mixed well. This mixture of culture
was then dispensed in 1-1.5 mL volume in cryules. These cryules were stored at -76°C at the

80
Department of Food Science and Technology. This procedure was used to make stock culture of
each strain, Scott A, V 7, and L-DCD, of L. monocytogenes.
Inoculum Preparation
For inoculum preparation, a loopful of each purified strain (from stock culture) was
transferred to different TSBYE (25 mL) and incubated at 35°C for 20-22 hours. Twenty mL of
each culture was transferred to a centrifuge tube to make final volume of 60 mL. The mixed
culture was then centrifuged, the spent medium was decanted, and the pellet was suspended in 60
mL sterile brine (8% NaCl w/v). Sixty liters of test brine was inoculated with this 60 mL
inoculum to achieve approximately 6 log CFU/mL initial population.
Brine Analysis
Recycled spent brine was obtained from a frankfurter processor after its maximum usage.
Each batch of spent brine (approximately 1000 L) was shipped via refrigerated truck and stored
at 4°C until use. It was analyzed for its initial pH, salt concentration and background micro-
flora. Before adding the inoculum to the brine, a 50 mL brine sample was taken to measure
background micro-flora and salt concentration. For analysis of background micro-flora the
sample was serially diluted using 0.1% peptone, and plated on Tryptic Soy Agar (TSA). Plates
were incubated at 35°C for 48 hours to count the colonies. The salt concentration of brines was
measured using Quantab Chloride Titrators (Hach Chemical Co., Matthews, NC). Moreover,
spent brine was analyzed for total solids and total suspended solids using Standard Methods for
the Examination of Water and Waste Water as mentioned below:

81
Analysis of Total Solids (TS)
For Total Solids (TS) the standard method of water and waste water treatment (2540 B) was
used (11). A specific amount of well-mixed sample was dispensed in a pre-weighed dish. The
sample dish was kept in an oven at around 98°C for some time (approx. 35-40 min) to prevent
splattering while evaporating water from the sample. Then the sample was dried at 103-105°C
until constant weight was achieved. Samples were analyzed in triplicate from each batch of new
spent brine. The total solids can be calculated using following equation:
Mg total solids/L = (A-B) × 1000/ sample volume (mL),
where A = weight of dried residue + dish, mg, and B = weight of dish, mg.
Analysis of Total Suspended Solids (TSS)
Total Suspended Solids (TSS) was measured using the standard method for water and
waste water (2540 D) (11) and was analyzed in triplicate from each batch of spent brine. A well-
mixed sample is filtered through a weighed standard glass-fiber filter and the residue retained on
the filter was dried to a constant weight at 103-105°C. The increase in weight of the filter
represents the total suspended solids that can be calculated using following equation:
Mg total suspended solids/L = (A-B) × 1000/ sample volume (mL),
where A = weight of filter + dried residue, mg, and B = weight of filter, mg.

82
Ultraviolet Water Treatment Unit
An Ultra-Violet Water Treatment Unit (Aquionics Inc., Erlanger, KY), which was used
for the fresh brine study (19) was also used for this research (Figure 5.1). The model number of
the UV treatment unit was AMD 150B/1/2T D. This UV treatment unit is effective with super
cooled water, hot water, poor transmission fluids, such as brine, and high dose situations (1).
The brine was exposed to a peak output of 254nm UV that produced an approximate UV
dose of 53.8mJ/cm2. UV lamp was mounted in a quartz sleeve that was placed in a stainless steel
Figure 5.1: Ultra-Violet Water Treatment Unit

83
chamber so that brine could circulate through all the sides of the lamp. A diameter of the lamp
quartz was 20.5 mm and the arc length was 280 mm. The brine temperature was maintained at
30°F (-1°C) during processing by connecting the UV system (kept in a 4°C laboratory) with an
in-line chiller unit (GCI Icewagon). After the UV exposure, a portion of brine was allowed to
return to a reservoir directly, while the remaining portion was allowed to return to the reservoir
via a chiller. That is, the brine was continually pumped through the UV system during the entire
treatment time.
UV Treatment of Brine
For this entire research, 60 L of brine was used that was kept in brine reservoir and allowed
to circulate until the temperature of brine was reduced to 30°F. Then a 50 ml sample was taken
for analysis of background microflora, pH, and salt concentration. The brine was inoculated
with a cocktail of three L. monocytogenes strains (approximately 6.0 log CFU/mL) and
circulated to mix. The inoculated brine then was exposed to UV for up to 120 minutes with the
flow rate of 198 L/min. Samples (50 mL) were taken at 0, 1, 5, 15, 30, 45, 60, 75, 90, 105, and
120 minutes and analyzed for L. monocytogenes. All the samples were taken in sterile 90 mL
specimen containers (Fisher Scientific, Inc) to avoid sample contamination. To determine the
effect of UV unit, flow rate, and low temperature on survival of L. monocytogenes the inoculated
brine was circulated through the UV system with the lamps turned off that served as control for
all the treatments. After each run, the UV unit was cleaned using HC-10 Chlorinated Kleer-Mor
high foaming caustic cleaner (EcoLab, St. Paul, MN) and sanitized with Ster-Bac Quaternary
Ammonium Sanitizer (200 ppm; EcoLab, St. Paul, MN).

84
Antimicrobial Treatments of Brine
Citric acid (CA, 0.1% and 0.2%), hydrogen peroxide (HP, 2000 ppm and 4000 ppm), and
dimethyl dicarbonate (DMDC, 250 ppm and 500 ppm) were used to treat spent brine. To
produce comparable results, the same concentrations of each antimicrobial that were used for
fresh brine were used for spent brine. Like UV treatment, 50 mL sample of brine was taken
before inoculation to check for pH, salt concentration, and background microflora. The brine
was then inoculated with approximately 6.0 log CFU/mL L. monocytogenes cocktail and
circulated for a minute to mix. A specific concentration of an antimicrobial was then added and
allowed to mix for about a minute. A sample was taken that was named zero-minute sample and
brine was circulated with added antimicrobial for 120 minutes. Samples were withdrawn at
regular intervals.
Combination of UV and Antimicrobial Treatments of Brine
Brine was also treated with combination of UV with each antimicrobial. Once the brine was
inoculated with approximately 6.0 log CFU/mL L. monocytogenes cocktail and antimicrobial
was added as described above (section: Antimicrobial Treatment), a zero minute sample was
taken. Immediately after that the UV was turned on. Brine was exposed to UV and
antimicrobial simultaneously for 120 minutes and samples (50 mL) were withdrawn at regular
intervals.
Microbiological analysis
Samples of test brines were serially diluted using 0.1% peptone and plated on to duplicate
MOX agar plates followed by 48 hours incubation at 35°C. Typical black colonies were

85
considered as presumptive for L. monocytogenes. After incubation, colonies were counted and
results were reported in CFU/mL. An enrichment procedure was also performed to detect the
cells once population reach to detection limit (1.00 log CFU/mL) and are no longer recoverable
by direct plating. For this purpose, 50 mL Brain Heart Infusion (BHI; Difco, Becton Dickinson
and Company, Franklin Lakes, NJ) broth was inoculated with the 10 mL brine sample followed
by 48 hours incubation at 35°C. After 24 hours, a loop-full of culture from BHI was streaked on
MOX plates followed by 48 hours incubation at 35°C. Then, results were reported in presence
or absence of L. monocytogenes in the samples. Typical colonies on MOX were confirmed using
Listeria API.
Statistical Analysis
Each experiment of UV, antimicrobials, and combination of UV and each antimicrobial
were replicated three times. Results of direct plating generated quantitative data that were
analyzed using JMP statistical software version 6.00 (SAS Institute; Cary NC). Using regression
analysis of these data, rates of L. monocytogenes reduction in brines were calculated for each
treatment. Since the regression analysis was performed on each replication of all the treatments,
there are more than one statistical models of this study. An example of these models for one of
the treatments used in spent brine is described in detail in Appendix C. The mean rate of
reduction was then obtained using one way ANOVA, where the value of α was used as 0.05.
The results of enrichment studies were qualitative that described either presence or absence of L.
monocytogenes in samples. Therefore, they were used to illustrate Time (in minutes) to reach a
non-detectable level in brines, and therefore, the total processing time.

86
RESULTS
The results of total aerobic plate count showed that population of background micro-flora
(aerobic mesophiles) in brine ranged from 1.9 to 4.3 log CFU/mL in different batches. The
average pH of brine was on the acidic side, 5.5, with an average salt concentration of 15.3%. An
average of 171.0 mg/L total solids and 1.0 mg/L total suspended solids were present in brine.
Microbiological Analysis of Brine
Figures 5.2, 5.3, and 5.4 explain the inactivation trend of L. monocytogenes in response to
all the treatments. Table 5.2 provides the comparison of rate of reduction of L. monocytogenes
and total time required (for each treatment) to reduce the number of this pathogen to a non-
detectable level through enrichment.
An average starting L. monocytogenes population for all treatments was 5.8 log CFU/mL
of brine. The slopes of all treatments were negative, which indicates the reduction in population
with time. When brine was treated with UV alone, the population of L. monocytogenes reduced
from 6.0 log CFU/mL to below the detection limit (i.e., 1 log CFU/mL) in 45 minutes (Figure
5.2) with a reduction rate of 0.12 log CFU/mL per minute (Table 5.2). However, L.
monocytogenes population was detectable by enrichment throughout the 120 minute time-period.
When brine was treated with UV+4000 ppm HP and UV+2000 ppm HP, the L.
monocytogenes population decreased from 5.8 log CFU/mL to below the detection limit in 45
minutes (Figure 5.2) with the reduction rate of 0.12 log CFU/mL per minute (Table 5.2).
Moreover, the results of enrichment studies showed that the treatments UV+4000 ppm HP and
UV+2000 ppm HP required 120 minutes to reach a non-detectable level of L. monocytogenes,
whereas all other treatments and control required more than 120 minutes.

87
In general, it was observed that the reduction rate values of a few treatments were not
significantly different than each other. Such treatments can, therefore, be grouped together and
given the same rank. The final ranking, in decreasing order of reduction rate, is as follows: (i)
UV+500 ppm DMDC, UV+4000 ppm HP, UV+2000 ppm HP, UV alone, UV+250 ppm DMDC,
UV+0.5% CA, and UV+0.2% CA; and (ii) 250 ppm DMDC and 500 ppm DMDC, 4000 ppm
HP, 2000 ppm HP, 0.2% CA, 0.5% CA, and Control. Based on the time (in minutes) required to
reach a non-detectable level of L. monocytogenes, the inactivation of L. monocytogenes followed
the order: (i) UV+4000 ppm HP and UV+2000 ppm HP, and; (ii) all other treatments. The
treatments that required more than 120 minutes to reach a non-detectable level were ranked same
since the brine was processed for 120 minutes.

88
DISCUSSION
Brining is one of the prime post-processing areas in food manufacturing where food
contamination is very likely to occur. Moreover, organisms such as L. monocytogenes that can
survive at high salt concentration and low temperature are of a major concern due to its low
infective dose and high fatality rate. Thus, it is very important to process brine particularly when
it is recycled to maintain zero tolerance policy of this pathogen in ready-to-eat food products.
USDA observed that most of the recent recalls of L. monocytogenes are associated primarily
with various fully cooked chicken products, frozen egg rolls, ready-to-eat meat products, and
sausage products. Because brine is used to quickly cool thermally processed RTE products, it is
a potential point in the process where L. monocytogenes contamination may occur. Not much
work has been done on processing of brine to reduce or remove this pathogen. This study
focuses on the use of the “multiple hurdle technology” to reduce the L. monocytogenes
population in spent brine. Specifically, several combinations of UV and antimicrobials, such as
citric acid, dimethyl dicarbonate, and hydrogen peroxide, were used in this study.
This research showed that when spent brine was treated with UV alone it required 45
minutes to achieve around 5.0 log CFU/mL reduction in the population of L. monocytogenes.
This result does not corroborate well with the fresh brine study (19) where UV alone reduced
around 5.0 log CFU/mL listeriae population in less than 15 minutes. This may be due to the
presence of organic matter in spent brine. It is known that the penetration ability of UV light
through liquids is poor, with the exception of clear water (21). As the penetration of UV light
into juices is about 1 mm for absorption of 90% of the light, in general, it is recommended to
have a turbulent flow of liquid during UV processing (15). The penetration ability of UV light

89
depends on the type of liquid, its UV absorption capacity, soluble solids, and suspended matter
present in the liquid. Moreover, a large amount of soluble solids implies lower intensity of UV
penetration in the liquid. Large suspended particles may also block the incidence of light on the
microbial load (5, 21). In a critical review on existing and potential application of UV in food
industry, Bintsis et al. (5) have noted that in distilled water UV radiation at 254 nm would suffer
30% loss in intensity 40 cm below the surface, while sea water would suffer the same loss over
approximately 10 cm. Therefore, a lower penetration of UV in spent brine resulted in lower
reduction of L. monocytogenes population in spent brine compared to fresh brine in a relatively
short time.
On the whole, a combination of UV and HP was found to be the most effective (based on
time required to reduce the population to non-detectable level) in spent brine. This finding is in
accordance with Larson et al. (1999) who also observed that L. monocytogenes survival was
inhibited by ≥ 0.02% HP in recycled cheese brine (with 22.2% salt concentration at pH value of
5.3) (17). In contrast, the same combination of UV and HP was observed relatively less effective
in fresh brine (19). This explains the manner in which changes in pH affect the antimicrobial
activity of HP. The average pH of spent brine, 5.5, was on the acidic side. Baldry (3) studied
the effect of pH on the antimicrobial activity of HP. He showed that 5 ppm HP inhibits the
growth of Pseudomonas aeruginosa at pH 5.0, but 10 ppm is required at pH 6.7, and 50 ppm is
required at pH 8.0. This study also showed that 3% solution of HP killed Bacillus subtilis spores
in 3 hours at pH 5.0. However, the same solution required 6 hours at pH 6.5 and pH 8.0. Thus,
HP shows better antimicrobial activity in acidic pH and slightly lower activity in neutral pH.
However, HP’s overall effectiveness is diminished at alkaline pH (12). Thus, lower pH of spent

90
brine (5.5) than fresh brine (7.1) may have exhibited a positive effect on antimicrobial property
of HP.
Combination of UV with 0.5% CA was not so effective with spent brine (Table 5.2). We
conjecture that this phenomenon was observed because of the presence of organic matter in spent
brine. As mentioned earlier, organic matter hinders UV penetration through spent brine.
Consequently, cells do not receive adequate UV dose, which results in longer processing time to
achieve the same log reduction. Moreover, we also expect some proteins to be present in spent
brine since it was used to process frankfurters. These proteins may have a buffering capacity and
so the same concentration of citric acid would not be able to reduce the pH of spent brine as low
as it would in clean brine. It was observed that the average pH of fresh brine dropped from 7.1
to 2.1 by both 0.5% and 0.2% CA (data not shown). In contrast, the average pH of spent brine
dropped from 5.5 to 3.6 and 4.1 through the addition of 0.5% and 0.2% CA, respectively. Thus,
the combination of lower UV penetration and pH reduction may have reduced the effectiveness
of UV+0.5% CA treatment in spent brine.
In spent brine the reduction rate achieved by UV+500 ppm DMDC was not significantly
different from the UV+4000 ppm HP (Table 5.2). However, the former treatment needed more
than 120 minutes to reach a non-detectable level. Williams et al. (2005) showed that the
combination of ozone with DMDC achieved greater reduction in the population of E. coli
O157:H7 and Salmonella in apple cider compared to orange juice. They reasoned that more
organic matter was present in orange juice than apple cider since the juice was home-style with
added pulp (26). We believe that organic matter present in spent brine reduced the availability of
DMDC for microbial interaction and also reduced the UV penetration. This resulted in lower L.

91
monocytogenes reduction rate and higher treatment time to reach a non-detectable level in spent
brine.
Our research showed that, in general, all treatments were more effective in reducing the
population of listeriae in fresh brine compared to spent brine. This was because the spent brine
contained a lot of organic matter that hindered UV penetration. Moreover, organic matter is also
thought to have a quenching effect on antimicrobials and thus reduced their availability for
interaction with microorganisms. Therefore, the combined effect of low UV penetration and less
availability of antimicrobials resulted in long processing times of spent brine with the
concentrations of antimicrobials used in this study. However, we conjecture that an increase in
the concentration of these antimicrobials with UV may effectively reduce the L. monocytogenes
population in less time.

92
REFERENCES
1. Aquionics Inc. Date, Erlanger, KY, Aquionics Literature. Available at:
http://www.aquionics.com/literature.php Accessed September 2007.
2. Autio, T., Hielm, S., Miettinen, M., Sjoberg, A. M, Aarnisalo, K., Bjorkroth, J., Mattila-
Sandholm, T., Korkeala, H. 1999. Sources of Listeria monocytogenes Contamination in a Cold-
Smoked Rainbow Trout Processing Plant Detected by Pulsed-Field Gel Electrophoresis Typing.
Applied and Environmental Microbiology. 65:150-155.
3. Baldry, M. G. C. 1983. The Bactericidal, Fungicidal and Sporicidal Properties of
Hydrogen-Peroxide and Peracetic-Acid. Journal of Applied Bacteriology. 54:417-423.
4. Bille, J., Catimel, B., Bannerman, E., Jacquet, C., Yersin, M. N., Caniaux, I., Monget, D.,
Rocourt, J. 1992. Api Listeria, a New and Promising One-Day System to Identify Listeria
Isolates. Applied and Environmental Microbiology. 58:1857-1860.
5. Bintsis, T., Litopoulou-Tzanetaki, E., Robinson, R. K. 2000. Existing and potential
applications of ultraviolet light in the food industry - a critical review. Journal of the Science of
Food and Agriculture. 80:637-645.
6. Center for Disease Control and Prevention. 2002. Public health dispatch: Outbreak of
listeriosis, Northeastern United States. p. 51(42): 950.951. In, Morbidity and Mortality Weekly
Report.
7. Centers for Disease Control and Prevention. 1985. Epidemiologic notes and reports
listeriosis outbreak associated with Mexican-style cheese, California. p. 34(24): 357.359. In,
Morbidity and Mortality Weekly Report.

93
8. Centers for Disease Control and Prevention. 1999. Multistate outbreak of listeriosis,
United States. p. 47(51): 1117.1118. In, Morbidity and Mortality Weekly Report
9. Centers for Disease Control and Prevention. 2000. Multistate outbreak of listeriosis,
United States, 2000. p. 49(50): 1129.1130. In, Morbidity and Mortality Weekly Report.
10. Centers for Disease Control and Prevention. 2001. Outbreak of listeriosis associated with
homemade Mexican-style cheese, North Carolina, October 2000-January 2001. p. 50(26):
560.562. In, Morbidity and Mortality Weekly Report.
11. Clescerl, L. S., Greenberg, A. E., Eaton, A. D. (ed.). 1999. Standard Methods for the
Examination of Water and Wastewater -20th Edition. American Public Health Association, New
York, NY.
12. Cords, B. R., Burnett, S. L., Hilgren, J., Finley, M., and Magnuson, J. 2005. Sanitizers:
Halogens, Surface-Active Agents, and Peroxides. p. 507-572. In P.M. Davidson, John N. Sofos,
and A. L. Branen (ed.), Antimicrobials in Foods (Third Ed.) CRC Press, Boca Raton, FL.
13. Food Safety Inspection Services. Date, 2007, Summary of Listeria monocytogenes
Compliance Guideline for Small and Very Small Meat and Poultry plants that Produce Ready-
To-Eat Products. Available at:
http://www.fsis.usda.gov/PDF/LM_Guidelines_for_SVSP_Ready_to_Eat_Products.pdf.
Accessed November, 2007.
14. Greer, G. G., F. Nattress, B. Dilts, and L. Baker. 2004. Bacterial Contamination of
Recirculating Brine Used in the Commercial Production of Moisture-Enhanced Pork. Journal of
Food Protection. 67:185-188.

94
15. Guerrero-Beltran, J. A., and G. V. Barbosa-Canovas. 2005. Reduction of Saccharomyces
cerevisiae, Escherichia coli and Listeria innocua in apple juice by ultraviolet light. Journal of
Food Process Engineering. 28:437-452.
16. Huang, L. 2007. Numerical Analysis of Survival of Listeria monocytogenes during In-
Package Pasteurization of Frankfurters by Hot Water Immersion. Journal of Food Science.
72:E285-E292.
17. Larson, A. E., E. A. Johnson, and J. H. Nelson. 1999. Survival of Listeria monocytogenes
in commercial cheese brines. Journal of Dairy Science. 82:1860-1868.
18. Montville, T. J., Matthews, K. R. 2005. Food Microbiology – An Introduction. American
Society for Microbiology Press, Washington DC.
19. Parikh, P. P., Rob Williams, Joseph Marcy, Joseph Eifert, Kumar Mallikarjunan. 2007.
Efficacy of Ultraviolet Light and Antimicrobials in Reducing the Number of Listeria
monocytogenes in Fresh Chill Brine. In Virginia Polytechnic Institute and State University,
Blacksburg, VA.
20. Romans, J. R., Costello, William J., Carlson, Wendell C. 1994. The Meat We Eat.
Interstate Publishers, Danville, IL.
21. Shama, G. 1999. Ultraviolet light. p. 2208-2214. In R.K. Robinson, Batt, C., and Patel, P.
(ed.), Encyclopedia of Food Microbiology - 3 Academic Press, London, UK.
22. Thomsen, M. R., R. Shiptsova, and S. J. Hamm. 2006. Sales Responses to Recalls for
Listeria monocytogenes: Evidence from Branded Ready-to-Eat Meats. Review of Agricultural
Economics. 28:482-493.

95
23. Tompkin, R. B., V. N. Scott, D. T. Bernard, W. H. Sveum, and K. S. Gombas. 1999.
Guidelines to prevent post-processing contamination from Listeria monocytogenes. Dairy, Food
and Environmental Sanitation. 19:551-562.
24. U.S. Department of Agriculture. Date, 2000, Sanitation performance standards
compliance guide Available at: http://www.fsis.usda.gov/oppde/rdad/frpubs/sanitationguide.htm.
Accessed August, 2007.
25. U.S. Department of Agriculture. 2007. Available at:
www.fsis.usda.gov/FSIS_Recalls/Open_Federal_Cases/index.asp. In, Food Safety and
Inspection Service - Recalls.
26. Williams, R. C., Sumner, S. S., Golden, D. A. 2005. Inactivation of Escherichia coli
O157: H7 and Salmonella in apple cider and orange juice treated with combinations of ozone,
dimethyl dicarbonate, and hydrogen peroxide. Journal of Food Science. 70:M197-M201.

96
Table 5.2: Listeria monocytogenes Inactivation during Ultraviolet Light Treatment of
Used/Spent Brines Containing Citric Acid (0.2 and 0.5%), Dimethyl Dicarbonate
(250 and 500ppm), and Hydrogen Peroxide (2000 and 4000ppm) in a Recirculating
Brine Chiller System
Treatment Mean Rate of
Reduction (Log
CFU/mL per minute)
Average R2 Time (min.)
to Reach ND*
2000 ppm HP Control 5.7×10 -4 a 0.24 >120
0.5% CA Control 0.001 a 0.31 >120
0.2% CA Control 0.002 a 0.96 >120
UV Negative Control 0.002 a 0.44 >120
4000 ppm HP Control 0.004 a 0.48 >120
500 ppm DMDC Control 0.02 a 0.94 >120
250 ppm DMDC Control 0.05 a,b 0.92 >120
UV + 0.2% CA 0.09 b,c 0.96 >120
UV + 0.5% CA 0.11 b,c 0.97 >120
UV+250 ppm DMDC 0.11 b,c 0.99 >120
UV Positive Control 0.12 c 0.94 >120
UV+2000 ppm HP 0.12 c 0.97 120
UV+4000 ppm HP 0.12 c 0.94 120
UV+500 ppm DMDC 0.13 c 0.93 >120
Means followed by the same letter are not significantly different at the 0.05 level using Tukey’s HSD. *ND = Non Detectable level; the organism did not recover through enrichment.

97
01234567
015
30
45
60
75
90
105
120
Treatment Time (min.)
Listeria Population (Log CFU/ml)
UV+4000 HP
4000 HP Control
UV+2000 HP
2000 HP Control
UV
Control
Detection Lim
it
ND
Figure 5.2: Inactivation of Listeria monocytogenes through UV alone and combination of UV with HP (2000 and 4000
ppm) treatments in Spent Brine. ND = Not Detected; the organism did not recover through direct surface plating.

98
01234567
015
30
45
60
75
90
105
120
Treatment Time (min.)
Listeria Population (Log CFU/ml)UV+0.5% CA
0.5% CA Control
UV+0.2% CA
0.2% CA Control
UV
Control
Detection Lim
it
ND
Figure 5.3: Inactivation of Listeria monocytogenes through UV alone and combination of UV with CA (0.2 and 0.5%)
treatments in Spent Brine. ND = Not Detected; the organism did not recover through direct surface plating.

99
01234567
015
30
45
60
75
90
105
120
Treatment Time (min.)
Listeria Population (Log CFU/ml)
UV+500 DMDC
500 DMDC Control
UV+250 DMDC
250 DMDC Control
UV
Control
Detection Lim
it
ND
Figure 5.4: Inactivation of Listeria monocytogenes through UV alone and combination of UV with DMDC (250 and
500 ppm) treatments in Spent Brine. ND = Not Detected; the organism did not recover through direct surface plating.

100
CONCLUSION
Brining is one of the prime post-processing areas in food manufacturing where food
contamination is very likely to occur. Moreover, organisms such as L. monocytogenes that can
survive at high salt concentration and low temperature are of a major concern due to its low
infective dose and high fatality rate. Thus, it is very important to process brine particularly when
it is recycled. Based on “multiple hurdle technology” principle, we processed fresh/unused and
spent/used chill brines using several combinations of UV and antimicrobials, such as citric acid,
dimethyl dicarbonate, and hydrogen peroxide.
Results of fresh brine studies showed that the combination of UV and 500 ppm DMDC
had the highest rate of decline and required a total time of 60 minutes to reduce the population to
a non-detectable level through enrichment. In contrast, UV+0.5% CA had significantly lower
reduction rate than UV+500 ppm DMDC, but was the most effective treatment in terms of
complete destruction of listeriae cells; i.e., cells could not be recovered after 45 minutes even
through enrichment. Overall, a combination of treatments was more effective than any of the
treatments alone except 0.5% CA control, which was almost as effective as UV+0.5% CA. The
lowest processing time to reduce the number of Listeria cells to a non-detectable level via
enrichment was 45 minutes, which was obtained with UV+0.5% CA treatment. Both UV+500
ppm DMDC and 0.5% CA control required 60 minutes to achieve the same result.
Results of spent brine studies showed that the combination of UV with 2000 and 4000
ppm HP, which was one of the least effective treatments in fresh brine, was the most effective
treatment. These treatments obtained the highest rate of decline, which was however lower than
the highest rate of decline obtained in fresh brine with the treatment UV+500 ppm DMDC. The
lowest processing time of brine to reduce the listeriae population to a non-detectable level

101
through enrichment was 120 minutes in spent brine, which was much higher than 45 minutes
when compared to fresh brine.
Our research showed that, in general, all the treatments were more effective in reducing
the population of listeriae in fresh brine than spent brine. This was because the spent brine
contained a lot of organic matter that hindered in UV penetration. Moreover, organic matter is
also thought to have a quenching effect on antimicrobials and thus reduced their availability for
interaction with microorganisms. Therefore, the combined effect of low UV penetration and less
availability of antimicrobials resulted in long processing times of spent brine with the tested
concentration of antimicrobials. However, we conjecture that an increase in the concentration of
these antimicrobials with UV may effectively reduce the L. monocytogenes population in less
time.

102
FUTURE WORK
Brine is very likely to get contaminated with foodborne pathogens, such as L. monocytogenes, if
it is established in plant already. Contaminated brine can pose serious threat of listeriosis
outbreak since this pathogen can survive well in brine. Even though this is an important area in
food safety especially of RTE foods, there is a lack of work in this area. Thus, following are the
main field of research that will enhance our knowledge and may improve current practices of
brine processing in industry.
1. Our work showed that high concentration of organic matter and solids present in spent brine
negatively affect the effectiveness of UV and antimicrobials. One approach to solve this
problem would be filtration of spent brine prior to any treatment. Filtration will reduce the
concentration of solids and other particles present in the spent brine and may improve the
effectiveness of UV and antimicrobials.
2. Efficacy of other non-thermal processes, such as high pressure, pulsed electric field, should
also be determined alone and in combination with antimicrobials or other processes to
process brine. High pressure processing has been shown as an effective mean to reduce the
population of listeriae cells in various media such as buffer with pH value 7.0, liquid whole
egg (pH 8.0), and oysters. Moreover, addition of antimicrobial such as nicin, citric acid, and
lactic acid along with high pressure found to be very effective at reduction of L.
monocytogenes from foods. Thus, this treatment might be promising at reducing the
population of listeriae in brine. Similarly pulsed electric field has also been found effecient
at reducing the listeria population in milk (47).
3. Bacteria adapt to any unfavorable environment that can lead to an increased pathogenisity of
the organism; for example, antibiotic resistant Salmonella. UV has been used for inactivation

103
of various pathogens in wide variety of foods. Since UV affect the DNA of the cell, it might
be possible that sub-lethally UV injured L. monocytogenes cells show higher virulence or
greater resistance to other environmental conditions. Thus, it may be useful to study a
behavior of UV stressed cells in presence of high salt, low pH, low temperature, etc.
4. UV can be effectively used for this purpose if the specific dosage requirement is known.
Therefore, determination of UV dose to remove L. monocytogenes from spent brine is also
important.

104
APPENDIX A: REGRESSION ANALYSES
As mentioned in the Materials and Methods section of Chapter IV, for each treatment, we
conducted three runs, obtained the reduction rates of L. monocytogenes (i.e., slope value), and
the R2 values. We then calculated the mean of the three slope and R2 values. The mean value of
slope and mean R2 values for each treatment are tabulated in Table 1 for fresh brine and Table 2
for spent brine.
This appendix briefly highlights the steps followed during the regression analysis for UV
(one of the several treatments) used for fresh and spent brines in this research.

105
Regression Analysis for 3 replications of UV Negative Control in Fresh Brine
RUN=1
0
1
2
3
4
5
6
7
Log CFU/ml
0 15 30 45 60 75 90 105 120
Time (min)
Linear Fit
Regression Model (Linear Fit)
Log CFU/mL = 5.8611327 - 0.0014887 * Time
Summary of Fit
RSquare 0.609347 RSquare Adj 0.560515 Root Mean Square Error 0.053676 Mean of Response 5.78 Observations (or Sum Wgts) 10
Analysis of Variance
Source DF Sum of Squares Mean Square F Ratio
Model 1 0.03595146 0.035951 12.4785 Error 8 0.02304854 0.002881 Prob > F C. Total 9 0.05900000 0.0077

106
RUN=2
0
1
2
3
4
5
6
7
Log CFU/ml
0 15 30 45 60 75 90 105 120
Time (min)
Linear Fit
Regression Model (Linear Fit)
Log CFU/mL = 5.8887748 + 5.9177e-5 * Time
Summary of Fit
RSquare 0.005942 RSquare Adj -0.11831 Root Mean Square Error 0.034466 Mean of Response 5.892 Observations (or Sum Wgts) 10
Analysis of Variance
Source DF Sum of Squares Mean Square F Ratio
Model 1 0.00005681 0.000057 0.0478 Error 8 0.00950319 0.001188 Prob > F C. Total 9 0.00956000 0.8324

107
RUN=3
0
1
2
3
4
5
6
7
Log CFU/ml
0 15 30 45 60 75 90 105 120
Time (min)
Linear Fit
Regression Model (Linear Fit)
Log CFU/mL = 5.5466158 + 8.0444e-5 * Time
Summary of Fit
RSquare 0.007899 RSquare Adj -0.11611 Root Mean Square Error 0.040597 Mean of Response 5.551 Observations (or Sum Wgts) 10 Analysis of Variance
Source DF Sum of Squares Mean Square F Ratio
Model 1 0.00010498 0.000105 0.0637 Error 8 0.01318502 0.001648 Prob > F C. Total 9 0.01329000 0.8071

108
Regression Analysis for 3 replication of UV Positive Control in Fresh Brine
RUN=1
0
1
2
3
4
5
6
Log CFU/ml
-1 0 1 2 3 4 5 6 7 8 9 10
Time (min)
Limit of Detection
Linear Fit
Regression Model (Linear Fit)
Log CFU/mL = 5.6442857 - 0.8671429 * Time
Summary of Fit
RSquare 0.989558 RSquare Adj 0.979116 Root Mean Square Error 0.333295 Mean of Response 3.91 Observations (or Sum Wgts) 3
Analysis of Variance
Source DF Sum of Squares Mean Square F Ratio
Model 1 10.527114 10.5271 94.7657 Error 1 0.111086 0.1111 Prob > F C. Total 2 10.638200 0.0652

109
RUN=2
0
1
2
3
4
5
6
Log CFU/ml
-1 0 1 2 3 4 5 6 7 8 9 10
Time (min)
Limit of Detection
Linear Fit
Regression Model (Linear Fit)
Log CFU/mL = 5.7333333 - 0.95 * Time
Summary of Fit
RSquare 0.999077 RSquare Adj 0.998155 Root Mean Square Error 0.108012 Mean of Response 3.833333 Observations (or Sum Wgts) 3
Analysis of Variance
Source DF Sum of Squares Mean Square F Ratio
Model 1 12.635000 12.6350 1083.000 Error 1 0.011667 0.0117 Prob > F C. Total 2 12.646667 0.0193

110
RUN=3
0
1
2
3
4
5
6
Log CFU/ml
-1 0 1 2 3 4 5 6 7 8 9 10
Time (min)
Limit of Detection
Linear Fit
Regression Model (Linear Fit)
Log CFU/mL = 5.62 - 0.805 * Time
Summary of Fit
RSquare 0.999884 RSquare Adj 0.999769 Root Mean Square Error 0.032404 Mean of Response 4.01 Observations (or Sum Wgts) 3
Analysis of Variance
Source DF Sum of Squares Mean Square F Ratio
Model 1 9.0723500 9.07235 8640.333 Error 1 0.0010500 0.00105 Prob > F C. Total 2 9.0734000 0.0068

111
Regression Analysis for 3 replication of UV Positive Control in Spent Brine
RUN=1
0
1
2
3
4
5
6
7
Log CFU/ml
-10 0 10 20 30 40 50 60
Time
Limit of Detection
Linear Fit
Regression Model (Linear Fit)
Log CFU/mL = 6.3845255 - 0.1130803 * Time
Summary of Fit
RSquare 0.976123 RSquare Adj 0.968164 Root Mean Square Error 0.377942 Mean of Response 4.236 Observations (or Sum Wgts) 5
Analysis of Variance
Source DF Sum of Squares Mean Square F Ratio
Model 1 17.518399 17.5184 122.6432 Error 3 0.428521 0.1428 Prob > F C. Total 4 17.946920 0.0016

112
RUN=2
0
1
2
3
4
5
6
7
Log CFU/ml
-10 0 10 20 30 40 50 60
Time
Limit of Detection
Linear Fit
Regression Model (Linear Fit)
Log CFU/mL = 6.3935036 - 0.1118686 * Time
Summary of Fit
RSquare 0.956117 RSquare Adj 0.94149 Root Mean Square Error 0.512151 Mean of Response 4.268 Observations (or Sum Wgts) 5
Analysis of Variance
Source DF Sum of Squares Mean Square F Ratio
Model 1 17.144984 17.1450 65.3643 Error 3 0.786896 0.2623 Prob > F C. Total 4 17.931880 0.0040

113
RUN=3
0
1
2
3
4
5
6
7
Log CFU/ml
-10 0 10 20 30 40 50 60
Time
Limit of Detection
Linear Fit
Regression Model (Linear Fit)
Log CFU/mL = 5.7974818 - 0.1256569 * Time
Summary of Fit
RSquare 0.885332 RSquare Adj 0.847109 Root Mean Square Error 0.966395 Mean of Response 3.41 Observations (or Sum Wgts) 5
Analysis of Variance
Source DF Sum of Squares Mean Square F Ratio
Model 1 21.631841 21.6318 23.1624 Error 3 2.801759 0.9339 Prob > F C. Total 4 24.433600 0.0171

114
Regression Analysis for 3 replications of UV Negative Control in Spent Brine
RUN=1
0
1
2
3
4
5
6
7
Log CFU/ml
0 15 30 45 60 75 90 105 120
Time
Linear Fit
Regression Model (Linear Fit)
Log CFU/mL = 6.1113333 - 0.0033556 * Time
Summary of Fit
RSquare 0.683483 RSquare Adj 0.638267 Root Mean Square Error 0.100281 Mean of Response 5.91 Observations (or Sum Wgts) 9
Analysis of Variance
Source DF Sum of Squares Mean Square F Ratio
Model 1 0.15200667 0.152007 15.1157 Error 7 0.07039333 0.010056 Prob > F C. Total 8 0.22240000 0.0060

115
RUN=2
0
1
2
3
4
5
6
7
Log CFU/ml
0 15 30 45 60 75 90 105 120
Time
Linear Fit
Regression Model (Linear Fit)
Log CFU/mL = 5.9844444 - 0.0015 * Time
Summary of Fit
RSquare 0.237263 RSquare Adj 0.128301 Root Mean Square Error 0.118108 Mean of Response 5.894444 Observations (or Sum Wgts) 9
Analysis of Variance
Source DF Sum of Squares Mean Square F Ratio
Model 1 0.03037500 0.030375 2.1775 Error 7 0.09764722 0.013950 Prob > F C. Total 8 0.12802222 0.1836

116
RUN=3
0
1
2
3
4
5
6
7
Log CFU/ml
0 15 30 45 60 75 90 105 120
Time
Linear Fit
Regression Model (Linear Fit)
Log CFU/mL = 5.7155556 - 0.0011111 * Time
Summary of Fit
RSquare 0.40366 RSquare Adj 0.318468 Root Mean Square Error 0.059308 Mean of Response 5.648889 Observations (or Sum Wgts) 9
Analysis of Variance
Source DF Sum of Squares Mean Square F Ratio
Model 1 0.01666667 0.016667 4.7383 Error 7 0.02462222 0.003517 Prob > F C. Total 8 0.04128889 0.0660

117
VITA
Priti Parikh was born and raised in Surat (Gujarat, India). In May 2002 she received the Masters
of Science (M.Sc.) degree in Microbiology from Sardar Patel University, Anand (Gujarat,
India). She worked as a Product Executive with Span Diagnostics Ltd. before joining the
Department of Food Science and Technology at Virginia Tech. as a Ph.D. student in Spring
2005. Under the guidance of Robert C. Williams, Ph.D., she initiated research in the area of Food
Microbiology, and completed this research in Fall 2007. She has presented her research at IAFP
conference in 2006 and 2007. During her stay at Virginia Tech, Priti served as teaching and
research assistants for the department, and led/participated in various national level product
development competitions.