Effects of Visual Cueing on Beginner Problem Solvers in Physics
Running head: EFFECTS OF VISUAL CUEING ON BEGINNER PROBLEM 1
Effects of Visual Cueing on Beginner Problem Solvers in Physics
Tanner Stevens2, Adrian Madsen
1, Adam Larson
1, Elizabeth Gire, Lester Loschky
1 and N.
Sanjay Rebello1
1Kansas State University
2University of Minnesota
3University of Mephis

Running head: EFFECTS OF VISUAL CUEING ON BEGINNER PROBLEM 2
Abstract
Previous research suggests that manipulating learners’ eye movements may affect cognitive
processing. This study builds on a previous study by investigating problems that were found to
have large differences in eye-movements between beginner problem solvers and expert problem
solvers. In this study, beginner physics problem solvers were asked to solve problems with
highly visual components, adapted from our previous study (Carmichael 2010). If students gave
an incorrect answer and/or verbal explanation for their answer, they were shown scaffolding
problems. In each scaffolding problem, students in the treatment group were cued to look at
colored shapes overlaid on the problem diagram that moved in some pattern. Students in the
control group viewed the problem diagram with no overlays. Cues were designed to direct
attention to relevant areas of the problem. After a given number of scaffolding problems,
students were shown a transfer problem which assessed conceptual understanding of the material
tested in that problem set. After the initial, scaffolding, and transfer problems, students were
asked to give a verbal explanation of their answer. We found that students performed better on
later problem sets after receiving cueing, and a larger number of students answered the
scaffolding problems with correct explanations in the cued group. Students who received cueing
also changed their explanations more often and were more likely to mimic the cueing sequence
on similar problems. Future work is needed to test these ideas for larger numbers of students.

EFFECTS OF VISUAL CUEING ON BEGINNER PROBLEM SOLVERS 3
Background and Introduction
Previous research has suggested that manipulating learners’ eye movements may influence
their cognitive processing (Grant, 2003; Thomas & Lleras, 2007) and that cognitive processes
may be affected by directing eye movements (de Koning, 2007, 2010). Specifically, previous
research has shown correlation between eye movements in “thematically relevant” (TR) areas of
a problem diagram and higher problem solving accuracy; similarly, looking at “perceptually
salient” (PS) areas that are not meaningful to the problem correlate to lower problem solving
accuracy (de Koning 2007). Perceptually salient areas are features of the diagram which are
initially most noticeable, or in other words those that draw attention via bottom up processes.
Thematic relevant areas are portions of the diagram that contain visual information required for
the problem solution. Carmichael (2010) has shown that among students solving visually-based
physics problems, students who chose the correct answer looked at the TR areas of the problem
more frequently, and students choosing incorrect answers looked at the PS areas of the problem
more frequently.
This exploratory study builds on Carmichael’s (2010) study by using four problems from that
study which showed the greatest difference in percentage of eye-fixations in PS and TR areas
between correct and incorrect problem solvers. In this study we add visual cues that move in a
pattern related to the problem solution. Addition of visual cues has improved problem solving
speed and correctness on Dunker’s radiation problem, an insight problem, (Grant, 2003; Thomas
& Lleras, 2007), but has not been tested in the domain of physics.
We investigated the application of this idea to introductory physics problems. We compared
the effect of providing scaffolding using isomorphic problems with and without cueing of TR
areas of the problem. Specifically we seek to determine how visual attentional cueing affects the

EFFECTS OF VISUAL CUEING ON BEGINNER PROBLEM SOLVERS 4
likelihood of correctly answering the transfer problem, the number of scaffolding problems
needed before proceeding correct solution, the quality and correctness of verbal explanations
provided for solving the problems, and the scan path of the eye movements of students after
viewing cued isomorphic problems.
Design and Method
Experimental Design
The volunteers recruited for this study were either previously or currently enrolled in an
introductory physics course. Volunteers first completed a survey to assess their prior physics
knowledge of concepts relevant to problems used in this study. Only those students whose
survey responses indicated knowledge of the concepts used in the study were chosen to
participate. The chosen participants were divided into two groups: cued (N=8) and non-cued
(N=7).
Students in both groups were asked to solve four sets of problems with highly visual
components, adapted from our previous study (Carmichael, 2010). In each set, students
answered an initial problem and provided a verbal explanation for their reasoning. The initial
problem in each of the four problem sets was identical to the problems in our previous study. If
the student answered the initial problem incorrectly or provided an incorrect verbal explanation,
they were presented a scaffolding problem which was isomorphic to the initial problem in that it
had an identical problem statement but a different diagram as illustrated in Figure 1.
Students in the cued group were asked to follow colored shapes overlaid on the scaffolding
problem as they moved across the screen in one seconds intervals. The motion of these colored
shapes was based on results of our previous study (Carmichael, 2010). Care was taken to make
sure that cueing did not only occur near the area with the correct solution, but across several

EFFECTS OF VISUAL CUEING ON BEGINNER PROBLEM SOLVERS 5
areas relevant to the correct conceptual understanding of the problem. This was done to avoid
cueing students to only the correct answer, rather to cue them to the right concept without
explicitly indicating the answer. After answering the problem, students were asked to provide an
explanation.
Students in the non-cued group were shown the same sequence of scaffolding problems, but
without any colored shapes overlaid on the problems. They too were asked to provide their
answer and reasoning for each problem. In other words, students in the non-cued group
experienced exactly the same problems as the cued group, except they did not receive any visual
cueing.
In both the cued and the non-cued group, if the student answered a scaffolding problem correctly
and provided correct reasoning, they were presented with the transfer problem. Conversely, if
the student answered a scaffolding problem incorrectly or provided an incorrect explanation they
were presented with another scaffolding problem. This sequence was repeated until a maximum
of three scaffolding problems had been presented. After that a transfer problem was presented,
regardless of whether the student had answered the third scaffolding problem correctly. The
flowchart shown in Figure 2 depicts this decision tree for one problem set for either the cued or
non-cued condition. Throughout the problem solving process, students' eye movements were
tracked using an EyeLink 1000 eye tracker, to both verify that the cued participants were
following cues and to compare the eye movements of the cued and non-cued groups.
Individual Problem Set Design
Each set of problems used was derived from an initial problem taken from our previous
study (Carmichael, 2010). The scaffolding problems in each set were used to target common
misconceptions with the concept presented. The transfer problem in each set contained a slightly

EFFECTS OF VISUAL CUEING ON BEGINNER PROBLEM SOLVERS 6
different context than the initial and scaffolding problems, and aimed to test the depth of the
student's knowledge on the concept.
The first problem set involved two roller coaster carts of the same mass traveling down
frictionless tracks as shown in Figure 3. Both carts start and end at the same height, but the hills
along each track differed in both height and width. Further, there were different numbers of hills
on each track. The problem asked the students to compare the final speeds of the two carts, if
both carts started from rest. The multiple-choice options provided to the student consisted of the
first cart (A) traveling faster, the second cart (B), traveling faster, both carts ending with the
same speed, and an option for ‘not enough information.’
Each scaffolding problem associated with the aforementioned initial problem contained
an identical problem statement and multiple-choice answers. The scaffolding problems differ
only in the shape of track presented. The differences between the tracks in each scaffolding
problem targeted commonly encountered misconceptions. For example, one scaffolding problem
showed two tracks that travel to the same minimum height, but contain a different number of
bumps, while another problem contained two tracks that are identical in their height at each point
and contain the same number of bumps but differ in total horizontal length traveled.
The cueing process in these scaffolding problems was designed to help students attend to
the thematically relevant regions in the diagram, or in other words, the regions of the diagram
that contained the information necessary to answer the question. In the roller coaster problem,
students needed to attend to the initial and final heights of Cart A and Cart B. Colored circles
were overlaid on the problem image, flashing first between the initial positions of Cart A and
Cart B, then the final positions of Cart A and Cart B. This pattern of eye-movement is similar to
the observed patterns in our previous study (Carmichael, 2010).

EFFECTS OF VISUAL CUEING ON BEGINNER PROBLEM SOLVERS 7
After completing the scaffolding problems, students were given a transfer problem. The
roller coaster transfer problem contained the same problem statement and answers, but differed
in the type of track displayed. In the initial problem, initial and final heights of Carts A and B
were all identical, while in the transfer problem, Carts A and B still have the same starting and
end elevation, but the change in elevation was non-zero. This transfer problem aimed to test the
student’s understanding of conservation of energy in a slightly different context than the initial
and scaffolding problems.
The second problem set involved two balls rolling along two separate flat paths, one path
located above the other (Fig. 4, left). The position of each ball was shown on the diagram at one-
second intervals, creating a freeze frame diagram. The students were asked to determine the
time at which both balls were moving at the same speed. Six multiple-choice answers were
provided, ranging over the time period displayed in the diagram up to 0.5 second accuracy.
Each scaffolding problem depicted the same two flat tracks with balls shown at one-
second time intervals as the initial problem, though the exact position of the balls on each track
differed between problems. Each scaffolding problem contained the same problem statement as
the initial problem, but contained different answer choices due to the differing positions of the
ball in each of the scaffolding problems. Efforts were made to ensure the interval over which the
balls traveled the same distance were not directly above or below each other, to test better
conceptual understanding of the concept of speed.
The cueing process for these problems involved colored squares overlaid on the problem
behind the ball at various times. The cues moved, for example, from 1s to 2s on Ball A, then to
1s and 2s on Ball B, then from 2s to 3s on Ball A, etc. This ordering was chosen due to evidence

EFFECTS OF VISUAL CUEING ON BEGINNER PROBLEM SOLVERS 8
from our previous study that correct problem solvers compared the distances between adjacent
balls on track A to those at the same time on track B (Carmichael, 2010).
The transfer problem in this set showed a similar problem situation, but dealt with
vertical motion instead of horizontal motion. The problem statement introduced Ball A in an
elevator traveling downward at constant velocity, while Ball B fell freely from an adjacent
building’s rooftop, and both Ball A and B were dropped at the same time.
The third problem set involved a skier traveling down a hill with a changing slope (Fig. 4,
right). The slope had three different constant values. The different slopes varied in vertical
distance and horizontal distance covered, and therefore varied in steepness. The student was
asked to rank the skier’s change in potential energy as he traveled down each slope. To assist
with this problem, a vertical bar on the edge of the diagram helped to show the amount of
vertical displacement over each slope.
The scaffolding problems depicted different values for the three slopes on the hill.
Efforts were made to adjust the steepness and vertical displacement in different combinations to
test the understanding of the factors affecting potential energy. The shape of each hill was
notably different, to determine the effect of this perceptually salient feature of the problem.
The cueing in this problem draws the student’s attention to the vertical displacement for
slope. A colored square would flash between the starting elevation of one slope and the ending
elevation of that slope twice, then move to the next slope and repeat this process. This was
intended to bring the student’s attention to the vertical displacement of each slope, rather than the
steepness of the slope on the other side of the screen.
The transfer problem for this set involved a ball traveling in parabolic motion. Three
portions of the ball’s motion were noted, A-C, and students were asked to rank the change in

EFFECTS OF VISUAL CUEING ON BEGINNER PROBLEM SOLVERS 9
potential energy over each of these segments. This different context expanded on the previous
understanding by now incorporating positive and negative changes in the potential energy.
The last problem set showed a distance vs. time graph with two lines on it representing
the motion of two different objects (Fig. 5). One object was moving at a constant speed, while
the speed of the second object was changing. There was one point on the graph where the lines
representing the object’s motion intersected. The students were asked to determine the point at
which both objects are traveling at the same speed. Five points (A-E) were labeled on one
object’s graph, with at least one point where the two graphs intersect. The student then chose
from one of the five points (Answers 1-5) or chose that the objects were moving the same speed
at all points (Answer 6).
Similar to the initial problem, each scaffolding problem contained one object that moved
at a constant velocity, depicted with a line of constant slope in the graph, while the other object
had a changing velocity, depicted with a line with changing slope. The scaffolding problems also
contained at least one intersection point between the lines representing the motion of the two
objects. The scaffolding problems provided the same problem statement answer choices as the
initial problem. The difference between the initial and scaffolding problems was the specific
motion of the two objects.
The cueing process in these problems involved a small circle flashing at the position of
each answer choice on the line on the graph depicting changing velocity. The circles were
flashed in the shape of the tangent line at the point of each answer choice. The circles flashed
back and forth twice on each point surrounding the correct answer. It has been found that
experienced problem solvers judge the slope of the changing velocity line and compare it to the
slope of the constant slope line. The cue in the shape of the slope was created to mimic this.

EFFECTS OF VISUAL CUEING ON BEGINNER PROBLEM SOLVERS 10
The transfer problem for this set again showed a distance vs. time graph for two objects.
This problem showed one object with a constant velocity, while the other object’s motion was no
longer a smooth curve but a piecewise function consisting of several segments, each with a
constant slope. Of the five points denoted on the graph, three were at intersection points of the
two lines, while the other two were at points when both objects had a constant zero velocity.
Analysis and Findings
Analysis
A total of 15 students (8 cued, 7 non-cued) participated in the study. Participants’ verbal
explanations were coded for the concepts used to solve the problem. A phenomenographic
approach (Marton, 1986) was used to code these responses. Four kinds of analysis were
completed.
1. Performance on Transfer Problem: We compared the number of students in the cued group
versus the non-cued group who changed from incorrect answers or explanations for the
initial problem to correct answers and explanations for the transfer problem.
2. Number of Scaffolding Problems Needed: We compared the average number of scaffolding
problems students in the cued group versus the non-cued group were presented before they
answered the scaffolding problem correctly with a correct explanation and were presented
with the transfer problem.
3. Changes in Verbal Explanations: We compared the correctness of students’ explanations in
the cued and non-cued conditions and how many times the students changed the concept
they used in both the cued and non-cued condition.

EFFECTS OF VISUAL CUEING ON BEGINNER PROBLEM SOLVERS 11
4. Eye Movements after Cueing: We compared the students' fixation time on the relevant
areas of the problem in the cued and non-cued groups, as well as the number of transitions
that mimic the cueing sequence.
Performance on Transfer Problem
We compared the accuracy of responses to the transfer problem in the cued and non-
cued groups. We found that the cued group gave the correct answer with correct reasoning more
often (34% vs. 26%) than the non-cued group. The percentage of students who answered the
transfer problem correctly in each problem set is shown in Figure 6. The non-cued group
answered transfer problems in sets 1 and 2 correctly more often than the cued group, whereas the
cued group answered transfer problems in sets 3 and 4 correctly more often than the non-cued
group. The non-parametric Fisher’s exact test indicated no statistically significant difference in
performance on any of the transfer problems between the cued and non-cued group.
We see evidence of the cued group outperforming the non-cued group on the transfer
problem, though the small numbers of students tested resulted in no statistical significance. The
data does reveal an interesting trend. As students progressed through various problem sets, the
cued group was more likely to answer the transfer problem correctly, while those in the non-cued
group were less likely to answer the transfer problem correctly. In other words, the results
suggest a cumulative effect of cueing. It appears that overall participants in the cued groups
were improving in their response to the cueing, even though each problem set covered a different
concept.
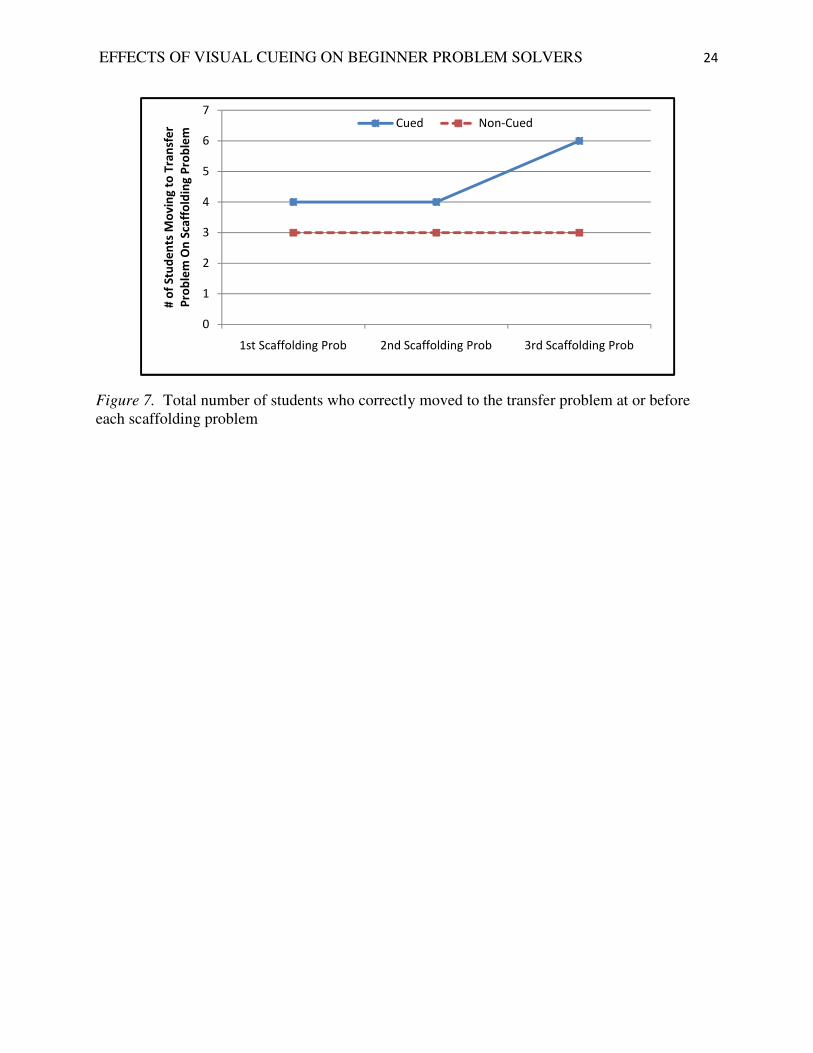
Number of Scaffolding Problems Needed
To investigate how many scaffolding problems participants needed to solve before
moving to the transfer problem we analyzed only the data from participants who provided an

EFFECTS OF VISUAL CUEING ON BEGINNER PROBLEM SOLVERS 12
incorrect explanation for the initial problem. There were a total of six (6) cued participants
changing to the right explanation of a problem, and three (3) instances of non-cued participants
changing to the correct explanation. The data shown in Figure 7 is aggregated over all four
problem sets. Figure 7 shows the total number of participants who gave a correct answer and
explanation at or before each scaffolding problem and thus proceeded to the transfer problem.
From Figure 7 it is clear that participants in the cued group were more likely to correctly answer
the scaffolding problem and thus move to the transfer problem.
Changes in Verbal Explanations
We also analyzed each participant’s verbal explanations. While conducting interviews,
there was a noticeable difference between the two groups in their explanations of their problem
solutions. Participants in both groups stated that they were unsure of their answers, but
participants in the non-cued group did not change their previous reasoning as frequently. For
example, many students in the cued group made statements such as, “Maybe [my first answer]
wasn’t right”, or “That one threw my last rationale out the window.”
By coding verbal responses and categorizing the explanations used in solving these
problems, we investigated whether the cueing condition caused participants to change existing
explanations more than the non-cued condition. Using a phenomenographic approach (Marton,
1986), each participant’s answers to each problem were categorized into different explanations
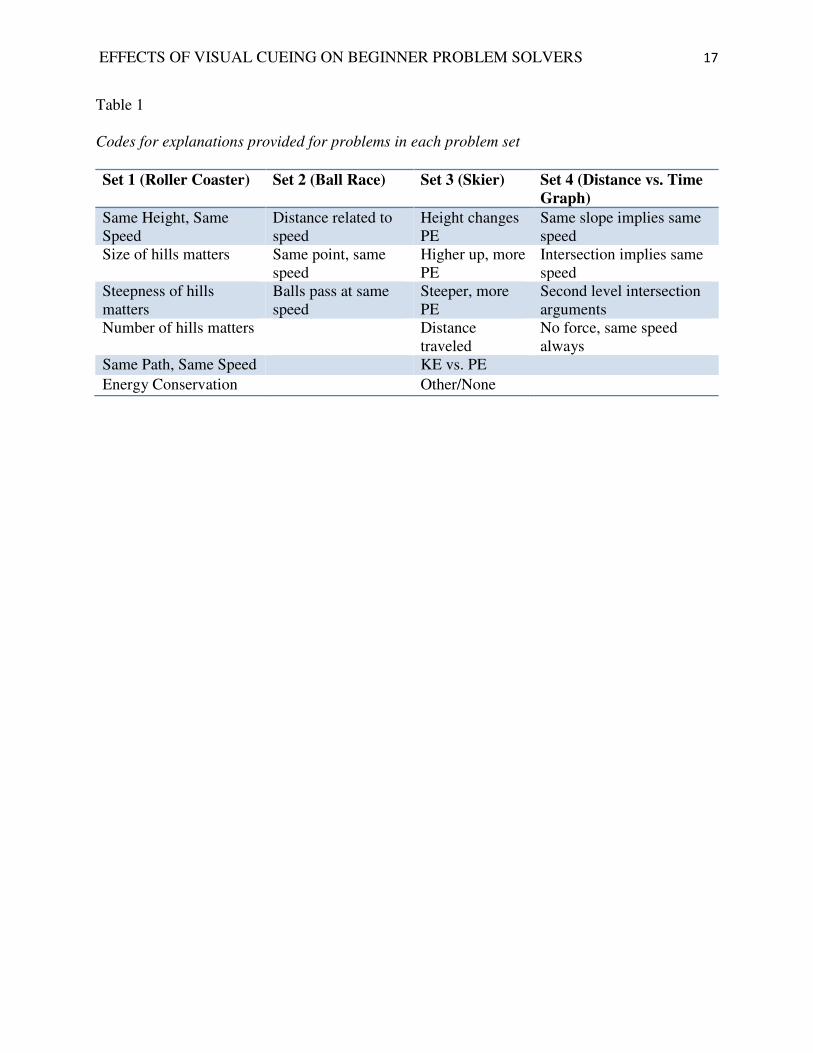
provided in solving the problem. Table 1 shows the codes for the explanations in each problem
set. The codes were categorized primarily by the common misconceptions in each of the
problem sets. In Problem Set 1 (Fig. 3), the features of each track are the perceptually salient
parts of the problem. Many students based their explanations on various features in the track,
such as the height, steepness, or number of hills. The correct conceptual understanding of this

EFFECTS OF VISUAL CUEING ON BEGINNER PROBLEM SOLVERS 13
problem would involve explaining how energy is conserved or that the carts start and end at the
same heights and therefore must be going the same speed at the end. The correct explanation in
Problem Set 2 (Fig. 4, left) involved relating the distance traveled by the ball over a time interval
to its speed. Common incorrect explanations included reasoning that the balls were traveling the
same speed when their positions matched up or when one passes the other. In Problem Set 3
(Fig. 4, right), a correct explanation would determine that the change in height is what
determines the change in potential energy. Incorrect explanations included relating the slope,
overall height, or distance traveled to the potential energy. In Problem Set 4 (Fig. 5), the correct
explanation would relate the slope of the graph to the object's speed, while incorrect explanations
regarded intersection as matching speeds. As shown in Figure 8, we found that the average
number of changes in explanations provided in going from one scaffolding problem to the next
was higher in three of the problem sets (Problem Sets 2, 3 and 4). Although a Mann-Whitney
test indicates that these results are not statistically significant, they seem to suggest that
participants that were provided visual cues are more inclined to change their initial explanations
about the problem, while participants that are not being cued were not as likely to change their
initial explanations about the problem.
Eye Movements after Cueing
To assess the effect of visual cueing on students' subsequent eye-movements, we
compared the percentage of fixations in the areas of interest on the initial problem of the first
problem set (Fig. 3, top). Students in the cued group fixated on the track for an average of
27.2% of their total viewing time on the problem, while students in the non-cued group fixated
on the track for an average of 29.9% of the total viewing time. A Mann-Whitney U test of the
percentage of fixation time showed no significant differences at the α=.05 level, indicating

EFFECTS OF VISUAL CUEING ON BEGINNER PROBLEM SOLVERS 14
minimal differences between students' initial eye movements between the two groups. We also
analyzed eye movements on the transfer problem in this problem set to determine whether cueing
had an effect on the students' eye movements compared to the non-cued group. Students who
correctly answered the initial problem with a correct explanation, who therefore saw no
scaffolding problems, were discarded from this analysis. This left seven (7) students from the
cued group who saw scaffolding problems and four (4) students in the non-cued group. Using
the same areas of interest, we compared the number of transitions between Track A and Track B,
mimicking the visual cue presented in this problem set. We found that students in the cued
group transitioned from Track A to Track B an average of 9.71 times while solving the transfer
problem, whereas students in the non-cued group transitioned an average of 6.25 times. A
Mann-Whitney U test again showed no significant difference in the number of transitions at the
α=.05 level. Even though the results show no statistical significance, the data suggest that cueing
students’ eye-movements in a certain sequence impacts their eye-movements on subsequent
similar problems.
Conclusions and Implications
Our results show that students who were cued were more likely than the non-cued students to
answer the transfer problem correctly. A larger number of students in the cued group, compared
to the non-cued group proceeded to answer the scaffolding problems correctly before proceeding
to the transfer problem. Our results also showed that students who were provided visual cues to
solve the problems were more likely to change their verbal explanations for solving the problem.
Our results show that students who were cued were more likely to mimic the cueing sequence
eye-movements on subsequent similar problems.

EFFECTS OF VISUAL CUEING ON BEGINNER PROBLEM SOLVERS 15
It is important to keep in mind that these trends may be solely due to the effect of showing a
moving colored shape over the thematically relevant areas and not due to the embodiment of the
correct solution. An important limitation of this pilot study is the small number of participants.
Future work is needed to test these ideas for larger numbers of students.
As the use of multimedia becomes more prevalent in science teaching, it is important to
understand how visual media influences students’ learning. As educators and researchers we
must seek the optimal way to present such media to facilitate students’ constructing scientifically
correct understanding. When personal guidance from a human tutor or facilitator is not
available, directing a student’s eye movements can be a crucial factor in altering students’ pre-
existing thinking and facilitating students’ construction of new, more scientifically accurate
ideas. This study builds on previous research to explore the value of attentional cueing for
solving physics problems, and can potentially impact teaching and learning in the future.

EFFECTS OF VISUAL CUEING ON BEGINNER PROBLEM SOLVERS 16
References
Carmichael, A., Larson, A., Gire, E., Loschky, L., & Rebello, N. S. (2010). How does visual attention
differ between experts and novices on physics problems? AIP Conference Proceedings, 1289(1),
93-96.
de Koning, B.B., Tabbers, H., Rikers, R., & Paas, F. (2007). Attention guidance in learning from a
complex animation. Applied Cognitive Psychology, 21, 731-746.
de Koning, B.B., Tabbers, H., Rikers, R., & Paas, F. (2010). Attention guidance in learning from a
complex animation: Seeing is understanding?. Learning and Instruction, 20(2), 111-122.
Grant, E. R. (2003). Eye movements and problem solving. Psychological Science, 14(5), 462.
Marton, F. (1986). Phenomenography - a research approach to investigating different understandings
of reality. Journal of Thought, 21(3):28-49.
Thomas, L, & Lleras, A. (2007). Moving eyes and moving thought: on the spatial compatibility
between eye movements and cognition. Psychonomic Bulletin & Review, 14(4), 663-668.
EFFECTS OF VISUAL CUEING ON BEGINNER PROBLEM SOLVERS 17
Table 1
Codes for explanations provided for problems in each problem set
Set 1 (Roller Coaster) Set 2 (Ball Race) Set 3 (Skier) Set 4 (Distance vs. Time
Graph)
Same Height, Same
Speed
Distance related to
speed
Height changes
PE
Same slope implies same
speed
Size of hills matters Same point, same
speed
Higher up, more
PE
Intersection implies same
speed
Steepness of hills
matters
Balls pass at same
speed
Steeper, more
PE
Second level intersection
arguments
Number of hills matters Distance
traveled
No force, same speed
always
Same Path, Same Speed KE vs. PE
Energy Conservation Other/None

EFFECTS OF VISUAL CUEING ON BEGINNER PROBLEM SOLVERS 18
Figure 1. (From top to bottom) Panel 1: Example of an initial problem, panel 2: scaffolding
problem without cues, panel 3 & 4: scaffolding problem with cues.

EFFECTS OF VISUAL CUEING ON BEGINNER PROBLEM SOLVERS 19
Figure 2. Flow chart for the experimental design. This sequence is repeated for each problem
set.
Initial
Problem
Correct
?
1st
Scaffolding
Problem
Transfer
Problem
Correct
?
2nd
Scaffolding
Problem
Correct
?
3rd
Scaffolding
Problem
Correct
?
Y Y Y Y
N N N N

EFFECTS OF VISUAL CUEING ON BEGINNER P
Figure 3. (From top to bottom) Initial
problems, and transfer problem from
CUEING ON BEGINNER PROBLEM SOLVERS
(From top to bottom) Initial problem with areas of interest, three scaffolding
problems, and transfer problem from first problem set.
20
scaffolding

EFFECTS OF VISUAL CUEING ON BEGINNER PROBLEM SOLVERS 21
Figure 4. (From top to bottom) Initial problem, three scaffolding problems, and transfer problem
from the second problem set (left) and third problem set (right).

EFFECTS OF VISUAL CUEING ON BEGINNER PROBLEM SOLVERS 22
Figure 5. (From top to bottom) - Initial problem, three scaffolding problems, and transfer
problem from the fourth problem set.

EFFECTS OF VISUAL CUEING ON BEGINNER PROBLEM SOLVERS 23
Figure 6. Percentage of participants who provided a correct answer and explanation for the
transfer problem in each problem set.
0%
10%
20%
30%
40%
50%
60%
70%
Transfer Problem
in Set 1
Transfer Problem
in Set 2
Transfer Problem
in Set 3
Transfer Problem
in Set 4
% C
orr
ect
An
swe
r &
Ex
pla
na
tio
n Cued Non-Cued
EFFECTS OF VISUAL CUEING ON BEGINNER PROBLEM SOLVERS 24
Figure 7. Total number of students who correctly moved to the transfer problem at or before
each scaffolding problem
0
1
2
3
4
5
6
7
1st Scaffolding Prob 2nd Scaffolding Prob 3rd Scaffolding Prob
# o
f S
tud
en
ts M
ov
ing
to
Tra
nsf
er
Pro
ble
m O
n S
caff
old
ing
Pro
ble
m
Cued Non-Cued

EFFECTS OF VISUAL CUEING ON BEGINNER PROBLEM SOLVERS 25
Figure 8. The average number of changes in explanation per student per problem set. The error
bars are the standard error.
0.00
0.50
1.00
1.50
2.00
2.50
3.00
Problem Set 1 Problem Set 2 Problem Set 3 Problem Set 4
Av
era
ge
# o
f C
ha
ng
es
in E
xp
lan
ati
on
pe
r
Stu
de
nt
Cued Group Non-Cued Group