
Effects of the Continuous Trial System on Litigation Time...
28
Report on the Effects of the Continuous Trial System on Litigation Time and Output in the National Capital Region Submitted to the Supreme Court by the Institute of Judicial Administration U.P. Law Center Diliman, Quezon City 1990
Transcript of Effects of the Continuous Trial System on Litigation Time...

Report
on the
Effects of the Continuous Trial System on Litigation Time and Output in the
National Capital Region
Submitted to the
Supreme Court
by the
Institute of Judicial Administration U.P. Law Center
Diliman, Quezon City
1990
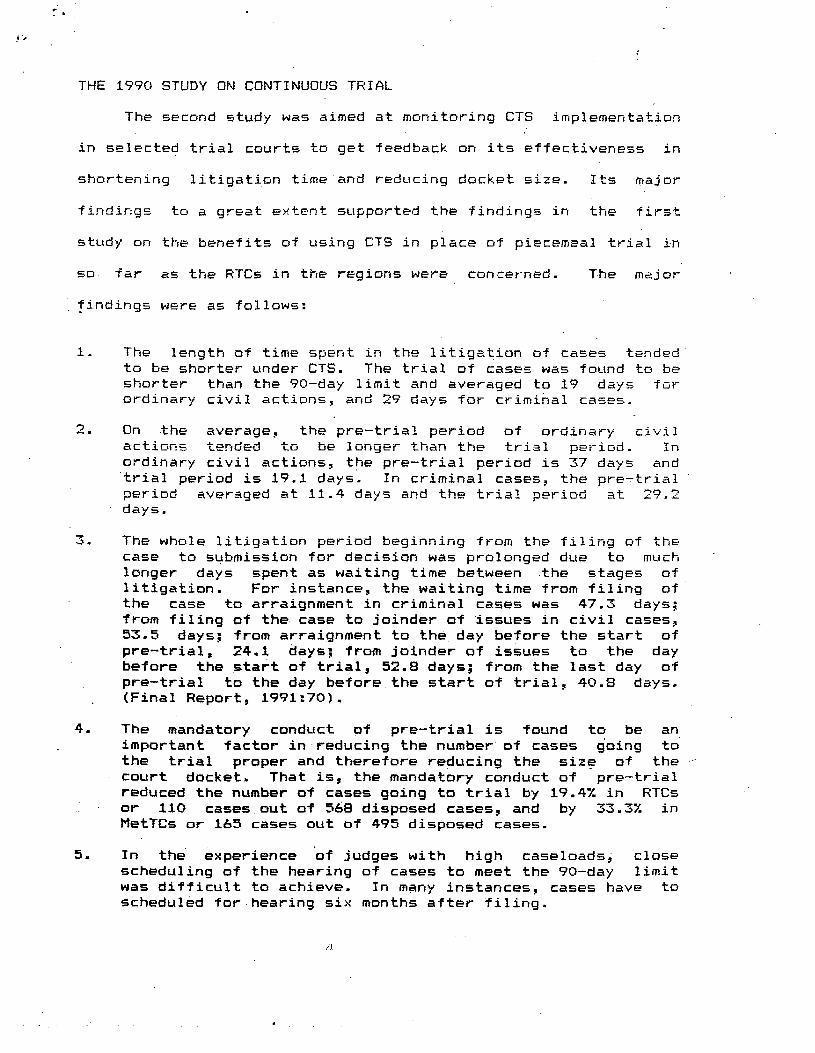
Continuous trial was envisioned as a "mode of judicial fact-
finding and adjudication conducted with speed and dispatch so
that trial are held on scheduled dates withaut needless
postponements, the factual issues for trial well defined at pre-
trial, and the whole proceeding5 terminated and ready for
judgement within 90 days f.rom the date of initial hearing."
(Circular yo. l-69, dated January 19, 3.989). Initially, it was
intended- to cure the deficiencies of the piecemeal trial system
described as follows:
"The flow of cases in the trial courts from the time of filing until their final disposition has been the subject of ' public criticism. The trial period is exceedingly long. It usually takes more than two to three years to finish,. The slcrw grind of the trial court machinery ha5 made the legal maxim 'justice delayed is justice denied' I 1 \I apt-/ descriptive of the dismal situation obtaining in that level of juri5diction. Indeed the ultimate .victims are ali+:aYs the ordinary litigants. The real culprit is the common practice of piecemeal trial of cases that sets cases for trial one day at a time and thereafter continued or postponed ta another date until all the parties have finished their presentation of evidence."
The Continuous Trial System (CTS) was first piloted in
February 1989 in eighty-one (81) trial court5 all over the
country. Aimed to minimize delay in the processing of cases, 73
Regional Trial Courts and 8 Metropolitan Trial Courts were
required under Administrative Circular No. 4 dated September 22,
1988 to conduct trial of "one or at most three cases at a time"
and 'to adhere strictly to the provision of the above circular
that 'lin no case shall the entire trial period esceed three
months from the first day of trial unless otherwise authorized by

the Chief Justice pursuant tt Section 3, Rule 22 Gf the Rules of
CGurt.
The Supreme Court issued a series of administrative GrderS
and circulars to widen and expedite the imp1 emen tatian of
continuous trial which led to its mandatory aduption in al 1 1,503
trial courts nationwide. These circulars were:
1.
2.
3.
4.
=I C"
6.
7.
THE
Circular No. l-89, January 19, 1989 Established guide1 ines for designated RTCs tG conduct mandatory continuous trial.
Administrative Order No. 135 Designated 83 RTCs to implement the Mandatory Continuous Calendar.
Administrative Order No. 135-A, February 6, 3.989 &mending Administrative Order No, 135.
Administrative Circular 135-E Amending Administrative Circular No. 135.
Administrative Circular No. 35, July 27, 1989 DeFignating 23 Manila RTC Judges in addition to 5 previcrusly designated a5 Special Criminal Courts to implement mandatary continuous trial.
1 Administrative Circular No. 135-C, August 11, 1989 Designating additional 1,377 branches of multisala RTC z MetTC, MTC to implement the mandatory continuous trial calendar effective September 1, 1989.
Admin,istrative Circular No. 3-90, January 31, 1990 Mandatory Continuous Trial in all courts. Designating all 1,900 trial courts nationwide to implement continuous trial effective February 15, 1990. ,
1989 STUDY ON CONTINUOUS TRIGL
The performance of the first 81 pilot courts were examined .
the Institute of Judicial Administration in two researches
done in February 1989 and February 1990. The first study,
entitled "A Study of the Efficiency of Pilot Courts Using
. ..-

,
Continuous Trial", sought to evalllate the continuous trial
process as a means of addressing two major problems: delay and
docket congestion. The study looked primarily into the reduction
of delay in terms of litigation time, and reduction Of docket
size in terins of the number of pending cases in the designated
courts.
The effectiveness af continuous trial was evaluated, first
by comparing the performance of the 81 pilot courts before and
after they adopted continuous trial; and second, by comparing
their performance with 81 non-pilot courts using piecemeal trial.
Parallel to this, views and perceptions of judges, lawyers,
fiscals and litigants tiere gathered as to the efficiency of
adopting continuous trial. It further included a profile of
judges and court personnel and an account rjf some aspects of
court administration like budget practices and financial
resources allocation. Finally, an attempt was made to estimate
the private cost of litigation.
Rrief ly, the major findings of the 15’89 study were as
follows:
1. Cn litigation time, the trial period was found to be is considerably shorter in courts using the continuous trial system. The average length of trial period was computed at 18.1 days per case as against 341.8 days in the piecemeal trial'. of civil and criminal case (Final Report, 1989:&I) j and
2.. On output, the pilot RTCs using continuous trial registered higher ratios of outflow over cas&load by 5.79x, and a higher rate of decided cases over caseload by &.4&X compared to the non-pilot courts using piecemeal trial-. Tite MetTCs which used continuous trial have higher rates of outflow over caseload by 4.1X, and a higher rate of decided cases over caseload by 3.82X. (Final Report, 1989:159)..
THE 1990 STUDY CN CCNTINUCUS TRIAL
The second study was aimed at monitoring CTS implementation
in selected trial courts to get feedback on its effectiveness in
shortening litigation time and reducing docket size. Its major
findings to a great extent supported the findings in the first
study on the benefits of using CTS in place of piecemeal trial in
50 far a5 the RTCs in the regions were concerned . The major
findings were as follows:
1. The length of time spent in the litigation of cases tended to be shorter under CTS. The trial of cases was found to be shorter than the PO-day limit and averaged to 19 days for ordinary civil actions, and 29 days for criminal cases.
2. On .the average, the pre-trial period of ordinary civil action5 tended to be longer than the trial period. In ordinary civil actions, the pre-trial period is 37 days and 'trial period is 19.1 days. In criminal cases, the prertrial period averaged at 11.4 days and the trial period at 29.2 days.
3 . The whole litigation period beginning from the filing of the case to submission for decision was prolonged due to much longer days spent as waiting time between -the stages of litigation. Fqr instance, the waiting time from filing of the ca5e to arraignment in criminal ca5e5 was 47.3 days; from filing of the case to joinder of Issues in civil cases, 53.5 days; from arraignment to the day before the start of pre-trial, 24.1 days; from joinder of issues to the day before the start of trial, 52.8 days; from the last day of pre-trial to the day before the start of trial, 40.8 days. (Final Report, 1991:70).
4. The mandatory conduct of pre-trial is found to be an important factor in-reducing the number of cases going to the trial proper and therefore reducing the size of the -_ court docket. That is, the mandatory conduct of pre-trial reduced the number of cases going to trial by 19.4X in RTCs or 110 cases.out of 568 disposed cases, and by 33.331 in MetTCs or 165 cases out of 493 disposed cases.
5. In the experience ‘of judges with high caseloads;; close scheduling of the hearing of cases to meet the 90-day limit was difficult to achieve. In many instances, cases have to scheduled forhearing six months after filing.
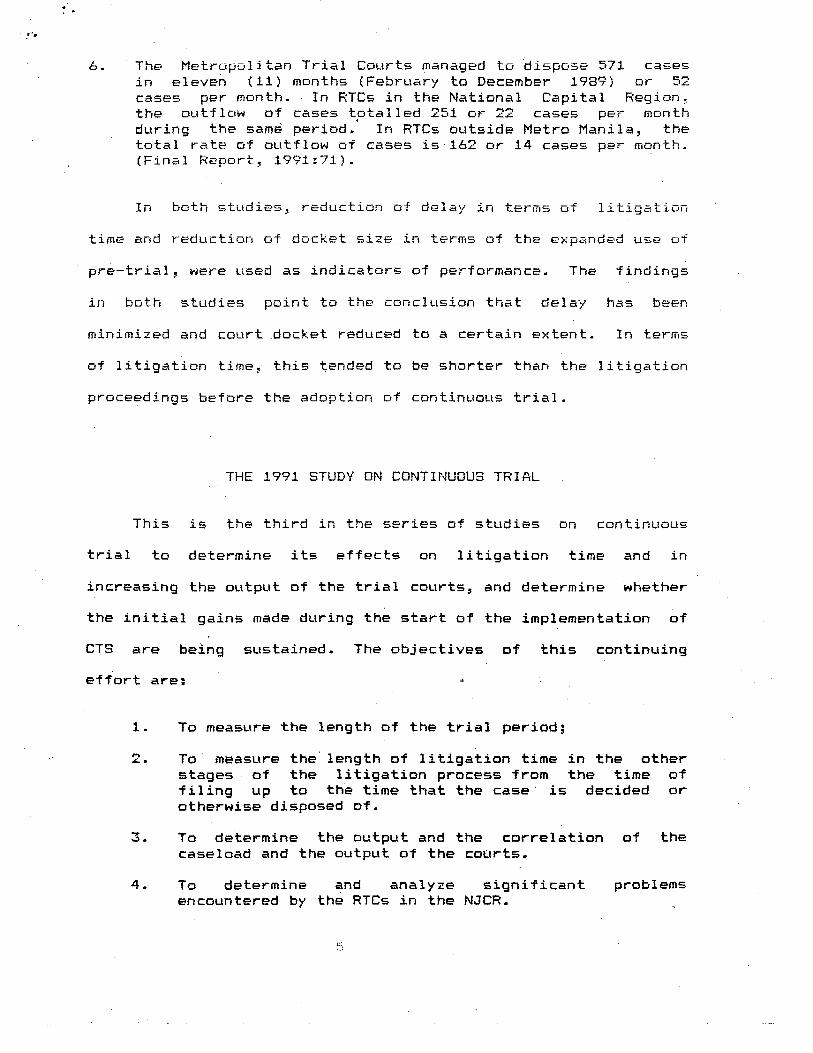
6. The MetrGpGlitan Trial CGr!rts managed tG disperse 571 cases in eleven (11) iTtGnthS (February to December 1X3’?‘) or 52 CEISES per rfmnth. In RTCs in the National Capital Region 3 the GUtf lGW Gf case5 tptalled 251 or 22 case5 pet- month during the same period. In RTCs outside Metro Manila, the tcrtal rate Gf outflow of cases is 162 or 14 cases per month. (Final fieport, 13?1:7i).
In bclth studies, reduction of delay in terms of litigation
time and reduction of dGCket size in terms of the expanded USE of
pre-trial, wet-e used as indicators of performance. The findings
in both studies point to the conclusion that delay has been
minimized and court docket reduced to a certain extent. In terms
of litigatiizn time, this fended to be shorter than the litigation
proceedings before the adoption of continuous trial.
THE 2.991 STUDY DN CONTINUDUS TRIGL
This is the third in the series of studies on continuous
trial to determine it5 effects on litigation time and in
increasing the output of the trial courts., and determine whether
the initial gains made during the start of the implementation of
CTS are being sustained. The objectives of this continuing
effort are: aa
1. To measure the length of the trial period;
2. To measure the’ length of litigation time in the other stages of the litigation process from the time of filing up to the time that the case- is decided or otherwise disposed of.
3. To determine the output and the correlation of the caseload and the output of the courts.
4. To determine and analyze 5ignif icant problems encountered by the RTCs in the NJCR. ,
,:: %.!

5 L. TO develop quantitative standards in meas,uring performance in terms of litigation period and Gutf low; and
6. To recommend courses of action that may be adopted by the Supreme Court to further reduce the 1 i tigation
*period and increase the output of the trial courts.
The present study is.similar in scope to the first two
studies made by IJA. The performance of a sample of trial courts
will be assessed in terms of two indicators that have been
mentioned: litigation time and outflow of cases. In terms of
geographic area, this study is focused on-RTCs in the National
judicial Capital Region.
Selection of sample courts from which sample cases were
drawn was done in proportion to the number of RTCs in each local
government in Metro Manila. The purpose is to have sample courts
from all areas in Metro Manila. In each area, a proportionate
sample of courts is chosen and classified into .high (with
caseload of 350 cases and moreIS medium (with caseload of 290 to
3491 I and low (with caseload of 1 to 289) caseload courts based
on their caseloads ending June 1990.. The classification of RTCs
by level of case-load was intended to examine the problem raised
by some judges of high caseload courts their high caseloads
prevent them from following the 90-day trial limit simply because
there are just too many cases to schedule.
Forty (40) RTCs in Metro Manila have been chosen as samples.
During the data gathering phase, however, the number was reduced

to 37 t S E E Table 1). Two sample courts were gutted by fire
including its records so they were removed from the sample. The
37 sample RTCs are about 21.5% of the total 172 RTCs in thE 4 I
National Capital Judicial Region. There are 14 high caseload
,RTCs, 8 medium caseload, and 15 caseload. The outflow of CiASES
in the sample courts were also analyzed. (See Annex 1).
With respect to the sample cases, these were all drawn from
the files of the 37 sample courts, and covered those cases filed
within the period July to December 1990. As expected, many of
the cases are not yet concluded as of the time of data gathering.
The rationale behind choosing only those cases filed during this
period is to closely monitor the flow of cases from the day they
WETi? filed. Under the continuous trial system, cases should be
tried as swiftly as possible and within a period of ninety d ;i\r c / --
Extension of the trial period is possible only upon written
guthority by the Chief Justice.
fin attempt was made to bP case specific and to analyze each
type of case within the major groups of criminal and civil cases.
However s the composition of the sample cases gathered did not
permit a detailed analysis since many of them have not yet been
submitted to pre-trial or to trial. They were found to be in
various stages of the litigation process. Instead, case5 were
grouped into criminal, and civil cases. At any rate, some
statements are made with regard to the each type of case as the
data allows. See Tables 1 for list of sample RTCs, and Tables 2
and 3 for list of sample cases.
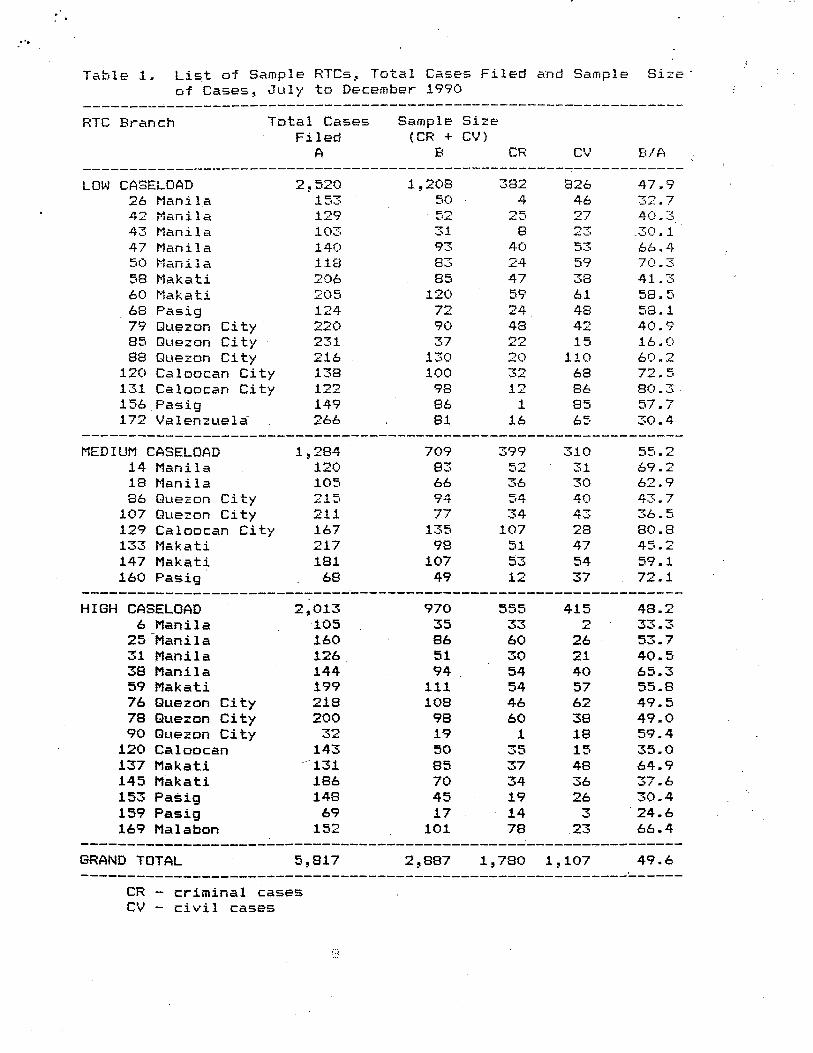
Table 1. List of Sample RTCs, Total C=lses Filed and Sample Size - Gf Cases, July to December 1990
_____-------------------------------------------- _
RTC Branch Tatal Cases Sample Size Filed (CR + CV)
A E CR CV E/k ( _____________------_---------------------------------------
LOW CASELOAI) 3 -l&L 930 1,208 382 826 47.9 26 Manila 153 50 4 4& 32.7 42 Manila 129 52 2 5 27 at-l , %. - 3 43 Manila 103 31 8 23 -30 . 1 47 Manila 140 93 40 53 Ab.4 : 50 Manila 118 83 24 53 70.3 58 Makati 206 85 47 T, a.3 41.3 60 Makati 205 120 59 61 58.5 &8 Fasig 124 72 24. 48 58.1 79 Quezon City 220 90 48 42 40.9 85 Wezan City A_ 371 37 22 15 16.0 88 Dueron City 216 130 20 110 60.2
120 Caloocan City 138 100 7-r) 3L 68 73 L.C ci 131 Caloocan City 137 Li 98 12 86 80 .3 156 Pasig 149 8A 1 8 5 57.7 172 Valenzuela- 2&A . 81 1.6 A;5 30.4
-----------__-_--------------------------------------------------
MEDIUM CASELOAD 1,284 709 399 310 55.2 14 Manila 120 83 52 3 1 69.2 18 Manila 105 66 36 30 62.9 86 !XuezGn City 215 94 54 40 43.7
107 Buezon City 211 77 34 43 36.5 129 Caloocan City 167 135 107 28 80.8 133 Makati 217 98 51 47 45.2 147 Makati 181 107 53 54 59.1 160 Pasig A8 49 12 37 72.1
----------__-______----------------------------------------------
HIGH CASELOAD 2,013 970 -3-L =I45 415 48.2 t5 Manila 105 35 33 2 33.3
25 -Manila 160 8b 60 26 53.7 31 Manila 12& 51 30 21 40.5 38 Manila 144 94 54 40 65.3 59 Makati 199 111 54 57 55.8 76 Quezon City 218 108 4& 62 49.5 78 Quezon City 200 98 550 38 49.0 90 Duezon City 32 19 1 18 59.4
120 Caloocan 143 50 35 15 35.0 137 Makati ,131 85 37 48 64.9 145 Makati 18& 70 34 36 37.6 153 Pa+ig 148 45 19 26 30.4 199 Pasig 69 17 14 3 24.6 l&9 Malabon 152 101 78 23 66.4
-----,-,--,,,,,,,,,,---------------------------~-----------------
GRAND TOTAL 5,817 2,887 1,780 1,107 49.6 ----------,_____,,,-,-----------------------------------------~------
CR - criminal cases cv - civil ca5e5
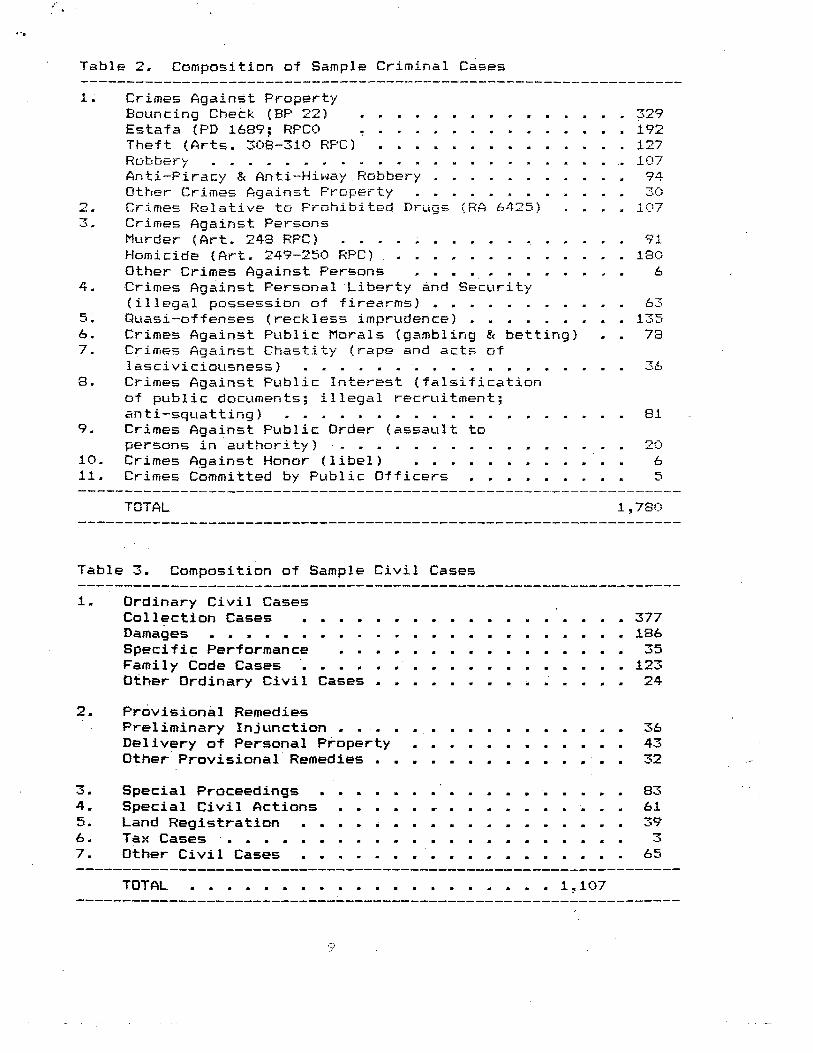
Table 2. Composition of Sample Criminal Cases --------____________---------------------------------------------
1. Crime5 Against Property Bouncing Check (PF 22) ............... 329 Estafa (PI? 1689; RFCO 7.. ............ i92 Theft (Arts. 308-310 HFC) .............. 127 Robbery ....................... 107 Anti-Firacy & Anti-Hiway Robbery ........... 94 Other Crime5 Against Froperty ............ 3 0
2. Crimes Relative to Frohibited Drugs IRA 6425) .... 107 3. Crimes Against Persons
Murder (Art. 248 RFC) ................ 91 Homicide (Art. 249-250 RFC) ............. 180 Other Crime5 Against Persons ............ 6
4. Crimes Again5t Fersonal Liberty and Security (illegal possession uf firearms) ........... 63
9 C. Quasi-offenses (reckless imprudence) ......... 135 6. Crimes Against Fublic Morals (gambling & betting) . . 78 7. Crimes Against Chastity (rape and ait 5. af
lasciviciousness) .................. 36 8. Crimes Against Fublic Interest (falsification
of FjubIic documents; illegal recruitment; anti-squatting) ................... Sl
9. Crime5 Against Fublic Order (assault to persons in authority) ................ 20
IO. Crimes Against Honor (libel) ............ 6 11. Crimes Committed by Public Officers ......... 5 --------------___--_---------------------------------------------
TOTAL 1,760 -----------________----------------------------------------------
Table 3. Composition of Sample Civil Cases --------____________--------------------------------------------- 1.
2.
3. 4. 5. 6. 7.
Ordinary Civil Cases CollectionCases ............ ..'....37 7 Damages ...................... -186 Specific Performance ................ 35 Family Code Cases Other Ordinary Civi; Cases ...............................
123 24
Prdvisional Remedies Preliminary Injunction .................. 36 Delivery of Personal Property ............ 43 Other Provisional Remedies ........... : .. 32
Special Proceedings ................... 83 Special Civil Actions ................ 61 Land Registration .................. 39 Tax Cases Other Civil'Cases .......................................
3 65
-------------__-------------------------------------------------- TOTAL . . . . . . . . . . . . . . . . . . . . 1,107
-------------__-__-----------------------------------------------
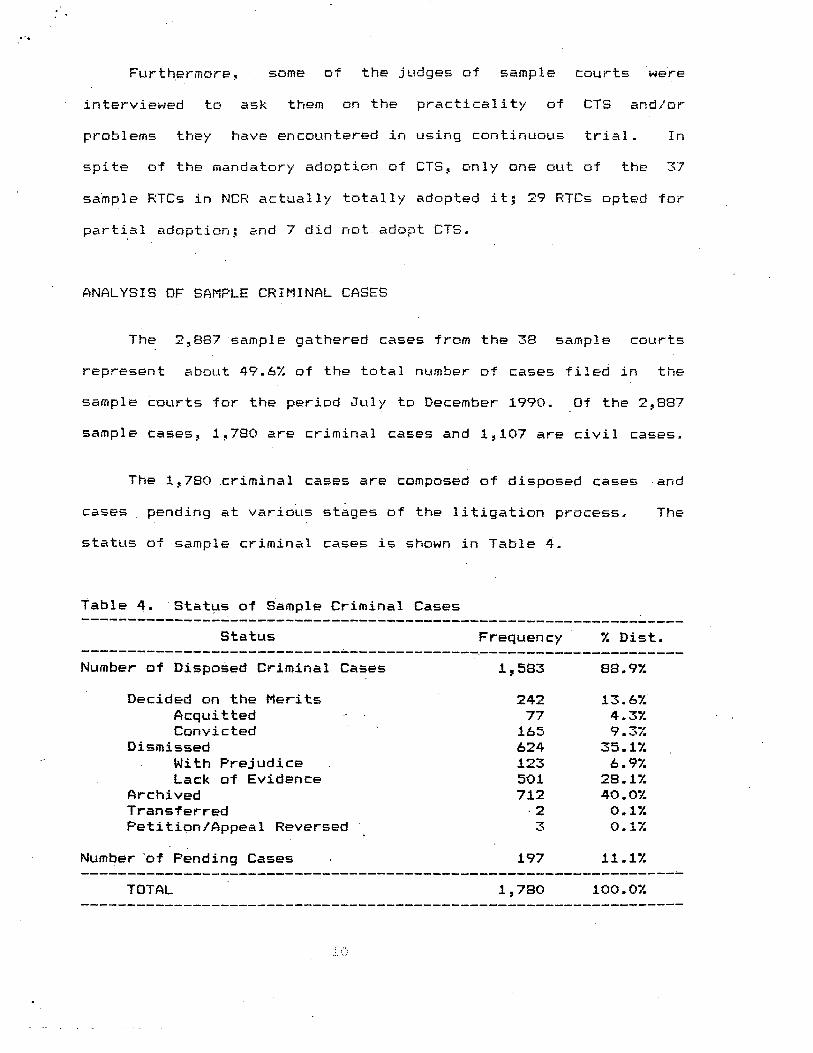
Furth,ermGre, same Gf the judges of 5dlllplP CGUrt5 were
interviewed tG ask them GI-I the practicality Gf CTS and;Gr
problems they have encGuntered in using CGntinUGUs trial. In
spite of the mandatory adGptiGn of CT'S, only one Out Of the 37
sample RTCs in NCR actttally totally adapted it; 29 HTCs Gpted for
partial adGptiGn; and 7 did nut adGpt CTS.
GNALYSIS OF SAMPLE CRIMINAL CASES
The . 2,887 sample gathered cases from the 38 sample courts
represent abaut 49.&% of the total number Of cases filed in the
sample courts for the periGd July tcs December 1990. Df the 2,887
sample cases, 1,780 are criminal cases and 1,107 are civil cases.
The 1,780 criminal cases are COmpGS@d of disposed cases -and
cases pending at various stages Of the 1itigatiGn prOcess. The
status of sample criminal cases is shuwn in Table 4.
Table 4. Status of Sample Criminal Cases -----------------------------------------------------------------
Status Frequency % Dist. -------------------------------------------.---------------------- Number of Disposed Criminal Cases 1,583 88.9%
Decided on the Merits Acquitted CGnVicted
Dismissed With Prejudice Lack of Evidence
Archived Transferred Petition/Appeal Reversed
242 13.6% 77 4.3%
165 9.3:; 624 35.1% 123 6.9X 501 28.1% 712 40.0%
.2 0.1% 3 0.1X
Number 'of P&ding Cases 197 11.1x -----------------------------------------------------------------
TOTAL 1,780 100.0% ------------------------------------------------------------- ----

The 1,780 sample criminal ~35~5 were classified according tcr
status of litigation, i.e., disposed (decided, dismissed,
archived, amicable settlement, transferred), and pending. There
were 1,523 disposed ca5e5 (242 decided; 624 dismissed; 712
archived; 2 transferred; 2 appealed ciizes), and I.97 PWidir:*~
cases rn
A number of the disposed criminal cases, 110 or 6.9% were
disposed with trial. A larger number of cases, 70 or 4.4% were
disposed after the pre-trial was concluded, and thus withoilt
trial. An even bigger proportion of these criminal cases WEFf?
resolved before the pre-trial stages, &39 or 40.4%. ThE reason5
often cited for the early resolution of the cases before pre-
trial were the following: the litigants agreed to enter into
compromise agreement or to settle their cases amicably; or the
plaintiff showed lack of interest to pursue the case indicated b.y
actually asking the court to dismiss the case or simply by non-
appearance for several times in scheduled court hearings.
Table 5. Status of Sample Criminal Cd533 Status of Litigation -----------------------------------------------------------------
After filing War After After Total Arraignment or Pre-Trial Trial
Joinder --------------------------------------------~-------------------- Criminal Cases 690 90 175 1,780
Disposed Cases A39 70 110 1,583
Pending Cases 91 20 65 197 -----------------------------------------------------------------

Elf the 1 ,583 disposed cases5 the trial of 267 cases trr 16.9%
were ccrmpleted within the mandatory W-day period. This included
the completion of the trial of 142 cases or 9% within a very
short period of l-10 days. On the average, the trial period
lasted 69.2 days per case. Dn the other hand, some 114 criminal
ca5es or 7.2% had a trial period longer than the mandatory sc-
days. See Table 6.
Table 6. Length of Trial Period of Criminal and Civil CEISE5 7 July to December 1990
------_-____________-------------------------------------------- Length of Trial Days cfi cv Total -----------_______----------------------------------------------
1 142 52 134 z- 10 25 7 32
11 - 20 24 9 33 21 - 30 17 3 20 31- 60 33 10 43 61 - 90 26 .7 33 91 - 182 67 31 98 '
182 - 365 4 2 9 51 > 365 5 1 6
--------____________----------------------------------------- --- Number of Cases 381 129 510 ------______________-------------------------------------------- Ave. Days per Case 69.2 61.3 65.2 --------___________---------------------------------------------
CR - criminal cases cv - civil .ca5e5
ANALYSIS OF SAMPLE CIVIL CASES
A similar pattern of disposition is exhibited in both
criminal and civil cases. Insofar a5 the civil cases are
concerned, majority or 862 cases (77.9%) were disposed compared
to the 245 cases or 22.1X which were still pending.
.
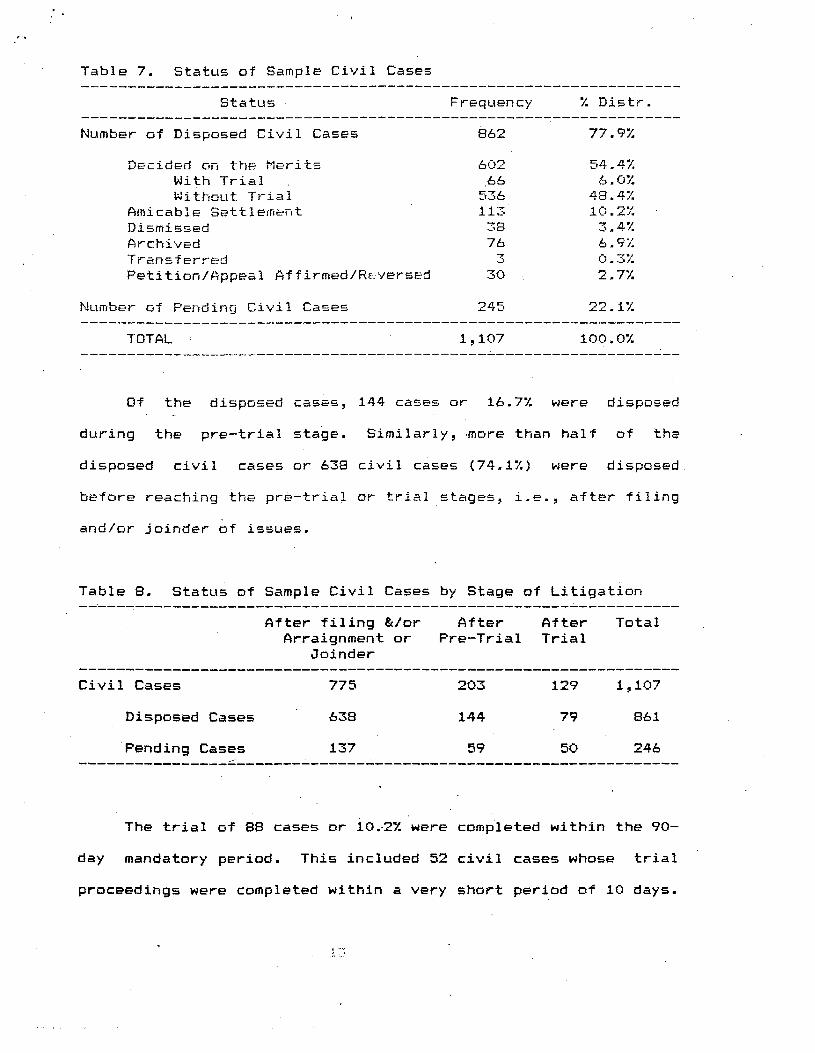
Table 7. Status of Sample Civil Cases ----________________________l________l__-------------------------
status Frequency % Distr. -------_________-___--------------------------------------------- Number of Disposed Civil Cases 862 77.9%
Decided on the tieritz With Trial Without Trial
AmicablE Settlement Dismissed Archived Transferred Petition/Appeal Affirmed/Htiversed
b~uinber crf Pending Civil Cases 245 22.1% -_------___________----------------------------------------------
TOTAL 1,107 100.0% -------_-_______-__----------------------------------------------
Of the disposed eases, 144 cases or 16.7% were disposed
during the pre-trial stage. Similarly, .more than half of the
disposed ci.vil cases or 638 civil cases (74.1%) were disposed
before reaching the pre-trial or trial stages, ime.Y after filing
and/or joinder of issues.
Table 8. Status of Sample Civil Cases by Stage of Litigation --------____________---------------------------------------------
After filing &/or After After Total
Arraignment or Pre-Trial Trial Joinder
-----------_________--------------------------------------------- Civil Cases 77s 203 129 1,107
Disposed Cases 638 144 79 8&I
Pending Cases 137 59 50 246 ----------,,-,-,=,,,---------------------------------------------
The trial of 88 cases or 10ti2% were completed within the 90-
day mandatory period. This included 52 civil cases whose trial
proceedings were completed within a very short period of 10 days.
. . , . . . . ’
: . . . . . <

. .
The average trial period of civil cases was computed at 61.3 days
Per case. A smaller number (41 civil cases) necessitated trial
periods l&gEr than three months. See alsc, Table 6.
Under CTS; the conduct of a pre-trial confe.rerice for
criminal and civil cases was made mandatory.‘ This provision i rt
the law is significant because tG it can be directly attributed
the rise in the volume of cases disposed before they reached the
‘trial stage. The pre-trial period led to the disposition of 383
criminal cases and ‘2% civil cases. These have the direct effect
of reducing the actual number of cases that will proceed to the
trial stage.
Table 9. Length of Fre-Trial Period of driminal and Civil Cases, July to December lt990
--------____________---------------------------------------------
Length of Trial Days CR cv Total -----------______-_----------------------------------------------
1 308 209 517 2- 10 14 7 21
11 - 20 & 9 15 21 - 30 14 7 21 31 - 60 14 20 34 bl- 90 11 12 23 91 - 182 1& 19 35
-183 - 365 d 12 18 > 3&5 0 1 1
,
-------------_____________________c_____-------------------------
Total No. of Gases 389 296 8385 ---------------------------------------T------------------------- Ave. Days Per Case 14.4 28.8 21.6 --------------__i__----------------------------------------------
CR - criminal cases cv - civil cases .x
.a ,.:‘,>\
.:.

: *
s.
LENGTH OF LITISGTIUN PERIOD BY LEVEL 5F CfiSELU~D
we tried tG.CGmpdre the length crf pre-trial and trial in the
IGW, medium and high caselccad courts. With respect to pre-trial,
it was surprisingly longest at 36.5 days per civil case in the
1GW CdsElGdd HTCS. In high caseload RTCs', the average was only
23.1 days per civil case.
Fur criminal ca5e5 3 the pre-trial average is abaLe tw5
WEEkS, and is again longsst, at 15.3 days in lclw caseload F;?-C5.
In high caseload HTCs, it averaged 14.4 days per criminal case.
With respect to the trial of civil cases, the high case1 odd
RTCs regi;tered an average of 52.3 days;‘this is lower than the
66.8 days average in low caseload RTCs.
With respect tG the trial of criminal cases:, this is lcjngest
in high caseload RTCs at an average of 82.1 days. In lGW
caseload RTCs, the average trial days is 62.6 days.
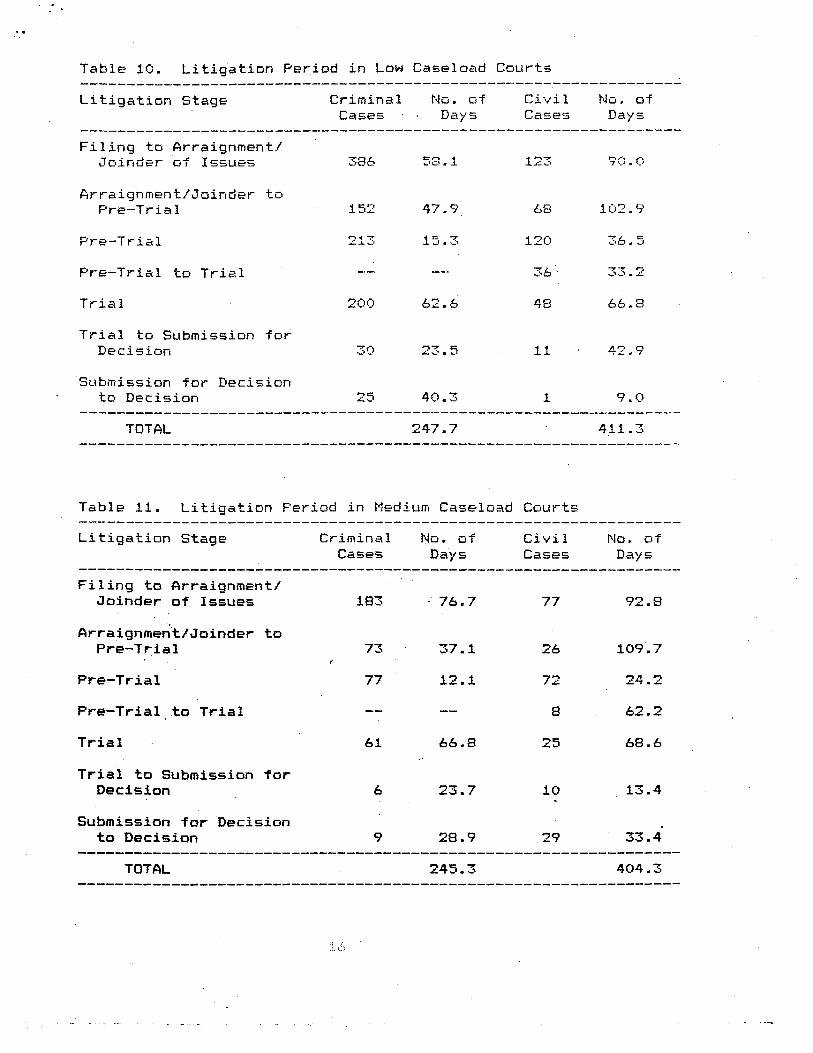
The length of litigation time that a particular criminal or
civil. case proceeding iS completed from filing to promulgation Gf
decision was computed. With respect to criminal‘cases the total .
length of 'litigation time has an average of 247.7 days in low
caseload .RTCs , and 372.8 days in high kseload RTCs. However.,
the difference in total' length of time with respect to civ'il
case5 is not very great, i.e, 411.3 days in low caseload RTCs ,
and 472.1 days in high caseload RTCs.
. .
Table IO. Litigation Period in Low Caseload Courts -----___II_________----------------------------------------------
Litigatictn Stage Criminal No. of Civil NG. of Cases . Days Cases Days
------_----_________---------------------------------------------
Filing to Arraignment/ Joinder of Issues 386 58.1 123 9 ;7 I rI:
firraignment/Joinder to Pre-Trial
Pre-Trial to Trial -- -- 36 77 bi .2
Trial 200 62.6 48 66.8
Trial to Submission for Decision 30 23.5 11 42.9
Submission for Decision to Decision 25 40.3 1 9 . u
------________________________________I_-------------------------
TDTAL 247.7 411.3 ------_-__________________________I_____-------------------------
Table 11. Litigation Period in Medium Caseload Courts ---------___________---------------------------------------------
Litigation Stage Criminal No. of Civil No. of Case5 Days Cases Days
-----------___-____----------------------------------------------
Filing to Arraignment/ Joinder of Issues 183 . 76.7 77 92.8
Arraignme&t/Joinder to Pre-Trial 73 37.1 26 109.7
* Pre-Trial 77 12.1 72 24.2
Pre-Trial,to Trial -- -- 8 62.2
Trial 61 6B.8 25 68.6
Trial to Submission for Decision 6 23.7 10 13.4
Submission far 'Decision to Decision 9 28.9 29 77 33 . 4
----------------------------------------------------------------- TOTAL 245.3 404.3
-----------------------------------------------------~-----------
.i . . .
. : . 1.1
_. _ I
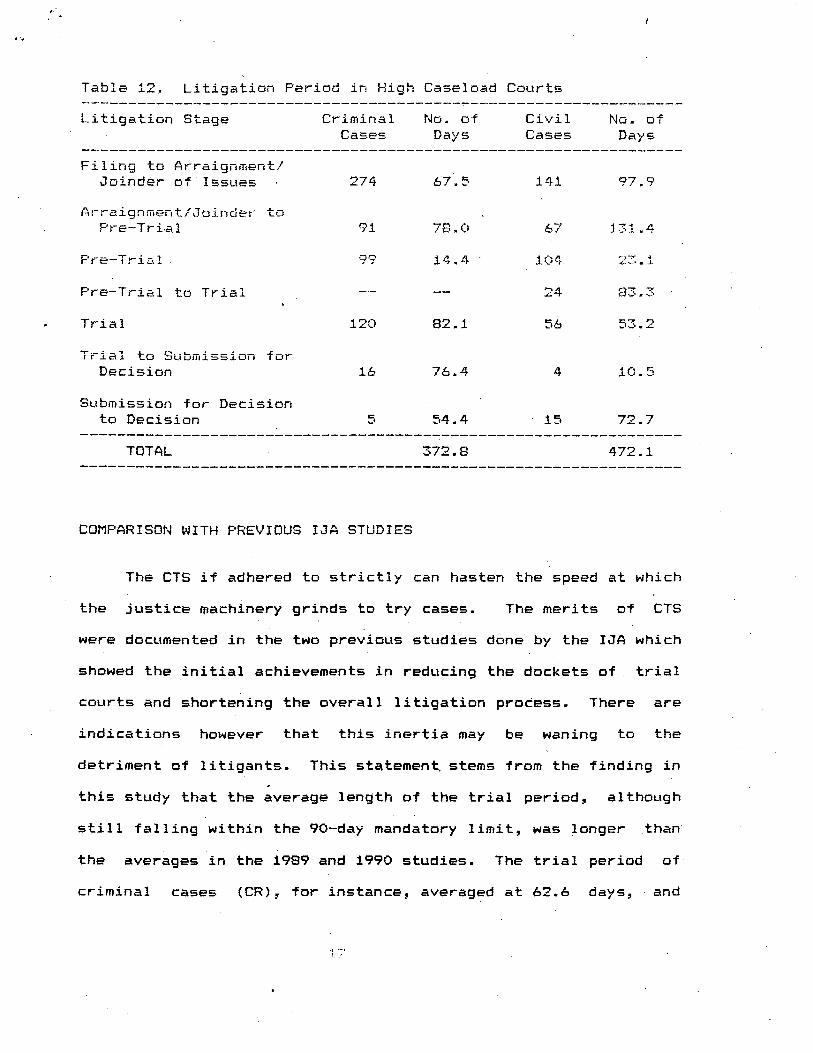
Table 12. Litigation Period in High Caseload hurts --------______-__------------------------------------------------
Litigaticin Stage Criminal No. of Civil No. of CdSES Days Cases Days
----------__________--------------------------------------------- Fi 1 ing to Gri-aignment/
Joinder of Issues 274 67.5 141 97.3
Grraignment~JoindEr to F’rlF-Tri,dl 3i 78.0 67 131.4
Fre-Trial
Fre-Trial to Trial -- -- 24 83.3
I Trial 120 82.1 56 53.2
Submission far Decision to Decision 5 54.4 13 72.7
- - - I - - - - - - _ _ _ _ _ _ - - - - - - - - - - - - - - - - - - - - - - - - - - - - - - - - - - - - - - - - - - - - - - - - -
TOTAL 372.8 472.1 ----------______-------------------------------------------------
COMPt?RISDN WITH PREVIDUS IJA STUDIES
The CTS if adhered to strictly can hasten the speed at which
the justice machinery grinds to try cases. The merits of CTS
were documented in the two previous studies done by the IJA which
showed the initial achievements in reducing the dockets of trial
courts and shortening the overall litigation process. There are
indications however that this inertia may be waning to the
detriment of litigants. This statement stems from the finding in
this study that the average length of the trial period, although
still falling within the 90-day mandatory limit, was longer ,than
the averages'in the 1989 and 1990 studies. The trial period of
criminal cases (CR), for instance, averaged at 62.6 days, and
.

66.8 days for civil cases (CV) in low caseload courts. These
averages are longer than the 17.7 days average for criminal cases
with prisoner (CCP), and 27 days for criminal ca5e5 without
prisoner (CCw/oP) based on the 1990 study. In the 1989 study,
the aver&ges were shorter at 14 days for CCP and 20.2 dsiys fsr
CCw/oP.
The average length of time from filing to decision w&s alsa
longer at 247.7 days for criminal cases, and 411.3 days for civil
cases in this study. In the 1990 study, this period took an
average of 64-b days {CCP), 90.3 days.ICCw/oP), and 119.1 days
ttxx - ordinary civil actions). In the 1989 study, the length of
titie from filing to decision was a little more than two months.
The -length of the pre-trial was relatively short at 15.3
days /CR), and 36.6 days under the present study. In the : 9'i!:,
study, the averages were 11.4 days ICR) and 37 days (OCR). See
Table 13.
The positive effects of CTS was manifested in the courts .,
being obliged to keep. its docket current. Thi; observation is
evident in the large volume of cases .disposed after filing,
arranignment in criminal cases, or joinder of issues in civil
cases, thus preventing cases whose litigants showed no more
interest6 to pursue their cases to clog the dockets. In the
present. sutyd, 50.7X of the total number of cases filed from 3uly
to December 1990 were disposed after filing and/or arraignment or
joinder of .isues.

The benefits of making the pre-trial mandatory h a d its
impact on the volume of CEISE~ disposed at the pre-trial stage.
The volume accounted for about 10.1% of the total sample CElSP5.
The volume of case5 going to trial wa5 also significantly sm.3 11
a5 most of the case5 had been disposed at earlier stages. Scje
Table 14,
Table 13. Comparison of Average Feriods under the Fresent Study and the 17’20 ansd l?S9 1,363 Studies
--------------------------------------------------------------.---
f? R c -----__-____________---------------------------------------------
Present Study
1. Low Caseload HTCs
Criminal case5 . . . . . . . . . . s52.6 15.3 247.7 Civil Ca5es . . . . . . . . .'. . 66.8 36.5 411.3
2. Medium Caseload RTCs Criminal Cases . . . . . . . . . . 65.8 12.1 24=1 b.3 Civil CasEs . . . . . . . . . . . .&a.6 24.2 404.3
3. High Caseload RTCs Criminal Cases . . . . . . . . . . 82.1 14.4 372.8 CivilCases . . . . . . . . . . . 5'2 -3. 23.1 472.1
-----------________---------------------------------------------- 1990 Study
Criminal Carjes with Prisoner . . . 17.7 11.4 64.6 Wiminal Cases without Prisoner. . 27.0 9013 Ordinary Civil CIctions . . . . . . 11.4 37.0 119.1
-----------c----------------------------------------------------- 1989 Study
Criminal Cases with Prisoner . . . 14.0 27.2 75.2 Criminal Cases without Prisoner. . 20.2 30.5 69.4, Ordinary Civil Actions . . . . . . 22.2 40.5 69.5
-------------------------------------------------------~--------- A- Length of Trial B- Length of Pre-Trial C- Length of Time from filing to Decision

c . ’
. .I
Table 14. Rate Gf Case Disposal at Certain Stage5 of LitigatiGn -------_________-_-----------------------------------------------
Tatal Sample D x % F . % -___________________---------------------------------------------
Criminal Case5 1,780 690 38.8 90 5.1 175 9.8
Civil Cases 1,107 775 70.0 203 18.3 129 11.h
Total 2,887 1,4M 50.7 293 10.1 304 JO.5 ----------__________---------------------------------------------
D - NLiRtb~r of Cases Disposed after Filing, and Arraignment or, Joinder of Issues
E- Number Gf Cases Disposed Z)uring Fre-Trial F- Number of Cases Disposed During Trial.
The CTS in general ha5 made its contribution in solving ilye
twin prablems Gf ct>urt delay and docket congestion. Its
achievement5 in this area huwever will be eroded if other
measures are not taken. Other interventions have to be adGpted
in conjunctiGn with the CTS to be able to keep the benefits that
the CTS has brought to the judicial proces. These intervention5
may be administrative, technical and behavioral.
Administratively, personnel benefits, budgetary and material
support must .be made 'available to the courts regularly in
sufficient amount to enable them to swiftly render their duties
and responsibilities.
Technically, the court system must contintiously protect its
independent decision making I to continuously uphold justice,
render justice equally, impartially and moral,ly. , In terms of
behavioral interventions, the court system should lend support to : .
the training and further training'of lawyers, fiscal!%, government
prosecutors, and judges to keep them abreast of recent court
decisions and innovations in the court system.

I’- .
OUTFLOW AND CASELOAD
For the six-month period covering July to December 1930, the
37 sample csurts had a YDTAL OUTFLOW of 8,763 ca~e5~ or an
average of 39 &5es per month per court. That sume of the RTCS
have registered very high OUtflGlha Gf cacxzsi does not absGlutefy
mean that they performed better than the courts which have lisw
outf lcw a-f cases. Total dutfloti of cases consists 61 ca5es
decided on the merits, dismissed, amicably settled, transferred
and archived. There is a general view that archived and
transferred cases b athough they lessen the caseload, may not
truly indicate higher or better performance, since pre-trial or
trial proceedings may not have been actually conducted. Eranch
PO-QC for instance has archived 432 cases. branch 145~Makati
likewise archived 109 ca5e5. Eranch i&T-tialabon archived 5 1
cases and transferred 91 cases.
Removing the effect of the archived cases s the average
monthly outflow. for Branch 9Q-QC is lowered from 94 to 14.3
cases, whiie that of Branch 14%Makati is lowered from 77 to 59
cases. in Branch .1&Y-Malabon, its average monthly outflow is
lowered from 58 to 33.8 cases.
Removing the effect of archived cases, the average monthly
outflow becomes 34 cases per court.
While the aver&e monthly outflow ranged from 15 (lowest) to
94 (highest) cases, 20X of the sample courts (or 8 courts)
registered a monthly average outflow of 27.5 ca5es g which is
. . . . . .; c:. :.

still lower than the overall average c3f 39 ca5es. The
concentration of the average monthly ctutflow is in the range of
15 to 55 cases.
on whether additions to or subtractions from the caselcrad
are substantive or not F the rate of change i r-i outflow Was
determirted. There werE 24 RTCs which experienced a decreasing
rate of outflow of cas.es. That is, the number of cases disposed
every month has become less and less at the rate of 41.5%. On
the positive side, 12 RTC have performed better by disposing
cases at an average of 126.8%. (See Table 15).
Table 15. Rate of Increase/decrease in Outflow in 37 RTCs ------_-______-------------------------------------------- Hate in X Increase Decrease ----------------------------------------------------------
0.0 - 10.0 1 * 3 10.1 - 20.0 1 3 20.1 - 30.0 1 4 JO.1 - 40.0 2 2 40.1 - 50.0 -- 4
> 50.0 7 8 ----------__---------------------------------------------- Total Number of RTCs 12 24 ------_________------------------------------------------- Average* 126.8X
. 41.5%
---------------------------------------------------------- Sum of rate of increase (or decrease)
-*Average = ------------------------------------- Total number of RTCs
The question may be asked whether the rate of outf fow of
ca5e5 is influenced by the level of caseload of individual
courts, i.e., a court with high caseload may also dispose cases
at a'relatively higher rate than a court with low caseload.
. . , . / - ,
t 1..
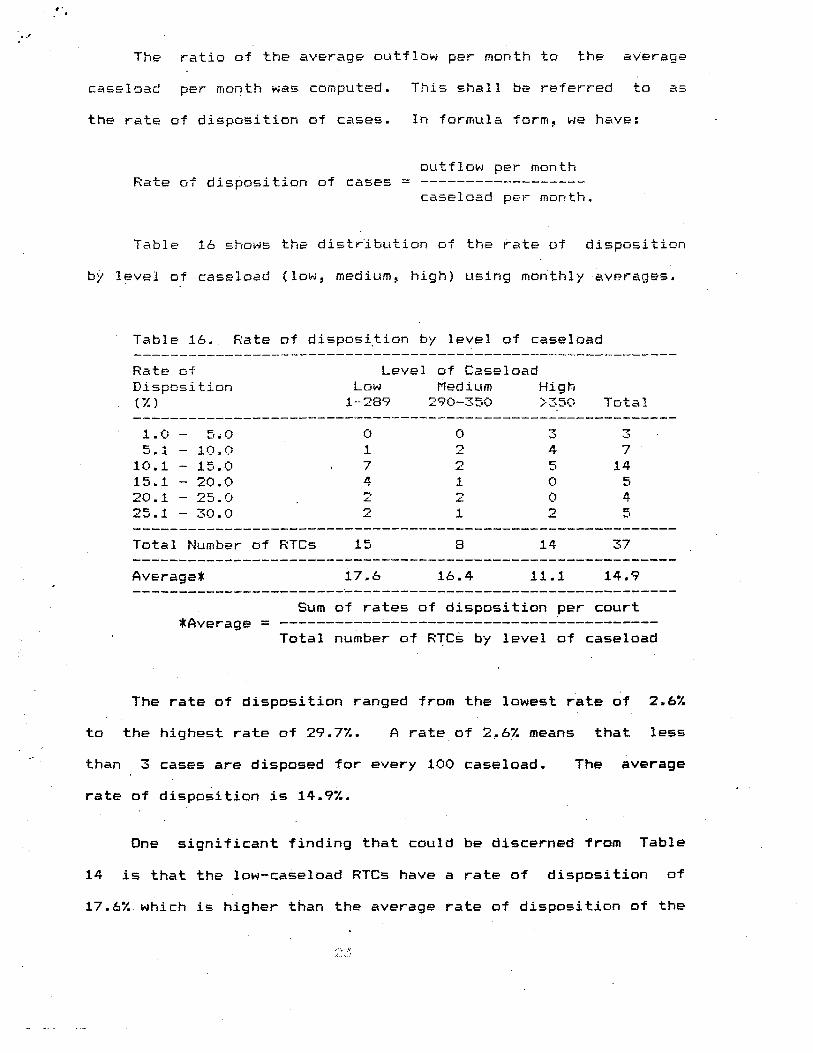
The ratio af the average outflow per month to the average
caseload per month was computed. This shall be refErred to as
the rate of dispO5itiOn of ca5e5. In formula form, we have:
outflow per month F:atf'Z Gf disposition of CASES. = -------------_-_--
caseload per month.
Table 16 shows the distribution of ths rate of disposition
by level of caseload (lok~, medium, high) using mon.thly averages.
Table 16. Rate of disposi,tion by level of caseload --___________------_~~~~~~~~~~~-~~~~~~-~~~~~~~-----------~~ Rate of Level of Caseload Disposition Low Medium High <%I l-283 290-35U )X50 -fcltal ---_-_______-------~~~~~~~~~~-~~~~~~~~-~-~~-~~~-----------~
1.0 - 5.0 0 u 3 3 5 . 1 - 1~~.Q 1 2 4 7
IQ.1 - 15.0 7 2 5 14 15.1 - 20.0 4 1 0 5 20.1 - 25.0 2 2 0 4 25.1 - 3u.u 2 1 2 5 ---___________--------------------------------------------- Total Number of RTCs 15 8 14 37 --________-________---------------------------------------- Averaget 17.6 16.4 11.1 14.9 --______I______--------------------------------------------
Sum of rates of disposition per court wlverage = -----------------------------------------
Total number of RTCi by level of caseload
The rate of disposition ranged from the lowest rate of 2.6%
to the highest rate of 29.7%. A rate of 2,6% means that less
than 3 cases are disposed for every 100 caseload. The average
rate of disposition is 14.9%.
One significant finding that could be discerned from Table
14 is that the low-caseload RTCs have a rate of disposition of
17.&% which is higher than the average rate of disposition of the

high caselciad cGUrts Gf 11.1%. filthGUgh in terms cjf the actual
number of cases removed fram the docket, the perfGrmance Gf high-
caseload RTCs did not differ much from that of the low-caseload
RTCs. Their monthly average GutflGw crf cases were 43 an& 35
case5, far high- and low-caseload RTCs y respectively. The
medium-caseload RTCs have a ccimparably high average mclrrthly r;i+a -_
of outflaw of 42 case5, and their average rate Gf dispGsitiGn is
16.4% per court. ,
Based Gf-I the foregoing, having high caseload may IiGt
neCeSsarily mean a high rate r3f case outflcrw.
The trend of the monthly caseload was determined to shed
light on the question of whether the monthly caselcrad of RTCs is
increasing lot- decreasing) as a result of the adoption of the
CTS.
Table 17. Rate of Increase/Decrease in Caseload ----__________------------------------------------------- , Rate in % Increase Decrease Total ----_-________-------------------------------------------
0.0 - 10.0. 8 8. .16 10.1 - 20.0 2 7 9 _
' 20.1 30.0 2 '3 5 - rflo.l'- 40.0 0 2 .2 40.1 - 50.0 0 3 3
> 50.0 1' 1 2 ---------___-_------------------------------------------- Tot&No. of RTCs 13 24 37 ------------------------------------------------------------- Average 24.2 m.7 21.3 ---------_-----------------------------------------------
The trend of the caseioad level is encouraging. Twenty-four
1241 of the sample qTCs registered a decreasing caseload at an
average of 19.7%.
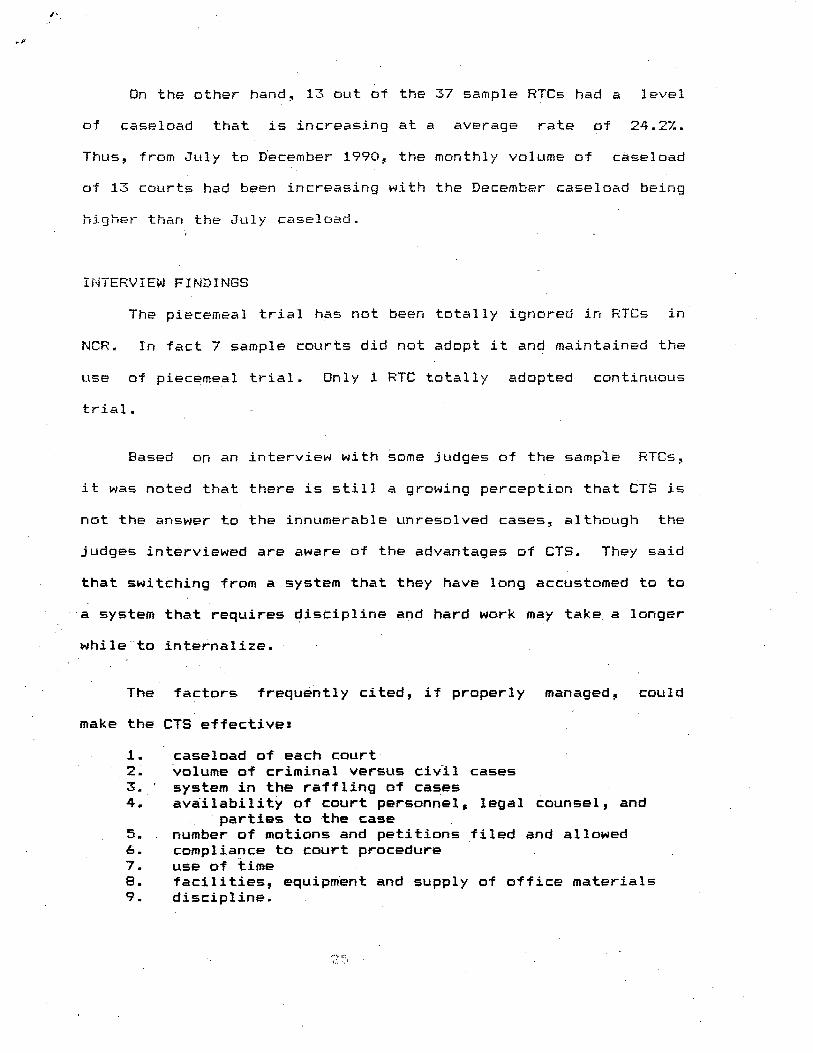
On the other hand, 13 cut of the 37 sample RTCs had a level
of caseload that is increasing at a average rate of 24.2%.
Thus, from July to D’ecember -1990, the monthly volume of c&se1 oad
of 13 courts had been increasing with the December caseload being
higher than the July caseload.
The piecemeal trial has not been tcrtally igncjred in WCs i i-l
NCR. In fact 7 sample courts did not adopt it and maintained the
u5e of piecemeal trial. Only 1 RTC totally adopted continuous
trial.
Hased on an interview with some judges of the sample ETCs Y
it was noted that there is still a growing perception that CTS is
not the answer to the innumerable unresolved cases, although the
judges interviewed are aware of the advantages of CTS. They said
that switching from a system that they have long accustomed to to
a system that requires discipline and hard work may take a longer
whileto internalize.
The factors frequently cited, if properly managed, could
make the CTS effective:'
1. caseload of each court 2. Lolume of criminal versus ciVi1 cases 3. ’ system in the raffling of cases 4. avdilability of court personnel, legal counsel, and
' parties to the case 5. number of motions and petitions filed and allowed 6. compliance to court procedure 7. use of time 8. facilities, equipment and supply of office materials 9. discipline.
. . . . . ,:: <:. ._:
The following pointers may help in the swift administratiGn
Gf cases in courts using CTS:
(Ncrte : This pcrrtion was written by Emil:, Caacbay. Reim!Y/E this nGte in the Final RepGi-t).
1. FreparatiGn Gf monthly inventGry.Gf ca5e5 categcrizing each
CEISE into betided cln the merits; amicably- settled Gr cGff:promise
cqreema-it; tr-ansf erred; archived; dismissed; piT3ViSiGi-ldl ly
disposed; and pending.
2. Fun c tua 1 i ty and attendance. The early bird catches the
early worm and the judge who starts early finished mGre CEISES.
Often the punctual judge commands mGre authority from the lawyers
who give mGre priority to cases heard before strict judges fGr
fear that they may be fined of their cases dismissed.
7 3 l Discipline. It is in the. determined efforts of the judges
a5 well as the lawyers to keep courts maintain a h4 profile.
But it is the sale responsibility of the judge to impose the
strict 'observance of, .and com'pl iance with court rules and
procedures. '
4. Working drive. As observed in an ordinary court forum, a
number of court personnel do not show enthusiasm in their work.
A "couldn+t care attitude" is observed and has become a habit to
some. As a means of achieving efficient ctxw t administration,
incentives and merit awards may be given to deserving and
effici&nt court employees. .
2’.
I-+
CONCLLJDINtS REMARKS
1.
2.
3.
4.
5.
6.
The major findings of this study are the following:
On the length of the trial period, the average length Gf
trial of criminal cases was 70.5 days; AZ.9 days i f-1 civil
ca5es.
The mandatory conduct of pre-trial has effectively led to
the early dissolution of CEISES and substantial ly reduced the
volume of cases going to the trial stage.
A large proportion of cases filed were disposed even before >
the pre-trial stage, thus decongesting the courts at the
earliest possible time.
The rate of outflow, i.e,, the number of ca5es disposed
monthly, is almost of the same level in high and low
caseload courts.
With respect to the level qf caseload, majority (28’ out of
40 samjqle WCs) registered a decreasing level of caseload
monthly; The decrease goes at an average rate of 18.9% .I
monthly. In the.other 19 sample RTCs, .the monthly rate of
increase in thei.r caseload is lower at 7.7%.
The decreasing rate of caseload and the increasing rate of I
outflow augur well for the averall favorable performance of I
the sample RTCs.
(Note for Gina: Attach here as Annexes’ the tklo tables on monthly caseload and outflow. Remove this note in the final report.)