Effects of Temperature on the Alignment and Electrooptical Responses of a Nematic Nanoscale Liquid...
9
Effects of Temperature on the Alignment and Electrooptical Responses of a Nematic Nanoscale Liquid Crystalline Film Lay Min Lee, Hye J. Kwon, Ralph G. Nuzzo,* and Ken S. Schweizer* Department of Chemistry, Department of Materials Science and Engineering, and the Frederick Seitz Materials Research Laboratory, UniVersity of Illinois at Urbana-Champaign, Urbana, Illinois 61801 ReceiVed: October 21, 2005; In Final Form: May 1, 2006 The surface-induced alignment and electrooptical (EO) dynamics of a 50-nm-thick liquid crystalline (4-n- pentyl-4′-cyanobiphenyl; 5CB) film were studied at three temperatures: 25 and 33 °C (near the crystalline- nematic and nematic-isotropic transition temperatures, respectively) and 29 °C (a median temperature in the stability region of the nematic phase). The ZnSe surfaces that entrap the liquid crystal (LC) film have been polished unidirectionally to produce a grooved surface presenting nanometer-scale corrugations, a structure that induces a planar and homogeneous orientation in the nematic phase. The present work attempts to understand the influences of temperature on the surface-induced alignment and corresponding EO dynamics of the material. Step-scan time-resolved spectroscopy measurements were made to determine the rate constants for the electric-field-induced orientation and thermal relaxation of the 5CB film. The field-driven orientation rates vary sensitively with temperature across a range that spans the stability limits of the nematic phase; the relaxation rates, however, vary very little across this same temperature range. We propose that these differences in LC behavior arise as consequence of the interplay of the temperature dependence of the elastic constants, viscosity, and degree of orientational order of the LC medium. A simple theoretical model provides some understanding of these behaviors. Introduction Fundamental understanding of interfacial interactions between fluids and surfaces are important for advancing progress in many areas of technology. In diverse fields such as biomaterials 1 and tribology, 2 for example, substantial influences are known to originate as direct consequences of the molecular structure and compositions present at an interface. These, in turn, provide a rich set of mechanisms through which complex functional properties of a system can be modified (e.g., to promote adhesion 3 or inhibit wear 4 ) or controlled (e.g., to inhibit an inflammatory response to a medical prosthetic device 5 ). This report is concerned with a system in which interfacial actions provide a critical control mechanism, one that enables the multibillion dollar commercial technology of flat-panel liquid crystal displays (LCDs). 6 The functioning of these devices and their energy efficiency depends very sensitively on the control- ling impacts of anchoring interactions. 7-11 These interactions most typically involve both molecular and more coarse-grained physical contributions as the means for controlling the meso- scopic organization that make it possible to exploit the elec- trooptical properties of liquid crystalline phases. 12,13 Much research has been conducted on the effects of surface properties on the alignment of liquid crystalline meso- phases, 9,14,15 and the methods through which specific alignments can be induced, whether textured, 16-18 chemical, 19,20 or other, 21,22 are now well established. Even so, the physics of these influences (especially as regards to their impacts on electro- optical dynamics 23-25 ) remain incompletely understood, and there exist opportunities to exploit new approaches to alignment that might serve as the foundation of a vastly more energy- efficient display technology. 26 In a previous report, 27 we examined the surface-dependent anchoring and electrooptical (EO) dynamics of thin liquid crystalline films using Fourier transform infrared (FTIR) spectroscopy and step-scan time-resolved spectroscopy (TRS). The EO dynamics were shown to be very sensitive to variations in the surface morphologies, and an assessment of the underlying mechanisms involved in the EO dynamic variations was provided by a coarse-grained dynamical model. The current report studies the convolved impacts of the temperature-dependent elastic constants and hydrodynamic viscosity on the EO dynamics of a prototypical LC material. We specifically explore the influence of temperature on the mediating role of the anchoring interactions. The structural organizations of LC mesophases are very sensitive to thermal influences 28,29 due to the temperature-dependent viscoelastic properties of these materials. 30,31 Temperature also impacts EO dynamical behaviors, although it can do so in complex ways involving many forms of mechanistic underpinnings. We explore these issues for the nematic liquid crystal, 4-n-pentyl-4′- cyanobiphenyl (5CB), 12,32 based on the same sample cell as used in our previous study 27 where the alignment of the molecules is induced using long-period, shallow-amplitude corrugations. The effects of temperature on the stability of the structural organization and the corresponding EO dynamics that they induce were examined at three temperatures: 25 and 33 °C (near the crystalline-nematic and nematic-isotropic phase transition temperatures, respectively) and 29 °C (a temperature at the midpoint from either phase boundary). The time scales at which the electric-field-induced orientation and thermal relaxations occur proved to be especially interesting. The softening of the elastic constants at higher temperatures leads to predictably * Authors to whom correspondence should be addressed. Phone: (217) 244-0809. Fax: (217) 244-2278. E-mail: [email protected]; [email protected]. 15782 J. Phys. Chem. B 2006, 110, 15782-15790 10.1021/jp056047u CCC: $33.50 © 2006 American Chemical Society Published on Web 07/27/2006
Transcript of Effects of Temperature on the Alignment and Electrooptical Responses of a Nematic Nanoscale Liquid...
Effects of Temperature on the Alignment and Electrooptical Responses of a NematicNanoscale Liquid Crystalline Film
Lay Min Lee, Hye J. Kwon, Ralph G. Nuzzo,* and Ken S. Schweizer*Department of Chemistry, Department of Materials Science and Engineering, and the Frederick Seitz MaterialsResearch Laboratory, UniVersity of Illinois at Urbana-Champaign, Urbana, Illinois 61801
ReceiVed: October 21, 2005; In Final Form: May 1, 2006
The surface-induced alignment and electrooptical (EO) dynamics of a 50-nm-thick liquid crystalline (4-n-pentyl-4′-cyanobiphenyl; 5CB) film were studied at three temperatures: 25 and 33°C (near the crystalline-nematic and nematic-isotropic transition temperatures, respectively) and 29°C (a median temperature in thestability region of the nematic phase). The ZnSe surfaces that entrap the liquid crystal (LC) film have beenpolished unidirectionally to produce a grooved surface presenting nanometer-scale corrugations, a structurethat induces a planar and homogeneous orientation in the nematic phase. The present work attempts tounderstand the influences of temperature on the surface-induced alignment and corresponding EO dynamicsof the material. Step-scan time-resolved spectroscopy measurements were made to determine the rate constantsfor the electric-field-induced orientation and thermal relaxation of the 5CB film. The field-driven orientationrates vary sensitively with temperature across a range that spans the stability limits of the nematic phase; therelaxation rates, however, vary very little across this same temperature range. We propose that these differencesin LC behavior arise as consequence of the interplay of the temperature dependence of the elastic constants,viscosity, and degree of orientational order of the LC medium. A simple theoretical model provides someunderstanding of these behaviors.
Introduction
Fundamental understanding of interfacial interactions betweenfluids and surfaces are important for advancing progress in manyareas of technology. In diverse fields such as biomaterials1 andtribology,2 for example, substantial influences are known tooriginate as direct consequences of the molecular structure andcompositions present at an interface. These, in turn, provide arich set of mechanisms through which complex functionalproperties of a system can be modified (e.g., to promoteadhesion3 or inhibit wear4) or controlled (e.g., to inhibit aninflammatory response to a medical prosthetic device5).
This report is concerned with a system in which interfacialactions provide a critical control mechanism, one that enablesthe multibillion dollar commercial technology of flat-panel liquidcrystal displays (LCDs).6 The functioning of these devices andtheir energy efficiency depends very sensitively on the control-ling impacts of anchoring interactions.7-11 These interactionsmost typically involve both molecular and more coarse-grainedphysical contributions as the means for controlling the meso-scopic organization that make it possible to exploit the elec-trooptical properties of liquid crystalline phases.12,13
Much research has been conducted on the effects of surfaceproperties on the alignment of liquid crystalline meso-phases,9,14,15and the methods through which specific alignmentscan be induced, whether textured,16-18 chemical,19,20or other,21,22
are now well established. Even so, the physics of theseinfluences (especially as regards to their impacts on electro-optical dynamics23-25) remain incompletely understood, andthere exist opportunities to exploit new approaches to alignment
that might serve as the foundation of a vastly more energy-efficient display technology.26
In a previous report,27 we examined the surface-dependentanchoring and electrooptical (EO) dynamics of thin liquidcrystalline films using Fourier transform infrared (FTIR)spectroscopy and step-scan time-resolved spectroscopy (TRS).The EO dynamics were shown to be very sensitive to variationsin the surface morphologies, and an assessment of the underlyingmechanisms involved in the EO dynamic variations wasprovided by a coarse-grained dynamical model.
The current report studies the convolved impacts of thetemperature-dependent elastic constants and hydrodynamicviscosity on the EO dynamics of a prototypical LC material.We specifically explore the influence of temperature on themediating role of the anchoring interactions. The structuralorganizations of LC mesophases are very sensitive to thermalinfluences28,29 due to the temperature-dependent viscoelasticproperties of these materials.30,31Temperature also impacts EOdynamical behaviors, although it can do so in complex waysinvolving many forms of mechanistic underpinnings. We explorethese issues for the nematic liquid crystal, 4-n-pentyl-4′-cyanobiphenyl (5CB),12,32based on the same sample cell as usedin our previous study27 where the alignment of the moleculesis induced using long-period, shallow-amplitude corrugations.The effects of temperature on the stability of the structuralorganization and the corresponding EO dynamics that theyinduce were examined at three temperatures: 25 and 33°C (nearthe crystalline-nematic and nematic-isotropic phase transitiontemperatures, respectively) and 29°C (a temperature at themidpoint from either phase boundary). The time scales at whichthe electric-field-induced orientation and thermal relaxationsoccur proved to be especially interesting. The softening of theelastic constants at higher temperatures leads to predictably
* Authors to whom correspondence should be addressed. Phone:(217) 244-0809. Fax: (217) 244-2278. E-mail: [email protected];[email protected].
15782 J. Phys. Chem. B2006,110,15782-15790
10.1021/jp056047u CCC: $33.50 © 2006 American Chemical SocietyPublished on Web 07/27/2006
faster electric-field-induced orientation rates; the relaxation rates,however, do not vary markedly with temperature. These strikingexperimental results are interpreted and accounted for semi-quantitatively using a theoretical framework presented in ourprevious report.27
Experimental Section
The liquid crystal EO cell employed and its means offabrication have been described in detail in earlier reports.27,33-35
The cell used in this study adopts the same design rules asdescribed there. The ZnSe windows were polished to producea nanometer-scale, grooved morphology that serves to align theLC director. These long-period corrugations were generated bypolishing the substrate crystals using motions restricted to withina few degrees along one primary axis. Representative atomicforce microscopy (AFM) micrographs of the polished surfacesare given in the earlier report.27
The methods of assembling the EO cell with 5CB are thesame as those described elsewhere.33,35The temperature of theliquid crystalline sample was controlled by attaching flexibleKapton resistive heating elements with pressure-sensitive ad-hesive surfaces (Watlow, St. Louis, MO) onto the stainless steelsample holder. Four heaters were attached, connected in series,and actuated by applying voltage from a programmable powersupply. The temperature of the sample was monitored with aEurotherm programmable temperature controller via a thermo-couple attached underneath the bottom ZnSe piece of the liquidcrystalline EO cell and interfaced with the power supply. Withthis setup, we were able to hold the sample temperature to within(0.2 °C of the set point during the experiments.
Two kinds of infrared spectroscopic measurements weremade. In the first of these, stable voltages (ranging from 1 to15 V) were applied to an interdigitated electrode array (IDEA)with a direct current (DC) power supply, and infrared spectraof the induced state were recorded with a Bio-Rad (Cambridge,MA) FTS-6000 FTIR spectrometer. The spacing betweenelectrodes is fixed at 15µm. In the second set of measurements,the step-scan feature of the FTS-6000 spectrometer was utilizedto observe the EO dynamics of the liquid crystalline sample byapplying transient electrical polarizations and capturing thecorresponding spectroscopic states on a sub-millisecond timescale. Details of all spectroscopic measurements are describedin our earlier reports27,33-35 and will not be discussed here.
Results and Qualitative Discussion
The liquid crystalline material 5CB exhibits a prototypicalnematic phase that has been studied extensively in the past.12,32
While representative of the materials finding use in the earliestversions of LCDs, the demands for high performance have ledto the introduction of devices that exploit more complexmesogenic structures typically based on multicomponent LCmixtures.6,36 Even so, 5CB remains a useful model system forstudies of LC dynamics. Its responses to surface morphologyand chemistry, for example, have been exhaustively studied andits alignment mechanisms on various surfaces are now reason-ably well understood.7-9 Among the various mechanisms usedto align this phase, we examine one that was first discoveredin the 1940s by Chatelain37 (and analyzed in the 1970s byBerreman16,17). This is a protocol that, in modified form, theflat-panel display industry still utilizes. By rubbing a surface(usually polymeric) unidirectionally, grooves are formed onit;16,17 additionally, the frictional heat produced in the processcan also serve to align the surface segments of molecularsubstrates (such as polymer) in the direction of the rubbing.38
When a nematic liquid crystalline material such as 5CB is placedon such a surface, the molecules adjacent to the surfacepreferentially align with their long axis oriented along the lengthof the grooves to minimize their free energy (via the minimiza-tion of elastic strains),16,17and these molecules in turn serve toalign the bulk material via intermolecular interactions.
Recent work from our group demonstrated that inorganicsurfaces such as ZnSe, when treated appropriately, can alsoeffectively manipulate the nematic phase alignment.34 Thepresent study adopts a recently described refinement of thesemethods to develop a highly anisotropic planar alignment in5CB.27 We adopt here a protocol in which the ZnSe is polishedto produce long-period nanometer-scale grooves and study thealignment and dynamics of 5CB induced by it. In particular,we study a specific alignment of the nematic phase thatfacilitates quantitative comparisons with the predictions of thetheoretical model described in our previous work.27 From pastexperimental efforts, we expected that the 5CB nematic phasewould form a planar structure in the 50-nm-thick EO cell, inwhich the director aligns in a strongly anisotropic manner alongthe length of the grooves (and parallel to the electrode digits).The experiments described below confirm this expectation.
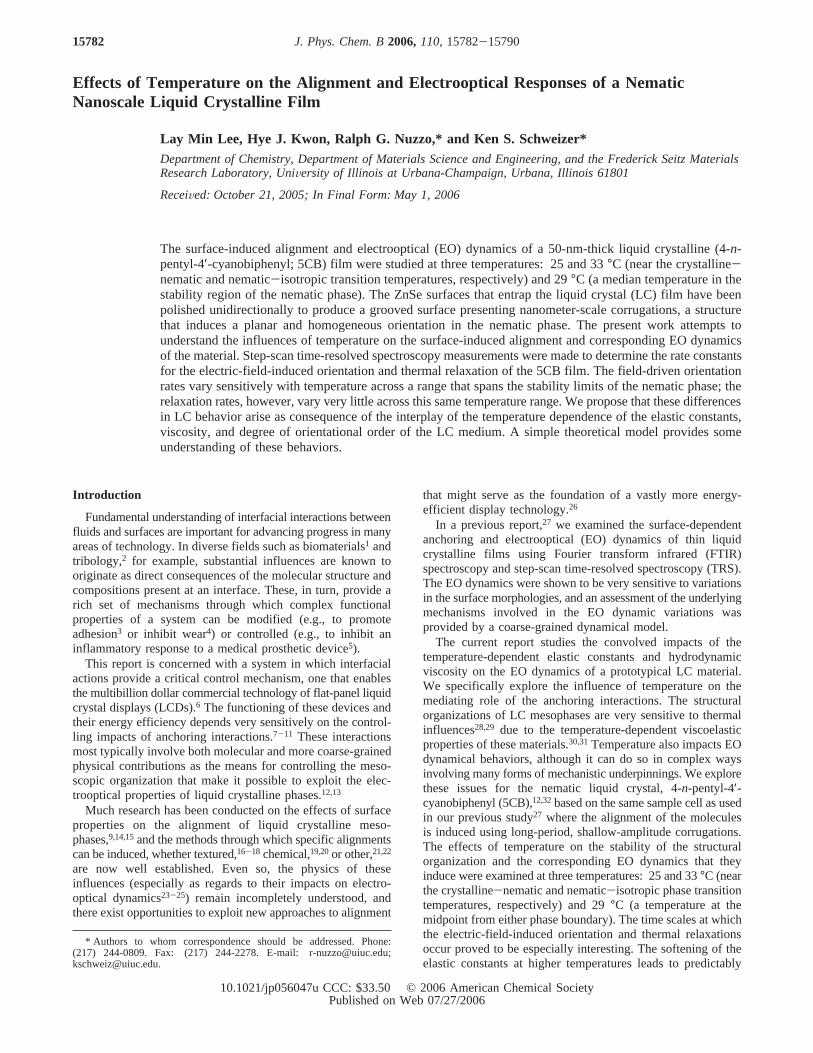
1. Polarized IR Responses of 5CB to Static Voltages.Polarized IR spectroscopy was used to determine the organiza-tion of the nematic liquid crystalline phase since the IR selectionrule yields information about the orientations of moleculespresent in a sample. The optical polarization of the IR radiationis defined with respect to the IDEA digits as describedelsewhere.27,33-35 The mode assignments for 5CB have beendiscussed in the literature.39,40 The structure of 5CB is shownin Chart 1.
The director alignment of the nematic phase is also definedwith respect to one (low-energy conformational) representationof the optic axis of the molecule. The orientation of the directoris strongly correlated with certain dipole transition moments,such as theνCN and in-plane aromatic modes, which rigorouslylie along the length of the rigid cyanobiphenyl portion of themolecule.39,40We focus on the IR modes corresponding to thesetransition moments as they are both intense and well-resolvedin the IR spectra.
Figures 1a-c show the dichroic spectra of 5CB measured at25, 29, and 33°C, respectively, a range of temperatures thatbroadly spans the stability limits of the nematic phase. Themodes with transition dipole moments projecting strongly alongthe optic axis of 5CB, such as theνCN and in-plane aromaticring modes, appear as intense positive features in these spectra.The negative intensity features correspond to modes withtransition moments lying perpendicular to this axis; these includemost notably the out-of-plane ring deformation modes of thearomatic 5CB core. To quantify these data, temperature-dependent dichroic ratios,D, were measured and found to be2.9 (25 °C), 2.4 (29°C), and 2.1 (33°C). Although the fullnature of the structural organization of the LC sample cannotbe deduced from these data alone, we infer from them that thedirector of the LC sample exhibits significant in-plane orderingthat projects strongly in the parallel direction lying along thelength of the electrode digits and the grooves on the ZnSe
CHART 1: 4-n-Pentyl-4′-cyanobiphenyl (5CB) Moleculea
a The arrow indicates the approximate optic axis of the molecule.
Temperature Effects on a Nematic LC Film J. Phys. Chem. B, Vol. 110, No. 32, 200615783
surface. This alignment, as inferred from the calculated dichroicratios, increases with cooling as expected.
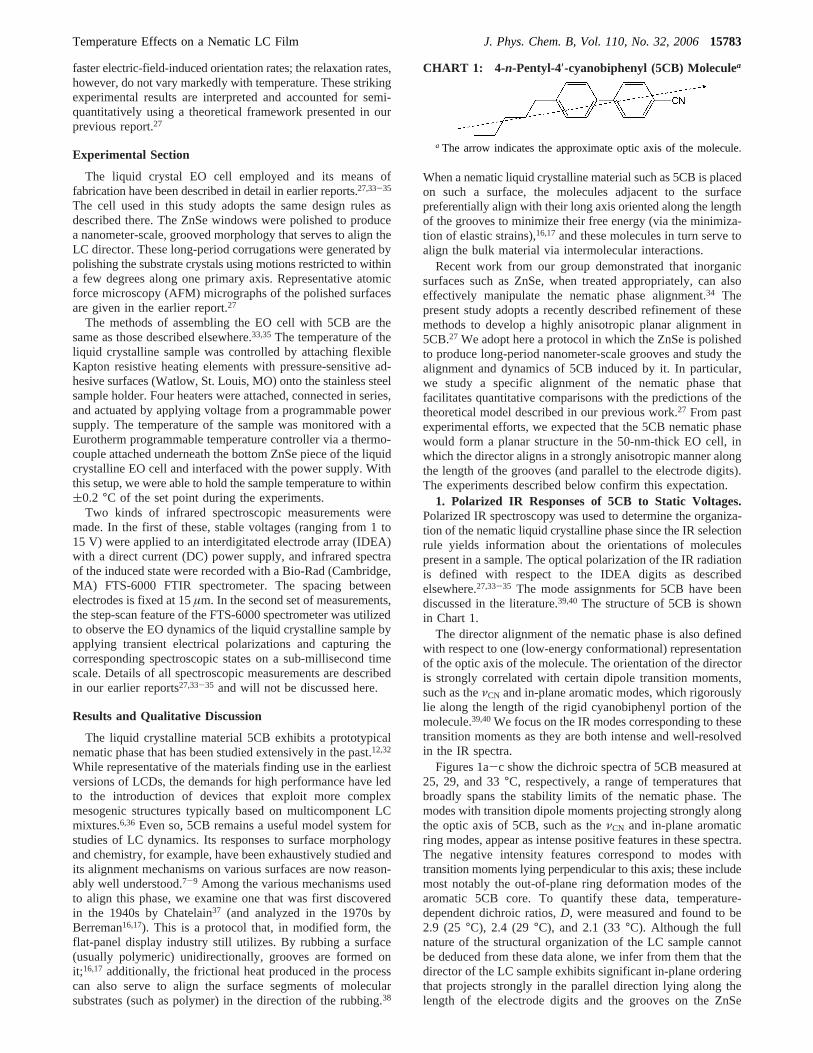
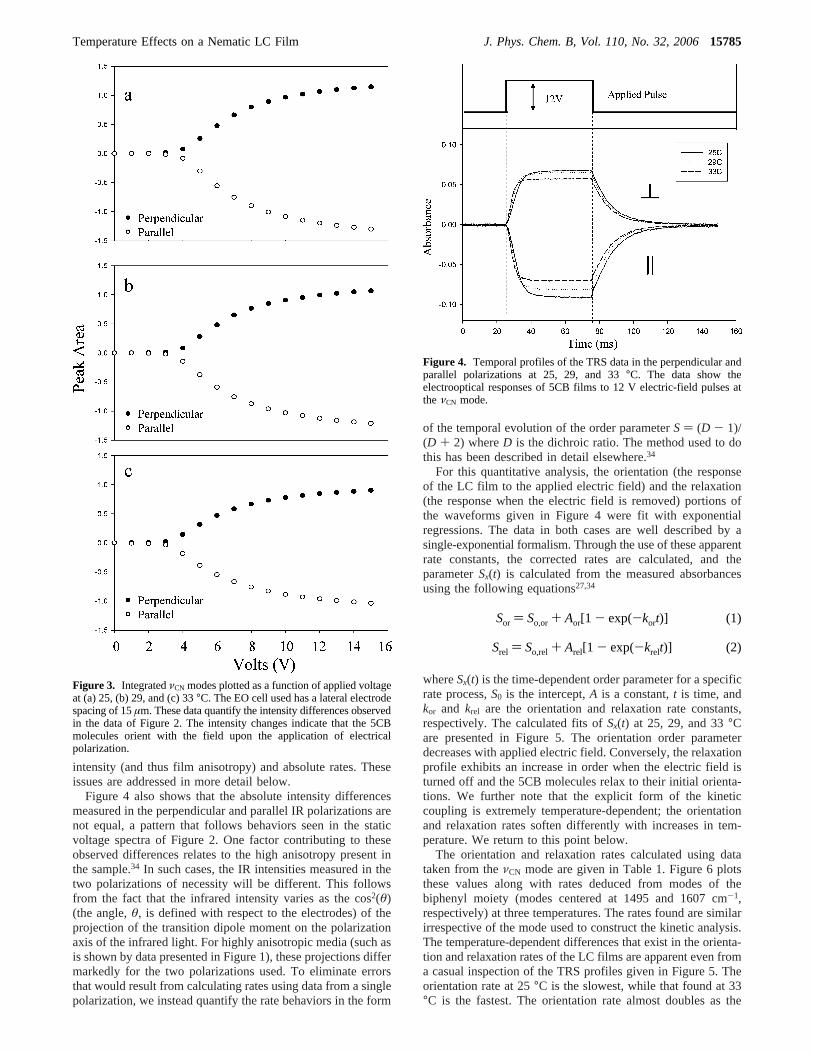
Representative IR spectra taken during the application of staticvoltages at 25, 29, and 33°C over a range of incrementallyincreased applied voltages (3-15 V or, equivalently, fieldstrengths ranging from 2500 to 10 000 V cm-1) are shown inFigure 2. These data imply that 5CB aligns as expected alongthe electric-field lines with the magnitude of the field-induced
reorganization increasing as stronger fields are applied. Theabsolute magnitudes of the intensity changes are slightlydifferent for the two infrared polarizations. Those measured inthe perpendicular direction are, in absolute measure, weaker thanthose found in the parallel case. This trend is more fullyquantified in Figure 3, in which the voltage-dependent integratedareas for theνCN mode are plotted; the integrated intensitychanges seen with respect to the applied fields also are notexactly commensurate in the two polarizations. One contributorto this difference results from the optics of the IR experimentand the influence of specific projections of transition momentson the measured band intensities.34 From this voltage-dependentIR data and that of Figure 1, we can develop a general pictureof the organization present in the LC sample. In the absence ofthe applied field, the nematic phase adopts a planar organizationin which the director strongly aligns in a collinear fashion alongthe direction defined by the electrode bands and substrategrooves. This LC organization is one that agrees well withpreviously published work both from our own group34 and thatof others.16,17,41-43 The data of Figure 3 also suggest that someminor out-of-plane alignments of 5CB may also be present, afact that has some impacts on the field-dependent dynamics ofthe material. We discuss this point in more detail below.
2. Electrooptical Dynamics of 5CB.Time-resolved IR datawere analyzed using literature protocols27,34 by examining thetemporal evolution of a specific vibrational mode absorbance.Figure 4 shows temporal domain data for the prominent IR modeat 2226 cm-1 (νCN) at 25, 29, and 33°C acquired using a 50ms, 12 V square electric-field pulse to drive the reorganizationof the equilibrium 5CB alignment. The pulse profile boundariesare depicted schematically in the figure along with data thatillustrate the effects that the electrical polarizations have on theνCN optical density and thus the correlated alignment of the LCfilm.
One notes from Figure 4 that the electric-field-inducedresponse of the 50-nm-thick 5CB film takes place on a severalmillisecond time scale. This electric-field-induced orientationresponse and its relaxation exhibit a striking pattern of sensitivityto temperature that is evident in terms of both impacts on band
Figure 1. Dichroic spectra of the 5CB film at (a) 25, (b) 29, and (c)33 °C. The dichroic ratios of these films are 2.9, 2.4, and 2.1,respectively. The positive features in the spectra correspond to thevibrational modes that lie predominantly parallel to the optic axis of5CB, whereas the negative features are orthogonal to this axis. Thespectra indicate that the director of the LC phase lies parallel to theelectrode digits.
Figure 2. Static voltage spectra of the 5CB film at (a) 25, (b) 29, and (c) 33°C. The EO cell used has a lateral electrode spacing of 15µm. Theupper panels show the data taken with perpendicular infrared polarization (parallel with the applied field), while the bottom panels show thosetaken with parallel polarization.
15784 J. Phys. Chem. B, Vol. 110, No. 32, 2006 Lee et al.
intensity (and thus film anisotropy) and absolute rates. Theseissues are addressed in more detail below.
Figure 4 also shows that the absolute intensity differencesmeasured in the perpendicular and parallel IR polarizations arenot equal, a pattern that follows behaviors seen in the staticvoltage spectra of Figure 2. One factor contributing to theseobserved differences relates to the high anisotropy present inthe sample.34 In such cases, the IR intensities measured in thetwo polarizations of necessity will be different. This followsfrom the fact that the infrared intensity varies as the cos2(θ)(the angle,θ, is defined with respect to the electrodes) of theprojection of the transition dipole moment on the polarizationaxis of the infrared light. For highly anisotropic media (such asis shown by data presented in Figure 1), these projections differmarkedly for the two polarizations used. To eliminate errorsthat would result from calculating rates using data from a singlepolarization, we instead quantify the rate behaviors in the form
of the temporal evolution of the order parameterS) (D - 1)/(D + 2) whereD is the dichroic ratio. The method used to dothis has been described in detail elsewhere.34
For this quantitative analysis, the orientation (the responseof the LC film to the applied electric field) and the relaxation(the response when the electric field is removed) portions ofthe waveforms given in Figure 4 were fit with exponentialregressions. The data in both cases are well described by asingle-exponential formalism. Through the use of these apparentrate constants, the corrected rates are calculated, and theparameterSx(t) is calculated from the measured absorbancesusing the following equations27,34
whereSx(t) is the time-dependent order parameter for a specificrate process,S0 is the intercept,A is a constant,t is time, andkor and krel are the orientation and relaxation rate constants,respectively. The calculated fits ofSx(t) at 25, 29, and 33°Care presented in Figure 5. The orientation order parameterdecreases with applied electric field. Conversely, the relaxationprofile exhibits an increase in order when the electric field isturned off and the 5CB molecules relax to their initial orienta-tions. We further note that the explicit form of the kineticcoupling is extremely temperature-dependent; the orientationand relaxation rates soften differently with increases in tem-perature. We return to this point below.
The orientation and relaxation rates calculated using datataken from theνCN mode are given in Table 1. Figure 6 plotsthese values along with rates deduced from modes of thebiphenyl moiety (modes centered at 1495 and 1607 cm-1,respectively) at three temperatures. The rates found are similarirrespective of the mode used to construct the kinetic analysis.The temperature-dependent differences that exist in the orienta-tion and relaxation rates of the LC films are apparent even froma casual inspection of the TRS profiles given in Figure 5. Theorientation rate at 25°C is the slowest, while that found at 33°C is the fastest. The orientation rate almost doubles as the
Figure 3. IntegratedνCN modes plotted as a function of applied voltageat (a) 25, (b) 29, and (c) 33°C. The EO cell used has a lateral electrodespacing of 15µm. These data quantify the intensity differences observedin the data of Figure 2. The intensity changes indicate that the 5CBmolecules orient with the field upon the application of electricalpolarization.
Figure 4. Temporal profiles of the TRS data in the perpendicular andparallel polarizations at 25, 29, and 33°C. The data show theelectrooptical responses of 5CB films to 12 V electric-field pulses atthe νCN mode.
Sor ) So,or + Aor[1 - exp(-kort)] (1)
Srel ) So,rel + Arel[1 - exp(-krelt)] (2)
Temperature Effects on a Nematic LC Film J. Phys. Chem. B, Vol. 110, No. 32, 200615785
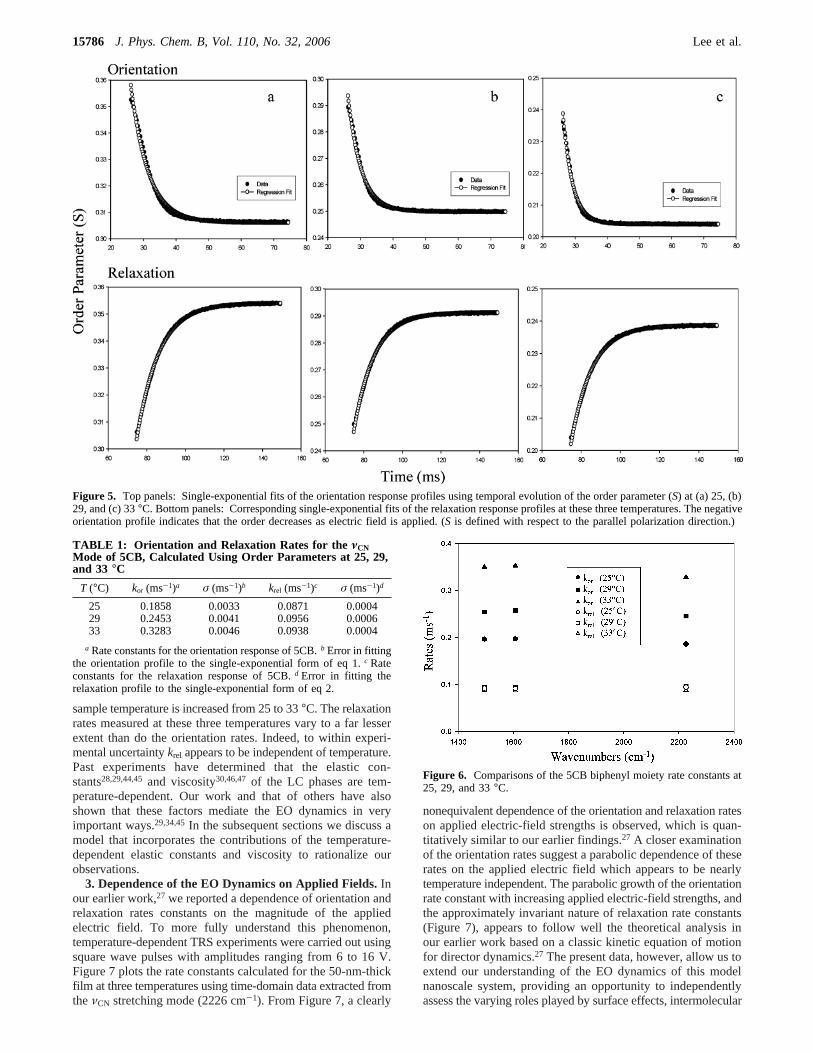
sample temperature is increased from 25 to 33°C. The relaxationrates measured at these three temperatures vary to a far lesserextent than do the orientation rates. Indeed, to within experi-mental uncertaintykrel appears to be independent of temperature.Past experiments have determined that the elastic con-stants28,29,44,45and viscosity30,46,47 of the LC phases are tem-perature-dependent. Our work and that of others have alsoshown that these factors mediate the EO dynamics in veryimportant ways.29,34,45In the subsequent sections we discuss amodel that incorporates the contributions of the temperature-dependent elastic constants and viscosity to rationalize ourobservations.
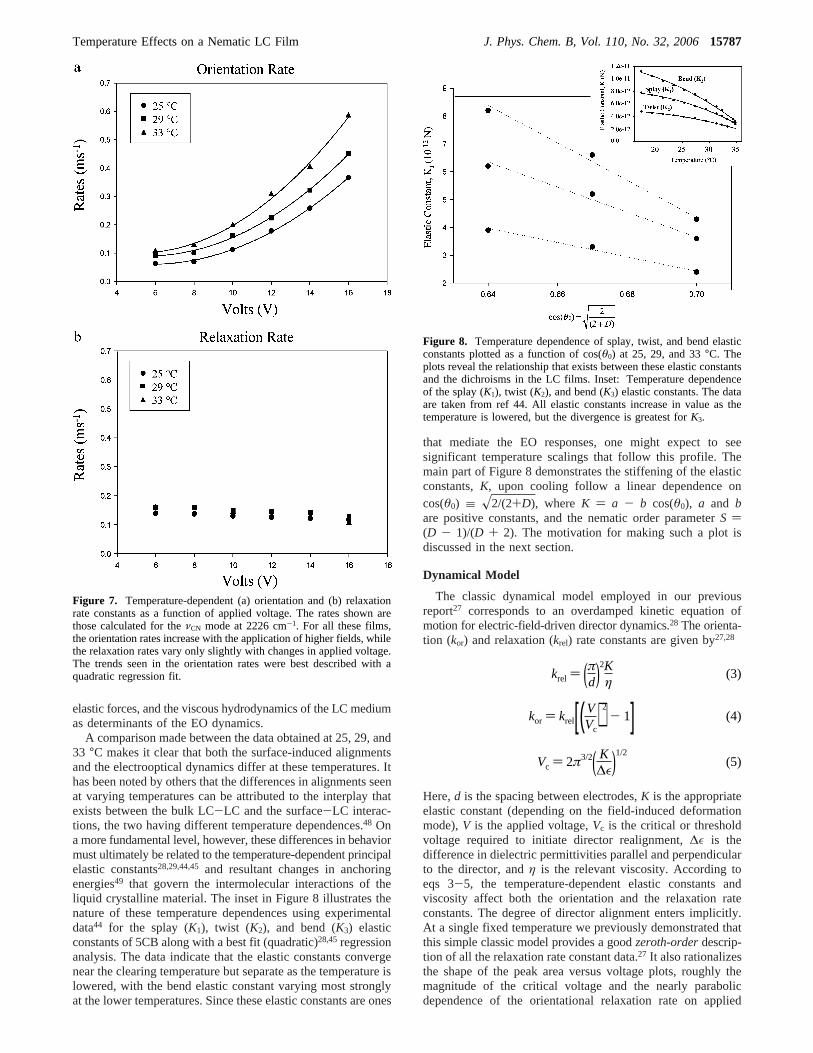
3. Dependence of the EO Dynamics on Applied Fields.Inour earlier work,27 we reported a dependence of orientation andrelaxation rates constants on the magnitude of the appliedelectric field. To more fully understand this phenomenon,temperature-dependent TRS experiments were carried out usingsquare wave pulses with amplitudes ranging from 6 to 16 V.Figure 7 plots the rate constants calculated for the 50-nm-thickfilm at three temperatures using time-domain data extracted fromtheνCN stretching mode (2226 cm-1). From Figure 7, a clearly
nonequivalent dependence of the orientation and relaxation rateson applied electric-field strengths is observed, which is quan-titatively similar to our earlier findings.27 A closer examinationof the orientation rates suggest a parabolic dependence of theserates on the applied electric field which appears to be nearlytemperature independent. The parabolic growth of the orientationrate constant with increasing applied electric-field strengths, andthe approximately invariant nature of relaxation rate constants(Figure 7), appears to follow well the theoretical analysis inour earlier work based on a classic kinetic equation of motionfor director dynamics.27 The present data, however, allow us toextend our understanding of the EO dynamics of this modelnanoscale system, providing an opportunity to independentlyassess the varying roles played by surface effects, intermolecular
Figure 5. Top panels: Single-exponential fits of the orientation response profiles using temporal evolution of the order parameter (S) at (a) 25, (b)29, and (c) 33°C. Bottom panels: Corresponding single-exponential fits of the relaxation response profiles at these three temperatures. The negativeorientation profile indicates that the order decreases as electric field is applied. (S is defined with respect to the parallel polarization direction.)
TABLE 1: Orientation and Relaxation Rates for the νCNMode of 5CB, Calculated Using Order Parameters at 25, 29,and 33 °C
T (°C) kor (ms-1)a σ (ms-1)b krel (ms-1)c σ (ms-1)d
25 0.1858 0.0033 0.0871 0.000429 0.2453 0.0041 0.0956 0.000633 0.3283 0.0046 0.0938 0.0004
a Rate constants for the orientation response of 5CB.b Error in fittingthe orientation profile to the single-exponential form of eq 1.c Rateconstants for the relaxation response of 5CB.d Error in fitting therelaxation profile to the single-exponential form of eq 2.
Figure 6. Comparisons of the 5CB biphenyl moiety rate constants at25, 29, and 33°C.
15786 J. Phys. Chem. B, Vol. 110, No. 32, 2006 Lee et al.
elastic forces, and the viscous hydrodynamics of the LC mediumas determinants of the EO dynamics.
A comparison made between the data obtained at 25, 29, and33 °C makes it clear that both the surface-induced alignmentsand the electrooptical dynamics differ at these temperatures. Ithas been noted by others that the differences in alignments seenat varying temperatures can be attributed to the interplay thatexists between the bulk LC-LC and the surface-LC interac-tions, the two having different temperature dependences.48 Ona more fundamental level, however, these differences in behaviormust ultimately be related to the temperature-dependent principalelastic constants28,29,44,45and resultant changes in anchoringenergies49 that govern the intermolecular interactions of theliquid crystalline material. The inset in Figure 8 illustrates thenature of these temperature dependences using experimentaldata44 for the splay (K1), twist (K2), and bend (K3) elasticconstants of 5CB along with a best fit (quadratic)28,45regressionanalysis. The data indicate that the elastic constants convergenear the clearing temperature but separate as the temperature islowered, with the bend elastic constant varying most stronglyat the lower temperatures. Since these elastic constants are ones
that mediate the EO responses, one might expect to seesignificant temperature scalings that follow this profile. Themain part of Figure 8 demonstrates the stiffening of the elasticconstants,K, upon cooling follow a linear dependence oncos(θ0) ≡ x2/(2+D), where K ) a - b cos(θ0), a and bare positive constants, and the nematic order parameterS )(D - 1)/(D + 2). The motivation for making such a plot isdiscussed in the next section.
Dynamical Model
The classic dynamical model employed in our previousreport27 corresponds to an overdamped kinetic equation ofmotion for electric-field-driven director dynamics.28 The orienta-tion (kor) and relaxation (krel) rate constants are given by27,28
Here,d is the spacing between electrodes,K is the appropriateelastic constant (depending on the field-induced deformationmode),V is the applied voltage,Vc is the critical or thresholdvoltage required to initiate director realignment,∆ε is thedifference in dielectric permittivities parallel and perpendicularto the director, andη is the relevant viscosity. According toeqs 3-5, the temperature-dependent elastic constants andviscosity affect both the orientation and the relaxation rateconstants. The degree of director alignment enters implicitly.At a single fixed temperature we previously demonstrated thatthis simple classic model provides a goodzeroth-orderdescrip-tion of all the relaxation rate constant data.27 It also rationalizesthe shape of the peak area versus voltage plots, roughly themagnitude of the critical voltage and the nearly parabolicdependence of the orientational relaxation rate on applied
Figure 7. Temperature-dependent (a) orientation and (b) relaxationrate constants as a function of applied voltage. The rates shown arethose calculated for theνCN mode at 2226 cm-1. For all these films,the orientation rates increase with the application of higher fields, whilethe relaxation rates vary only slightly with changes in applied voltage.The trends seen in the orientation rates were best described with aquadratic regression fit.
Figure 8. Temperature dependence of splay, twist, and bend elasticconstants plotted as a function of cos(θ0) at 25, 29, and 33°C. Theplots reveal the relationship that exists between these elastic constantsand the dichroisms in the LC films. Inset: Temperature dependenceof the splay (K1), twist (K2), and bend (K3) elastic constants. The dataare taken from ref 44. All elastic constants increase in value as thetemperature is lowered, but the divergence is greatest forK3.
krel ) (πd)2Kη
(3)
kor ) krel[( VVc
)2- 1] (4)
Vc ) 2π3/2( K∆ε)1/2
(5)
Temperature Effects on a Nematic LC Film J. Phys. Chem. B, Vol. 110, No. 32, 200615787
voltage. However, a complex dependence of the magnitude ofthe orientational rate constants at fixed voltage on film thicknessand anchoring conditions was found that is not simply ratio-nalizable. These strongly nonuniversal consequences of variablefilm thickness and surface treatment were discovered to becorrelated with a specific measure of the degree of quiescentnematic order. Here we sketch the ideas developed in priorwork27 and apply and extend them to provide a physicalinterpretation of our new temperature-dependent data.
At high voltages well beyond the threshold value eq 4simplifies to
The viscosity and dielectric anisotropy parameter enter thedetermination ofkor and depend on system variables includingthe degree of nematic order, which is highly variable dependingon film thickness, surface treatment, and temperature. In realitythe nematic order is described by a probability distribution dueto thermal fluctuations. However, the latter are ignored in theclassic mean field mesoscopic kinetic approach,28 and one cancrudely relate the orientational order parameter (S) or dichroicratio (D) to a “mean alignment angle”Θh as
We previously argued that the electric-field-driven orientationprocess speeds up with decreasing nematic order.27 Onequantitative measure of the latter is the magnitude of theprojection of the mean director orientation along the electricfield, which is given by
whereθ0 ≡ (π/2) - Θh . Remarkably, at the single temperaturepreviously studied, a (nearly) linear dependence of the orienta-tion rate constant onx2/(2+D) was found for all variable filmthicknesses and surface treatment/anchoring conditions.27 Ifinterpreted in the context of the classical result of eq 6, thiscorrelation suggests that the leading order dependence of thefactor∆ε/η on the degree of nematic order scales asx2/(2+D).The underlying microscopic mechanism of this remarkablecorrelation is not precisely established. However, one physicallyexpects the viscous resistance for the electric-field-drivenorientation orthogonal to the director will increase as the degreeof quiescent nematic order increases. Equation 6 does suggestsuch a qualitative trend.
Comparison of Theory and Experiment
For the purposes of the discussion that follows, we considerthe representative time-domain data of Figure 4. Upon applica-tion of the electrical polarizations, the prompt increase in theabsorbance seen in these temporal profiles of theνCN differencespectra (Figure 4) is the result of predominantly twisting motionsof the LC molecules. Our system is in some ways similar tothe planar orientations examined in the earlier study.27 One ofthe cells used in that study, however, was based on a somewhatdifferent design that incorporated a polyimide planarization layerto mediate the anchoring interactions of 5CB.
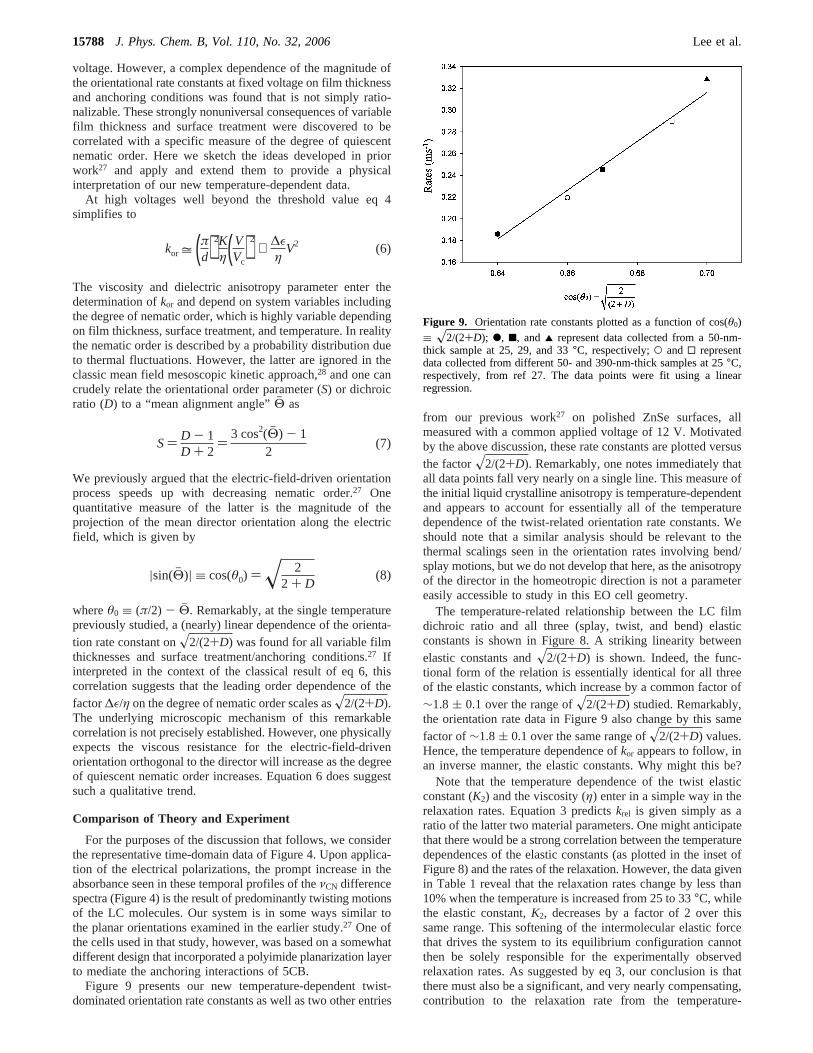
Figure 9 presents our new temperature-dependent twist-dominated orientation rate constants as well as two other entries
from our previous work27 on polished ZnSe surfaces, allmeasured with a common applied voltage of 12 V. Motivatedby the above discussion, these rate constants are plotted versusthe factorx2/(2+D). Remarkably, one notes immediately thatall data points fall very nearly on a single line. This measure ofthe initial liquid crystalline anisotropy is temperature-dependentand appears to account for essentially all of the temperaturedependence of the twist-related orientation rate constants. Weshould note that a similar analysis should be relevant to thethermal scalings seen in the orientation rates involving bend/splay motions, but we do not develop that here, as the anisotropyof the director in the homeotropic direction is not a parametereasily accessible to study in this EO cell geometry.
The temperature-related relationship between the LC filmdichroic ratio and all three (splay, twist, and bend) elasticconstants is shown in Figure 8. A striking linearity betweenelastic constants andx2/(2+D) is shown. Indeed, the func-tional form of the relation is essentially identical for all threeof the elastic constants, which increase by a common factor of∼1.8 ( 0.1 over the range ofx2/(2+D) studied. Remarkably,the orientation rate data in Figure 9 also change by this samefactor of∼1.8( 0.1 over the same range ofx2/(2+D) values.Hence, the temperature dependence ofkor appears to follow, inan inverse manner, the elastic constants. Why might this be?
Note that the temperature dependence of the twist elasticconstant (K2) and the viscosity (η) enter in a simple way in therelaxation rates. Equation 3 predictskrel is given simply as aratio of the latter two material parameters. One might anticipatethat there would be a strong correlation between the temperaturedependences of the elastic constants (as plotted in the inset ofFigure 8) and the rates of the relaxation. However, the data givenin Table 1 reveal that the relaxation rates change by less than10% when the temperature is increased from 25 to 33°C, whilethe elastic constant,K2, decreases by a factor of 2 over thissame range. This softening of the intermolecular elastic forcethat drives the system to its equilibrium configuration cannotthen be solely responsible for the experimentally observedrelaxation rates. As suggested by eq 3, our conclusion is thatthere must also be a significant, and very nearly compensating,contribution to the relaxation rate from the temperature-
kor = (πd)2K
η( VVc
)2∝ ∆ε
ηV2 (6)
S) D - 1D + 2
)3 cos2(Θh ) - 1
2(7)
|sin(Θh )| ≡ cos(θ0) ) x 22 + D
(8)
Figure 9. Orientation rate constants plotted as a function of cos(θ0)≡ x2/(2+D); b, 9, and 2 represent data collected from a 50-nm-thick sample at 25, 29, and 33°C, respectively;O and 0 representdata collected from different 50- and 390-nm-thick samples at 25°C,respectively, from ref 27. The data points were fit using a linearregression.
15788 J. Phys. Chem. B, Vol. 110, No. 32, 2006 Lee et al.
dependent viscosity7 relevant to the twist motion that willincrease with cooling and enhanced nematic order.
The above analysis allows inferences to be made about therelative importance of different physical factors determining thetemperature dependence of the field-induced orientation rates,kor. Sincekrel is largely insensitive to changes in temperature,K/η ≈ constant. Hence, eq 6 suggests that the much strongerreduction of the orientation rate upon cooling at fixed voltagearises predominantly from the viscosity, which has a temperaturedependence essentially identical to the elastic constant whichdecreases withx2/(2+D) as seen in Figure 8. Hence, thecombination of eq 6, the near temperature invariance of therelaxation rates, and the elastic constant data of Figure 8provides a basis for understanding the remarkable correlationin Figure 9. A possible complication is the presence of thedielectric anisotropy parameter,∆ε, which is also expected tobe temperature-dependent. However, the fact that∆ε increasesupon cooling butkor decreasesas the temperature is lowered,further supports our deduction that the viscosity is the dominantdetermining factor of the thermal dependence of the orientationrate constant.
Summarizing, for these nanoscale nematic film structures wefind that temperature affects both the alignments and theelectrooptical dynamics significantly. These differences dependstrongly on both the temperature-dependent elastic constantsand the viscosity in ways that are quantified by the temperature-dependent order parameter or dichroic ratio. The suppressedorientation rate upon cooling is deduced to be primarilycontrolled by the growing quiescent nematic order parameterand concomitant higher viscous resistance for rotating thedirector toward the (orthogonal) electric-field direction. Fur-thermore, for the polished cells considered here and in priorwork,27 the striking correlation shown in Figure 9 holds notonly for the 50-nm-thick film but also the much thicker 390nm film. This suggests that a remarkable simplicity exists inthe sense that the consequences of a thicker film on theorientation rate constant enters solely via the modification ofthe nematic order parameter and its effect on the viscosity.
Conclusions
A rich temperature dependence of the electrooptical dynamicsof a nematic 5CB liquid crystalline film has been observed.The experimental findings can be interpreted based on a classiccoarse-grained mesoscopic model of driven director dynamics28
discussed and applied in detail in our earlier report.27 Theelectric-field-driven orientation rates were found to vary sen-sitively with temperature and applied voltage, while therelaxation rates do not. Furthermore, the orientation rates displaya parabolic dependence on applied electric field. A linearrelationship was found between a specific function of the initialanisotropy (x2/(2+D)) of the film and the measured orienta-tion rates, which appears tosimultaneouslyorganize all theeffects of temperature, film thickness, and surface treatment/anchoring state.
There is a caveat that merits discussion here. The presentstudy examines a specific LC mesogen (5CB), a material thatprovides a model for behaviors seen in the dynamics of othernanoscale LC thin films. What implications these results holdfor the more complex system used in displays remains, in somerespects, an open question. The latter technologies typicallyexploit the properties of complex LC mixtures, which can alsobe formulated with specific forms of low-concentration additives(e.g., ionic compounds that act to mediate high-frequencyswitching behaviors). In such cases the quantitative outcomes
for the dynamics, as established by the theoretical relationshipsemployed here, need not be precisely the same. Such cautionnot withstanding, the present work does provide materials-basedprinciples and device design rules that allow broad tunabilityof a material’s dynamical responses. In future studies, we willexplore these ideas in more detail, examining LC filmsexhibiting highly novel anisotropies and dramatically alteredEO dynamics. We also intend to investigate new approaches tochemically tailor substrate surfaces to obtain anchoring interac-tions that can be used to embed complex hierarchical organiza-tions into the LC mesophase. The latter work will exploit thesemicrofabricated systems to systematically examine discreteelastic deformations occurring in complex cooperative as-semblies of liquid crystalline materials.
Acknowledgment. We gratefully thank the National ScienceFoundation (Grant No. CHE 00-97096) and the Department ofEnergy (Grant No. DEFG02-91ER45439) for their support ofthis work. AFM studies were carried out at the Center forMicroanalysis of Materials at the University of Illinois Urbana-Champaign supported by the U. S. Department of Energy underContract No. DEFG02-91ER45439.
References and Notes
(1) Stuart, D. I.; Jones, Y. E.Curr. Opin. Struct. Biol.1995, 5, 735.(2) Bhushan, B.; Israelachvili, J. N.; Landman, U.Nature1995, 374,
607.(3) Alexopoulos, P. S.; O’Sullivan, T. C.Annu. ReV. Mater. Sci.1990,
20, 391.(4) Hu, Y.-Z.; Granick, S.Tribol. Lett. 1998, 5, 81.(5) Widmer, M. R.; Heuberger, M.; Voros, J.; Spencer, N. D.Tribol.
Lett. 2001, 10, 110.(6) Kaneko, E.Liquid Crystal TV Displays: Principles and Applica-
tions of Liquid Crystal Displays; KTK Scientific Publishers: Tokyo, 1987.(7) Cognard, J.Mol. Cryst. Liq. Cryst.1982, Supplement 1, 1.(8) Jerome, B.Rep. Prog. Phys.1991, 54, 391.(9) (a) Maugin, C.Compte Rendus1913, 156, 1246. (b) Maugin, C.
Bull. Soc. Fr. Mineral.1911, 34, 71. (c) Uchida, T.; Seki, H.SurfaceAlignment of Liquid Crystals; Bahadur, B., Ed.; World Scientific: Singapore,1992.
(10) Yeh, P.; Gu, C.Optics of Liquid Crystal Displays; John Wiley &Sons: New York, 1999.
(11) Goossens, W. J. A.Mol. Cryst. Liq. Cryst.1985, 124, 305.(12) Gray, G. W.; Harrison, K. J.; Nash, J. A.Electron. Lett.1973, 9,
130.(13) Schadt, M.Annu. ReV. Mater. Sci.1997, 27, 305.(14) Bryan-Brown, G. P.; Wood, E. L.; Sage, I. C.Nature1999, 399,
338.(15) Clark, N. A.Phys. ReV. Lett. 1985, 55, 292.(16) Berreman, D. W.Phys. ReV. Lett. 1972, 28, 1683.(17) Berreman, D. W.Mol. Cryst. Liq. Cryst.1973, 23, 215.(18) Chaudhari, P.; Lacey, J.; Doyle, J.; Galligan, E.; Lien, S.-C. A.;
Callegari, A.; Hougham, G.; Lang, N. D.; Andry, P. S.; John, R.; Yang,K.-H.; Lu, M.; Cai, C.; Speidell, J.; Purushothaman, S.; Ritsko, J.; Samant,M.; Stohr, J.; Nakagawa, Y.; Katoh, Y.; Saitoh, Y.; Sakai, K.; Satoh, H.;Odahara, S.; Nakano, H.; Nakagaki, J.; Shiota, Y.Nature2001, 411, 56.
(19) Nejoh, H.Surf. Sci.1991, 256, 94.(20) Drawhorn, R. A.; Abbott, N. L.J. Phys. Chem.1995, 99, 16511.(21) O’Neill, M.; Kelly, S. M. J. Phys. D: Appl. Phys.2000, 33, R67.(22) Wu, Y.; Demachi, Y.; Tsutsumi, O.; Kanazawa, A.; Shiono, T.;
Ikeda, T.Macromolecules1998, 31, 349.(23) Blinov, L. M.; Chigrinov, V. G.Electrooptic Effects in Liquid
Crystal Materials; Springer-Verlag: New York, 1994.(24) de Bleijser, J.; Leyte-Zuiderweg, L. H.; Leyte, J. C.; van Woerkom,
P. C. M.; Picken, S. J.Appl. Spectrosc.1996, 50, 167.(25) Helfrich, W.Mol. Cryst. Liq. Cryst.1973, 21, 187.(26) Jones, J. C.; Worthing, P.; Bryan-Brown, G.; Wood, E.Dig. Tech.
Pap. - Soc. Inf. Disp. Int. Symp.2003, 34, 190.(27) Lee, L. M.; Kwon, H. J.; Kang, J. H.; Nuzzo, R. G.; Schweizer, K.
S. J. Chem. Phys.2006, 125, 24705.(28) de Gennes, P. G.; Prost, J.The Physics of Liquid Crystals; Oxford
University Press: New York, 1993.(29) Alexe-Ionescu, A. L.; Barbero, G.; Durand, G.J. Phys. II1993, 3,
1247.(30) Cui, M.; Kelly, J. R.Mol. Cryst. Liq. Cryst.1999, 331, 49.
Temperature Effects on a Nematic LC Film J. Phys. Chem. B, Vol. 110, No. 32, 200615789
(31) de Jeu, W. H.Physical Properties of Liquid Crystalline Materials;Gordon and Breach: New York, 1980.
(32) Ashford, A.; Constant, J.; Kirton, J.; Raynes, E. P.Electron. Lett.1973, 9, 118.
(33) Blanchard, R. M.; Noble-Luginbuhl, A. R.; Nuzzo, R. G.Anal.Chem.2000, 72, 1365.
(34) Noble, A. R.; Kwon, H. J.; Nuzzo, R. G.J. Am. Chem. Soc.2002,124, 15020.
(35) Noble-Luginbuhl, A. R.; Blanchard, R. M.; Nuzzo, R. G.J. Am.Chem. Soc.2000, 122, 3917.
(36) (a) Iimura, Y.; Akiyama, H.; Li, X. T.; Kobayashi, S. InPhoto-Alignment Control of LC and Its Applications to LCD Fabrication;Shashidhar, R., Ed.; 1998. (b) Heckmeier, M.; Lu¨ssem, G.; Tarumi, K.;Becker, W.Bunsen-Magn. 2002, 4 (5), 106. (c) Schadt, M.Annu. ReV.Mater. Sci.1997, 27, 305.
(37) Chatelain, P.Bull. Soc. Fr. Mineral.1943, 66, 105.(38) Geary, J. M.; Goodby, J. W.; Kmetz, A. R.; Patel, J. S.J. Appl.
Phys.1987, 62, 4100.
(39) Gregoriou, V. G.; Chao, J. L.; Toriumi, H.; Palmer, R. A.Chem.Phys. Lett.1991, 179, 491.
(40) Urano, T.; Hamaguchi, H.-O.Chem. Phys. Lett.1992, 195, 287.(41) Hallam, B. T.; Sambles, J. R.Liq. Cryst.2000, 27, 1207.(42) Hiraoka, H.; Sendova, M.Appl. Phys. Lett.1994, 64, 563.(43) Newsome, C. J.; O’Neill, M.; Farley, R. J.; Bryan-Brown, G. P.
Appl. Phys. Lett.1998, 72, 2078.(44) Dunmur, D. A. Measurements of Bulk Elastic Constants of
Nematics; Dunmur, D. A., Fukuda, A., Luckhurst, G. R., Eds.; INSPEC:London, 2001.
(45) Schiele, K.; Trimper, S.Phys. Status Solidi B1983, 118, 267.(46) Kneppe, H.; Schneider, F.; Sharma, N. K.J. Chem. Phys.1982,
77, 3203.(47) Diogo, A. C.; Martins, A. F.Mol. Cryst. Liq. Cryst.1981, 66, 133.(48) Barbero, G.; Gabbasova, Z.; Osipov, M. A.J. Phys. II1991, 6,
691.(49) Blinov, L. M.; Kabayenkov, A. Y.; Sonin, A. A.Liq. Cryst.1989,
5, 645.
15790 J. Phys. Chem. B, Vol. 110, No. 32, 2006 Lee et al.