Effects of Short-Term Treatment with Kinesiotaping for ... · Effects of Short-Term Treatment with...
25
Effects of Short-Term Treatment with Kinesiotaping for Plantar Fasciitis Chien-Tsung Tsai, Wen-Dien Chang, Jen-Pei Lee Chien-Tsung Tsai, MD, Chief, Department of Physical Therapy and Rehabilitation, Da Chien General Hospital, Miao Li City , Taiwan [E-mail : [email protected]] Wen-Dien Chang, Physical Therapist, Department of Physical Therapy and Rehabilitation, Da Chien General Hospital, Miao Li City , Taiwan [E-mail : [email protected] ] Jen-Pei Lee, MD, Chief, Department of Neurosurgery, Da Chien General Hospital, Miao Li City , Taiwan [E-mail: [email protected] ] Address correspondence to: Jen-Pei Lee, MD, Department of Neurosurgery, Da Chien General Hospital, No. 6, Shin Guang Street, Miao Li City 360, Taiwan, R.O.C. TEL:(886)-37-357125 ext 1153 (886)-931-039065 FAX:(886)-37-336274 Submitted: January 29, 2008.
-
Upload
phungkhuong -
Category
Documents
-
view
216 -
download
0
Transcript of Effects of Short-Term Treatment with Kinesiotaping for ... · Effects of Short-Term Treatment with...

Effects of Short-Term Treatment with Kinesiotaping for Plantar Fasciitis
Chien-Tsung Tsai, Wen-Dien Chang, Jen-Pei Lee
Chien-Tsung Tsai, MD, Chief, Department of Physical Therapy and Rehabilitation, Da Chien
General Hospital, Miao Li City , Taiwan [E-mail : [email protected]]
Wen-Dien Chang, Physical Therapist, Department of Physical Therapy and Rehabilitation, Da
Chien General Hospital, Miao Li City , Taiwan [E-mail : [email protected]]
Jen-Pei Lee, MD, Chief, Department of Neurosurgery, Da Chien General Hospital, Miao Li
City , Taiwan [E-mail: [email protected]]
Address correspondence to:
Jen-Pei Lee, MD, Department of Neurosurgery, Da Chien General Hospital, No. 6, Shin
Guang Street, Miao Li City 360, Taiwan, R.O.C.
TEL:(886)-37-357125 ext 1153
(886)-931-039065
FAX:(886)-37-336274
Submitted: January 29, 2008.

1
ABSTRACT
Objectives: The purpose of this study was to investigate the therapeutic effects of
kinesiotaping on plantar fasciitis.
Methods: Fifty-two patients with plantar fasciitis were randomly and equally divided into two
groups. The patients in the control group received only daily physical therapy program
including ultrasound thermotherapy and low-frequency electrotherapy. The patients in the
experimental group received kinesiotaping in addition to the same physical therapy program
as the control group. The tape for kinesiotaping was applied on the gastrocnemius and the
plantar fascia continuously for one week. For each patient, the therapeutic effects were
measured with subjective pain assessment [pain description scores and foot function scores],
and ultrasonographic assessment [measuring plantar fascia thickness and structural change].
Results: The reduced pain scores [pain description scores and foot function scores] and the
reduced thickness of plantar fascia at the insertion site [ultrasound assessment] after treatment
were significantly [P<0.05] more in the experimental group than the control group. However,
there were no significant [P>0.05] differences in the changes of plantar fascia thickness at the
site 0.5 cm distal to the insertion site, and hypoechoic phenomena.
Conclusions: It was concluded that the additional treatment with continuous kinesiotaping for
one week might alleviate the pain of plantar fasciitis better than the treatment with only
physical therapy.
KEY WORDS: Plantar fasciitis, kinesiotaping, plantar fascia, ultrasonography, hypoechoic
phenomena
2
INTRODUCTION
Kinesiotaping was originally developed in Japan by Kase (1). This special technique is
very popular in some Asian countries, and now, even in the Europe and United States (2).
However, only a few well-controlled studies can be found in the literature (3-5). Kinesiotape
is a thin porous cotton fabric with a medical grade acrylic adhesive. The tape can be stretched
up to 140 percent of the original length. After taping, the mobility of the applied muscle or
joint can still be maintained at full range (6). The mechanism of therapeutic effectiveness of
kinesiotaping on pain relief is still uncertain. In 1998, Kase et al. found that the local
circulation underneath the taping area was increased in a Doppler study (7). Murray (5) has
suggested that kinesiotaping may cause an increase in ankle proprioception through increased
stimulation to cutaneous mechanoreceptors (8). A significant effect of applying low-dye tape
to enhance the ankle proprioception has been documented. Contradictorily, Halseth (9)
showed a negative result of the kinesiotaping in enhancing ankle proprioception.
Plantar fasciitis is a common chronic overuse injury of the plantar fascia. The initial
symptom is heel pain at the moment of the first step on the floor when getting out of bed in
the early morning. The symptom may be released gradually after walking (10). However, the
pain may recur later on, if the stepping force is increased or the continuous weight bearing
period is prolonged (11). Repetitive minor trauma may cause persistent chronic pain and may
have osteophyte formation in the insertion site of the calcaneal bone (12). Therapeutic
interventions include systemic medication, ultrasound (13), deep friction massage (14),
plantar fascia stretch (15), strengthening of toe flexors (14), foot arch support (16), heel
cushion (2,16), traditional non-elastic taping (17), night splinting (18), and local steroid
injection (19).
In 1999, Loh (20) had applied kinesiotaping to treat plantar fasciitis. It is very likely that
application of kinesiotaping on the foot may correct the abnormal movement of the foot in
3
order to prevent foot injury due to repetitive minor trauma from the abnormal foot movement
(21). It might also facilitate recovery if injured. Furthermore, taping in a direction parallel to
the longitudinal axis of the foot and the leg can create a positive tension to the plantar fascia
and a negative tension to the ankle plantar flexors (22), and subsequently, may reduce the
muscle pulling force to the plantar fascia. However, as far as we know, the therapeutic
effectiveness of kinesiotaping for the treatment of plantar fasciitis has never been
scientifically studied. In our current study, we investigated the effects of kinesiotaping on
plantar fasciitis compared to a control group.
MATERIALS AND METHODS
Subjects
Male and female patients with confirmed diagnosis of plantar fasciitis were recruited
from the rehabilitation clinic of a teaching hospital. For every subject, the onset of the
symptoms was within 10 months at the time of this study, since kinesiotaping is most
effective during this period (2). They were randomly divided into two groups: the
experimental group and the control group. Patients with history of foot surgery or any
significant foot disorder such as arthritis, trauma, tumor, etc. were excluded from this study.
This study was approved by the Institutional Review Board on Human Subjects Research
in a university. After receiving an explanation about the study in detail, every subject signed
the informed consent forms as approved by the review board.
The basic data for each group were demonstrated in the Table 1. Statistically, there were
no significant differences between two groups although the mean age of the patients in the
control group was older than the experimental group. There was no significant difference in
the location of pain between two groups.

4
Treatments
During the study period, all patients received no any other treatment such as oral
medication, foot support, heel cushion, stretching exercise, or Chinese medical intervention.
They were allowed to maintain regular daily activity. Patients in the control group received a
course of physical therapy only, and those in the experimental group received kinesiotaping
therapy in addition to the same physical therapy program as the control group.
Physical Therapy Program for All Patients
The physical therapy program included therapeutic ultrasound [US700, ITO, Japan] and
low-frequency electrotherapy [TENS/SW32010, Shinmed, Taiwan] to the plantar fascia.
Initially, ultrasound with an intensity of 3MHz was given to the painful site of the plantar
fascia for five minutes. Then low-frequency TENS [120 Hz/40ms] was applied on the same
site for 15 minutes. This treatment was given to every patient six times per week for one
week.
Kinesiotaping
The whole procedure of taping was performed by one physical therapist for every patient
immediately after the first treatment of physical therapy. This physical therapist was not
involved in the patient assessment. The tape [Kinesio Tex, Kinesio Taping®, USA] used for
this study was waterproof, porous, and adhesive. The tape with a width of 5 cm and a
thickness of 0.5 mm was selected for this study.
Taping on the Gastrocnemius Muscle
The reference points for taping were marked on the skin of the posterior leg. As shown in
Figure 1, the original site for taping was marked on the Achilles tendon at the level of medial
and lateral malleoli. The two end sites of taping were marked on both medial and lateral heads

5
[most prominent area] of the gastrocnemius muscle. During taping, the patient was in a prone
position on a table with feet placed outside the end edge of the table. The knee joints were
fully extended and the ankle joints were maintained at the neutral position. The procedure of
“Y-shape” taping was applied to the gastrocnemius muscle in the affected side. The tape was
cut longitudinally up to about two-third of the whole length of the tape to be used. The
common end of the tape was firmly adhered to the marked original site on the Achilles tendon
and then stretched proximally to stick the two ends of the bivalve tape on the marked sites of
two gastrocnemius heads. The tape was stretched to be one-third longer than the original
length, so that the length was increased to about 133 percent of the original length in order to
provide a negative tension to the muscle. Figure 1 showed the original and stretched length of
the tape. The original length of the tape was about one-half of the leg length measured from
the fibular head to the lateral malleolus.
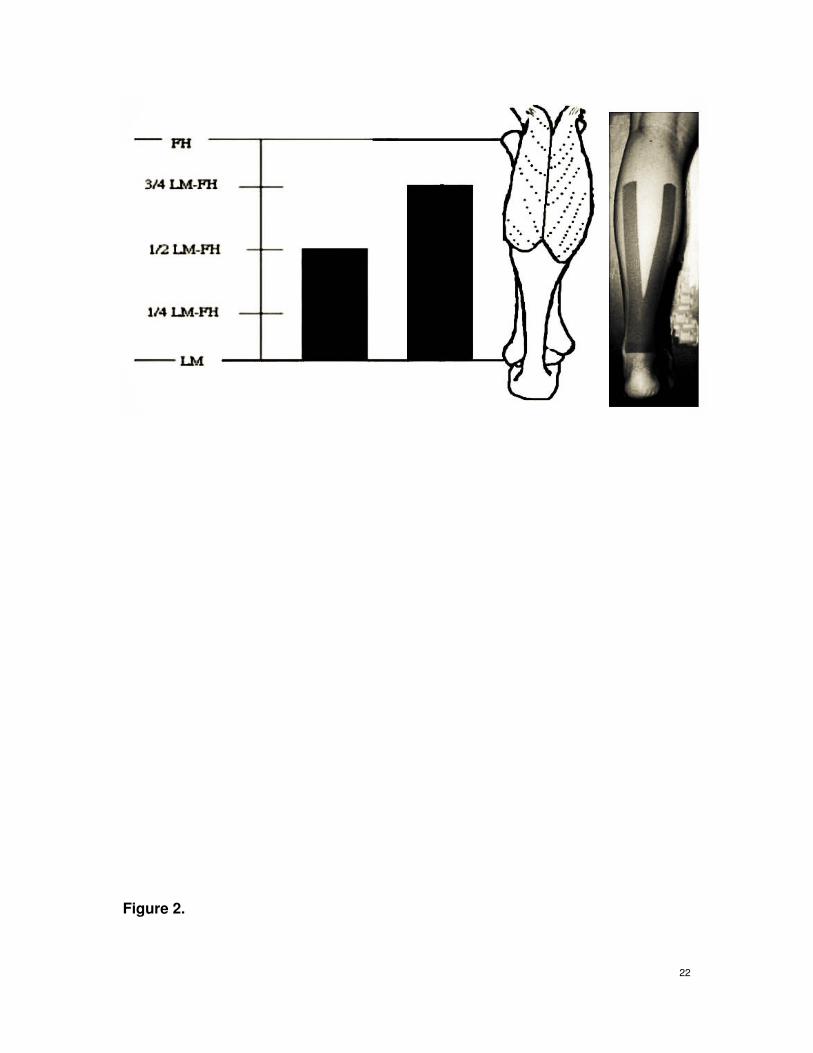
Taping on the Plantar Fascia
Figure 2 showed the reference points for taping. The original site for taping was marked
on the posterior margin of the calcaneal bone. The four end sites of taping were marked on the
metatarsal joints of the first to fifth toes, except the third. During the taping, the patient was in
a prone position with the knee joints at 90 degrees of flexion and the ankle joints at a neutral
position. As shown in Figure 2, the procedure of “palm-shape” taping was applied to the
plantar fascia. The tape was cut longitudinally into four slices of equal width extended up to
about two-thirds of the whole length of the tape to be used. The common end of the tape was
firmly adhered to the marked original site over the calcaneal bone and then stretched distally
to stick the four ends of the sliced tape on the marked sites of forefoot. The tape was stretched
so that the length was increased to about 133 percent of the original length in order to provide
a negative tension to the plantar fascia. The original and stretched [taped] length of the tape

6
was demonstrated in Figure 2. The original length of the tape was about one-half of the foot
length measured from the calcaneal end to the tip of the big toe.
Assessments
Each patient was assessed before and one week after the treatment. The assessments
included the subjective pain intensity, and the changes in the ultrasonography [measuring
plantar fascia thickness and structural changes]. The investigators who performed the
assessment were blinded as to the group assignment of the subject.
Subjective Pain Assessment
The subjective pain intensity was assessed with the McGill Melnack pain questionnaire
(23) for the “pain description scores” and the foot function index (15) for the “foot function
scores.” The McGill Medlnack pain questionnaire included 20 questions to describe the
perception and the influences of pain. The patient was requested to select the items that could
exactly describe patient’s pain or discomfort. It was not necessary to select one if no correct
answer in the question. Only one choice for each question could be selected. The total number
of selected items would indicate the pain intensity. Regarding the foot function index, seven
items of different foot functions were listed in the questionnaires. These items included: pain
intensity at the most painful moment, pain intensity during the first step on the floor in the
morning, pain intensity at the end of the day, pain intensity during walking with bare foot,
pain intensity during standing with bare foot, pain intensity during walking with shoes, and
pain intensity during standing with shoes. For each item, the patient used a score of 0 to 100
to describe the pain intensity [0 = no pain and 100 = the worst pain in the whole life]. The site
of pain should also be indicated in a picture of foot.
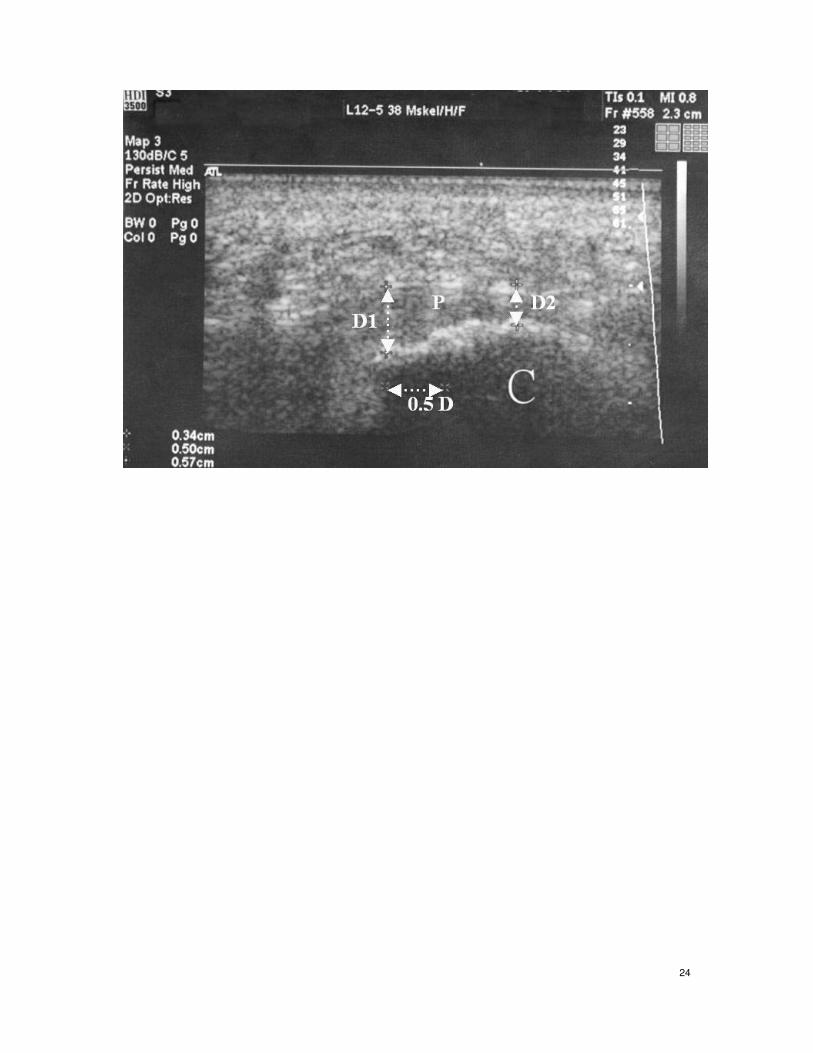
Ultrasonographic Assessment

7
A diagnostic ultrasonographic machine [HDI 3500, Philips, Japan; HDI transducers:
L12-5, 38 mm, Philips, Japan] was used for this assessment. For every patient, this procedure
was performed by one physician who was also blinded as to the group assignment. For this
test, the patient was in a prone position with the knees at 90 degrees of flexion and the ankles
at neutral position. The ultrasound probe was placed on the plantar surface and moved along
the mid-axis in a longitudinal direction from the calcaneal end to the toe end of the foot to
identify the plantar fascia. The measuring sites for the plantar fascia thickness were
determined according to that defined by Wall (24) [Figure 3]. The first measured site was at
0.5 cm distal to the anterior calcaneal margin where inflammation is usually found. The
secondary site was over calcaneus where the plantar fascia was inserted. The sign of
hypoechoic was expressed as “+” [positive]. If no hypoechoic sign was found, it was marked
as “-” [negative].
Data Analysis
The collected data were analyzed with SPSS 11.0 Software Top to compare the
differences between the pre-treatment data and the post-treatment data for each group. To
compare the differences between the control and experimental groups, data were further
normalized into the percentages of changes [percent difference] as shown below: % difference
= [(Post-treatment data – Pre-treatment data) / (Pre-treatment data)] x 100%. For the
continuous variables, nonparametric test, Mann-Whitney U test was used to assess the
significance of differences [α = 0.05]. For categorical variables, Fisher exact test was used to
test the difference [α = 0.05].
RESULTS
Fifty-two patients [19 males and 33 females] participated in the study [Table 1]. The
experimental group consisted 26 patients with 29 foot-samples [three patients with bilateral

8
involvement], and the control group included 26 patients with 28 foot-samples [two patients
with bilateral involvement].
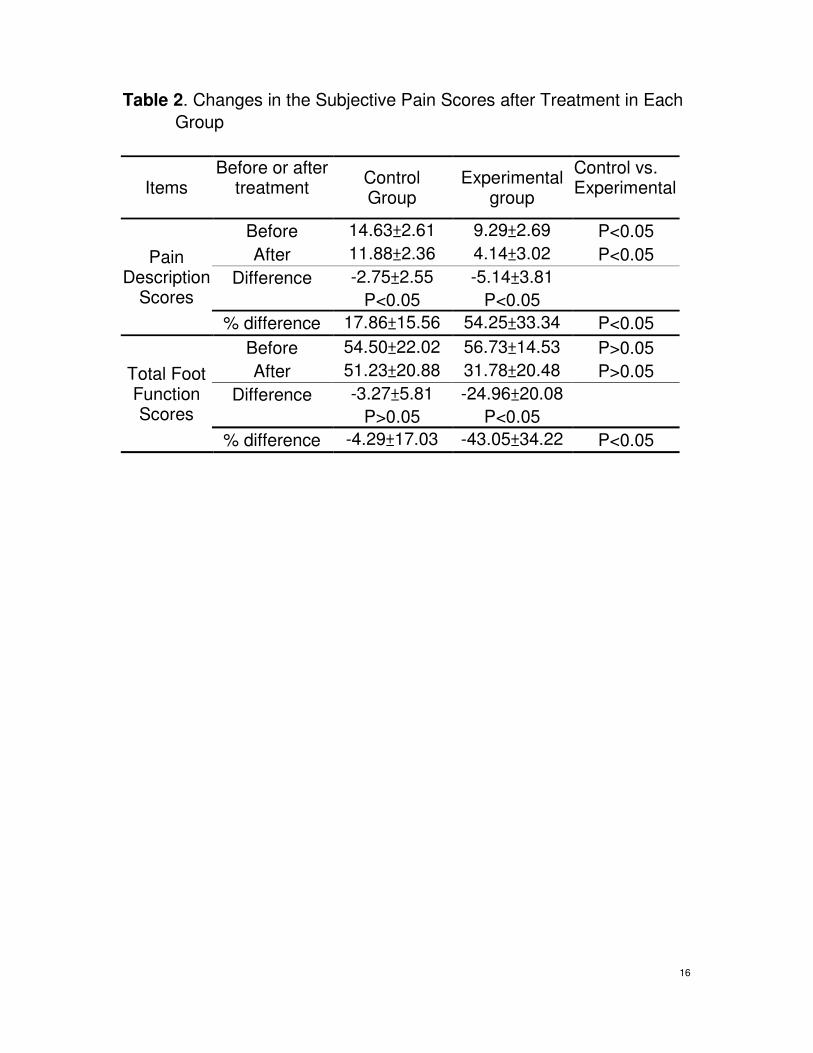
Subjective Pain Assessment
Based on the assessment with the McGill Melnack Pain Questionnaires [pain description
scores], the control subjects had significantly higher pain scores than the experimental
patients [Table 2]. After treatment, the mean pain score reduced significantly in both groups.
The amount of improvement [percent difference] in the pain description scores were
significantly more in the experimental group than the control group.
Regarding the foot function index, there was no significant difference in total foot
function scores between two groups. There was significant improvement after treatment in the
experimental group, but not in the control group. The percent difference after treatment were
significantly more in the experimental group than the control group [P<0.05] for either total
scores [Table 2] or each single item [Tables 3 and 4].
Ultrasonographic Assessment
As shown in Table 5, the reduced fascia thickness at the insertion site after treatment was
significantly higher [P<0.05] in experimental group than the control group. However, there
was no significant difference between two groups at the site 5 cm distal to the insertion site.
In the control group, hypoechoic phenomena were found in 20 of the 28 foot-samples
and two of them disappeared after treatment. However, in the experimental group, hypoechoic
phenomena were found in 22 of the 29 foot-samples and six of them disappeared after
treatment. There was no statistical difference between two groups [Table 6].
DISCUSSION

9
In this study, it was found that the pain intensity and the thickness of plantar fascia at the
insertion site were significantly [P<0.05] reduced after kinesiotaping as compared to the
control group, although no significant changes were found in the plantar fascia thickness at
the site 0.5 cm distal to the insertion site. There was also no significant difference in the
existence of hypoechoic phenomena [ultrasound assessment] between two groups.
Possible Mechanism of Kinesiotaping in Treating Plantar Fasciitis
The technique of kinesiotaping, including selection of taping site, pulling direction, and
pulling force, is critical in treating soft tissue lesions. It should follow the principle of motion
analysis and biomechanics. Usually, kinesiotaping can control the pulling force to a certain
tendon or ligament in order to avoid further injury so that the tissue repair can be facilitated.
In most cases, the cause of plantar fasciitis is due to the abnormal force to the plantar
fascia. When a patient has a high foot arch, the plantar fascia becomes too tight, and the calf
muscles and the Achilles tendon are also too tight. The plantar fascia cannot be effectively
extended in the heal strike phase of walking. Therefore, the angle of foot-anterior-rocking is
reduced. Furthermore, the counter force from the floor cannot be adequately absorbed by foot
arch due to tight plantar fascia. Therefore, the plantar fascia is over-stretched. On the other
hand, when a patient has a low foot arch [flat foot], foot ligaments are loose and the
supporting force to the foot arch is weak. The weight loading shifts to the plantar fascia. The
angle of foot-anterior-rocking is too big. The foot is not stable during the stance phase of the
other foot, and the plantar fascia is also over-stretched (25). Either way, the plantar fascia may
be over-stretched to cause plantar fasciitis. By applying kinesiotaping on the plantar fascia
and calf muscles, the pulling force of the plantar flexors and the plantar fascia can be reduced.
Therefore, repetitive injury to the plantar fascia can be avoided and the tissue repair can be
facilitated.
Changes in Subjective Pain after Kinesiotaping

10
The decreases in pain scores were significant more in the experimental group than the
control group. The reduction in pain intensity was probably due to the reduced pulling force to
the plantar fascia [negative tension from taping]. The improvement in focal circulation (7)
might be also an important factor for pain relief. It is unclear whether the direct mechanical
stimulation [from the shearing force of taping] to the nociceptors and/or mechanoceptors
plays any role in pain relief.
Changes in Plantar Fascia Morphology and Thickness after Kinesiotaping
To assess the morphological changes in the plantar fascia, either magnetic resonance
imaging [MRI] or ultrasonography can be used. The MRI is expensive, but ultrasound is
cheap and convenient. Therefore, we applied ultrasonography to investigate the
morphological changes of plantar fascia. By using ultrasonography, Sabir et al. (26) found
that the thickness of the inflamed plantar fascia was increased and the margin of the fascia
was blurring with hypoechoic changes. In a normal plantar fascia, the sonographic image is
homogeneous parallel fibrous structure with normoechoic reflection. There are two distinct
parallel hyperechoic margins in the normal fascia. In an inflammatory fascia, there was
anisotrophy with hypoechoic regions. In this study, we observed similar findings in the
plantar fasciae as previously reported. Cardinal et al. (27) has suggested that a hypoechoic
region can be the image of an area with hyaline change, granulation tissue or hematomas. In
this study, only one foot had complete disappearance of the hypoechoic region after
kinesiotaping, and the pain of that foot was also reduced completely after taping. The reason
for the poor result in sonographic findings is probably due to the small sample size in this
study. A long follow-up period may be necessary to see the changes.
In both groups of our study, the mean thickness of the plantar fascia at the proximal
insertion site of calcaneus [before treatment] was within normal range based on the data
measured by Chen et al. (28). However, the thickness at 0.5 cm distal to the anterior calcaneal

11
line was thicker than the data of Chen, probably due to inflammatory reaction. In clinical
practice, the most painful site is at the insertion region, but not the site with most remarkable
inflammatory reaction in the plantar fascia. Therefore, Wall (24) suggested measuring two
different sites. After kinesiotaping, the thickness at the insertion site was significantly reduced
as compared to the control group. It appears that kinesiotaping can effectively reduce the
inflammatory reaction in a certain region [the insertion site] of the plantar fascia. However,
the difference was not significant at the most inflamed site. This is probably due to the small
sample size in our study. The mechanism of such anti-inflammatory effect is unknown.
Further study is required to clarify that.
CONCLUSION
It is concluded that the treatment with kinesiotaping continuously for one week can
provide pain relief in patients with plantar fasciitis with a better effect as compared to those
treated with only physical therapy. The plantar fascia thickness at the insertion site may be
reduced after kinesiotaping. However, the changes in the plantar fascia thickness at the most
inflamed site, and the inflammation changes [hypoechoic] may not be affected after
kinesiotaping.

12
REFERENCES
1. Kase K, Wallis J: The latest Kinesio taping method. Tokyo Ski-journal: 2002.
2. Stadler TA, Teresa S, Stephen MB: What is the best treatment for plantar fasciitis. J Fam
Pract 52: 714-717, 2003.
3. Halseth T, McChesney JW, CeBeliso M, Vaughn R, Lien J: The effects of Kinesio taping
on proprioception at the ankle. J sports sci med 3: 1-17, 2004.
4. Ackermann B, Adams R, Marshall E: The effect of scapula taping on electromyographic
activity and musical performance in professional violinists. Australian Journal of
Physiotherapy 48: 197-204, 2002.
5. Robbins S, Waked E, Rappel R: Ankle taping improves proprioception before and after
exercise in young men. Br J Sports Med 29: 242-247 1995.
6. Chen YL: The Technique of Kinesiotaping. Taipei (Taiwan): The Community Health and
Sports Association of the Republic of China, 1995.
7. Kase K, Hashimoto T, Okane T: Kinesio Perfect Taping Manual: Amazing Taping
Therapy to Eliminate Pain and Muscle Disorders. Kinesio Taping Association, 1998.
8. Murray H: 2001. Effects of kinesio taping on muscle strength after ACL-repair. Retrieved
December 12, 2004 from: http://www.kinesiotaping.com/.
9. Halseth T, McChesney JW: The effects of Kinesiotaping on proprioception at the ankle. J.
Sports Science and Med 3: 1-7, 2004.
10. Brotzman SB, Wilk KE: Clinical orthopedic rehabilitation. Philadelphia:Mosby; 2003:
393-405.
Clinical orthopedic rehabilitation. 改為 Clinical Orthopedic Rehabilitation
11. Alshami AM, Babri AS, Souvlis T, Coppieters MW: Biomechanical evaluation of two
clinical tests for plantar heel pain: the dorsiflexion-eversion test for tarsal tunnel
syndrome and the windlass test for plantar fasciitis. Foot Ankle Int 28: 499-505, 2007.
13
12. Michelsson O, Konttinen YT, Paavolainen P, Santavirta S: Plantar heel pain and its
3-mode 4-stage treatment. Mod Rheumatol 15: 307-14, 2005.
13. Crawford F, Snaith M. How effective is therapeutic ultrasound in the treatment of heel
pain?Ann Rheum Dis 55: 265-267, 1996.
14. Allen RH, Gross MT: Toe flexors strength and passive extension range of motion of the
first metatarsophalangeal joint in individuals with plantar fasciitis. J Orthop Sports Phys
Ther 33: 468-478, 2003.
15. Benedict FD, Deborah A, Nmarc EL, Elizabeth AM, Joseph CM., Gregory EW,
Baumhauer JF.et al. : Tissue-specific plantar fascia -stretching exercise enhances
outcomes in patients with chronic heel pain: a prospective, randomized study. J Bone
Joint Surg 85: 1270-1277, 2003.
16.Conservative therapy for plantar fasciitis: a narrative review of randomized controlled
trials. J Can Chiropr Assoc 50: 118-133, 2006.
17. Radford JA, Landorf KB, Buchbinder R, Cook C: Effectiveness of low-dye taping for the
short-term treatment of plantar heel pain: a randomised trial. BMC Musculoskelet Disord
7: 64, 2006.
18. Berlet GC, Anderson RB, Davis WH, Kiebzak GM: A prospective trial of night splinting
in the treatment of recalcitrant plantar fasciitis: the ankle dorsiflesion dynasplint.
Orthopedics 25: 1273-1275, 2002.
19. Frater CV, Vander WH, Perera C, Halasz P, Emmett L, Fogelman I: Bone scintigraphy
predicts outcome of steroid injection for plantar fasciitis. J Nucl Med 85: 576-582, 2003.
20. Loh MY: Principle and Method of Kinesiotaping. Wagner Publishing, Taipei, Taiwan,
1999.
21. Erdemir A, Hamel AJ, Fauth AR, Piazza SJ, Sharkey NA: Dynamic loading of the plantar
aponeurosis in walking. J Bone Joint Surg 86: 546-552, 2004.
22. Lin YL: Therapeutic kinesiotaping. PTNEWS, ROC, Taiwan 94: 26-28, 2005.
14
23. Melzack R: The McGill Pain Questionnaire: major properties and scoring methods. Pain
1: 277-299, 1975.
24. Wall JR: Ultrasound diagnosis of plantar fasciitis. Foot Ankle 14: 465-470, 1993.
25. Daniel LR, Matthew P, Peter P: Risk factor for plantar fasciitis:a matched case- control
study. J Bone Joint Surg 85: 872-877, 2003.
26. Sabir N, Demirlenk S, Yagci B, Karabulut N, Cubukcu S: Clinical utility of sonography
in diagnosing plantar fasciitis. J Ultrasound Med 24: 1041-1048, 2005.
27. Cardinal E, Chhem RK, Beauregard G, Aubin B, Pelletier M: Plantar fasciitis:
sonographic evaluation. Radiology 201: 257-259, 1996.
28. Chen YC, Wang TQ, Hsieh CY, Wang CL, Hsieh FJ: Ultrasonography on plantar fasciae.
J Formos Med Assoc 4: 14-19, 2000.

15
Table 1. The Basic Data in Two Groups
Control group
Experimental group
Number of foot samples 28 29 Age 30.50 ± 13.14 52.67 ± 28.75
BMI values 24.07 ± 6.87 24.09 ± 3.77
Duration after onset [months]
4.33 ± 3.01 3.92 ± 1.80
Number of subjects who required daily activity > 8 hours
21/28 [75%] 24/29 [83%]
BMI = body mass index
16
Table 2. Changes in the Subjective Pain Scores after Treatment in Each
Group
Items Before or after
treatment Control Group
Experimental group
Control vs. Experimental
Pain Description
Scores
Before 14.63±2.61 9.29±2.69 P<0.05
After 11.88±2.36 4.14±3.02 P<0.05
Difference -2.75±2.55 -5.14±3.81
P<0.05 P<0.05
% difference 17.86±15.56 54.25±33.34 P<0.05
Total Foot Function Scores
Before 54.50±22.02 56.73±14.53 P>0.05
After 51.23±20.88 31.78±20.48 P>0.05
Difference -3.27±5.81 -24.96±20.08
P>0.05 P<0.05
% difference -4.29±17.03 -43.05±34.22 P<0.05

17
Table 3. Changes in the Foot Function Scores for Different Items of Foot
Function after Treatment in Each Group
Items Before or after
treatment Control Group
Experimental group
Control vs. Experimental
1st item Before 67.88±12.07 61.14±18.50 P>0.05
After 60.63±17.32 36.43±17.49 P<0.05
2nd item Before 49.38±29.09 49.57±16.11 P>0.05
After 50.63±27.18 20.71±15.39 P<0.05
3rd item Before 64.75±20.26 59.00±16.29 P>0.05
After 58.00±20.31 32.14±21.77 P<0.05
4th item Before 41.88±20.96 55.00±18.48 P>0.05
After 40.00±18.71 35.00±21.41 P>0.05
5th item Before 47.38±23.44 53.57±11.80 P>0.05
After 44.25±19.47 30.00±24.66 P>0.05
6th item Before 52.50±14.23 60.29±11.35 P>0.05
After 51.75±14.80 35.71±23.17 P>0.05
7th item Before 57.75±24.59 58.57±9.45 P>0.05 After 53.38±25.82 32.43±23.09 P>0.05
Table 4. Percentage of Change in the Foot Function Scores for Different
Items of Foot Function after Treatment in Each Group

18
Values were meant the difference between before and after treatment.
Table 5. Changes in the Fascia Thickness [cm] based on Ultrasonic
Assessment after Treatment in Each Group
Items Control Group Experimental group Control vs.
Experimental
1st item -12.25±13.23 -40.39±26.41 P<0.05
2nd item 10.21±31.25 -47.44±45.44 P<0.05
3rd item -11.53±5.99 -44.90±36.86 P<0.05
4th item -1.10±15.89 -35.28±29.27 P<0.05
5th item -3.28±13.71 -46.37±40.29 P<0.05
6th item -1.45±9.39 -40.11±36.70 P<0.05
7 th item -10.59±11.13 -46.89±35.69 P<0.05

19
Items Before or after
treatment Control Group
Experimental group
P value
Fascia thickness at site 1
Before 0.55±0.16 0.57±0.19 P>0.05
After 0.50±0.18 0.49±0.17 P>0.05
Difference -0.05±0.02 -0.08±0.07
P value P>0.05 P>0.05
% difference -10.72±6.50 -13.38±11.79 P>0.05
Fascia thickness at site 2
Before 0.34±0.06 0.39±0.07 P>0.05
After 0.33±0.05 0.33±0.08 P>0.05
Difference -0.01±0.03 -0.06±0.04
P value P>0.05 P>0.05
% difference -3.46±81.36 -16.41±9.91 P<0.05
Measuring site 1: at 0.5 cm distal to the anterior calcaneal margin.
Measuring site 2: at the anterior calcaneal margin [facial insertion site].
Table 6. Changes the Hypoechoic Phenomena on Ultrasonic
Assessment after Treatment in Each Group
Items Before treatment
After treatment
P value
Control Group No. hypoechoic phenomena[+]
20 18
No. hypoechoic phenomena[-]
8 10

20
Ratio of disappearance 2/20
Experimental group
No. hypoechoic phenomena[+]
22 16
No. hypoechoic phenomena[-]
7 13
Ratio of disappearance 6/22 P>0.05
Ratio of disappearance: numbers of disappeared hypoechoic
phenomena [after treatment- before treatment]/ numbers of hypoechoic
phenomena[+]
FIGURE LEGEND
Figure 1. Length of tape for kinesiotaping on the gastrocnemius muscle. The leg length was
measured from the lateral malleolus [LM] to the fibular head [FH]. The original length of tape
was half of the leg length [1/2 LM-FH]. The original site of taping was on the Achilles tendon

21
at the level of medial and lateral malleoli, and the end of sliced tape was stretched distally for
a total length of three-quarters of the leg length [3/4 LM-FH].
Figure 2. Kinesiotaping on the plantar fascia. The foot length was measured from the
posterior margin of calcaneus [PMOC] to the tip of big toe [TOBT]. The original length of
tape was half of the foot length [1/2 PMOC-TOBT]. The original site of taping was at the
proximal one-eighth of foot [1/8 PMOC-TOBT], and the end of sliced tape at the distal
one-eighth margin of the foot [7/8 PMOC-TOBT].
Figure 3. Measurement of the thickness of plantar fascia [P]. The first distance [D1] was at
0.5 cm distal [0.5D] to the anterior calcaneal margin [C] and the secondary distance [D2] was
over the edge of calcaneus.
Figure 1.
22
Figure 2.

23
Figure 3.
24