Effects of Scouting Videos on Physiological and ... · Through editing, scouting videos are made...
8
Football Science Vol.11, 28-35, 2013 http://www.jssf.net/home.html 28 1. Introduction The improvement of performance in modern competitive sports is closely linked to the impressive level of development reached by information processing technology in today’s information-oriented society. In particular, the use of video has proved to have high practical utility, and video is now utilized in many different areas. In recent years, with the development of new video processing methods and editing software, as well as the ability to get feedback easily through electronic devices, video has come to be widely used as part of the information strategy in competitive sports. In football, scouting videos are used as part of the efforts to obtain information about the opposing team prior to important matches such as league games, etc., to analyze the opposing team and its individual players. Scouting videos are made by editing video footage of games involving the opposing team to highlight the key features of their attacking and defending play. Sone (2008) suggests that pre-match preparation should include not only the formulation of a game plan, but also analysis of the capabilities of the opposing team’s players and the provision of information about the opposing team to one’s own team. The utilization of scouting videos can play an important role in facilitating the more effective provision of information by managers and coaches when giving strategy or tactical advice to players. Furthermore, it is generally accepted that scouting videos serve as a useful source of information for players preparing for their next match by seeking to visualize or simulate the upcoming match. Effects of Scouting Videos on Physiological and Psychological Responses during Motor Imagery in Football Players Takahiro Matsutake * and Takayuki Sugo ** * Graduate School of Osaka University of Health and Sport Sciences ** Osaka University of Health and Sport Sciences 1-1 Asasirodai, Kumatorichou, Sennnangun, Osaka 590-0496 Japan [email protected] [Received February 20, 2013; Accepted June 3, 2013] Videos of the opponent team’s games are used to obtain information about the team and its players and to analyze them before important games, such as official football games. Through editing, scouting videos are made that indicate characteristics of offense and defense play of the opponent team. The present study examined the effects of scouting videos on vividness of motor imagery. Participants (n=20) were members of a football club of a sports- oriented college. They were divided into the experimental group that watched the video before developing imagery and the control group that did not. Physiological indicators of the autonomic nervous system when developing motor imagery and psychological indicators for the diagnosis of the contents of the imagery were measured. The results indicated that respiratory rate, heart rate, and sympathetic nervous system responses were significantly activated when developing imagery under the experimental condition. Furthermore, results of tasks and kinesthesia of psychological indicators under the experimental condition were significantly higher than those under control conditions. The above results indicate that scouting videos promoted activation of autonomic nervous system responses and helped participants to develop vivid imagery with a sense of presence under the experimental conditions. Keywords: Sport mental training, Imagery, Autonomic nerves Paper : Psychology [Football Science Vol.11, 28-35, 2013]
Transcript of Effects of Scouting Videos on Physiological and ... · Through editing, scouting videos are made...

Football Science Vol.11, 28-35, 2013http://www.jssf.net/home.html
28
1. Introduction
The improvement of performance in modern competitive sports is closely linked to the impressive level of development reached by information processing technology in today’s information-oriented society. In particular, the use of video has proved to have high practical utility, and video is now utilized in many different areas. In recent years, with the development of new video processing methods and editing software, as well as the ability to get feedback easily through electronic devices, video has come to be widely used as part of the information strategy in competitive sports. In football, scouting videos are used as part of the efforts to obtain information about the opposing team prior to important matches such as league games, etc., to analyze the opposing
team and its individual players. Scouting videos are made by editing video footage of games involving the opposing team to highlight the key features of their attacking and defending play. Sone (2008) suggests that pre-match preparation should include not only the formulation of a game plan, but also analysis of the capabilities of the opposing team’s players and the provision of information about the opposing team to one’s own team. The utilization of scouting videos can play an important role in facilitating the more effective provision of information by managers and coaches when giving strategy or tactical advice to players. Furthermore, it is generally accepted that scouting videos serve as a useful source of information for players preparing for their next match by seeking to visualize or simulate the upcoming match.
Effects of Scouting Videos on Physiological and Psychological Responses during Motor Imagery in
Football PlayersTakahiro Matsutake* and Takayuki Sugo**
*Graduate School of Osaka University of Health and Sport Sciences**Osaka University of Health and Sport Sciences
1-1 Asasirodai, Kumatorichou, Sennnangun, Osaka 590-0496 [email protected]
[Received February 20, 2013; Accepted June 3, 2013]
Videos of the opponent team’s games are used to obtain information about the team and its players and to analyze them before important games, such as official football games. Through editing, scouting videos are made that indicate characteristics of offense and defense play of the opponent team. The present study examined the effects of scouting videos on vividness of motor imagery. Participants (n=20) were members of a football club of a sports-oriented college. They were divided into the experimental group that watched the video before developing imagery and the control group that did not. Physiological indicators of the autonomic nervous system when developing motor imagery and psychological indicators for the diagnosis of the contents of the imagery were measured. The results indicated that respiratory rate, heart rate, and sympathetic nervous system responses were significantly activated when developing imagery under the experimental condition. Furthermore, results of tasks and kinesthesia of psychological indicators under the experimental condition were significantly higher than those under control conditions. The above results indicate that scouting videos promoted activation of autonomic nervous system responses and helped participants to develop vivid imagery with a sense of presence under the experimental conditions.
Keywords: Sport mental training, Imagery, Autonomic nerves
Paper : Psychology
[Football Science Vol.11, 28-35, 2013]

Effects of Scouting Videos on Physiological and Psychological Responses
Football Science Vol.11, 28-35, 2013http://www.jssf.net/home.html
29
Simulation can be defined as putting oneself in a situation where one has the sensation of undergoing a real experience. The simulation of a football match is an experience in which one seems to actually be taking part in the match. Match simulation, in the form of image rehearsal, is one of the imagery techniques used in sports mental training with the aim of enhancing competitiveness. In order to enable players to experience the mental state of actually being in the match, image rehearsal gets the players to imagine that they are playing in the match. This imagining is referred to as motor imagery, and is defi ned as the mental rehearsal of motor activity that does not actually involve bodily motion (Kotani, 2004). In the field of competitive sports, motor imagery has attracted considerable attention as a training method for gaining motor skill. Lotze and Halsband (2006) found that, in order for outstanding athletes to improve their performance and acquire new skills, it is important for them to make use of motor imagery, through the observation both of themselves and of other athletes. One of the scales that can be used when evaluating motor imagery is clarity, in terms of how vivid the motor imagery experienced by the individual athlete is, and how clearly it is felt. Hasegawa (1991) developed the Scale of Mental Imagery—Short Form (SMI-S) as a scale for measuring this clarity. Hasegawa (1997) reported that the more vivid an athlete’s motor imagery, the clearer the images they are able to evoke, and the more realistic the simulation experience is. Kodama (1993) found that, in order to be able to evoke vivid motor imagery, besides the ability to imagine clear images, athletes also needed to have accumulated sufficient information. Based on these reports, it would appear that the act of watching scouting videos should have a useful role to play in stimulating the evoking of vivid motor imagery, by contributing to the accumulation of relevant information. However, up until now there has been no clear evidence as to whether watching scouting videos does in fact affect the vividness of motor imagery.
In this regard, it would seem reasonable to assume that evaluation of the vividness of motor imagery should take into account not only the psychological aspect, but also the physiological aspect. For example, it has been reported that, while the evoking of motor imagery may not involve actual bodily motion, it is linked to physiological reactions; when motor imagery is invoked, the motor programming
that would normally lead to actual physical motion is activated, changes take place in the state of excitation of the motor neuron group, and significant changes are observed in the autonomic nervous system (ANS) (Oishi, 2006). Hayashi (2001) used SMI-S and classifi ed high-score and low-score groups based on image clarity scores. When physiological reaction was measured, the members of the high-score group were found to have a faster heart rate and faster respiration when evoking imagery than when relaxed. On the basis of the above, assuming that the viewing of scouting videos can contribute to the stimulation of vivid motor imagery, it would seem reasonable to expect that in such cases the heart rate and respiration rate would increase; however, up until now this has not actually been demonstrated. If this could be demonstrated, it would serve as evidence of the suitability of scouting videos for use as an effective method of evoking motor imagery.
The purpose of the present study is therefore to examine the impact that the viewing of scouting videos has on physiopsychology reaction when evoking motor imagery.
2. Methods
2.1. Participants
The participants in the experiment comprised 20 male football team players from a physical education college (aged between 20 and 22). The team in question belonged to the Kansai University Soccer League (Division 1); the 20 players chosen to participate in the study were all members of the “TOP Team” (and formally registered as players in the Kansai Universities Soccer League).
The 20 participants were divided into two groups: an experimental group who were asked to evoke motor imagery after having viewed scouting videos, and a control group who were asked to evoke motor imagery without having viewed scouting videos. SMI-S scores were used to classify participants into the two groups. SMI-S is scale used to evaluate the clarity or vividness of motor imagery evocation. In the present study, in order to measure physiological reaction when evoking motor imagery, following Hayashi (2001), SMI-S was used to ensure that there was no signifi cant disparity between the two groups in terms of their members’ ability to evoke motor imagery with clarity.

Football Science Vol.11, 28-35, 2013
Matsutake, T. and Sugo, T.
http://www.jssf.net/home.html30
When the SMI-S scores of the experiment participants were measured, the score range for both groups combined was found to be 58.35±5.97. Using this as the baseline, participants were assigned to the two groups in such a way as to avoid there being any signifi cant disparity between the two groups’ SMI-S scores. For the experimental group, the SMI-S score range was 58.50±5.44; for the control group, the SMI-S score range was 58.20±6.75.
2.2. Experiment Implementation Period
The experiment was carried out between late October and mid-November 2011.
2.3. Imagery Content
In order to control the content of the imagery evoked by the experiment participants, the Imagery Story Setting Sheet, which is widely used in imagery training, was employed. The Imagery Story Setting Sheet is a form filled out by the experiment participants on which they draw up a framework for the imagery, preparing a “script” that covers the location and circumstances of the imagery, the participant’s own physical and mental state, what their surrounding look like, etc. (Tsuchiya, 2005). In this study, prior to the implementation of the experiment, an explanatory meeting was held, attended by the participants, during which the participants underwent SMI-S and were asked to fill out the Imagery Story Setting Sheet. For this experiment, the following Imagery Story Setting Sheet content was unified among all the participants: “A match against X University in the next term.” “The date of the match is October XX.” “The venue for the match is Nagai Stadium.” “There is fine weather.” Participants had complete freedom as to the imagery content. Imagery evocation was implemented over a period of five minutes; during the experiment, the researcher read out the content noted by the participant on the Imagery Story Setting Sheet at the specified time, and the participant then performed motor imagery evocation based on this content.
2.4. Test Items
2.4.1. Physiological IndicatorsTo determine the physiological indicators,
m e a s u r e m e n t w a s p e r f o r m e d u s i n g
electrocardiography (ECG) and measurement of respiratory activity. ECG was carried out using Vitrode M-150 Ag/AgCl disposable electrodes manufactured by Nihon Kohden Corporation. Three electrodes were attached to the participant’s chest, with recording from chest lead II (approximation). Respiratory activity was measured using an MLT1132 piezo-electric respiratory belt transducer manufactured by ADInstruments. The data obtained was converted into digital format, processed using an ADInstruments Powerlab data acquisition system with built-in analog-digital converter, and then recorded on a computer hard drive using a sampling rate of 1,000 Hz.
Heart rate (in beats per minute) and heart rate variability (HRV) were calculated from the ECG data. HRV was calculated using AD Instruments’ Chart Software, with analysis being performed using the Fast Fourier Transform (FFT) method. For HRV, the 0.04Hz – 0.15Hz frequency band was taken as the low-frequency (LF) component, with the 0.15Hz – 0.40Hz band as the high-frequency (HF) component, and the power values of each component were then calculated. In the present study, the LF/HF ratio was used as the indicator for sympathetic nerve activity.
2.4.2. Psychological Indicators (1) SMI-S was used in the classification of
participants into the experimental group and the control group. SMI-S is a scale used to measure imagery clarity, which represents participants’ ability to evoke imagery. SMI-S employs 14 questions relating to: Visualization i: Everyday objects; Visualization ii: People; Visualization iii: Seven sensation modalities, including natural scenery, hearing, skin sensation, motor sensation, taste, smell, and organic sensation. The questions were put to the participants orally. The number of points awarded for each answer varied from 5 points (“The imagery was so vivid that I felt as though I really was experiencing it”) to 1 point (“My reaction was limited to thinking about it, with no imagery evoked”), for a maximum possible score of 70 points. The SMI-S scores were used when dividing the participants into the experimental group and the control group to eliminate any significant disparity between the two groups in terms of the ability to evoke imagery clearly.
Effects of Scouting Videos on Physiological and Psychological Responses
Football Science Vol.11, 28-35, 2013http://www.jssf.net/home.html
31
(2) After motor imagery evocation had been completed, cognitive motor imagery evaluation was performed using the imagery test method (Takano et al., 1995). The image test method is a scale for evaluation for imagery that makes use of four sub-scales: kinesthesia, tasks, vision, and feeling. Participants were asked to reply to 21 questions, giving a subjective self-evaluation of the imagery from “Completely inapposite” (1 point) to “Extremely apposite.” This test was administered to all of the participants following completion of the motor imagery questions.
2.5. The Scouting Video
The scouting video shown to the experimental group showed information about the players’ opponents necessary for the imagery content in the present study. The video, which was approximately fi ve minutes in length, was compiled from footage of a game involving the X University team, a team which the participants would actually have to play in league games. The footage included goal-scoring, attacks that resulted in shooting opportunities, instances of letting in goals, and cases where the team’s opponents were able to score after breaking through their defensive line. Particularly with respect to the team’s most distinctive players, slow-motion and replay footage was used to highlight important points. Immediately before the showing of the scouting video, the purpose of the video was explained by the researcher, who gave the participants the following instructions: “The video you are about to see is a video of a game played by X University, the team that you will be playing next. The team wearing the blue uniforms is the team that we will be playing next time. Those parts of the video that are shown in slow-motion or using replay are the distinguishing aspects of the way the X University team plays. The stadium where the match shown in the video was played, Nagai Stadium, is the same stadium where your upcoming match against X University will be played.” While watching the video, the participants sat quietly, with no instructions being given while the video was being shown.
2.6. Procedure
An explanation about the experiment was given to the participants in advance. During the explanatory
meeting, the participants had their SMI-S scores measured (for the purpose of classification into the experimental and control groups), and filled out the Imagery Story Setting Sheet for use in imagery testing. To allow time for the compilation of the SMI-S results and the allocation of participants to the experimental and control groups, the experiment itself commenced one week after the presentation was held.
Since the experiment involved mental work, it was conducted with only one participant in the room where outside stimuli, etc. were controlled. During the period after completion of the measurement but before the electrodes were removed, the participants remained in a relaxed posture in comfortable chairs. In addition, the participants were instructed not to make big movements or talk during the experiment. Firstly, to provide baseline measurements, ECG and respiratory activity testing was performed on the members of both groups (the control group and experimental group) for a period of five minutes. Next, the members of the control group were allowed to rest quietly for fi ve minutes with no stimuli, while the experimental group watched a scouting video for five minutes. To control the physiological state of the two groups, before the motor imagery evocation testing commenced, they were asked to perform an abdominal breathing relaxation technique (Yamanaka, 2005), before undergoing motor imagery testing for fi ve minutes. Following the completion of the motor imagery evocation testing, the imagery test was implemented (to serve as a psychological indicator), bringing the experiment to an end.
2.7. Statistical Processing
Regarding physiological indicator analysis targets, the mean value and standard deviation for each physiological indicator were calculated for both groups with respect to the final minute during the period of rest and the fi nal minute during the period of motor imagery evocation. Employing a two-factor mixed-model design with the group as the between-subjects factor and time as the within-subject factor, two-factor analysis of variance (ANOVA) was implemented to test for interaction and main effect. In addition, scoring was performed with respect to the four sub-scales used in the imagery test psychological indicator, and the mean value and standard deviation were calculated in order to perform the t-test. PASW Statistics ver. 18 for Windows was used for all

Football Science Vol.11, 28-35, 2013
Matsutake, T. and Sugo, T.
http://www.jssf.net/home.html32
statistical processing. For all of the analysis, the signifi cance level was set at ≤ 0.05.
3. Results
3.1. Heart Rate
The mean value and standard deviation for the control group and experimental group heart rate when at rest and when evoking motor imagery is shown in Fig. 1. For the control group, the heart rate when at rest was 62.90±6.22 beats per minute, and the heart rate when evoking motor imagery was 63.10±5.78 beats per minute; for the experimental group, the heart rate when at rest was 56.40±10.62 beats per minute, and the heart rate when evoking motor imagery was 58.80±10.92 beats per minute. The two-factor ANOVA results showed that, while there was no statistically-signifi cant difference with respect to interaction, a statistically-significant trend was seen at the 0.10 signifi cance level (F (1,18) = 4.124, p < 0.1). The simple main effect test results showed that, for the experimental group only, there was a signifi cant increase in heart rate in the transition from
rest to motor imagery evocation (F (1,9) = 11.915, p < 0.05).
3.2. Respiratory Rate
The mean value and standard deviation for the control group and experimental group respiratory rate when at rest and when evoking motor imagery is shown in Fig. 2. For the control group, the respiratory rate when at rest was 16.10±3.17 breaths per minute, and the respiratory rate when evoking motor imagery was 17.50±2.06 breaths per minute; for the experimental group, the respiratory rate when at rest was 12.50±3.20 breaths per minute, and the respiratory rate when evoking motor imagery was 17.90±2.46 breaths per minute. The two-factor ANOVA results showed that there was interaction (F (1,18) = 12.329, p < 0.05). The simple main effect test results showed that, for the experimental group only, there was a signifi cant increase in the respiratory rate in the transition from rest to motor imagery evocation (F (1,18) = 35.630, p < 0.05).
3.3. HRV LF/HF Ratio
The mean value and standard deviation for the control group and experimental group LF/HF ratio when at rest and when evoking motor imagery is shown in Fig. 3. For the control group, the LF/HF ratio when at rest was 1.34±1.87, and the LF/HF ratio when evoking motor imagery was 1.37±1.22; for the experimental group, the LF/HF ratio when at rest was 0.56±0.19, and the LF/HF ratio when evoking motor imagery was 1.03±0.65. The two-factor ANOVA results did not show any significant interaction (F (1,18) = 0.370, n.s.).
Figure 1 Change of heart rate (Comparison of Rest and Imagery)
40455055606570
Rest Imagery
Ave
rage
of H
eart
rate
**:p<.05
control
experiment
Figure 2 Change of respiratory rate(Comparison of Rest and Imagery)
5 7 9
11 13 15 17 19
Rest Imagery
Aver
age o
f Res
pira
tory
rate
control
experiment
*:p<.05
*
Figure 3 Change of LF/HF ratio(Comparison of Rest and Imagery)
0.0 0.5 1.0 1.5 2.0 2.5 3.0 3.5
Rest Imagery
HRV
LF/
HF
rati
o control
experiment
Effects of Scouting Videos on Physiological and Psychological Responses
Football Science Vol.11, 28-35, 2013http://www.jssf.net/home.html
33
3.4. Imagery Test (Psychological Indicator)
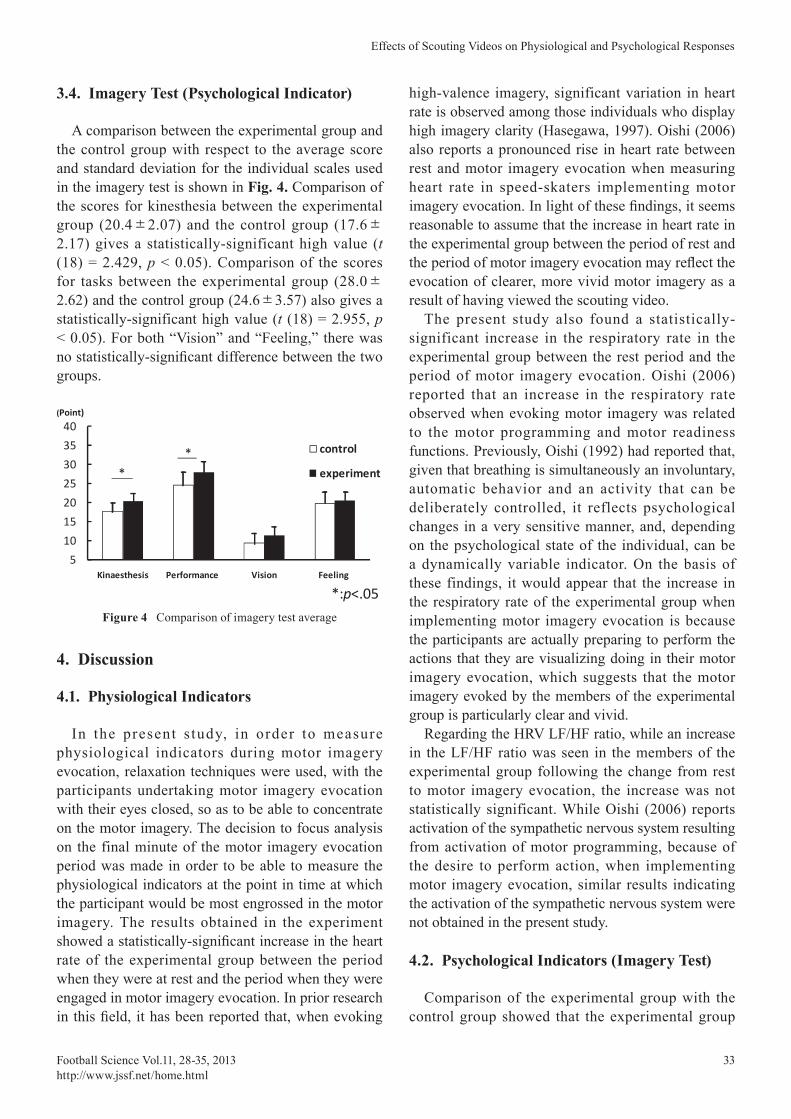
A comparison between the experimental group and the control group with respect to the average score and standard deviation for the individual scales used in the imagery test is shown in Fig. 4. Comparison of the scores for kinesthesia between the experimental group (20.4±2.07) and the control group (17.6±2.17) gives a statistically-significant high value (t (18) = 2.429, p < 0.05). Comparison of the scores for tasks between the experimental group (28.0±2.62) and the control group (24.6±3.57) also gives a statistically-significant high value (t (18) = 2.955, p < 0.05). For both “Vision” and “Feeling,” there was no statistically-signifi cant difference between the two groups.
4. Discussion
4.1. Physiological Indicators
In the present s tudy, in order to measure physiological indicators during motor imagery evocation, relaxation techniques were used, with the participants undertaking motor imagery evocation with their eyes closed, so as to be able to concentrate on the motor imagery. The decision to focus analysis on the final minute of the motor imagery evocation period was made in order to be able to measure the physiological indicators at the point in time at which the participant would be most engrossed in the motor imagery. The results obtained in the experiment showed a statistically-signifi cant increase in the heart rate of the experimental group between the period when they were at rest and the period when they were engaged in motor imagery evocation. In prior research in this fi eld, it has been reported that, when evoking
high-valence imagery, significant variation in heart rate is observed among those individuals who display high imagery clarity (Hasegawa, 1997). Oishi (2006) also reports a pronounced rise in heart rate between rest and motor imagery evocation when measuring heart rate in speed-skaters implementing motor imagery evocation. In light of these fi ndings, it seems reasonable to assume that the increase in heart rate in the experimental group between the period of rest and the period of motor imagery evocation may refl ect the evocation of clearer, more vivid motor imagery as a result of having viewed the scouting video.
The present study also found a statistically-significant increase in the respiratory rate in the experimental group between the rest period and the period of motor imagery evocation. Oishi (2006) reported that an increase in the respiratory rate observed when evoking motor imagery was related to the motor programming and motor readiness functions. Previously, Oishi (1992) had reported that, given that breathing is simultaneously an involuntary, automatic behavior and an activity that can be deliberately controlled, it reflects psychological changes in a very sensitive manner, and, depending on the psychological state of the individual, can be a dynamically variable indicator. On the basis of these findings, it would appear that the increase in the respiratory rate of the experimental group when implementing motor imagery evocation is because the participants are actually preparing to perform the actions that they are visualizing doing in their motor imagery evocation, which suggests that the motor imagery evoked by the members of the experimental group is particularly clear and vivid.
Regarding the HRV LF/HF ratio, while an increase in the LF/HF ratio was seen in the members of the experimental group following the change from rest to motor imagery evocation, the increase was not statistically significant. While Oishi (2006) reports activation of the sympathetic nervous system resulting from activation of motor programming, because of the desire to perform action, when implementing motor imagery evocation, similar results indicating the activation of the sympathetic nervous system were not obtained in the present study.
4.2. Psychological Indicators (Imagery Test)
Comparison of the experimental group with the control group showed that the experimental group
Figure 4 Comparison of imagery test average
5
10
15
20
25
30
35
40
Kinaesthesis Performance Vision Feeling
(Point)
control
experiment*
*
*:p<.05

Football Science Vol.11, 28-35, 2013
Matsutake, T. and Sugo, T.
http://www.jssf.net/home.html34
had higher values for all of the sub-scales used in the imagery test. In the case of the kinesthesia and tasks sub-scales, the experimental group’s values were signifi cantly higher. Given that both groups had been implementing the same tasks, the fact that the experimental group had significantly higher values for the Tasks sub-scale suggests that this was due to the experimental group having evoked clearer motor imagery. Oishi (2006) reported observing electromyographic activity when evoking motor imagery, despite the fact that the subjects were not actually engaged in physical activity. In the present study, it can be deduced that, given the increase seen in the experimental group’s physiological indicators (heart rate and respiratory rate), the fact that the experimental group had signifi cantly high kinesthesia values indicates that the activation of motor programming and motor readiness when evoking motor imagery may have served to stimulate muscular activity. As electromyographic activity was not actually measured in the present study, it cannot be said with certainty that muscular activity took place in the experimental group, but it does appear that the scouting video shown to the experimental group prior to the motor imagery evocation had an impact in terms of enhancing the clarify of the experimental group’s motor imagery.
4.3. Conclusions and Future Research
The results obtained in the present study show that viewing a scouting video can play supplementary role in helping to stimulate clear motor imagery. Based on this fi nding, the utilization of scouting videos in image rehearsal can be recommended. Image rehearsal is implemented by means of the following flow: (1) task selection, (2) compilation of image story, (3) relaxation, (4) image evocation (Tsuchiya, 2005). Given the wide variation in the special characteristics of individual sports, there is no one approach to task selection that can be neatly summarized. However, in the case of “open-skill” sports, and particularly those sports where the aim is to score goals, it would appear that providing subjects with information about the opposing team by having them view a scouting video immediately before the relaxation period when implementing image rehearsal can contribute to the evocation of clearer motor imagery.
Nevertheless, there are several aspects of the research undertaken in the present study that could be
improved. In the present study, while the members of the experimental group were shown a scouting video, the control group were not shown any kind of video at all. If the utilization of scouting videos in image rehearsal so as to stimulate vivid motor imagery is to be advocated for practical use, then there is a need to implement detailed examination of the content of scouting videos, by undertaking comparison with other match video. An additional point is that, when scouting videos are used for practical purposes, they are normally utilized in team meetings where the manager or coach wishes to get some particular point across to the players. In the present study, the participants did not receive any instructions from their manager or coach when watching the scouting video, thereby removing the manager’s or coach’s intent aspect from the process of viewing the video; it might be considered that an essential aspect of the fundamental nature of the scouting video was thus lost. In the future, if the use of scouting videos in image rehearsal in actual practice is to be advocated, then detailed examination and research will need to be undertaken into the content of scouting videos and how they are actually perceived.
ReferencesGrasso, R., Schena, F., Gulli, G. and Cevese, A. (1997). Does
low-frequency variability of heart period ref lect a specific parasympathetic mechanism?. Journal of the Autonomic Nervous System, 63(1-2): 30-38.
Hasegawa, K. (1991). The Scale of Vividness of Mental Imagery. Bulletin of Faculty of Letters Aoyama gakuin University , 33: 63-96.
Hasegawa, K. (1997). A Study on Measurement of Mental Imagery 8). Bulletin of Faculty of Letters Aoyama gakuin University, 39: 41-52.
Hayashi, Y. (2001). The difference in image and ability contents of an image: Physiological psychological change of Imagery. The 52 Conference Japanese Society of Physical Education-Health and Sports Science, 261.
Kodama, M. (1993). Study of the effect of different training style Ⅰ- study of image sharpening. The 44 Conference Japanese Society of Physical Education-Health and Sports Science 220.
Kon, H. (2007). A Study on Group Tactics Analysis in Soccer Videos. Technical report of IEICE., IE Image engineering, 106(536): 121-124.
Kotani, Y. (2004). Physiological mechanism of mental training. Japan Society of Sports Psychological Edition, Sports psychology. pp.197-208, Taisyuukannsyoten.(in Japanese).
Lotze, M. and Halsband, U. (2006). Motor Imagery. Journal of Physiology, Paris, 99(4-6): 386-395.
Onigata, S., Suzuki, T. (2009). Literatures research on motor image. Bulletin of Kansai University of Health Science, 3: 61-67.
Oishi, K. (1992). Changes of physiological parameters during

Effects of Scouting Videos on Physiological and Psychological Responses
Football Science Vol.11, 28-35, 2013http://www.jssf.net/home.html
35
mental rehearsal of speed skating. Japan Jounal of Physical Education, Health and Sports Sciences, 36:303-312.
Oishi, K. (2006). Autonomic Responses and Motor Imagery. pp.12,Publication Administration of Sensyuu University. (in Japanese).
Porro, C. A., Francescato, M. P., Cettolo, V., Diamond, M. E., Baraldi, P., Zuiani, C., Bazzocchi M., di Prampero P.E. (1996). Primary motor and sensory cortex activation during motor performance and motor imagery: A functional magnetic resonance imaging study. The Offi cial Journal of the Society for Neuroscience, 16(23):7688-7698 .
Sekimura, M., Onizawa, Y., Okade, Y. (2005). Inf luence the video is on the effect of learning tactics: An example of a class of university students football. The 56 Conference Japanese Society of Physical Education-Health and Sports Science,377.
Sone, J. (2008). A study on the ways to make the strategy and tactics in SYRIA U-17 National Football team. Bulletin of Osaka University of Health and Sport Sciences 39: 37-53 .
Takano, H., Nakagomi, S., Tuchiya, H., Takahasi, K.,(1995). State diagnostic test creation of image experience a problem of image competition performance scene ideal, Japanese Journal of Sports Psychology, 22(1): 24-31.
Tuchiya, H. (2005). Imagery. Japan Society of Sports Psychology Edition, Sports Mental Training Textbooks, pp.111-115, Taisyuukannsyoten.(in Japanese) .
Yamanaka,H (2005). Relaxation. Japan Society of Sports Psychology Edition, Sports Mental Training Textbooks, pp.96-100, Taisyuukannsyoten.(in Japanese).
Name: Takahiro Matsutake
Affi liation: Graduate School of Osaka University of Health and Sport Sciences
Address: 1-1 Asasirodai,Kumatorichou,Sennnangun, Osaka 590-0496 Japan
Brief Biographical History: 2012-2014 Master's Program in Graduate school of Osaka University Health and Sport Sciences
Membership in Learned Societies: • Japan Society of Physical Education, Health and Sport Sciences• Japanese Society of Sports Psychology