Effects of sa ps on agriculture in mukono district(original)
49
EFFECTS OF STRUCTURAL ADJUSTMENT PROGRAMME ON AGRICULTURE IN UGANDA: A CASE STUDY OF MUKONO DISTRICT BY KATEREGGA DENNIS 00/U/7552/PS A RESEACH PAPER SUBMITTED IN PARTIAL FULFILMENT OF THE REQUIREMENTS FOR THE AWARD OF THE BACHELOR OF ARTS DEGREE IN ECONOMICS MAKERERE UNIVERSITY SEPTEMBER 2003
-
Upload
dennis-kateregga -
Category
Environment
-
view
523 -
download
4
Transcript of Effects of sa ps on agriculture in mukono district(original)

EFFECTS OF STRUCTURAL ADJUSTMENT
PROGRAMME ON AGRICULTURE
IN UGANDA: A CASE STUDY OF
MUKONO DISTRICT
BY
KATEREGGA DENNIS
00/U/7552/PS
A RESEACH PAPER SUBMITTED IN PARTIAL
FULFILMENT OF THE REQUIREMENTS FOR THE
AWARD OF THE BACHELOR OF ARTS DEGREE
IN ECONOMICS
MAKERERE UNIVERSITY
SEPTEMBER 2003

i

DEDICATION
To my parents Mr. Kateregga Wilberforce and Mrs. Kateregga Prossy.
ii

ACKNOWLEDGEMENT
I am greatly indebted to my Supervisor Dr. James Muwanga who repeatedly
guided me during the production process of this thesis.
Thanks to my respondents in Mukono who were very co-operative despite seeing
the process for their first time i.e., the interview of the key informants and
application of questionnaires to other respondents. Special thanks to the L.C
Chairman Mr. Tadeo Mukasa who guided me through the whole process.
I equally extend special thanks to my family Dad, Mum, Ronnie, Maria, Elias,
Josephine, Robert and Cedric who tirelessly contributed materially and morally
towards my success.
iii
TABLE OF CONTENTS
PAGE
Declaration ………………………………………………………………….. I
Dedication …………………………………………………………………… ii
Acknowledgement ………………………………………………………….. iii
Table of Contents …………………………………………………………… iv
List of Table and Figures …………………………………………………... vi
List of Appendices ………………………………………………………….. vii
Acronyms ……………………………………………………………………. viii
Abstract ……………………………………………………………………… ix
Chapter 1 Background to the study
1.1 Background ………………………………………………. … 1
1.2 Agriculture …………………………………………………… 1
1.3 Structural Adjustment Programmes in Uganda ………….. 3
1.4 Statement of the problem …………………………………... 5
1.5 Objective of the study ………………………………………. 5
1.6 Significance of the study …………………………………… 6
1.7 Scope of the study …………………………………………. 6
Chapter 2 Literature Review
2.1 Literature Review …………………………………………... 7
Chapter 3 Methodology
3.1 Introduction …………………………………………………. 15
3.2 Research design ……………………………………………. 15
3.3 Study area and its selection rationale ……………………. 15
3.4 Sample selection and size ………………………………… 15
3.5 Data collection and type of data ………………………….. 16
3.6 Data analysis ……………………………………………….. 16
3.6.1 Quantitative data analysis ………………………………… 16
3.6.1.1 Editing… …………………………………………………… 16
3.6.1.2 Coding……………………………………………………… 16
iv

3.6.1.3 Tabulation………………………………………………….. 16
3.7 Qualitative data analysis.………………………………… 17
3.8 Procedure.………………………………………………… 17
3.9 Hypothesis………….……………………………………… 17
3.10 Limitations to study………………………………………… 18
Chapter 4 Presentation of the findings
4.1 Household structure ……………………………………….. 19
4.2 Education level ……………………………………………... 20
4.3 Land Holding and Land use ………………………………. 22
4.3.1 Crop Enterprises …………………………………………… 23
4.4 Livestock farming ………………………………………….. 24
4.5 Level of agricultural modernization ……………………… 25
4.6 Farmers’ perception towards SAP ……………………….. 28
4.6.1 Agricultural markets before and after SAP ……………... 28
4.6.2 Changes in farm production during the SAP period …… 30
Chapter 5 Conclusion and Recommendations
5.1 Conclusions ………………………………………………. 32
5.2 Policy recommendations …………………………………. 34
5.3 Recommendations for further research ………………… 35
5.4 References ………………………………………………… 36
Appendix …………………………………………………… 38
v

LIST OF TABLES AND FIGURES
PAGE
Table 1.2 Performance of agriculture between 1986-1995 (in terms of
GDP)………………………………………………………… 2
Table 4.1 Household size and composition by age ………………… 19
Table 4.2 Average land size under major cash and food crops …... 23
Table 4.3 Average number of livestock kept per respondent in
Mukono ………………………………………………………. 24
Table 4.4 Percentage of farmers responses on marketing before
and after SAP periods ……………………………………… 30
Table 4.5 Reasons for farm production increase during SAP
period ………………………………………………………... 31
Table 4.6 Reasons for farm production decrease during SAP
period ………………………………………………………… 32
Figure 4.1 Age structure of respondents ……………………………… 20
Figure 4.2 Education level of respondents ……………………………. 21
Figure 4.3 Categories of farmers according to land size
possessed …………………………………………………… 22
Figure 4.4 Land size in Mukono District ………………………………. 23
Figure 4.5 Effect of a change in price of industrial output on
supply of intermediate goods by the industrial sector ….. 27
Figure 4.6 Industrial output on industrial demand for inputs of
agricultural origin …………………………………………… 27
vi

LIST OF APPENDICES
1. Questionnaire
2. Introduction letter
vii
ACRONYMS
ERP - Economic Reform Programme
CMB - Coffee Marketing Board
CMBL - Coffee Marketing Board Limited
LMB - Lint Marketing Board
LMBL - Lint Marketing Board Limited
SAP - Structural Adjustment Programme
COMESA - Common Market for Eastern and Southern Africa
NRM - National Resistance Movement
NPC - Nominal Protection Coefficients
WB - World Bank
IMF - International Monetary Fund
MFEP - Ministry of Finance and Economic Planning
COBE - Census of Business Establishment
RFS - Rural farmers Scheme
CCS - Co-operative Credit Scheme
IFAP - International Federation of Agricultural Producers
DAO - District Agricultural Officer
viii
ABSTRACT
Since 1987, the government of Uganda has been implementing economic policy
reforms under the commonly called Structural Adjustment Programme. Among
other policy measures, price controls and the monopoly of marketing boards
were dismantled and export duties were virtually eliminated.
This study examines Ugandan farmers’ socio-economic backgrounds farm
resource availability and farmers’ perception towards SAP, It also analyses the
effects of SAP on output, household income. Most specifically, the study
determines how and to which extent trade liberalization policies should be
implemented, the capability of the liberalized economy to withstand unfavourable
world market price changes.
Results from a field survey in Mukono district where questionnaires were
administered on a sample size of 45 farmers, indicate that there was a decline in
farm production and changes in farm production.
This study also analysed the vulnerability of the liberalized economy in case of
unfavourable changes in external market conditions. Given the fact that farmers
respond to changes in market conditions, appropriate policy measures should be
undertaken to increase the flow of benefits that accrue from adjustment policies
to the farming community. If such measures are not in place, efforts of carrying
out structural adjustment will be rendered fruitless.
ix

CHAPTER 1
INTRODUCTION
1.1 Background
Uganda occupies an area of 241,038 sq. km. of which 18.23% (43,942 sq.
km) is open water and swamps and 81.77% (197,097 sq. km.) is land
area. According to the 2002 housing and population census, the country
had a population of 24.7 million people (69 persons/sq. km) compared to
9.5 million (40 persons / sq. km) and 12.6 million people (52 persons / sq.
km) in 1969 and 1980 census respectively, giving an average annual
growth rate of 2.7% and 2.5% for the periods 1969 – 1980 and 1980 –
1991 respectively.
Total population projection based on 1991 census gave an estimate of 20
million people in 1997, 22 million in 2000 and 35.5 million in 2015.
Although the fertility rate declined from 7.1 to 6.8 children per woman, the
population continued to grow at a rate of about 2.83% p.a. in 1999.
Uganda had a GNP per capita of US$280 in 2001.
Agriculture is the most important sector of the economy. In 1999/2000 it
accounted for about 42% of GDP and for the bulk of exports. The sector
employs around 80% of the labour force.
1.2 Agriculture in Uganda before SAP
The crisis of the Ugandan agriculture is dated as far as the colonial era,
when farmers were given instructions to grow certain types of cash crops,
but with no emphasis on food crops.
Furthermore, the processing and marketing of the cash crops was
monopolized by foreigners mainly the Asians and some European Import
and Export companies, with trade proceeds not re-invested in agriculture,
but invested in import substitution industries which were not foreign
exchange earners.
Besides, farmers had been dependent on rudimentary technology with
heavy capital constraints, and strong reliance on cheap, and in most
cases, unskilled family labour.

In attempts to solve these problems, both the colonial and post-
independence governments administered agricultural output prices and
supplied farmers with subsidized inputs as an incentive to increase
production. However, the subsidies were discriminatively given to the
large-scale farmers, and the marketing policies discouraged most small-
scale farmers from producing for the market. Those who persisted with
cash crop growing were paid late for their produce and lacked extension
services and other infrastructural support.
These, coupled with the inefficiency of the state-controlled marketing
boards and other natural calamities such as drought, accelerated the rate
at which agriculture was declining.
It was against this background that Uganda adopted structural adjustment
policies (SAP) which, among other goals, were meant to reverse the
decline in agriculture and hence induce positive economic growth. These
policies which were under the ERP were initiated during the period 1987-
1992, aimed at improving producer incentives as well as increasing the
processing and marketing of agricultural products.
Table1.2:Performance of agriculture between 1986-1995 (in terms of GDP)
Sub-Sector 1986 1987 1988 1989 1990 1991 1992 1993 1994 1995
Food crops 38.1 37.4 37.1 37.4 36.5 35.1 34.6 34.4 33.5 32.2
Cash crops 3.55 3.36 3.25 3.22 3.28 3.38 3.27 3.09 3.29 3.24
Livestock 9.54 9.33 9.39 9.13 8.99 8.89 8.67 8.48 7.89 7.43
Forestry 2.12 2.16 2.17 2.05 2.07 2.05 2.06 2.02 1.92 1.85
Fishing 2.74 2.68 2.56 2.40 2.61 2.58 2.57 2.51 2.21 2.08
Total Agric 56.1 54.9 54.5 54.2 53.4 52.0 51.2 50.5 48.8 46.8
Growth in
Agric
- 4.4 6.3 5.8 4.1 2.4 2.8 4.4 6.4 4.4
Source: Background to the Budget 1996/1997
The 4.5 percent average growth rate in agricultural output achieved for the
period 1987-1992 was due to high growth in food crop production. Growth
in food production on the average was 3.2 percent per annum, whereas
export crops and livestock production grew more slowly at a rate of 1-2
percent.

As a result, an agricultural sector policy agenda was formed to implement
the agricultural sector reform package. The package constituted
agricultural pricing policy, trade liberalization and promotion restructuring
of marketing boards, rationalization of crop processing capacity, financial
rehabilitation of co-operative unions, and strengthening agricultural
research and extension institutions.
Africa is not likely to take off unless its agricultural sector takes off
because of the strong linkage that exists between agricultural growth,
domestic purchasing power expansion, and the demand for industrial
goods.
1.3 Structural Adjustment Programmes in Uganda .
The war brought the NRM into power in January 1986 with an agenda of
rehabilitating the shattered economy. Its approaches to rebuild the
economy were different from those of the previous regime and it was anti-
IMF advice of currency devaluation. The flexible foreign exchange regime
thus replaced by a fixed one at a rate of Ush14.00 to the US dollar,
increased salaries by 50% re-introduced price controls and extended
government monopoly control over internal and external trading.
However, economic conditions continued to deteriorate with a fall in coffee
revenue, a decline in marketed food output and an increase in prices,
crucial balance of payment and increased inflation.
This called for an adoption of ERP in May 1987 accepting the advice,
guidance and assistance of the IMF and the WB. Among other measures
undertaken included the de-regulation of trade by abolishing export and
import monopolies.
Before SAPS, the marketing of Uganda’s export crops and some food
crops was under the control of parastatals namely; CMB for coffee, LMB
for cotton and PMB for beans, groundnuts, maize and other cereals.
Although these boards were meant to ensure marketing efficiency, they
did not perform according to expectations. Farm prices were low with
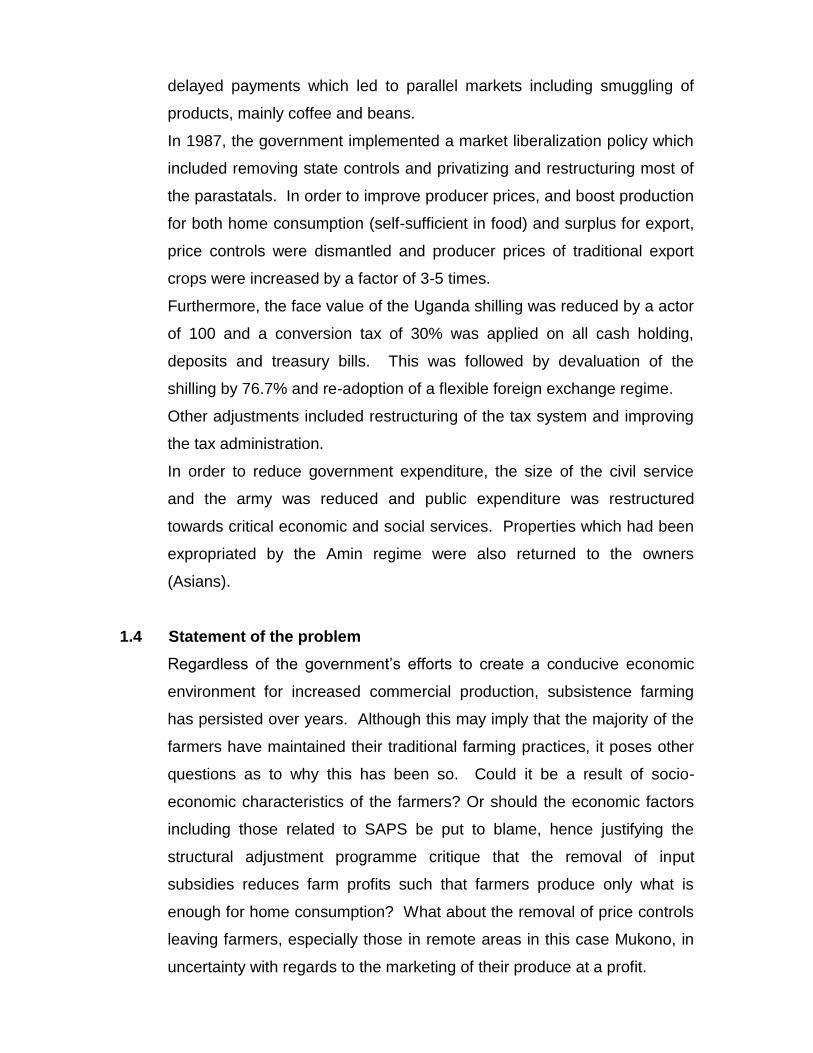
delayed payments which led to parallel markets including smuggling of
products, mainly coffee and beans.
In 1987, the government implemented a market liberalization policy which
included removing state controls and privatizing and restructuring most of
the parastatals. In order to improve producer prices, and boost production
for both home consumption (self-sufficient in food) and surplus for export,
price controls were dismantled and producer prices of traditional export
crops were increased by a factor of 3-5 times.
Furthermore, the face value of the Uganda shilling was reduced by a actor
of 100 and a conversion tax of 30% was applied on all cash holding,
deposits and treasury bills. This was followed by devaluation of the
shilling by 76.7% and re-adoption of a flexible foreign exchange regime.
Other adjustments included restructuring of the tax system and improving
the tax administration.
In order to reduce government expenditure, the size of the civil service
and the army was reduced and public expenditure was restructured
towards critical economic and social services. Properties which had been
expropriated by the Amin regime were also returned to the owners
(Asians).
1.4 Statement of the problem
Regardless of the government’s efforts to create a conducive economic
environment for increased commercial production, subsistence farming
has persisted over years. Although this may imply that the majority of the
farmers have maintained their traditional farming practices, it poses other
questions as to why this has been so. Could it be a result of socio-
economic characteristics of the farmers? Or should the economic factors
including those related to SAPS be put to blame, hence justifying the
structural adjustment programme critique that the removal of input
subsidies reduces farm profits such that farmers produce only what is
enough for home consumption? What about the removal of price controls
leaving farmers, especially those in remote areas in this case Mukono, in
uncertainty with regards to the marketing of their produce at a profit.
1.5 Objective of the study
One of the general objectives of the study is to analyse the farming status
in Uganda including the understanding of farmers socio-economic
characteristics, farm resource availability and farmers’ perception towards
SAP.
Secondly, the study aims at analyzing the impact of SAP on the Ugandan
agricultural sector in particular and on other economic sectors in general.
The specific objectives are:
i) To examine the Ugandan farming status in terms of farmers’ socio-
economic characteristics, resource availability and farmers’
perception towards SAP.
ii) To determine the effects of trade liberalization policies on
agricultural production.
iii) To examine the stability of the liberalized economy to changes in
the external market conditions.
iv) To quantify the impact of trade liberalization policies on household
income.
1.6 Significance of the study
The study aims at helping policy makers in formulating policies at both
macro and micro-economic levels. It is relevant to the current situation in
Uganda and other members of the COMESA, who are in the process of
dominating across border tariffs to create a free trade zone for produce
that comes from their rural farmers like those of Mukono. Besides that,
the study, could serve as a stepping stone for other research work that
aims at solving similar problems.
1.7 Scope of the study
The study is more interested in the likely outcomes of SAP it will further
concentrate on trade liberalization policies with regard to how these
policies could be implemented and what the consequences would be.
Mukono is the case study because it is near Kampala and this proximity to
urban centres is an incentive to agricultural production and farmers tend to
be market oriented.
CHAPTER 2
LITERATURE REVIEW
Todaro (1985), he said if development is to take place and become self-
sustaining, it will have to start in the rural areas (Mukono) and the
agricultural sector in particular. The core problems of widespread poultry,
growing income inequality, rapid population growth and rising employment
all originate from the stagnation of the agricultural sector policies must
favour the agricultural sector so that it can play a pivotal role in the
development of a country. As a matter of fact, most development
economists have strongly agreed for an agricultural led growth strategy
that suits developing countries.
Agriculture cannot be the only prime mover of the economy at least there
are some linkages with other sectors like industrial sector, Todaro over
looked the possibility of linkages i.e., agriculture provides market for
industrial output.
Krueger (1989), policies affect the agricultural sector in the following
forms directly through the sector-specific policies and indirectly through
economy wide policies. The effects are all summed up in the two main
government policies characteristic of developing countries.
First, government imposed marketing mechanisms through monoplolistic
marketing boards and unions coupled with export taxes and quotas often
supposed producer prices for agricultural crops. In Uganda the LMBL and
CMBL were responsible for marketing of all the coffee and cotton growth
until recently 1991 when their monopoly was dismantled by government
as one of the ways of liberalization.
Second, is the attempting to off-set the dis-incentive created by the fore-
most loned policies these governments have chosen to provide some
incentives in form of providing free seeds, interesting into research for
high yielding seeds and pest-weed control methods, irrigation, provision of
machinery on loan and many other capital investments. In Uganda these
investments have involved also the rehabilitation/construction of roads to

facilitate the transportation of agricultural crops from the farmers to the
boards and consumers.
Krueger left out how these policies (SAP) affected agriculture and what
crops in particular what he had to do was to select some major crops.
According to Okwi, Matovu and Mpuga (2000), the normal process of
structural transformation from agriculture to other sectors has not been
smooth in Uganda due to political instability in some part. The
transformation requires that an expanding economy must have a growing
agricultural sector and secondly, the share of agriculture in a country’s
GDP decline with a country’s development.
They only looked at the growth of agricultural sector as the only way
structural transformation can be attained, other sectors are also needed to
achieve this transformation. The share of agriculture to the country’s GDP
is also important in this study, the next study must identify the
contributions of SAP to the increase in the share of GDP because they did
not specify how the share is to be increased.
Rural life and Agriculture tour, Zambia (2002), key issue in understanding
the contribution of the agricultural sector to the economy of Zambia is the
low level of productivity from the small scale farms. In the 1970s and
1980s this put pressure on small-scale farmers to break with traditional
slash and burn methods and adopt more modern techniques that raised
the productivity of the land since Independence the government
subsidized small-scale farmers by ways of providing cheaper low cost
imported fertilizers. However, with the agricultural reforms in the 1990s by
President Chiluba’s government in response to Structural Adjustment
Programmes of the IMF, these subsidies have been reduced or at back
forcing up the price of fertiliser. Many small-scale farmers have been
unable to afford the new prices or the cost of transporting it from the
warehouses and have had little option to return to “chitemene”.
Chitemene is a slash and burn method of cultivation.

There are very many methods that are used in Zambia this study left out
which are important, so the next study should look at those other methods
and how subsidies are cut under the influence of SAP.
According to Tsikata (2002), the longer term structural adjustment
programme is aimed at the promotion of production and resource
mobilization through the promotion of commodity exports, public sector
reform, market liberalization and institutional reform. The programme
seeks to limit the role government in the economy, promote private sector
operations and remove restrictions in the economy and ensure market
determined prices.
The problems of gender relations in Africa have been exacerbated by SAP
in a number of ways like in Tanzania and Nigeria, poor and middle class
women are giving up formal employment for informal sector work because
it pays better. Export cropping has often not benefited women. Studies in
Kenya and Zaire have found that although there is no next dichotomy
between men’s cash crops and women food crops, women farmers are
disadvantaged in relation to men because they focus on food consumption
production and have less access to farm support services and crucial
inputs.
He critizes SAP, that they have disabled African economies from
fundamentally changing their character as primary commodity products, a
situation which is the source of the crisis of Africa’s economies. This is
particularly important because many of the SAP policies are designed on
the basis of a questionable ‘comparative advantage’ in that they aim to
strengthen the ability of African economies to produce what they were
already producing, primary commodities.
The total trade liberalization, high interest rates and the full removal of
subsidies have threatened both agriculture and domestic industries.
Agriculture, especially food production, has also been adversely affected
by interest rates and the high prices of inputs. There is consensus that
low commodity prices have not brought the economic returns expected
from the promotion of export agriculture. He left out the narrowness and

the little relevancy to long term development goals, so this study will point
out that.
Green, February (2003), he points out that the economic reform was
overdue in many third world countries. He looked at how some policies
worked for rich countries and would not work for the poor countries.
IMF gave the same advice it got to this non-developed countries that of
export crops which has led to over production of some commodities and a
drop in their prices on world markets.
Instead of rising, export earnings often declined country by country,
structural adjustment became the problem not the solution. There should
have been variations in policies that were applied to poor countries i.e., as
shown by the following study.
According to Dong, Kastner, Young (1991), adjustment programmes that
succeed in one country may prove difficult to implement in other partly
because of domestic political constraints.
Mutiibwa, (1990) as in several other developing countries, Uganda
depends on its agricultural produce both for subsistence and export crops
while tea, tobacco and sugarcane are important for the East African and
international markets, this has been proved right by the introduction of
SAP where its 85% of the population have depended on it and 10% of the
population earns their living from agro-oriented industries. All this
contribution is attributed to the participation of the women who are like
their counterparts in the world developing countries, are involved in small-
scale agricultural and agro-oriented activities for both subsistence and
business levels. A further insight to women and agriculture is given by the
study below.
Workers’ World News (1996), women in developing countries have
suffered the worst effects of the IMF and WB policies of neo-liberalism.
The structural adjustment programmes that go along with IMF/WB loans

have only resulted in political and economic disaster for the countries that
borrow money from them. SAP are based on export-oriented
industrialization, they do not develop industry to meet local demand for
basic goods, this kind of industrialization has also resulted in people
moving from rural areas to the towns and cities.
The participation of women in the economy tends to be higher when the
economy is organized around family based production in agriculture. So,
an industrialization policy that is not linked to a sustainable land
development programme has a negative impact on the participation of
women in the labour market.
The next study is going to look at how the women have participated in
commercial agriculture because there has been a transition from
traditional agriculture and then contribution to export-oriented
industrialization. How an industrialization policy can be linked to a
sustainable land development programme that can enhance women
contribution to agriculture? That is the question that should be answered
in the coming study.
Reed (1992), one of the most important economic contributions of
structural adjustment programmes is the removal of distortions that
prejudiced the agricultural sector for many years. Commercial agricultural
production expanded and diversified in many countries as trade and
exchange rate reforms opened new market opportunities for commercial
producers. Distortionary subsidies have been removed and more efficient
marketing arrangements are evolving as government – controlled
marketing boards although still in place in some countries are being
dismantled. Reed only acknowledged the removal of distortions as the
only contribution of SAP, this study will look for other contributions.
According to Jaeger (1991), the impact of government policy on
agriculture. He argues that since government policies have discriminated
against agriculture, measuring the dispersion of the farmers’ price from the
world price would be a measure of the direct government intervention.
Jaeger reviews government policies which affect farmers as being
basically three.
a) The fixing of agricultural prices,
b) Export taxes
c) Monopolistic marketing arrangements by the government.
Jaeger realizes the effect of macro-economic policy on agriculture using
the NPC to get the effects of policies on agriculture.
What Jaeger left out was the limitations the of NPC and their effect on the
monopolistic marketing arrangements by the government ,so this study is
going to look at that.
Kabuga, October (2001), in his assessment of the impact of SAP on
agriculture and rural livelihoods in Sub-Saharan Africa, there cannot be
better evidence than that given by the very affected people themselves.
Around 1995, and in the face of persistent criticisms of SAP, the WB and a
number of governments sought to improve their understanding of the long-
term economic and social impacts of SAP.
They undertook to do this through an exercise known as SAPRI, in
countries with a history of SAP supported by WB and IMF. Involved in this
initiative were civil society organizations, governments and the Bank.
During the launch, both the Bank and government presented evidence
regarding the positive impacts SAP had had on agriculture and on the
livelihoods of people. On account of its success of financial stabilization
and strong structural reforms, Uganda reported that it had maintained a
growth rate averaging six percent of GDP for the last decade with inflation
below 5%.
A steady increase in agricultural growth of 4.0-4.5% p.a in the last ten
years had been registered and a fall in the incidence of poverty by 18%
over a period of three years (1992 to 1995) was reported. It was also
reported that before CMB was liberalized, the farmers earned less than
20% of the world market prices. After liberalization, over 70% is earned.
While liberalization might have exposed the farmers to the volatility in

commodity prices, the removal of controls on effort margins improved
income received by the farmers.
While the views of civil society organizations in the countries that
participated in the initiative may not be representative of all countries, the
impact of SAP on agriculture in Sub-Saharan Africa have generally been
the same.
Civil society organizations hailed SAPRI for the opportunity it provided all
stakeholders to assess the impact of SAP on the livelihoods of ordinary
people as perceived by those people themselves. All in all, it was
generally agreed that the agricultural sector had made significant
contributions to “economic growth” as a result of the SAP. “Growth” was
also accepted as critical, but not the only pillar, in poverty reduction.
It was evident that farmers involved in the traditional export crops like
coffee, cocoa, cotton, etc., had benefited more from the liberalization of
agricultural marketing than the majority of farmers of non-traditional export
crops like maize, beans, soya beans, simsim, groundnuts, etc. Farmers of
non-export food crops like millet, field peas, sweet or irish potatoes
benefited least.
It must be noted that those involved in producing non-export food crops in
Africa are women. They neither benefit from what they grow nor from the
profits from export crops like coffee and cocoa, except for gifts of cloth
etc., from their husbands for the labour they provide. Not much was said
about the impact of SAP on animal industry and fisheries.
Despite the generally positive assessments of SAP on agriculture as
indicated above, the very civil society organizations questioned the
sustainability of the “growth” brought about by SAP in agriculture and
invariably raised other SAP – related concerns summarized below:
Liberalisation has negative effects on food security because at the harvest
time, the farmers sell all and at the time of need they cannot attract it back
from surplus areas due to high transport costs.
The traditional export crops have continued to dominate agricultural
exports although non-traditional crops were promoted by government
since the late 1980s. They still remain a small proportion of exports.
With liberalization, prices are determined by the demand and supply of the
specific commodity. In the absence of market information, farmers’
ignorance of commodity prices is used by traders to cheat them. Farmers
are thus wholly exposed to price and market shocks without fallback
positions.
The competition from imports of subsidized agricultural products as a
result of liberalization seriously threatens peasant agriculture.
The next study must look at the impact of SAP on animal industry and
fisheries which Kabuga did not look at which is important for this study.

CHAPTER 3
METHODS AND PROCEDURES
3.1 Introduction
This chapter presents the research design, study area and its selection
rationale sample selection and size, data collection and type, data
analysis, procedure and limitations.
3.2 Research design
The study focused on Mukono in a view to find the effects of SAPS in that
district. It looked at both the women and men. This research employed
both qualitative and quantitative methods in order to make triangulation
possible.
3.3 Study area and its selection rationale
A field survey was carried out in Mukono District in central Uganda. The
rationale for selecting this area was the existence of at least one of the
traditional export cash crop in the cropping system. Mukono was to
represent a coffee – based farming area since it is the main foreign
exchange earner of Uganda. Another factor considered was the location
of this area, since this has a bearing on production and marketing.
Mukono is a peri-urban district neighboring Kampala on the western side.
This proximity to urban centers is an incentive to agricultural production
and farmers tend to be market oriented.
3.4 Sample selection and size
Mukono district has got a population of 966,000 people who live in 6
counties. Two sub-counties were randomly selected and from each two
parishes were also randomly selected. With the help of a list of farmers
provided by the local administration authorities, ten farmers were selected
from each of the selected parishes.
The selection of farmers was random in the sense that the selected
farmer, randomly picked from the list, had to be growing coffee as one of
the farm enterprises, 5 key informants were chosen. This made a sample
size of 45 respondents.
3.5 Data collection and type of data
Farm level primary data were collected using pre-tested questionnaire.
Secondary data was also used to give the relevancy and true picture of
the study.
3.6 Data analysis
3.6.1 Quantitative analysis
The master sheet was used to analyze information from key informants.
Data from the questionnaire was processed manually, .errors were
eliminated at this stage through cross checking in view of ensuring reliable
valid analysis.
3.6.1.1 Editing Completeness, legibility, consistence, accuracy, comprehensibility and
uniformity were sighted. Editing was done after colleting the
questionnaires to detect any omissions of questions and irrelevant
answers.
Interviews, editng, were done immediately after the interviews. This aimed
at colleting the consistencies within some questions and eliminating them
with assistance from the respondents.
3.6.1.2 Coding
All responses were coded and classified to bring out their essential
proportion of the edited questionnaires which where chosen randomly
from the sub-samples of the sample.
The responses were listed question-by-question, shortening the answers
and tallying them in order to calculate their percentage.
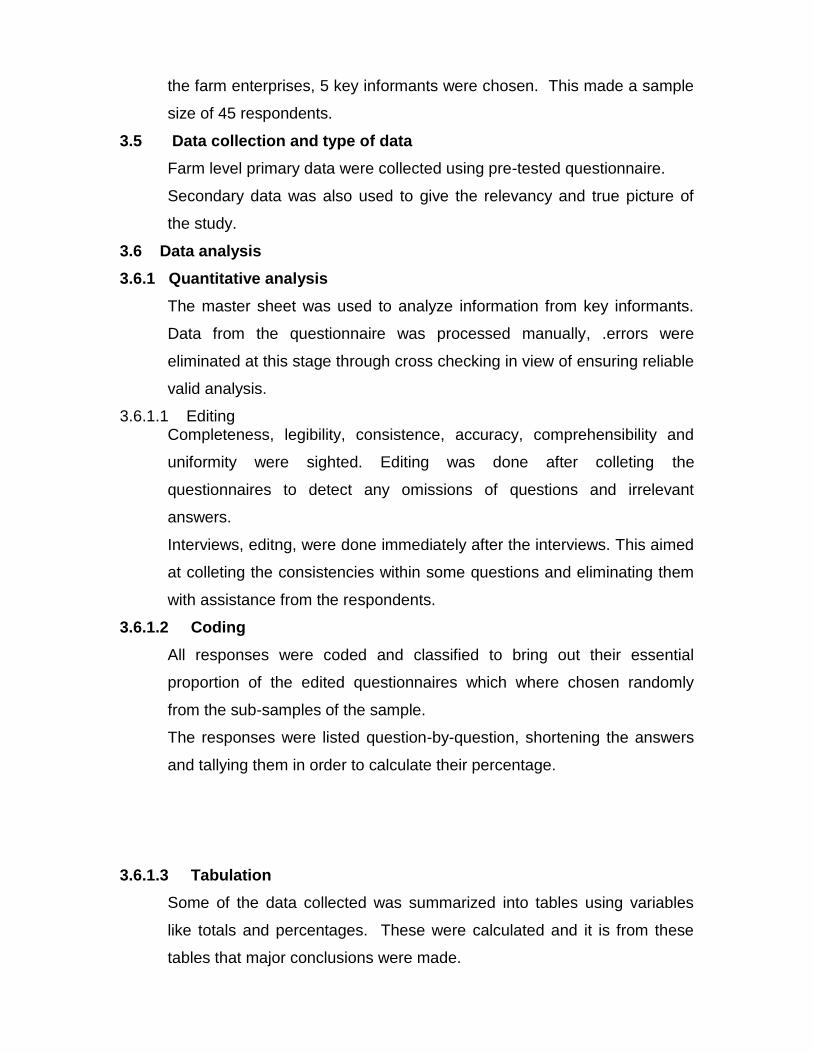
3.6.1.3 Tabulation
Some of the data collected was summarized into tables using variables
like totals and percentages. These were calculated and it is from these
tables that major conclusions were made.
3.7 Qualitative data analysis
Data analysis was done manually; analysis was done during and after
collection of the data. And before collection of data, tentative themes and
code categories were confirmed and even some new ones were
formulated.
3.8 Procedure
Letter of Introduction from the University to be presented to local
authorities.
Study area to be sampled.
Respondents to be asked verbal permission on what to be interviewed.
Interview of individual respondents with the help of local authorities.
3.9 Hypothesis of the study
The study is guided by the following hypothesis:
1. Uganda could achieve a better economic position by making more trade
policy adjustments; and the negative effects in case of an external
economic shock are expected to be less pronounced with trade
liberalization than without.
2. Exports are expected to increase at a higher rate than imports leading to
the narrowing of the balance of trade deficit. This is due to the
expectations that liberalization widens external market outlets in terms of
quantities and better prices resulting into increased production of exports
and imports substitutes.
3. Mukono’s output is expected to increase following liberalization policies.
These policies expectedly increase producer prices and hence provide
incentives to producers. If, on the other hand, trade barriers exist,
favorable market prices are not fully transmitted to farmers. This is
expected to lead to comparatively low levels of resource use ,which in turn
leads to low output levels.
3.10 Limitations to the study
The major limitation of the study was the scattered nature of some of the
relevant data. Besides, there was a problem of inconsistency in some

data served from different sources, let alone being in certain formats that
made their use in the model of this study very difficult.
Respondents’ absenteeism and constant postponing of appointments by
key informants was another problem. This was however, overcome by the
researcher’s patience.
The funds, time constraint, the study concentrated only on one district
(Mukono) and the confidence of the researcher determined the data that
was collected.
Language barrier was another problem since some people had not
attained the necessary education levels. This necessitated the researcher
to translate the questionnaire and re-structured interviews to the
understandable language of the respondents
CHAPTER 4
PRESENTATION OF THE FINDINGS
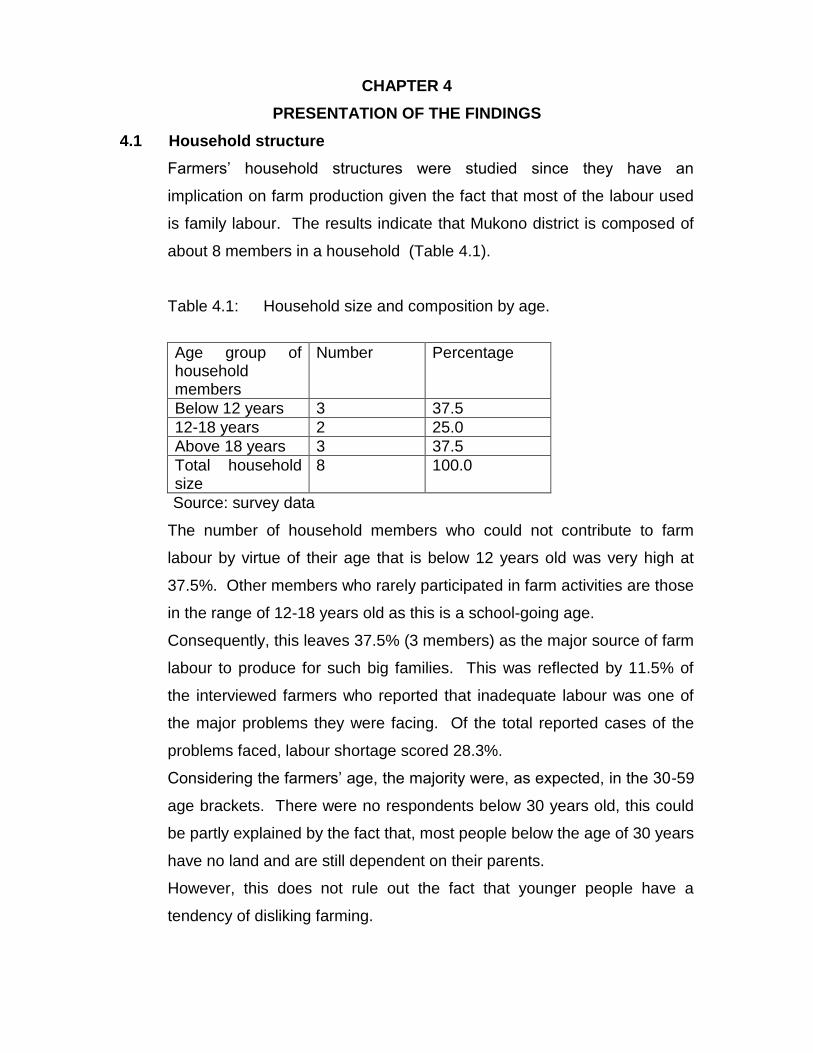
4.1 Household structure
Farmers’ household structures were studied since they have an
implication on farm production given the fact that most of the labour used
is family labour. The results indicate that Mukono district is composed of
about 8 members in a household (Table 4.1).
Table 4.1: Household size and composition by age.
Age group of household members
Number Percentage
Below 12 years 3 37.5
12-18 years 2 25.0
Above 18 years 3 37.5
Total household size
8 100.0
Source: survey data
The number of household members who could not contribute to farm
labour by virtue of their age that is below 12 years old was very high at
37.5%. Other members who rarely participated in farm activities are those
in the range of 12-18 years old as this is a school-going age.
Consequently, this leaves 37.5% (3 members) as the major source of farm
labour to produce for such big families. This was reflected by 11.5% of
the interviewed farmers who reported that inadequate labour was one of
the major problems they were facing. Of the total reported cases of the
problems faced, labour shortage scored 28.3%.
Considering the farmers’ age, the majority were, as expected, in the 30-59
age brackets. There were no respondents below 30 years old, this could
be partly explained by the fact that, most people below the age of 30 years
have no land and are still dependent on their parents.
However, this does not rule out the fact that younger people have a
tendency of disliking farming.
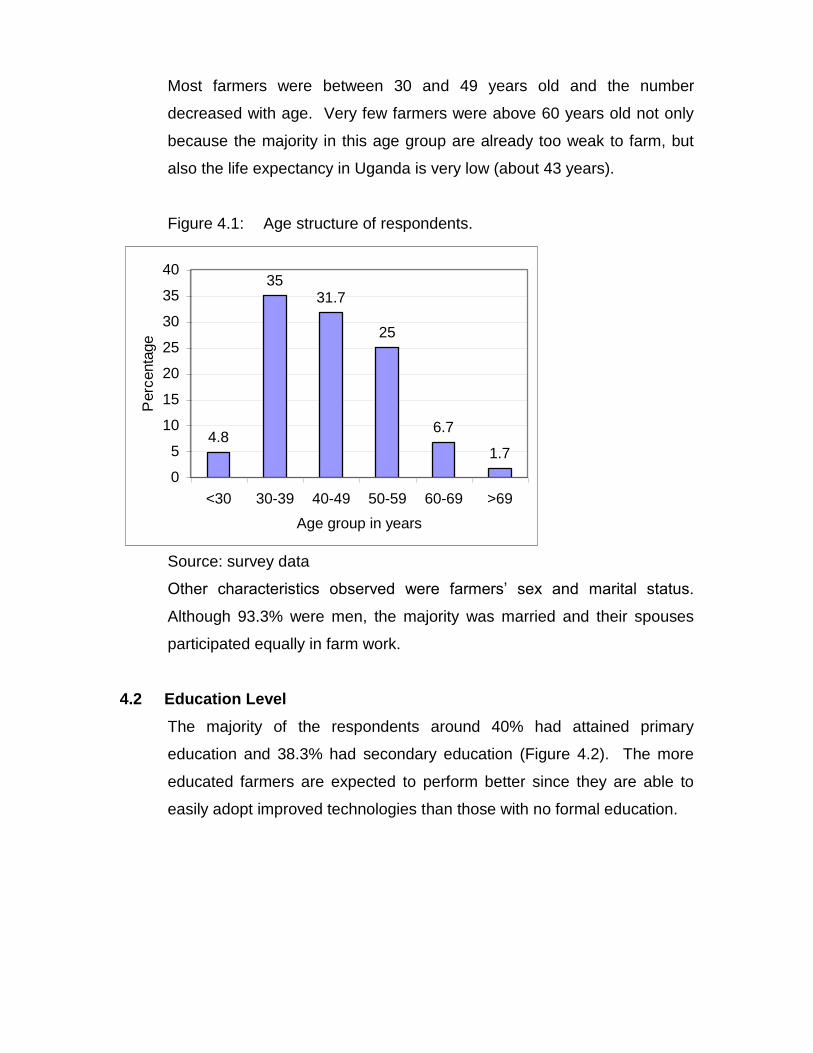
Most farmers were between 30 and 49 years old and the number
decreased with age. Very few farmers were above 60 years old not only
because the majority in this age group are already too weak to farm, but
also the life expectancy in Uganda is very low (about 43 years).
Figure 4.1: Age structure of respondents.
4.8
3531.7
25
6.7
1.7
0
5
10
15
20
25
30
35
40
<30 30-39 40-49 50-59 60-69 >69
Age group in years
Perc
enta
ge
Source: survey data
Other characteristics observed were farmers’ sex and marital status.
Although 93.3% were men, the majority was married and their spouses
participated equally in farm work.
4.2 Education Level
The majority of the respondents around 40% had attained primary
education and 38.3% had secondary education (Figure 4.2). The more
educated farmers are expected to perform better since they are able to
easily adopt improved technologies than those with no formal education.
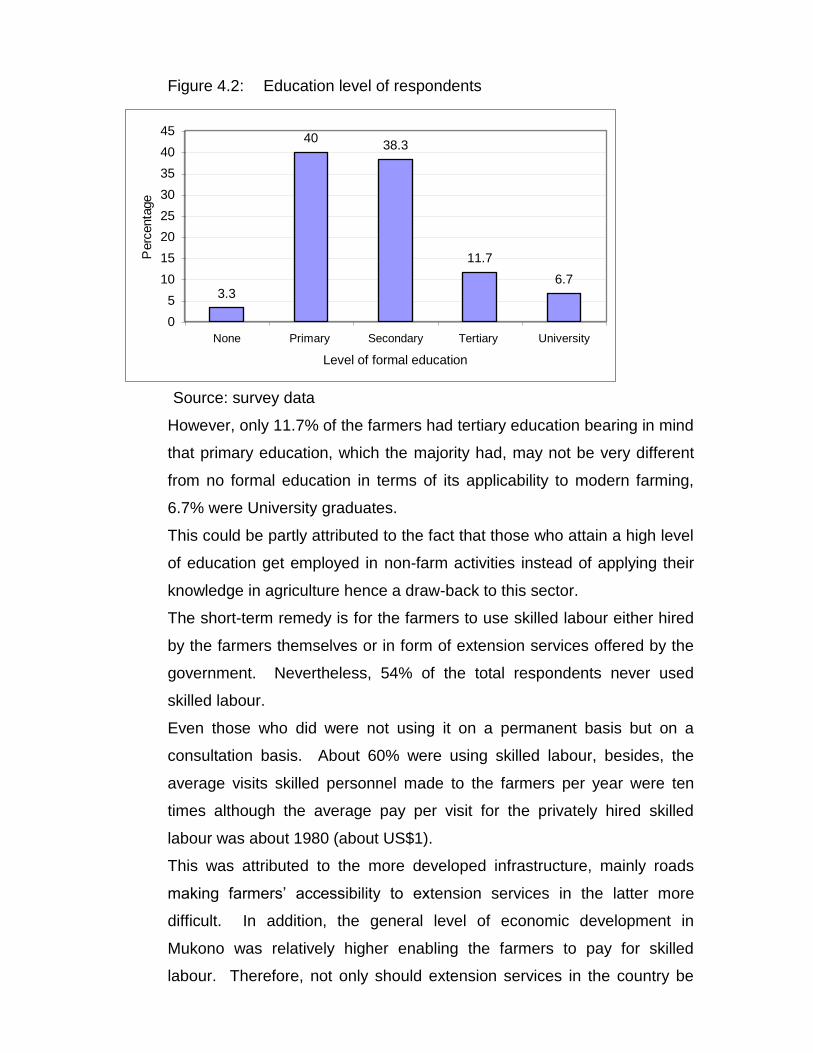
Figure 4.2: Education level of respondents
3.3
4038.3
11.7
6.7
0
5
10
15
20
25
30
35
40
45
None Primary Secondary Tertiary University
Level of formal education
Perc
enta
ge
Source: survey data
However, only 11.7% of the farmers had tertiary education bearing in mind
that primary education, which the majority had, may not be very different
from no formal education in terms of its applicability to modern farming,
6.7% were University graduates.
This could be partly attributed to the fact that those who attain a high level
of education get employed in non-farm activities instead of applying their
knowledge in agriculture hence a draw-back to this sector.
The short-term remedy is for the farmers to use skilled labour either hired
by the farmers themselves or in form of extension services offered by the
government. Nevertheless, 54% of the total respondents never used
skilled labour.
Even those who did were not using it on a permanent basis but on a
consultation basis. About 60% were using skilled labour, besides, the
average visits skilled personnel made to the farmers per year were ten
times although the average pay per visit for the privately hired skilled
labour was about 1980 (about US$1).
This was attributed to the more developed infrastructure, mainly roads
making farmers’ accessibility to extension services in the latter more
difficult. In addition, the general level of economic development in
Mukono was relatively higher enabling the farmers to pay for skilled
labour. Therefore, not only should extension services in the country be
promoted but also transport and communication should be improved to
make these services easily accessible.
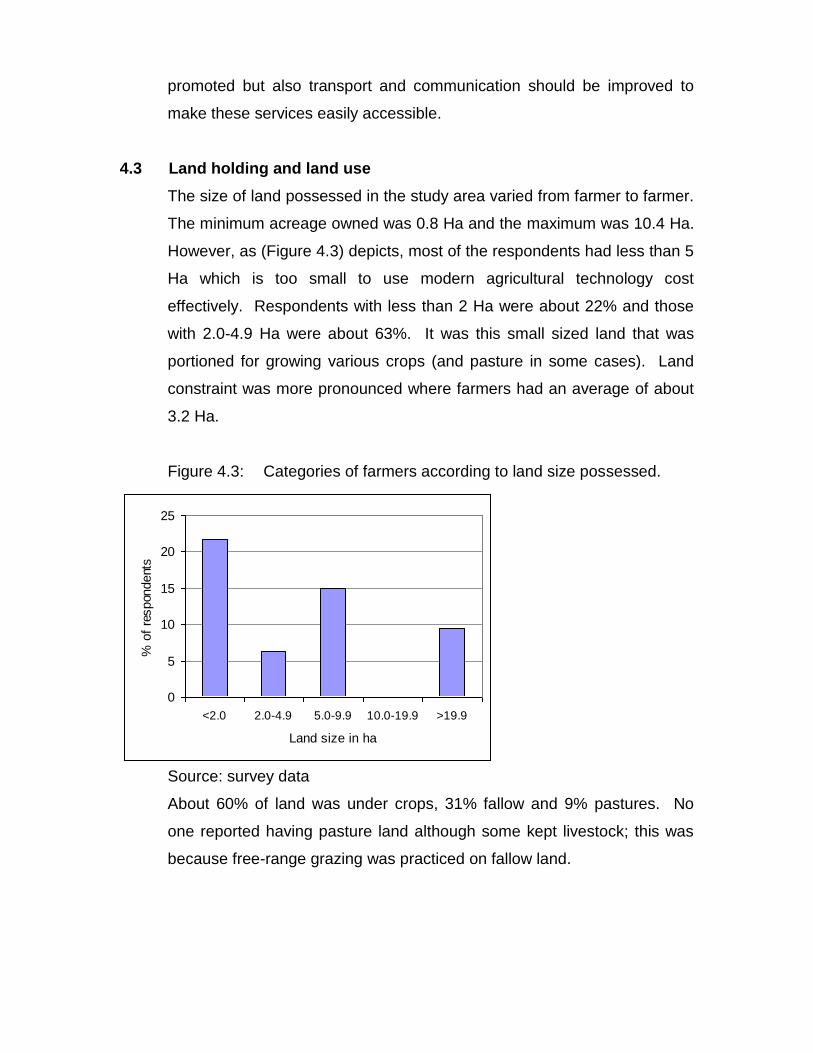
4.3 Land holding and land use
The size of land possessed in the study area varied from farmer to farmer.
The minimum acreage owned was 0.8 Ha and the maximum was 10.4 Ha.
However, as (Figure 4.3) depicts, most of the respondents had less than 5
Ha which is too small to use modern agricultural technology cost
effectively. Respondents with less than 2 Ha were about 22% and those
with 2.0-4.9 Ha were about 63%. It was this small sized land that was
portioned for growing various crops (and pasture in some cases). Land
constraint was more pronounced where farmers had an average of about
3.2 Ha.
Figure 4.3: Categories of farmers according to land size possessed.
0
5
10
15
20
25
<2.0 2.0-4.9 5.0-9.9 10.0-19.9 >19.9
Land size in ha
% o
f re
spon
dent
s
Source: survey data
About 60% of land was under crops, 31% fallow and 9% pastures. No
one reported having pasture land although some kept livestock; this was
because free-range grazing was practiced on fallow land.
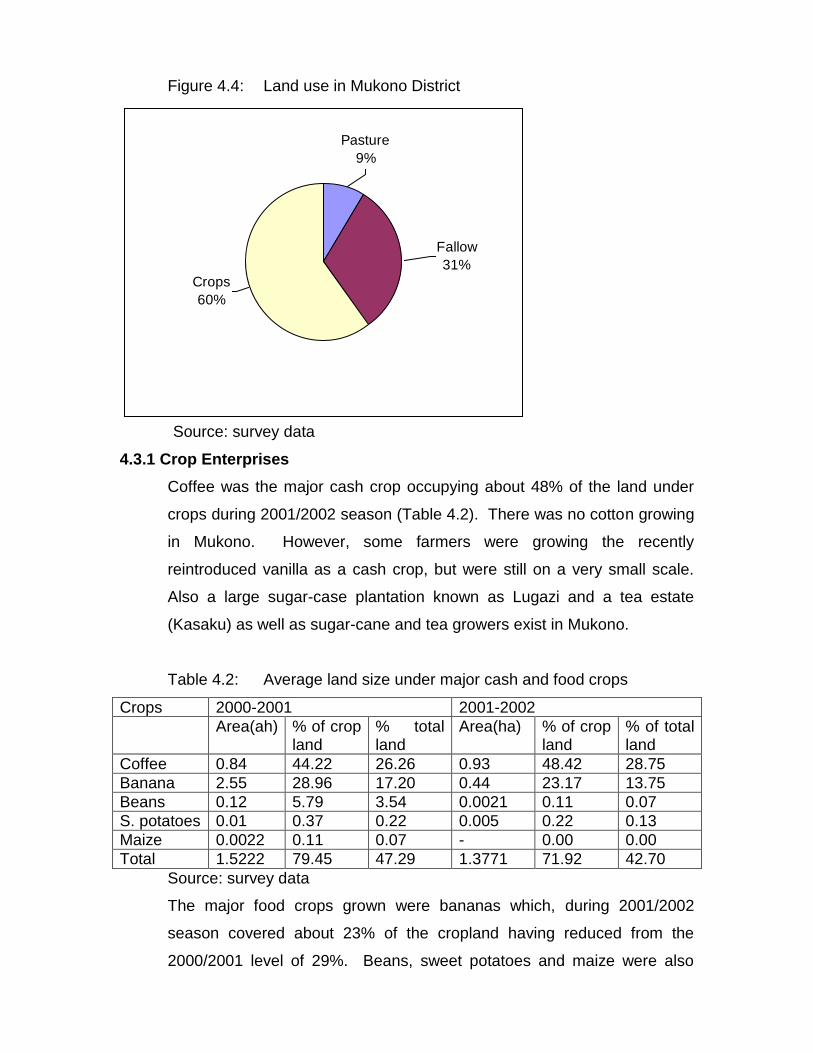
Figure 4.4: Land use in Mukono District
Fallow
31%
Pasture
9%
Crops
60%
Source: survey data
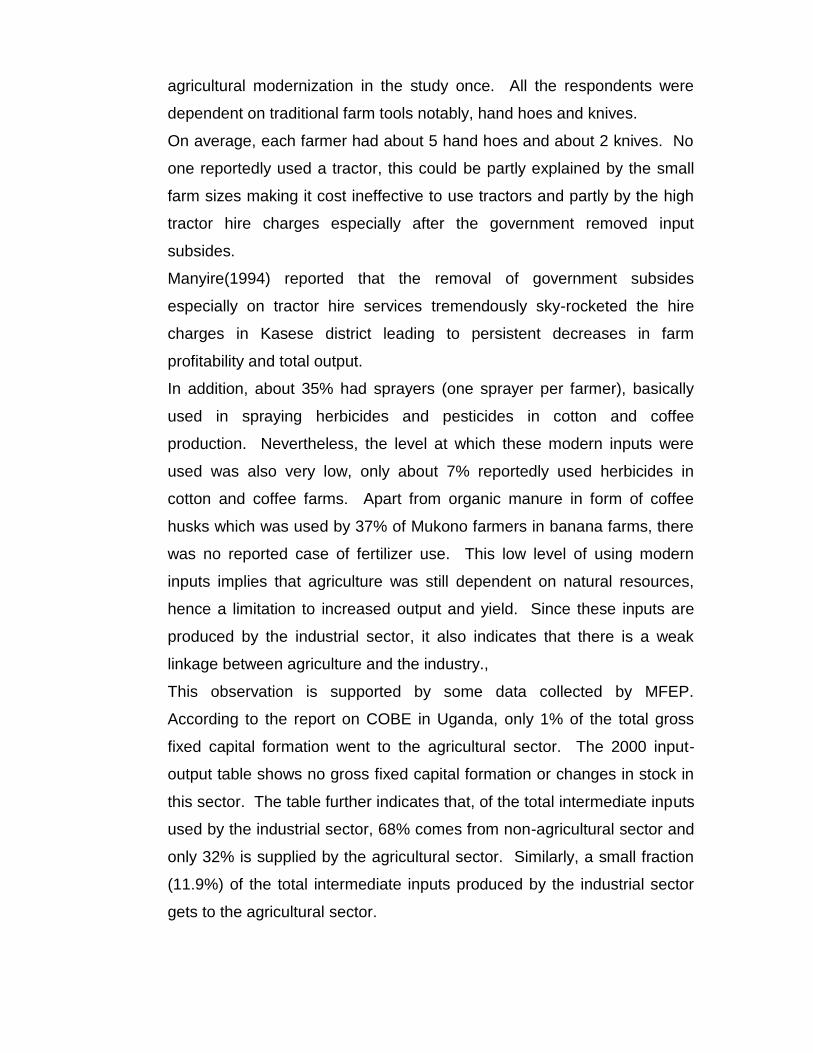
4.3.1 Crop Enterprises
Coffee was the major cash crop occupying about 48% of the land under
crops during 2001/2002 season (Table 4.2). There was no cotton growing
in Mukono. However, some farmers were growing the recently
reintroduced vanilla as a cash crop, but were still on a very small scale.
Also a large sugar-case plantation known as Lugazi and a tea estate
(Kasaku) as well as sugar-cane and tea growers exist in Mukono.
Table 4.2: Average land size under major cash and food crops
Crops 2000-2001 2001-2002
Area(ah) % of crop land
% total land
Area(ha) % of crop land
% of total land
Coffee 0.84 44.22 26.26 0.93 48.42 28.75
Banana 2.55 28.96 17.20 0.44 23.17 13.75
Beans 0.12 5.79 3.54 0.0021 0.11 0.07
S. potatoes 0.01 0.37 0.22 0.005 0.22 0.13
Maize 0.0022 0.11 0.07 - 0.00 0.00
Total 1.5222 79.45 47.29 1.3771 71.92 42.70
Source: survey data
The major food crops grown were bananas which, during 2001/2002
season covered about 23% of the cropland having reduced from the
2000/2001 level of 29%. Beans, sweet potatoes and maize were also

grown but on small fields as shown in (Table 4.2). Other crops grown
were cassava, vegetables, soya beans and fruit trees.
4.4 Livestock farming
Mukono is not a livestock zone in Uganda. Large herds of cattle are kept
in Mbarara and Karamoja districts located in South-Western and North-
Eastern Uganda, respectively. Nevertheless, some farmers in the study
areas kept some cattle, goats, pigs and poultry as shown in (Table 4.3).
However, most of the cattle were improved (cross) breeds, in addition,
milk was also sold at about Ushs.400/= per litre for 20 litres sold per day
by the farmers. The wide range of litres of milk produced in Mukono
(about 24 litres per day).
Table 4.3: Average number of livestock kept per respondent in Mukono
Types of livestock
Number kept Number sold Unit price (Ush)
Cattle 3 1 230,000
Goats 2 1 50,000
Pigs/piglets 2 21 10,000
Poultry 15 5 3000
Source: survey data
Only one per farmer reared a goat, however, farmers kept more pigs
(about 2 per farmer). On average 21 piglets per year were sold at about
10,000/= each (Table 4.3).
Poultry was also kept with about 16 birds per household, in addition to the
revenue farmers earned from sales of live poultry, about 50 eggs were
produced per week per farmer and of these 21 eggs were sold at about
Ushs.80/= each. Livestock is, therefore, a potential income earner which
needs to be exploited through increased use of modern agricultural
techniques.
4.5 Level of agricultural modernization
The level at which sophisticated farm implements as well as modern
variable inputs were used by farmers was used as a proxy for the level of
agricultural modernization in the study once. All the respondents were
dependent on traditional farm tools notably, hand hoes and knives.
On average, each farmer had about 5 hand hoes and about 2 knives. No
one reportedly used a tractor, this could be partly explained by the small
farm sizes making it cost ineffective to use tractors and partly by the high
tractor hire charges especially after the government removed input
subsides.
Manyire(1994) reported that the removal of government subsides
especially on tractor hire services tremendously sky-rocketed the hire
charges in Kasese district leading to persistent decreases in farm
profitability and total output.
In addition, about 35% had sprayers (one sprayer per farmer), basically
used in spraying herbicides and pesticides in cotton and coffee
production. Nevertheless, the level at which these modern inputs were
used was also very low, only about 7% reportedly used herbicides in
cotton and coffee farms. Apart from organic manure in form of coffee
husks which was used by 37% of Mukono farmers in banana farms, there
was no reported case of fertilizer use. This low level of using modern
inputs implies that agriculture was still dependent on natural resources,
hence a limitation to increased output and yield. Since these inputs are
produced by the industrial sector, it also indicates that there is a weak
linkage between agriculture and the industry.,
This observation is supported by some data collected by MFEP.
According to the report on COBE in Uganda, only 1% of the total gross
fixed capital formation went to the agricultural sector. The 2000 input-
output table shows no gross fixed capital formation or changes in stock in
this sector. The table further indicates that, of the total intermediate inputs
used by the industrial sector, 68% comes from non-agricultural sector and
only 32% is supplied by the agricultural sector. Similarly, a small fraction
(11.9%) of the total intermediate inputs produced by the industrial sector
gets to the agricultural sector.
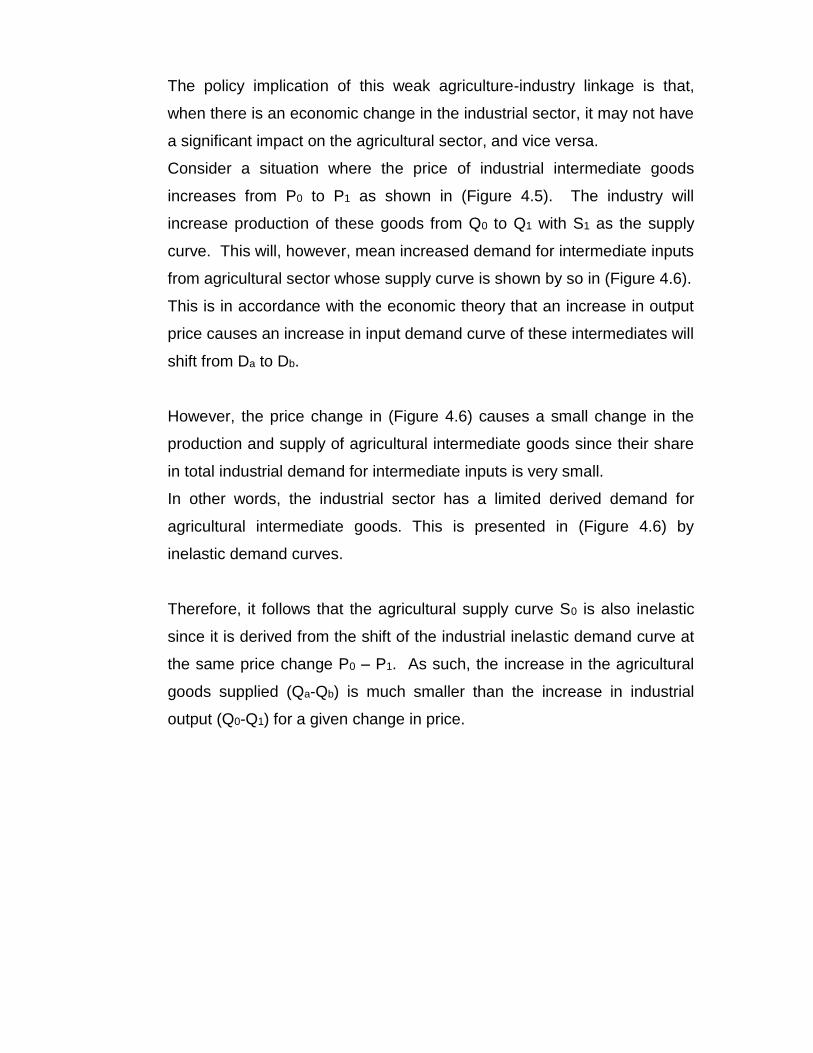
The policy implication of this weak agriculture-industry linkage is that,
when there is an economic change in the industrial sector, it may not have
a significant impact on the agricultural sector, and vice versa.
Consider a situation where the price of industrial intermediate goods
increases from P0 to P1 as shown in (Figure 4.5). The industry will
increase production of these goods from Q0 to Q1 with S1 as the supply
curve. This will, however, mean increased demand for intermediate inputs
from agricultural sector whose supply curve is shown by so in (Figure 4.6).
This is in accordance with the economic theory that an increase in output
price causes an increase in input demand curve of these intermediates will
shift from Da to Db.
However, the price change in (Figure 4.6) causes a small change in the
production and supply of agricultural intermediate goods since their share
in total industrial demand for intermediate inputs is very small.
In other words, the industrial sector has a limited derived demand for
agricultural intermediate goods. This is presented in (Figure 4.6) by
inelastic demand curves.
Therefore, it follows that the agricultural supply curve S0 is also inelastic
since it is derived from the shift of the industrial inelastic demand curve at
the same price change P0 – P1. As such, the increase in the agricultural
goods supplied (Qa-Qb) is much smaller than the increase in industrial
output (Q0-Q1) for a given change in price.

Figure 4.5: Effect of a change in price industrial output on supply of
intermediate goods by the industrial sector.
Price
S1
P1
P0
Qa Qb Quantity
Source: survey data
Figure 4.6: Effect of a change in price industrial output on industrial
demand for inputs of agricultural origin. S0
Price
P1
P0
Db
Da
Qa Qb Quantity
Source: survey data
In a similar way, any policy adopted by the agricultural sector. This study
attempts to prove this hypothesis under various policy options. Regarding
the use of subsidized inputs, no one has access to these inputs.
These were hand hoes produced from co-operative societies at 75% of
the market price.
This implied that one had to be a co-operative member to get the subsidy.
Some chemicals were also obtained from D.A.O and co-operatives at a
subsidy of about 50%. The reason for not using subsidized inputs was
that they were actually not available following the implementation of SAP.
This was reported by the farmers.
The results of this study also indicated that since the implementation of
SAP, the majority (48.7%) of the respondent’s realized farm production
increase although they had no access to input subsidies.
This low response to input subsidies is also attributed to the weak linkages
between agricultural and the industrial sectors explained above.
4.6 Farmers’ perception towards SAP
With an assumption that farmers respond to price signals, they react
according to changes in market conditions. According to economic theory,
they supply more (less) when market conditions become more(less)
favourable.
This means that changes in market conditions also affect the level of farm
production, should the prices rise, more of a given commodity is produced
and vice versa, ceteris paribus.
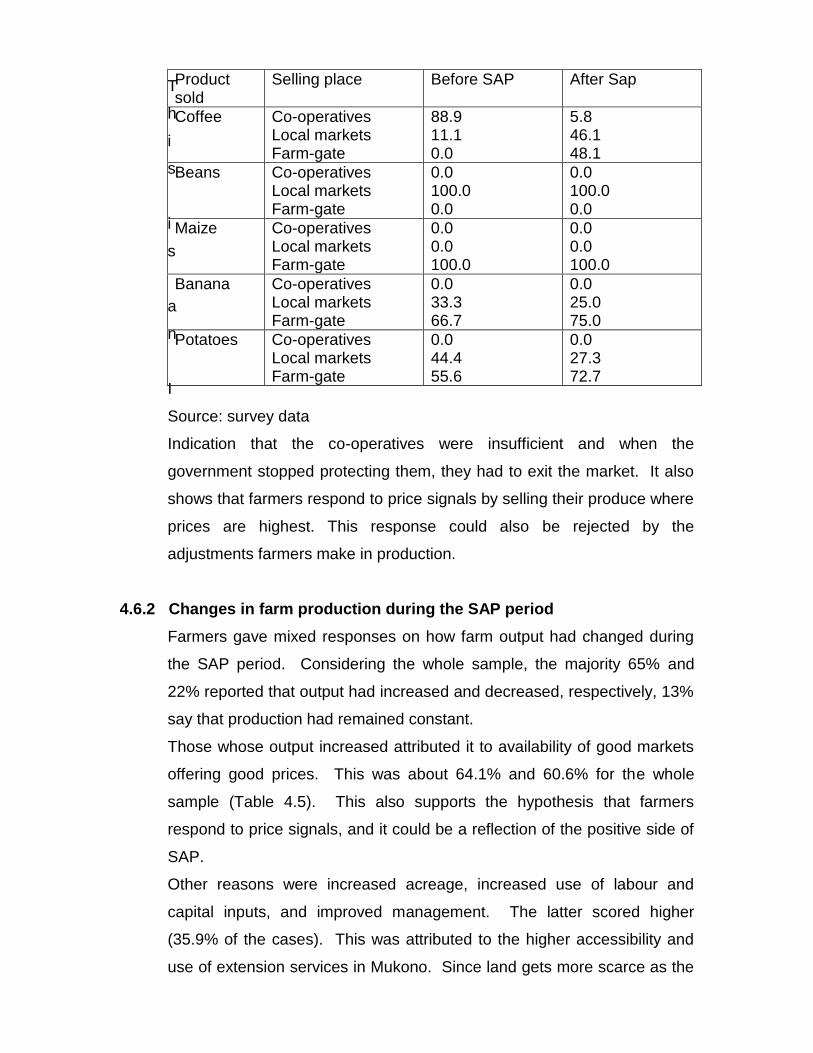
4.6.1 Agricultural markets before and after SAP
Before SAP implementation, most of the farmers’ cash crop products were
handled by co-operatives as marketing agents of the marketing boards. In
Mukono, 88.9% of the respondents used to sell coffee to co-operatives
and 11.1% to individual traders both of whom would deliver the coffee to
CMB. Beans, bananas potatoes and maize were not traded and were
sold at farm-gate or local markets.
Since the liberalization of markets (breaking the monopoly of marketing
boards and removing price controls), private traders entered the market
and farmers gained a wider range of market outlets for their products.

(Table 4.4) shows that the percentage of respondents who sold coffee to
co-operatives had reduced to 58%. The majority sold to private traders at
farm-gate 48.1% and in local markets 46.2%. Beans, bananas, maize and
potatoes were still sold at the farm-gate and or in local markets to private
traders and final consumers.
Considering the overall sample, the largest amount of the farmers produce
was sold to private buyers others at farm-gate as reported by 44.7% of the
respondents, or in local markets by 40.4%. Only 14.9% of the
respondents reportedly sold the largest amount to co-operatives.
The fact that the number of farmers who were selling their produce at
farm-gate had greatly increased during the SAP period is a reflection that
the policies had created a favourable farm market environment such that
farmers had more access to markets than it was before SAP.
This is not only convenient for the farmers in marketing their goods but
also saves them the burden and costs of transporting the goods to the
markets which in some cases are far away from the farms.
The major reasons why farmers had shifted from the old marketing
channel were given.
First, 64% reported that after market liberalization, private buyers
competed favourably by paying them promptly unlike the co-operatives
which used to delay payments.
Second, the private buyers were offering higher prices as reported by
36%.
The third reason forwarded was that the co-operatives had collapsed and
they no longer bought farmers’ produce.
Table 4.4: Percentage of farmers’ responses on marketing before and
after SAP periods.
T
h
i
s
i
s
a
n
I
Source: survey data
Indication that the co-operatives were insufficient and when the
government stopped protecting them, they had to exit the market. It also
shows that farmers respond to price signals by selling their produce where
prices are highest. This response could also be rejected by the
adjustments farmers make in production.
4.6.2 Changes in farm production during the SAP period
Farmers gave mixed responses on how farm output had changed during
the SAP period. Considering the whole sample, the majority 65% and
22% reported that output had increased and decreased, respectively, 13%
say that production had remained constant.
Those whose output increased attributed it to availability of good markets
offering good prices. This was about 64.1% and 60.6% for the whole
sample (Table 4.5). This also supports the hypothesis that farmers
respond to price signals, and it could be a reflection of the positive side of
SAP.
Other reasons were increased acreage, increased use of labour and
capital inputs, and improved management. The latter scored higher
(35.9% of the cases). This was attributed to the higher accessibility and
use of extension services in Mukono. Since land gets more scarce as the
Product sold
Selling place Before SAP After Sap
Coffee Co-operatives Local markets Farm-gate
88.9 11.1 0.0
5.8 46.1 48.1
Beans Co-operatives Local markets Farm-gate
0.0 100.0 0.0
0.0 100.0 0.0
Maize Co-operatives Local markets Farm-gate
0.0 0.0 100.0
0.0 0.0 100.0
Banana Co-operatives Local markets Farm-gate
0.0 33.3 66.7
0.0 25.0 75.0
Potatoes Co-operatives Local markets Farm-gate
0.0 44.4 55.6
0.0 27.3 72.7
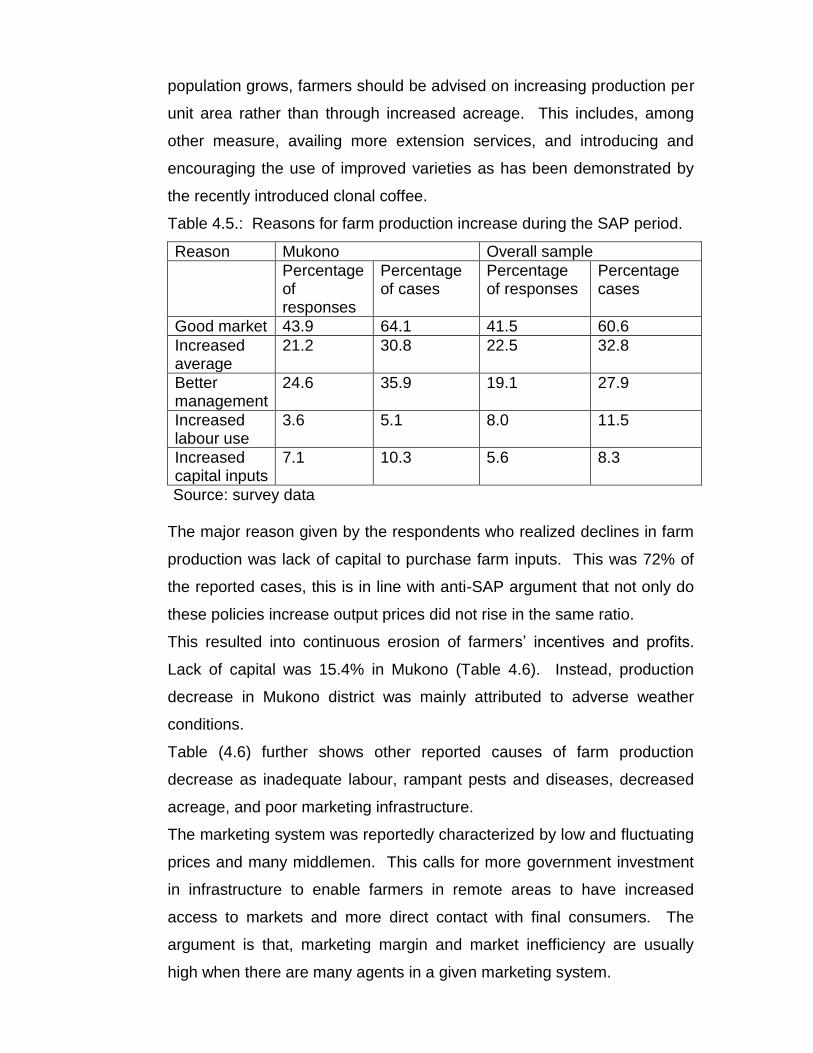
population grows, farmers should be advised on increasing production per
unit area rather than through increased acreage. This includes, among
other measure, availing more extension services, and introducing and
encouraging the use of improved varieties as has been demonstrated by
the recently introduced clonal coffee.
Table 4.5.: Reasons for farm production increase during the SAP period.
Reason Mukono Overall sample
Percentage of responses
Percentage of cases
Percentage of responses
Percentage cases
Good market 43.9 64.1 41.5 60.6
Increased average
21.2 30.8 22.5 32.8
Better management
24.6 35.9 19.1 27.9
Increased labour use
3.6 5.1 8.0 11.5
Increased capital inputs
7.1 10.3 5.6 8.3
Source: survey data
The major reason given by the respondents who realized declines in farm
production was lack of capital to purchase farm inputs. This was 72% of
the reported cases, this is in line with anti-SAP argument that not only do
these policies increase output prices did not rise in the same ratio.
This resulted into continuous erosion of farmers’ incentives and profits.
Lack of capital was 15.4% in Mukono (Table 4.6). Instead, production
decrease in Mukono district was mainly attributed to adverse weather
conditions.
Table (4.6) further shows other reported causes of farm production
decrease as inadequate labour, rampant pests and diseases, decreased
acreage, and poor marketing infrastructure.
The marketing system was reportedly characterized by low and fluctuating
prices and many middlemen. This calls for more government investment
in infrastructure to enable farmers in remote areas to have increased
access to markets and more direct contact with final consumers. The
argument is that, marketing margin and market inefficiency are usually
high when there are many agents in a given marketing system.
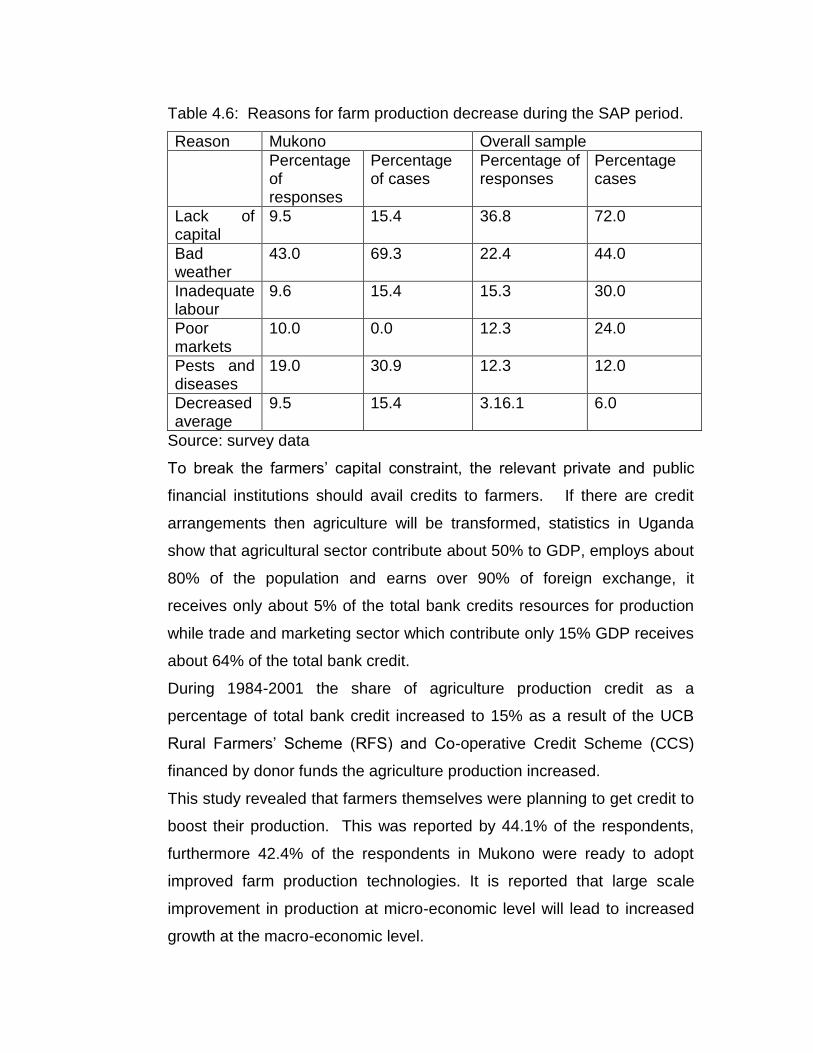
Table 4.6: Reasons for farm production decrease during the SAP period.
Reason Mukono Overall sample
Percentage of responses
Percentage of cases
Percentage of responses
Percentage cases
Lack of capital
9.5 15.4 36.8 72.0
Bad weather
43.0 69.3 22.4 44.0
Inadequate labour
9.6 15.4 15.3 30.0
Poor markets
10.0 0.0 12.3 24.0
Pests and diseases
19.0 30.9 12.3 12.0
Decreased average
9.5 15.4 3.16.1 6.0
Source: survey data
To break the farmers’ capital constraint, the relevant private and public
financial institutions should avail credits to farmers. If there are credit
arrangements then agriculture will be transformed, statistics in Uganda
show that agricultural sector contribute about 50% to GDP, employs about
80% of the population and earns over 90% of foreign exchange, it
receives only about 5% of the total bank credits resources for production
while trade and marketing sector which contribute only 15% GDP receives
about 64% of the total bank credit.
During 1984-2001 the share of agriculture production credit as a
percentage of total bank credit increased to 15% as a result of the UCB
Rural Farmers’ Scheme (RFS) and Co-operative Credit Scheme (CCS)
financed by donor funds the agriculture production increased.
This study revealed that farmers themselves were planning to get credit to
boost their production. This was reported by 44.1% of the respondents,
furthermore 42.4% of the respondents in Mukono were ready to adopt
improved farm production technologies. It is reported that large scale
improvement in production at micro-economic level will lead to increased
growth at the macro-economic level.
CHAPTER 5
CONCLUSION AND RECOMENDATIONS
5.1 Conclusions
To rehabilitate the shattered economy as a result of poor internal policies,
political instability and external markets and shocks of the 1970s and early
1980s, the Uganda government programme in 1987 under which the price
controls and the monopoly of marketing boards were removed to stimulate
production and exports. The government reduced its control on external
trade and trade liberalization policies were partially implemented by
eliminating export duties. The aim was to bring domestic prices closer to
international prices.
The agricultural sector is the backbone of the Ugandan economy so that
the current and future development of the country will have to arise from
the sector. Owing to its size and importance in economic development,
this study attempted to study the impact of SAP on agriculture.
Furthermore, the study attempted to assess the efforts that have been
under way since the adoption of structural adjustment programmes in
addressing the problems arising from the liberalization policy on
agriculture.
It should be noted here also that since Uganda is an agrarian-economy in
the sense that agriculture alone contributes to over 42% percent of the
national income, employees over 80% percent of the active labour force,
contributes to more than 80% percent of the foreign exchange earnings
and form a backbone for much of manufacturing sector, it becomes very
difficult to draw a boundary for the liberalization policies and macro-
economic policies. It is therefore the objective of this study to determine
the effects of SAP on output, household income and government budget.
A time frame is considered to determine the pace at which liberalization
policies should be implemented. The study also analysed the vulnerability
of the liberalized economy in case of unfavourable changes in external
market conditions. Besides, farmers’ socio-economic characteristics and

their perception towards SAP examined under the hypothesis that farmers
respond to price changes by adjusting their output. It is also hypothesized
that trade liberalization leads to increased output, exports, household
income and consumption and makes the economy less prone to external
economic shocks.
5.2 Policy recommendations
Given the fact that farmers respond to changes in market conditions,
appropriate policy measures should be undertaken to increase the flow of
benefits that accrue from adjustment policies to the farming community. If
such measures are not in place, efforts of carrying out structural
adjustment will be rendered fruitless.
As evident from the results, some of the programmes in the SAP have
generally had a positive impact on the economy. In the case of agriculture
liberalization policies have greatly improved exchange rate over valuation.
This has completely reversed the implicit tax on agricultural exports.
There are still problems with the marketing especially because of
problems of poor infrastructure which requires some time to completely
change. For example, it will require some time before all roads could be
upgraded to ease the transportation of agricultural products. In addition,
this too would require complete rehabilitation of the transport sector which
could not be done over-night.
There is a need to look into measures of controlling the minimum prices
for the products, otherwise, produce buyers would exploit the farmers.
Whereas a free market system is the best, it takes sometime to develop
it. Before then, government should some how direct activities to protect
the farmers who would be vulnerable to unscrupulous businessmen.
The effort at diversifying the agricultural export sector should be supported
not to leave coffee and cotton as the major crops. In fact, cotton is no
longer an important export crop. Fortunately, this policy has already been
started on. It is envisaged that with a wider range of tax from, it could be
balanced thereby lessening the burden on coffee and cotton growers.
5.3 Recommendations for further research
Due to some limitations, this study could not address all the important
issues pertaining to agriculture in Uganda especially Mukono. Such a
study should not consider a favourable technical change, it should also
look at the adverse part of it such as unfavourable weather drought, since
Ugandan agriculture is nature-dependent.
Another area of economic interest is extending the study to address
environmental issues, such a study should focus on the impact of SAP on
key environmental variables and the resultant impact on agriculture in
particular.
REFERENCES Abidi, H. Syeda. (1990), Uganda Women in Development, African
Development, Series No.2, Foundation for African Development.
Bibangambah, J. R. (1994), The Impact of Structural Adjustment on
Agricultural producers in Uganda. In: MUNENE J. C. (Ed),
Empowerment, Poverty and Structural Adjustment in Uganda,
Friedrich Ebert Foundation, PP. 5-19.
Dong Lual, Kastner Markus, Young Crawford (1991), Democratisation
and Structural Adjustment in Africa in the 1990s, African Studies
Program, University of Wisconsin – Madison.
Green Duncan (2003), Structural Adjustment Programmes, Cafod
www.cafod.org/saps.htm
Husain, I. (1994), Adjustment in Africa; Lessons from country case
studies. In: KAPOOR, K. (Ed), Africa’s Experience with Structural
Adjustment Proceedings of the Harare Seminar, World Bank, PP. 28-40.
Ilrig, January / February (1996), Structural Adjustment and its Effects
on Women, Workers’ World News.
Jaeger, William. (1981), The Impact of Policy in African Agriculture: An
Empirical Investigation, World Bank Working Paper.
Kabuga, Charles. October (2001), The Impact of Structural Adjustment
Programmes on the Agricultural Sector and Rural Livelihoods in Africa,
IFAP.
Krueger, Anne. (1989); Agricultural Incentives in Developing
Countries; Measuring the Effect of Sectoral and Economy-Wide Policies,
World Bank Economic Review,VOL 2,No; PP. 255-271
Manyire, H. (1994), The Impact of Structural Adjustment on
agricultural producers in Uganda. In: MUNENE, J. C. (Ed),
Empowerment, Poverty and Structural Adjustment in Uganda,
Friedrich Ebert Foundation, PP.41-61.
Okwi O. Paul, Matovu Fred, Mpuga (2000), A hand-book of
Development Economics.

Reed, David. (1992), Structural Adjustment, The Environment and
Sustainable Development, Earth Scan.
Rural Life and Agriculture Tour, Zambia (2002), Just Business,
www.justbusiness.org/saps.htm
Todaro, P. Michael. (1985), Economic Development in the Third World,
Third Edition, New York, Longman.
Tsikata, Dzodzi. (2002), Effects of Structural Adjustment on Women
and the Poor, www.twnside.org.sg/south/women.htm
_______, December (1992), The journal of the Uganda Society, Vol. 42,
New Vision Printing & Publishing Corporation

Appendix QUESTIONNAIRE
Introduction This questionnaire is designed to establish the effects of SAP on Agriculture in
Uganda in Mukono. This information is for educational purposes and not for any
other use. Your responses will be strictly confidential and will be analyzed along
with information from other respondents.
Section 1: Socio-Demographic information
1. Sex a) Male
b) Female
2. I) Age a) Below 18 years
b) Between 18 – 30 years
c) Above 30 years
ii) Age of household members a) Below 12 years
and size b) Between 12 – 18 years
c) Above 18 years
3. Marital Status a) Married
b) Separated
c) Single
d) Widowed
e) None of the above
4. Educational background a) Primary
b) Secondary
c) Tertiary
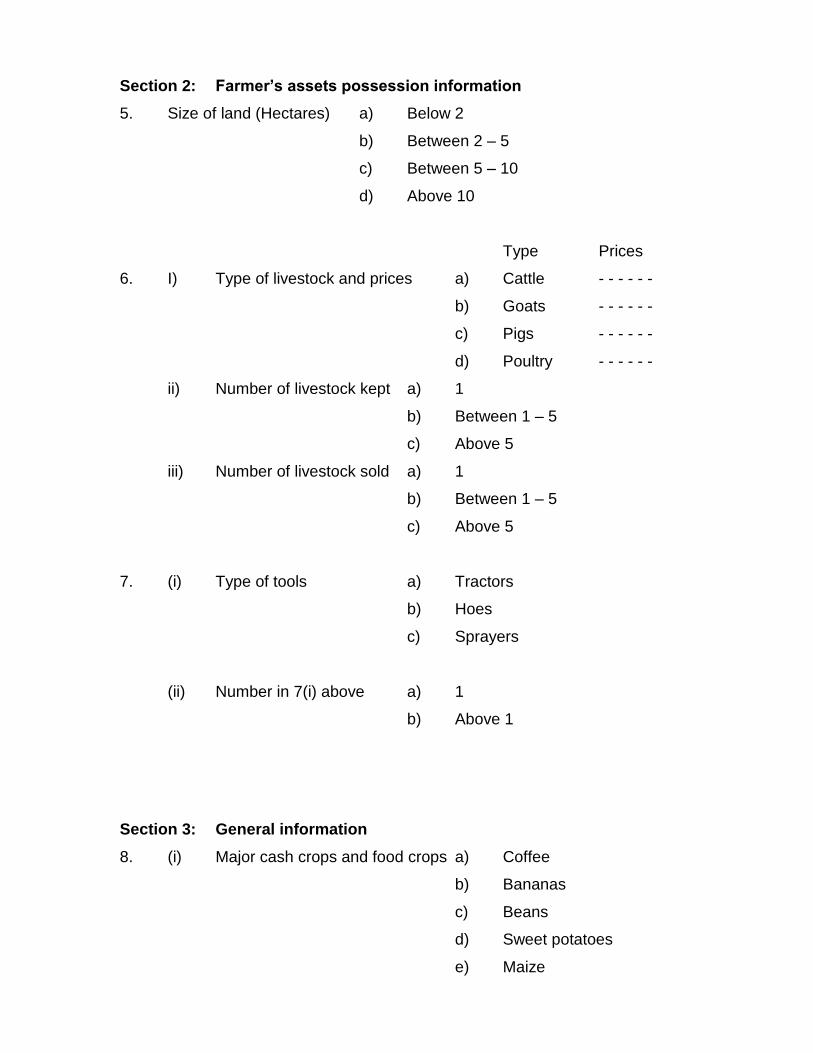
Section 2: Farmer’s assets possession information
5. Size of land (Hectares) a) Below 2
b) Between 2 – 5
c) Between 5 – 10
d) Above 10
Type Prices
6. I) Type of livestock and prices a) Cattle - - - - - -
b) Goats - - - - - -
c) Pigs - - - - - -
d) Poultry - - - - - -
ii) Number of livestock kept a) 1
b) Between 1 – 5
c) Above 5
iii) Number of livestock sold a) 1
b) Between 1 – 5
c) Above 5
7. (i) Type of tools a) Tractors
b) Hoes
c) Sprayers
(ii) Number in 7(i) above a) 1
b) Above 1
Section 3: General information
8. (i) Major cash crops and food crops a) Coffee
b) Bananas
c) Beans
d) Sweet potatoes
e) Maize
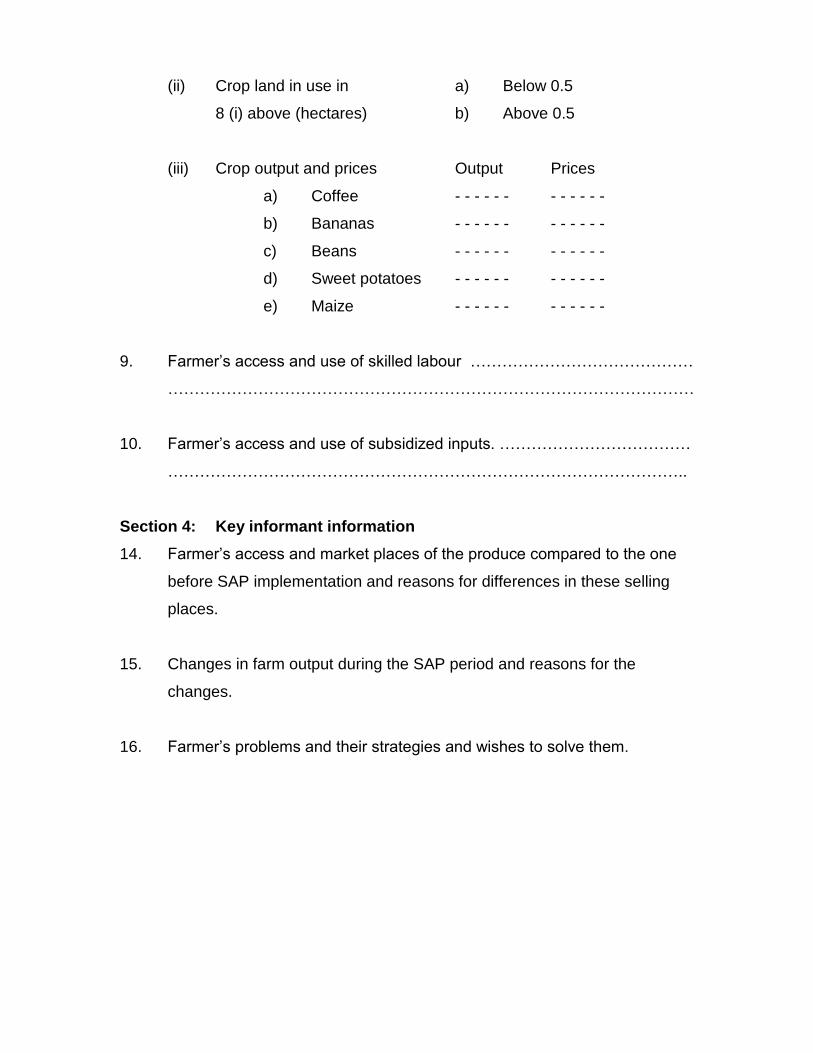
(ii) Crop land in use in a) Below 0.5
8 (i) above (hectares) b) Above 0.5
(iii) Crop output and prices Output Prices
a) Coffee - - - - - - - - - - - -
b) Bananas - - - - - - - - - - - -
c) Beans - - - - - - - - - - - -
d) Sweet potatoes - - - - - - - - - - - -
e) Maize - - - - - - - - - - - -
9. Farmer’s access and use of skilled labour ……………………………………
………………………………………………………………………………………
10. Farmer’s access and use of subsidized inputs. ………………………………
……………………………………………………………………………………..
Section 4: Key informant information
14. Farmer’s access and market places of the produce compared to the one
before SAP implementation and reasons for differences in these selling
places.
15. Changes in farm output during the SAP period and reasons for the
changes.
16. Farmer’s problems and their strategies and wishes to solve them.