Effects of road traffic scenarios on human exposure to …€¦ · J. H. Amorim, A. I. Miranda, ......
12
Effects of road traffic scenarios on human exposure to air pollution C. Borrego, A. M. Costa, R. Tavares, M. Lopes, J. Valente, J. H. Amorim, A. I. Miranda, I. Ribeiro & E. Sá CESAM, Department of Environment and Planning, University of Aveiro, Portugal Abstract Human exposure to air pollution has been identified as a major problem due to its known impact on human health. Particulate matter is a pollutant which rises special concern due to the adverse health effects on sensitive groups of the population, such as asthmatic children. This study is part of the SaudAr research project which main objective was to assess the air quality effects on the health of a population group risk (asthmatic school children) living in an urban area (Viseu). The aim of this paper is to investigate the influence of road traffic emissions on air quality and consequently, on human exposure. For this purpose, the CFD model VADIS integrating an exposure module has been applied over the town of Viseu, for the periods of one week in winter and one week in summer, to four different situations: the reference year (2006) and three future scenarios for the year 2030, BAU, Green and Grey scenario. The differences among the scenarios include changes on the existing land use, the vehicle fleet composition, the mobility, the vehicle technologies and the fuel types. Field campaigns were performed in order to obtain information about vehicle fleet in the town of Viseu and mobility patterns. The quantification of road traffic emissions and the hourly traffic emissions patterns for all scenarios was carried out by the application of the TREM model. The results reveal an increase in PM 10 emissions, concentrations and exposure in all future scenarios, particularly in winter with an increase around 80% in the BAU and Grey scenarios and only 34% in the Green scenario. Keywords: traffic emissions, air quality modelling, human exposure, development scenarios. Air Pollution XVII 89 www.witpress.com, ISSN 1743-3541 (on-line) © 2009 WIT Press WIT Transactions on Ecology and the Environment, Vol 123, doi:10.2495/AIR090081
Transcript of Effects of road traffic scenarios on human exposure to …€¦ · J. H. Amorim, A. I. Miranda, ......

Effects of road traffic scenarios on human exposure to air pollution
C. Borrego, A. M. Costa, R. Tavares, M. Lopes, J. Valente, J. H. Amorim, A. I. Miranda, I. Ribeiro & E. Sá CESAM, Department of Environment and Planning, University of Aveiro, Portugal
Abstract
Human exposure to air pollution has been identified as a major problem due to its known impact on human health. Particulate matter is a pollutant which rises special concern due to the adverse health effects on sensitive groups of the population, such as asthmatic children. This study is part of the SaudAr research project which main objective was to assess the air quality effects on the health of a population group risk (asthmatic school children) living in an urban area (Viseu). The aim of this paper is to investigate the influence of road traffic emissions on air quality and consequently, on human exposure. For this purpose, the CFD model VADIS integrating an exposure module has been applied over the town of Viseu, for the periods of one week in winter and one week in summer, to four different situations: the reference year (2006) and three future scenarios for the year 2030, BAU, Green and Grey scenario. The differences among the scenarios include changes on the existing land use, the vehicle fleet composition, the mobility, the vehicle technologies and the fuel types. Field campaigns were performed in order to obtain information about vehicle fleet in the town of Viseu and mobility patterns. The quantification of road traffic emissions and the hourly traffic emissions patterns for all scenarios was carried out by the application of the TREM model. The results reveal an increase in PM10 emissions, concentrations and exposure in all future scenarios, particularly in winter with an increase around 80% in the BAU and Grey scenarios and only 34% in the Green scenario. Keywords: traffic emissions, air quality modelling, human exposure, development scenarios.
Air Pollution XVII 89
www.witpress.com, ISSN 1743-3541 (on-line)
© 2009 WIT PressWIT Transactions on Ecology and the Environment, Vol 123,
doi:10.2495/AIR090081
1 Introduction
Despite the fact that in some European urban areas the atmospheric emissions resulting from industry, power production and households contribute substantially to air pollution, the dominant source is the continuing growth in road transport [1]. According to statistics compiled by the European Environment Agency [2], a significant proportion of Europe's urban population still lives in cities where EU air quality limits for the protection of human health are regularly exceeded, stressing the importance of air pollution as one of the major environment-related health threats in Europe. The impacts of air pollution on human health can be expressed in terms of a reduction in average life expectancy and increased premature deaths, hospital admissions, use of medication and days of restricted activity. Especially the air pollution caused by fine particles represents the highest risk to public health in Europe [1]. On the basis of the emissions in 2000, the EU's CAFE programme estimated a total of 348 000 premature deaths per year due to exposure to anthropogenic PM2.5 [3]. In agreement, data from the World Health Organization [4] show that, as a result of human exposure to particulate matter, approximately three million deaths occur globally per year. In particular the traffic-related air pollution was estimated in 2001 to account, each year, for more than 25 000 new cases of chronic bronchitis in adults, more than 290 000 episodes of bronchitis in children, more than 0.5 million asthma attacks, and more than 16 million person-days of restricted activity [5]. Several studies in adults and children have shown that asthma, among other respiratory health problems, and cardiovascular diseases are aggravated by the exposure to traffic-emitted pollution in urban areas [4, 6–8]. The large fraction of European citizens living in urban areas (about 80%), the continuous growth of road transport, the significant number of air pollutants emitted by road traffic and the close proximity between the emission source and the human receptors are responsible for the contribution of urban air pollution to various health problems and a decreased quality of life. In this context, traffic emission scenarios are privileged tools for evaluating the contribution of road transport to future atmospheric emissions [9–12], while air quality modelling is a useful tool for population exposure studies, especially when exposure monitoring is not applicable and/or air quality monitoring data are not representative for the area of interest [13]. The research on the relations among air pollution, human exposure and road transport, is important in the support to sustainable transport policies, emission control measures, traffic management and urban planning. Therefore, the aim of this study is the assessment of the effects of current and future road traffic emissions on the human exposure to urban air pollution. A number of development scenarios were defined by projecting the expected changes for the year of 2030 in terms of land use, vehicle fleet composition, mobility, and vehicle technologies, in a town in mainland of Portugal characterised by a significant population growth and an expecting economic development.
90 Air Pollution XVII
www.witpress.com, ISSN 1743-3541 (on-line)
© 2009 WIT PressWIT Transactions on Ecology and the Environment, Vol 123,

2 Study approach overview
This study is part of a large project involving researchers from environmental and medical sciences – the “The Health and the Air we breath” (SaudAr) Project [14] – which main objective was to contribute for the sustainable development of a region by preventing air pollution problems and health related diseases in the future due to expected economical growth. The project wide methodological approach is presented in Figure 1. A detailed description of the project is made by Borrego et al. [14].
Case Study selection
Current situation characterization
• Air quali ty
• Indoor environmen t • Health
• Meteorology • Emissions • Relat ion Health/Pollution
I. Scenarios Development
IndicatorsStrategic Development
Plans
II. Expected development
• Numeric model ing of air quality • Health Ev olution
• Pollu tion /Health Relation
I. development of an education and
information programme
II. Technological transference
•Seminaries • School lectures
• Web Page • School field trips
• Meetings with local authorit ies • Informative b rochures
• Workshops • Imp lementation of techno logy
• Experimental campaigns
• Air quality modeling
Prevention and mit igation
measures
Figure 1: Global scheme of the SaudAr project.
This paper explores the impact on emissions, air quality and individual exposure of different development scenarios for the year 2030. The study analyse the effects related to different mobility patterns connected to three different development scenarios by comparison with the current situation (reference scenario). The BAU (Business As Usual) scenario keeps the trends in land use and emissions patterns of the last decades. Hence the total emission amount will
Air Pollution XVII 91
www.witpress.com, ISSN 1743-3541 (on-line)
© 2009 WIT PressWIT Transactions on Ecology and the Environment, Vol 123,

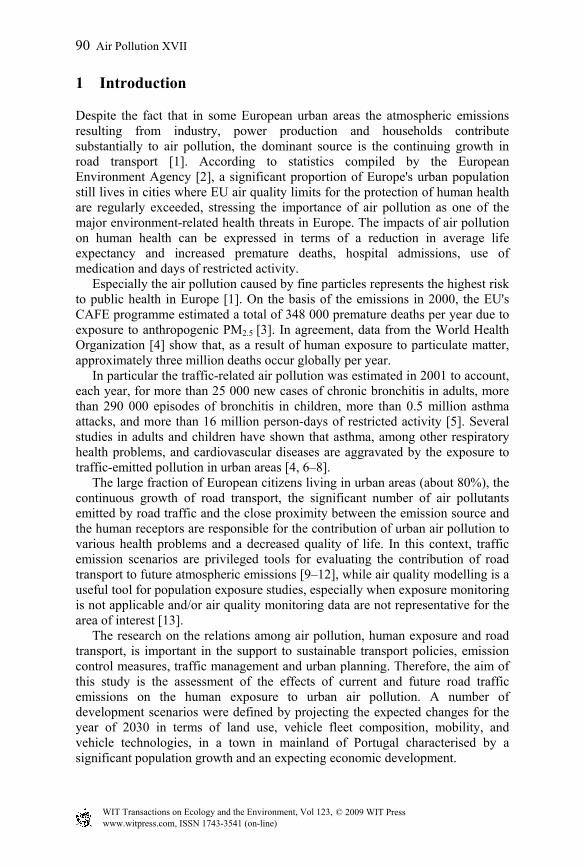
increase in accordance only to the increase of the total population projected to the year 2030. The other two scenarios, named Green and Grey, try to reflect different options on future development as described forward. The Green scenario considers a change on land use pattern based on a compact dense occupation in the city centre that is consolidated and rehabilitated. The use of “soft” modes of transport (walking and cycling) becomes an option. More efficient and cleaner public transportation modes are also considered; thus a decreased use of the private cars is expected. The mileage per capita is also decreased due to the compact land use. Like the Green scenario, the Grey scenario considers a change on land use pattern, which is however based on a more dispersed land use. The city centre is now consolidated, but the new areas of expansion are further away from the centre, have lower densities and are more sprawl with several small household’s cores. This means that a higher number of daily trips contribute to an increase of mileage per capita. With a slightly smaller population on the central villages, the implementation of more efficient public transport systems is not so feasible. The “soft” modes, walking and cycling are not also attractive in this kind of land use. Private cars are then the best economical solution for most population displacements, which increased traffic related emissions. For this work, a town in the central part of Portugal – Viseu - was chosen taking into account its current characteristics in terms of air pollution and urban development. A group of seven children with asthma problems attending the same classroom of the Marzovelos elementary school were selected as study case. These children live, study and have their activities within the selected study domain located in the centre of Viseu (Figure 2). The houses where the selected children live are located in the same figure and are identified by the numbers 1 to 7. The individual exposure to PM10 for the seven children was estimated for the winter and summer periods of the experimental campaigns conducted under the SaudAr project, at 20-27 January 2006 and 19-26 June 2006, and for the three defined scenarios. The individual exposure was estimated using the microenvironment approach [16] which is based on: a) the definition of the daily activity profile of each child for a typical winter and summer school week, allowing the identification of the microenvironments frequented by those children and the time spent in each one; and b) the characterisation of the air quality in those microenvironments. To estimate the air quality in each microenvironment, as a complement to the experimental campaigns measurements, a cascade of air quality numerical models was applied. The results of a mesoscale model simulation over a large domain were used as initial and boundary condition to the local scale CFD model simulation. The CFD model had as input the road traffic emission estimated for each scenario as presented in §3. The ambient air pollutants concentration calculated with the CFD model were the basis to estimate the indoor concentrations in the different microenvironments using indoor/outdoor relations [16].
92 Air Pollution XVII
www.witpress.com, ISSN 1743-3541 (on-line)
© 2009 WIT PressWIT Transactions on Ecology and the Environment, Vol 123,
Marzovelos School
3
55
6
74
ASAC
CarrilhoPeniche
Infante
Morago
Filipe
Circunvalação
InfantariaMcDonald
25 de Abril
2
1
Figure 2: Selected study domain located in the Viseu town centre.
3 Road traffic scenarios
In order to evaluate the effects related to different mobility patterns, three different road traffic emission trends were developed and applied to the study domain (Figure 2), based on currently adopted measures and feasible emissions reduction perspectives. The scenarios were achieved by changing the land use, vehicle fleet composition, mobility patterns and vehicle technologies from the reference situation.
3.1 Scenarios development
The BAU scenario keeps all current trends in vehicle fleet and mobility patterns observed during the experimental campaigns. Vehicle fleet composition trends are based on current and evolution perspectives of Portuguese population and vehicle fleet [17]. This scenario corresponds to a ‘does nothing’ approach, where the penetration rate of new technologies is in line with the past trends of vehicle turnover. The Green and Grey scenarios try to show different options on future development. The main change in these scenarios is the introduction of more efficient and cleaner technologies, representing a fast technology renewal, that supposes a complete turnover of the older vehicles replaced by EURO V and EURO VI in
Air Pollution XVII 93
www.witpress.com, ISSN 1743-3541 (on-line)
© 2009 WIT PressWIT Transactions on Ecology and the Environment, Vol 123,

2030. The principal difference between Green and Grey scenarios is the vehicle fleet composition and mobility patterns. Such difference results from the land use considered in each scenario. Grey scenario mobility patterns and fast fleet renewal may result in a decrease of the life time average of vehicle fleet. A slight decrease on public transportation modes and an increase of private vehicles will be the best economical solution for most population displacements.
3.2 Road traffic emission quantification
The quantification of road traffic emissions was performed by the application of the Transport Emission Model for Line Sources (TREM). The TREM model [18] is based on the average speed approach and it applies the emission functions derived from MEET/COST methodology. Different technologies (engine type, model year) and engine capacity are distinguished in TREM to derive emission factors. Furthermore, TREM allows the estimation of several pollutants, including PM10. Recently, the model has been updated based on the EMEP/CORINAIR emission function methodologies [19] to include new vehicle technologies (EURO IV, V and VI) and fuel types (liquefied natural gas, compressed natural gas, hybrids and biodiesel). For road traffic emissions, this study includes passenger cars (PC), light and heavy duty vehicles (LDV and HDV), heavy duty passenger vehicles (HDPV), mopeds (MP) and motorcycles (MC) parameters. Assuming that the fleet renewal rate in the future will be, at least, similar to the one observed in the recent past and present [17], by 2030 almost all of the existing vehicles will have been replaced by new ones, fulfilling, at least, the EURO V measures. To predict the vehicle fleet in 2030, up to date information for fleet composition and population were used [17]. The BAU and Green scenarios maintain current vehicle fleet composition and an increase of 8.7% for the total number of vehicles; whereas the Grey comprises an increase of PC and an increase of 10% for the total number of vehicles. During the experimental campaigns, vehicle fleet and composition data were collected to characterize road traffic hourly profiles in the study domain. Hourly traffic PM10 emissions profiles were estimated using the TREM model for typical winter and summer days, according to the scenarios. In order to evaluate the variation of PM10 traffic emissions along the winter and summer periods, total emissions have been estimated for the future scenarios. Table 1 resumes the variation of vehicle fleet and total PM10 emissions estimated by TREM for the baseline (reference) and future (BAU, Green and Grey) scenarios. It is possible to verify that the total number of on-road vehicles during the summer period is significantly higher (+75%) than during the winter period. This results in a significant difference in the PM10 emissions estimated by TREM. When compared to the reference scenario values, BAU scenario is characterized as the highest PM10 emission values (+24%), followed by the Grey (+10%) and the Green (+9%) scenarios. The slight difference between Green and Grey scenarios results from the differences in the vehicle number and fleet composition as a consequence of the land use change.
94 Air Pollution XVII
www.witpress.com, ISSN 1743-3541 (on-line)
© 2009 WIT PressWIT Transactions on Ecology and the Environment, Vol 123,

Table 1: Total PM10 emissions [g.km-1] and total number of vehicles considered in the local scale study domain, for the winter and summer periods.
Reference BAU Green Grey
PM10[g.km-1]
Vehicles PM10[g.km-1]
Vehicles PM10[g.km-1]
Vehicles PM10[g.km-1]
Vehicles
Winter 1820 20092 2266 20611 1985 20611 2024 22728
Summer 3197 35286 3980 36199 3486 36199 3555 39916
Averaged 2508 27689 3123 28405 2735 28405 2790 31322
4 Local scale simulations
The road traffic emissions estimated for the reference and for the future scenarios were used as input data to model the PM10 concentrations over the town of Viseu. In this sense, the modelled air quality data allowed the assessment of the short-term individual exposure to PM10 for the group of selected children.
4.1 Air quality results
The local scale model VADIS was applied to evaluate the PM10 air pollutant concentrations within the urban area of Viseu. VADIS is a CFD model [20] that allows the assessment of short-term local concentrations in urban geometries due to road traffic emissions. Its structure is based on two modules: FLOW and DISPER. The first module, FLOW, is a Reynolds Averaged Navier-Stokes (RANS) prognostic model with a standard k-ε turbulence closure that calculates the wind components, the turbulent viscosity, the pressure, the turbulent kinetic energy and the temperature 3D fields through the finite volume method. The second module, DISPER, applies the Lagrangian approach to the computation of the 3D concentration field of inert pollutants using the wind field estimated by FLOW. The model has been validated with wind tunnel measurements and with data from real case applications, demonstrating a good performance in the calculation of flow and pollutants dispersion around obstacles under variable wind conditions [20]. The study area covers 1300 m x 1300 m x 90 m, with a resolution of 5 m x 5 m x 3 m, and is located in the city centre of Viseu (Figure 2). The input data to perform the local scale simulation comprises information on the characterisation of the built-up area of the study domain, namely: buildings volumetry and respectively location within the domain; traffic emissions; meteorological and pollutant background concentrations provided by a mesoscale air quality modelling system. The urban built-up area of the study domain was represented by 142 buildings with different configurations ranging from 9 to 27 m height. Outdoor 3D fields of flow and PM10 concentrations were simulated with VADIS for the reference situation and the future scenarios. Figures 3 presents, as
Air Pollution XVII 95
www.witpress.com, ISSN 1743-3541 (on-line)
© 2009 WIT PressWIT Transactions on Ecology and the Environment, Vol 123,

Figure 3: Horizontal view at 4.5 m height of flow and PM10 concentration fields for the 20th January 2006 at 4 p.m.
example, the horizontal view at 4.5 m height of flow and concentration fields of PM10 over the simulation domain for the 20th January 2006 at 4 p.m., for the reference scenario. The analysis of the PM10 concentration patterns for the winter example shows the transport of the main traffic emissions to southwest, according to the prevailing wind conditions (Figure 3). Hot-spots are observed at the downstream buildings, but with PM10 concentration values below the reference daily limit value of 50 µg.m-3. However, the different temporal resolution of the averages requires some caution in this analysis. According to the local scale simulations for the reference scenario, the outdoor PM10 concentrations nearby the houses of the seven children and the elementary and ASAC (After School Activity Centre) schools are mainly affected by the existent background concentrations determined by the mesoscale modelling system. The future air quality in the study area was simulated using the road traffic emissions and the PM10 background concentrations for the future scenarios (BAU, Grey and Green), maintaining the meteorological conditions used for the reference scenario. Results from the VADIS simulations show an increase of the PM10 concentrations for all scenarios for both winter and summer periods with
96 Air Pollution XVII
www.witpress.com, ISSN 1743-3541 (on-line)
© 2009 WIT PressWIT Transactions on Ecology and the Environment, Vol 123,

an important influence of the background concentrations. The average PM10 concentrations in the domain for the winter period in the three scenarios reveal an increment of 18.0% (Grey), 23.0% (Green) and 16.5% (BAU), relatively to the reference situation. Thus, the Green scenario was identified as the worst case considering the PM10 air quality levels, justified by the increase of the population density and the corresponding emissions in a compact city centre [15]. For the summer period, it is observed a higher increase of PM10 concentrations for all scenarios regarding the winter period, namely 59.0% (Grey), 58.9% (Green) and 59.9% (BAU). Nevertheless, no significant differences were obtained between the analyzed scenarios.
4.2 Human exposure results
The human exposure was based on the children time-activity pattern and on the concentration levels in the visited microenvironments [16]. Five distinct microenvironments were considered in the study, corresponding to the main locations where the selected children spend their time during the winter and summer campaigns: outdoor, residential (bedroom), school, ASAC and transport. The time-activity pattern of the seven children was recorded for both winter and summer periods, characterizing their movement within the study domain. For all children, the higher fraction of time is spent indoors, more particularly, at home, followed by school and ASAC. Also, little time is spent outdoors or in transport microenvironments. The PM10 concentrations at the different indoor locations were estimated using indoor/outdoor relations [16]. The average individual PM10 exposure in the winter period for the reference and the future scenarios is presented in Figure 4.
Winter
22
24
26
28
30
Child 1 Child 2 Child 3 Child 4 Child 5 Child 6 Child 7Ex
po
su
re (
µg
.m-3
.h)
Reference BAU Green Grey
Summer
0
5
10
15
20
25
30
35
40
Child 1 Child 2 Child 3 Child 4 Child 5 Child 6 Child 7Ex
po
su
re (
µg
.m-3
.h)
Reference BAU Green Grey
Figure 4: Children individual exposure to PM10 for the winter and summer periods.
The analysis of Figure 4 for the winter period allows concluding that the highest and the lowest average exposure values to PM10 are found for Children 5 and 1, respectively, for the reference and the future scenarios. Nevertheless, it is important to mention that the PM10 concentration that children are exposed to is below the indicative PM10 daily limit value of 50 µg.m-3 imposed by the air quality legislation for the protection of human health. These results are directly related to the spatial pattern of the outdoor PM10 concentrations near the different
Air Pollution XVII 97
www.witpress.com, ISSN 1743-3541 (on-line)
© 2009 WIT PressWIT Transactions on Ecology and the Environment, Vol 123,

microenvironments that determine the indoor levels and also by the time that each child spent in these indoor spaces. Moreover, the individual exposure for the winter period increases for all scenarios regarding the reference situation, with the highest value found for the Green scenario (+12%), followed by the Grey (+9%) and the BAU (+8%) scenarios. This result is in agreement with the air quality results previously obtained for the three simulated scenarios and for the winter period. These results allow identifying that Children 3, 4 and 5 may have in the future a higher probability to aggravate their respiratory problems. Figure 4 also presents the average individual exposure to PM10 for the group of studied children along the summer period. There is an increase of the individual exposure for all scenarios in regard to the reference situation, with the highest value found for the BAU scenario (+87%), followed by the Grey (+84%) and the Green (+34%) scenarios. The results of the summer period are higher than the ones found for the winter period, which are in agreement with the obtained air quality results; nevertheless the Green scenario is considered here the best case scenario for the future. According to the exposure results for the reference and future scenarios, children 1 and 6, and children 4 and 5 are exposed to the highest and the lowest PM10 concentrations, respectively. Children 1 and 6 have therefore a highest probability to aggravate their respiratory problems in the future. These results are related to the outdoor PM10 levels determined by the VADIS model and used for the estimation of indoor concentrations, meaning that the microenvironments frequented by children 1 and 6 in the summer period are characterized by higher PM10 concentrations. The time-activity patterns of the studied children during the summer period are also a relevant factor on the obtained results.
5 Conclusions
The work presented in this paper is part of a wider project [14], which aimed at the development of scientific elements that can be considered and incorporated into local development plans and in the exercise of the territorial planning, contributing to the sustainable development of a town and therefore, to the improvement of the quality of life of the populations in what concerns air quality and health. The developed methodology is adequate to the intended study, especially regarding the defined objectives. The developed scenarios show that, despite the introduction of cleaner technologies, it is expected that PM10 emissions from the transportation sector grow, leading to a deterioration of the air quality. The BAU scenario is the one that presents the highest emissions, with the Green and Grey scenarios presenting quite similar values. All future scenarios developed point to an air quality degradation, with a mean increase of 20% and 60% of PM10 concentration values for the winter and summer periods, respectively. Nevertheless, these results are not linearly translated into exposure values. In winter, results show a small and similar increase in exposure to PM10 for all
98 Air Pollution XVII
www.witpress.com, ISSN 1743-3541 (on-line)
© 2009 WIT PressWIT Transactions on Ecology and the Environment, Vol 123,

scenarios, while in summer the BAU and Grey scenarios indicate a significant raise of exposure values. This study reveals the non linearity between emissions, air quality and exposure values, confirming the importance of using exposure, instead of ambient air concentrations, in studies where the relation between air quality and health is investigated.
Acknowledgements
The authors are grateful to Calouste Gulbenkian Foundation for the SaudAr project’s financial support. The authors are also grateful for the financial support under the 3rd EU Framework Program and the Portuguese ‘Ministério da Ciência, da Tecnologia e do Ensino Superior’ for the Ph.D. grant of J. Valente (SFRH/BD/22687/2005) and Richard Tavares (SFRH/BD/22741/2005), and for the PAREXPO project (POCI/AMB/57393/2004).
References
[1] EEA, Europe's environment – The fourth assessment. Office for Official Publications of the European Communities. European Environmental Agency (EEA). Luxembourg. 452 p., 2007 (ISBN: 978-92-9167-932-4).
[2] EEA, EEA Signals 2009 – Key environmental issues facing Europe. Office for Official Publications of the European Communities. European Environmental Agency (EEA). Luxembourg. 40 p., 2009 (ISBN: 978-92-9167-381-0).
[3] EC, The Communication on Thematic Strategy on Air Pollution and the Directive on Ambient Air Quality and Cleaner Air for Europe, Impact Assessment. European Commission (EC), 2005.
[4] WHO, WHO Strategy on Air Quality and Health, Occupational and Environmental Health Protection of the Human Environment. World Health Organization (WHO), Geneva. 12 p., 2001.
[5] Dora, C. and Racioppi, F., Transport, environment and health in Europe: Knowledge of impacts and policy implications. Rome, 2001.
[6] Nicolai T., Carr D., Weiland S.K., Duhme H., von Ehrenstein O., Wagner C. and von Mutius E., Urban traffic and pollutant exposure related to respiratory outcomes and atopy in a large sample of children, European Respiratory Journal 21, 856-963, 2003.
[7] WHO, Health effects of transport-related air pollution. M. Krzyzanowski, B. Kuna-Dibbert and J. Schneider (Eds.). World Health Organization (WHO) Regional Office for Europe. Copenhagen, Denmark. 190 p., 2005 (ISBN: 92-890-1373-7).
[8] WHO, Children's health and the environment in Europe: a baseline assessment. World Health Organization (WHO) Regional Office for Europe. Copenhagen, Denmark. 125 p., 2007 (ISBN: 978-92-890-7297-7).
Air Pollution XVII 99
www.witpress.com, ISSN 1743-3541 (on-line)
© 2009 WIT PressWIT Transactions on Ecology and the Environment, Vol 123,

[9] Reis S., Simpson D., Friedrich R., Jonson J.E., Unger S. and Obermeier A., Road traffic emissions – predictions of future contributions to regional ozone levels in Europe. Atmospheric Environment 34(27). 4701-4710, 2000.
[10] Caserini S., Giugliano M. and Pastorello C., Traffic emission scenarios in Lombardy region in 1998–2015. Science of the Total Environment 389(2-3). 453-465, 2008.
[11] Zamboni G., Capobianco M. and Daminelli Giorgio, Estimation of road vehicle exhaust emissions from 1992 to 2010 and comparison with air quality measurements in Genoa, Italy. Atmospheric Environment 43(5). 1086-1092, 2009.
[12] Gonçalves M., Jiménez-Guerrero P. and Baldasano J.M., Emissions variation in urban areas resulting from the introduction of natural gas vehicles: Application to Barcelona and Madrid Greater Areas (Spain). Science of the Total Environment 407. 3269-3281, 2009.
[13] Borrego C., Tchepel O., Costa A.M., Martins H., Ferreira J. and Miranda A.I., Traffic-related particulate air pollution exposure in urban areas. Atmospheric Environment 40(37). 7205-7214, 2006.
[14] Borrego C., Lopes M., Valente J., Santos J., Nunes T., Martins H., Miranda A.I., Neuparth N. Air Pollution and child respiratory diseases: the Viseu case-study, Portugal. Air Pollution 2007. 23 – 25 April, Algarve, Portugal. Eds. C.A. Borrego, C.A. Brebbia, WIT Press, Southampton, UK. pp 15 – 24, 2007.
[15] Ferreira, J.; Martins, H.; Miranda, A.I. e Borrego, C. (2005) - Population Exposure to Atmospheric Pollutants: the influence of Urban Structure. In 1st Environmental Exposure and Health Conference, Atlanta, EUA, 5-7 October 2005 – Environmental Exposure and Health. Eds. M..M. Aral, C.A. Brebbia, M.L. Masila and T. Sinks. WIT Press, pp 13-22.
[16] Borrego C., Lopes M., Valente J., Tchepel O., Miranda A.I., Ferreira J., The role of PM10 in air quality and exposure in urban areas. Air Pollution 2008, 22 – 24 September, Skiathos, Greece. Eds. Eds. C.A. Brebbia, J.W.S. Longhurst. WIT Press, Southampton, UK. pp 511 - 520., 2008.
[17] ACAP, Estatísticas do Sector Automóvel – Edição 2008 (cd-rom), ACAP, 2008.
[18] Tchepel, O., Modelo de emissões para apoio à decisão na Gestão da Qualidade do Ar. Dissertação apresentada à Universidade de Aveiro para obtenção do grau de Doutor em Ciências Aplicadas ao Ambiente, 2003.
[19] European Environmental Agency, EMEP/CORINAIR Emission Inventory Guidebook 2007, Technical Report Nº 16/2007, EEA, 2007.
[20] Borrego C., Tchepel O., Costa A., Amorim J., Miranda A.I., Emission and dispersion modelling of Lisbon air quality at local scale. Atmospheric Environment, 37, 5197-5205, 2003.
100 Air Pollution XVII
www.witpress.com, ISSN 1743-3541 (on-line)
© 2009 WIT PressWIT Transactions on Ecology and the Environment, Vol 123,