EFFECTS OF PULSED GAMMA-NEUTRON IRRADIATION ON THE … · 2018-11-08 · Gangloff and Haley...
47
AFRRI SR72-8 APRIL 1972 AFRRI SCIENTIFIC REPORT eo CM oc EFFECTS OF PULSED GAMMA-NEUTRON IRRADIATION ON THE EEG AND BEHAVIOR OF THE MONKEY W. L. McFarland S. G. Levin ARMED FORCES RADIOBIOLOGY RESEARCH INSTITUTE Defense Nuclear Agency Bethesda, Maryland Approved for public release; distribution unlimited
Transcript of EFFECTS OF PULSED GAMMA-NEUTRON IRRADIATION ON THE … · 2018-11-08 · Gangloff and Haley...

AFRRI SR72-8
APRIL 1972
AFRRI SCIENTIFIC
REPORT
eo ■
CM
oc
EFFECTS OF PULSED GAMMA-NEUTRON IRRADIATION
ON THE EEG AND BEHAVIOR OF THE MONKEY
W. L. McFarland
S. G. Levin
ARMED FORCES RADIOBIOLOGY RESEARCH INSTITUTE Defense Nuclear Agency
Bethesda, Maryland
Approved for public release; distribution unlimited

All aspects of investigative programs involving the use of laboratory animals sponsored by DoD components are conducted according to the principles enun- ciated in the "Guide for Laboratory Animal Facilities and Care", prepared by
the National Academy of Sciences - National Research Council.

AFRRI SR72-8 April 1972
EFFECTS OF PULSED GAMMA-NEUTRON IRRADIATION
ON THE EEG AND BEHAVIOR OF THE MONKEY
W. L. McFARLAND S. G. LEVIN
y^r-^KlC W. F. DAVIS, JR. Chairman Behavioral Sciences Department * SI
* C/MYRON I. VARON
Q^lxA^C.yG OA^ CaPtain MC USN ' Director R. E. CARTER Chairman Physical Sciences Department
ARMED FORCES RADIOBIOLOGY RESEARCH INSTITUTE Defense Nuclear Agency
Bethesda, Maryland
Approved for public release; distribution unlimited

A CKNOWLEDGMENT
The authors wish to express their appreciation for the excellent technical sup-
port provided by J. F. Lee, the computer programming supplied by E. E. Sereno,
and the vascular surgery performed by C. L. Turbyfill and R. M. Roudon.

TABLE OF CONTENTS
Page
Foreword (Nontechnical summary) iii
Abstract iv
I. Introduction 1
II. Materials and Methods 6
III. Results 16
IV. Discussion 26
V. Summary 30
References 32

LIST OF FIGURES
Page
Figure 1. Monkey in the primate training chair 7
Figure 2. Samples of "raw" EEG epochs and their associated power spectral density plots 14
Figure 3. Median percent correct response; median latency; median AM1L, ASDL and power values of EEG epochs; median heart rate; and average systemic systolic and diastolic blood pressures • 18-19
LIST OF TABLES
Table I. Median Values of EEG, Cardiovascular and Behavioral Measures 22
Table II. Po stir radiation to Preirradiation Ratios for AM1L, ASDL and Power 23
Table III. Postirradiation to Preirradiation Ratios in the ETI and Non-ETI Groups for the Correct and Omission Categories . 25
Table IV. Median Values of Postirradiation to Preirradiation Ratios for the "Go" Category 26
ii

FOREWORD (Nontechnical summary)
The objective of this study was to correlate electroencephalographic changes
and behavioral impairment in rhesus monkeys after a whole-body exposure to a
2500-rad pulse of mixed gamma-neutron radiation. The cortical EEC was used as
the index and the monkeys were trained to perform a visual discrimination task. A
method for analyzing the EEC quantitatively was implemented to facilitate comparison
of EEC changes with behavioral changes. In addition, systemic blood pressure was
measured to investigate the possible relationship between cardiovascular changes and
EEG changes. Shifts in values of the EEC measures, indicating an alteration to high
amplitude slow waves, occurred in about the same time period as the behavioral dete-
rioration of the early transient incapacitation (ETI) period. Cardiovascular changes
were not as closely related to behavioral changes. In the recovery period following
the ETI, performance of the monkeys returned to near normal levels of accuracy and
then usually deteriorated in the last part of the session. There was no clear relation-
ship between EEG measures and accuracy of response in this period following ETI.
111

ABSTRACT
Cortical EEG recording leads were implanted in seven rhesus monkeys (Macaca
mulatta). The monkeys were then trained to perform a visual discrimination task.
After the animals had been trained to acceptable levels of performance, blood pres-
sure measuring devices were surgically implanted. Two weeks after surgery the
monkeys were irradiated with a single 2500-rad whole-body pulse of mixed gamma-
neutron radiation from the AFRRI-TRIGA reactor. EEG, behavioral, and cardiovas-
cular parameters were continuously monitored and recorded on magnetic tape. The
EEG was analyzed by a power spectral density procedure, and various measures,
including first and second moments of the spectra, were obtained. Relationships
between these EEG measures, behavioral changes, and cardiovascular alterations
were then studied both preirradiation and postirradiation. Some degree of apparent
relationship was found between changes in the EEG measures after irradiation and
changes in performance, particularly during the early transient incapacitation (ETI)
period. This relationship could not be well established in the period following ETI or
between behavioral and cardiovascular changes. A consistent relationship between
cardiovascular and EEG changes was not established.
IV
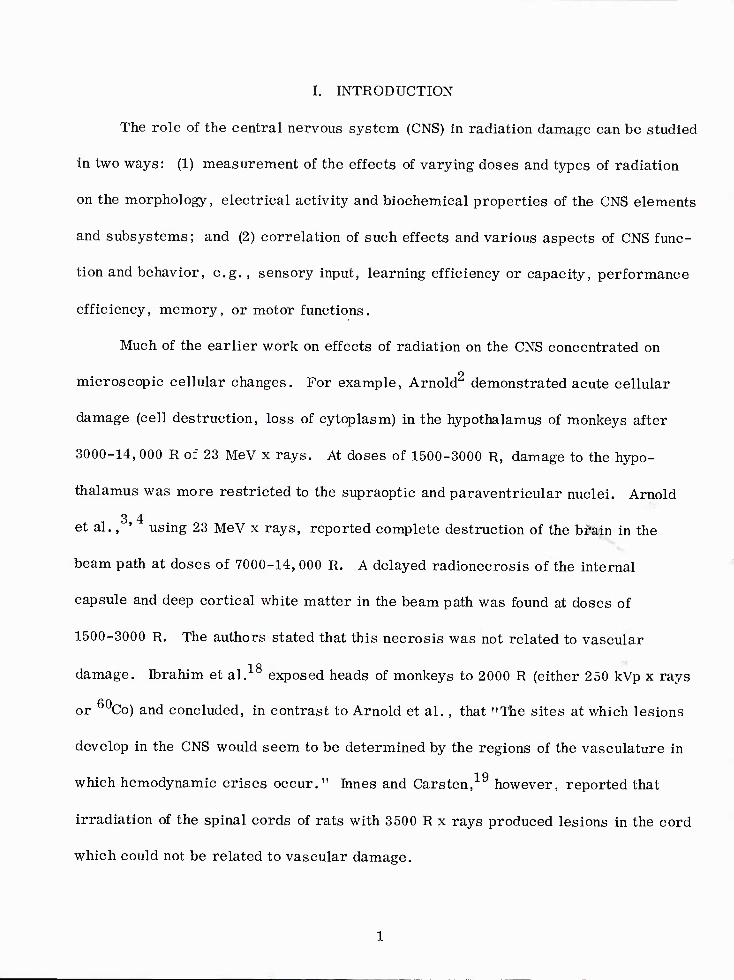
I. INTRODUCTION
The role of the central nervous system (CNS) in radiation damage can be studied
in two ways: (1) measurement of the effects of varying doses and types of radiation
on the morphology, electrical activity and biochemical properties of the CNS elements
and subsystems; and (2) correlation of such effects and various aspects of CNS func-
tion and behavior, e.g. , sensory input, learning efficiency or capacity, performance
efficiency, memory, or motor functions.
Much of the earlier work on effects of radiation on the CNS concentrated on
o microscopic cellular changes. For example, Arnold demonstrated acute cellular
damage (cell destruction, loss of cytoplasm) in the hypothalamus of monkeys after
3000-14,000 R of 23 MeV x rays. At doses of 1500-3000 R, damage to the hypo-
thalamus was more restricted to the supraoptic and paraventricular nuclei. Arnold
3 4 et al., ' using 23 MeV x rays, reported complete destruction of the brain in the
beam path at doses of 7000-14, 000 R. A delayed radionecrosis of the internal
capsule and deep cortical white matter in the beam path was found at doses of
1500-3000 R. The authors stated that this necrosis was not related to vascular
1 8 damage. Ibrahim et al. exposed heads of monkeys to 2000 R (either 250 kVp x rays
or uCo) and concluded, in contrast to Arnold et al. , that "The sites at which lesions
develop in the CNS would seem to be determined by the regions of the vasculature in
which hemodynamic crises occur." Innes and Carsten, however, reported that
irradiation of the spinal cords of rats with 3500 R x rays produced lesions in the cord
which could not be related to vascular damage.

The combination of electroencephalographic recording and biochemical analyses
with neuropathological observations provides much more sensitive indices of radiation
36 damage. If anatomical studies are made in conjunction with functional observa-
25 26 30 tions, ' ' valuable correlations between structural alterations and function can
be obtained.
The present study concentrated on the psychologic and physiologic indices of
radiation damage, in particular electrical activity of the CNS. Considerable evidence
has accumulated indicating that the electrical activity of the CNS is disturbed by ioniz-
er ing radiation. For example, Brooks found that 1000 R of whole-body gamma radiation
at a dose rate of lOOOR/minute caused slowing of the EEG wave form in anesthetized
Q
monkeys. Caster et al. reported that after 700R of total body x irradiation in rats
there was a decrease in both low frequency (1.5-7 Hz) and high frequency (14-30 Hz)
EEG activity relative to the 8- to 12-Hz band 3-12 hours after irradiation. There was
a significant decrease in brain DNA in this same time interval. Caveness et al.
and Carsten indicated that monkeys exposed to 3500 R of 250 kVp x rays (right side
of head only) at a dose rate of 350R/minute showed EEG amplitude alterations as early
as 24 hours after irradiation, a decrease in magnitude of the visual evoked response in
the irradiated hemisphere, reaching its nadir in the 6th week postirradiation, and the
appearance of high amplitude slow waves 18-22 weeks after irradiation. They were
able to correlate evoked potential changes with reductions in dendritic ramifications
in the cortex and appearance of EEG high amplitude slow waves accompanied by neu-
ronal tissue destruction, myelin degeneration, and inflammatory and glial reactions.
Innes and Carsten also reported hemiplegia and EEG abnormalities in monkeys
6-8 weeks after receiving 3500 rads of x rays to the right cerebral hemisphere.
14 Gangloff and Haley reported primarily subcortical (particularly hippocampal) re-
sponses to 200 and 400 R x irradiation in cats. Two points of special interest in their
work were that (1) hippocampal spiking occurred only with whole-body or head irradi-
ation, and not with the head shielded, suggesting a central nervous system effect; and
(2) the initial cortical response at these dose levels was an arousal one (low voltage
fast activity), with high voltage slow wave activity not appearing until the animal
22 approached death. Monnier and Krupp also found that 400-600 R head only gamma
irradiation to rabbits produced neocorticaldesynchrony and hippocampal hyperactivity.
However, if the dose was increased to 900 R, high voltage slow cortical waves
appeared. Nair et al,23 found that 10, 000 R of 250 kVp x rays at 295 R/minute to the
heads of rats resulted in a marked EEG amplitude reduction, 24-48 hours postirradia-
27 tion, Ross et al. ' reported high amplitude slow waves in monkeys after 1500-6000 R
of 250 kVp x rays (118 R/minute) to the head. These changes appeared within the
1st day postirradiation after 4500-6000 R, after 24 hours in the 3000 R group, and by
the 4th day in the 1500-2000 R group. Absence of symptoms of radiation sickness
such as vomiting, diarrhea, and hemorrhages in these head-irradiated monkeys led
them to conclude that there is no causal relationship between CNS damage and those
oQ oq syndromes. Sams et al. ' reported hippocampal spiking in dogs whose heads were
exposed to 10 or 100 rads of 250 kVp x rays at 21.7 R/minute. They could not relate
the spiking activity to any behavioral changes, although they did report an increase in
I 17 time spent in deep sleep after irradiation. In contrast, Herrmann et al. reported
that monkeys generally spent more time asleep, but primarily in the lighter stages of

sleep, after a 5000-rad pulse of mixed gamma-neutron radiation. Also in connection
with sleep stages, Ono et al. used the "EEG afterreaction" (appearance of regular
slow waves in the hippocampus, frontal cortex, and brainstem reticular formation)
as an indicator of paradoxical sleep. Following Co irradiation to the head of rab-
bits (200-10,000R at 37-96R/minute) there were (1) increases in latency of appearance
of the afterreaction with increases in dose; (2) disappearance of the afterreaction with
doses of 3000 R or more; and (3) a rise in the threshold of septal stimulation induced
32 afterreaction with increases in dose. Tsuya, using rabbits and gamma irradiation
to the head (96-37 R/minute), found flattening and slowing of the EEG after doses of
5000-15,000R, more moderate flattening and slowing after 1000-3000R (hippocampus
and amygdala affected more than cortex), and a slight "lowering" of EEG in the 200-
34- 500 R group within 3 hours after irradiation. Uzzell and Sheer exposed cats to either
500 R whole-body gamma radiation or 2000-3000 R head only gamma radiation. They
found a transitory loss of 40 Hz activity in olfactory bulbs in the 2000-3000 R head only
irradiated group, but a nontransitory loss of 40 Hz activity over the 7-day observation
period in the 500R whole-body irradiated cats. They related these EEG results to
changes in norepinephrine and serotonin levels in the olfactory bulbs. Garcia et al.15
reported an EEG arousal reaction in sleeping rats within 1 second after exposure to
250 kVp x-ray doses delivered at rates as low as 0.1 to 0. 2 R/second. They pre-
sumed that this response was due to activation of peripheral receptors.
In one of the few papers dealing with effects of radiation on both EEG and behav-
ior, Adey and Schoenbrun1 reported the following. (1) Doses of 100-400 R of 250 kVp
x irradiation (50 R/minute, delivered weekly over a 6-week period for a total of 600 or

2400 R and directed to the heads of cats) produced hypersynchrony at 5-6 Hz in the
hippocampus and entorhinal cortex and a depression of locomotor activity but had no
effect on learned behavior. (2) Whole head irradiation by 1000-1500 R also produced
hypersynchrony and spiking in the hippocampus promptly after irradiation. These
symptoms diminished and then returned 18 days later coincident with anorexia and
performance decrements. (3) Unilateral irradiation of one hippocampal arch with
1000 R resulted in a decrease in motor activity and hypersynchrony in the hippocampal
EEG at 5-6 Hz, but such effects diminished with accumulated doses over 10, 000R.
Performance accuracy was not affected at any dose. (4) Bilateral hippocampal irradi-
ation with 2500, 5000, or 10,000R of x irradiation produced increases in response
latencies and shifts in the peak of the EEG "power" spectrum to lower frequencies.
Food intake of these cats was not altered nor were there signs of radiation sickness as
there were following their whole head exposures. The latter finding contrasts with
the lack of radiation sickness of whole head irradiated monkeys reported by Ross et
27 al. In another behavioral study the visual acuity of monkeys after 3500 rads of
250 kVp x rays at 350 rads/minute to both occipital lobes was examined by Graham et
1 d al. Significant decrements in acuity appeared 119 days after exposure. Blindness
occurred 149-195 days after exposure. Yanson irradiated rabbits in which a condi-
tioned response had been developed with 500 R of 180 kVp x rays delivered to the head
only, total body, or body only. The conditioned response disappeared 15-20 minutes
after both head only and total body irradiation, whereas impairment of the reflex did
not occur until 1 to 2 days in the body only irradiated group, EEG changes were not

seen in the latter group, although erratic wave forms and amplitude decreases were
seen in the first two groups.
The above studies indicate that a fair amount is known about CNS electrical re-
sponses to x rays in particular in a variety of species, but relatively little work has been
done with high doses of gamma-neutron radiation. In addition, little information is avail-
able concerning the effects of high radiation doses on behavioral-neurophysiological
interactions in trained animals. Therefore the purpose of the present study is to pro-
vide data relating effects of pulsed gamma-neutron radiation on cortical electrical
activity, task performance, and certain pertinent cardiovascular measures.
II. MATERIALS AND METHODS
Seven male rhesus monkeys (Macaca mulatta), approximately 2 years old, were
placed in primate chairs for a 3- to 5-day adaptation period. EEC electrodes (Carmeci
et al. )were surgically implanted on the dura over paired frontal, parietal, and occip-
ital areas under general anesthesia. A miniature Winchester plug, to which the EEC
leads were attached, was also implanted on the skull. After surgery, the monkey was
replaced in the primate chair (Figure 1) and allowed to recover for 1 week before
training started.
Training took place in a ventilated, sound-shielded room in which the monkey
remained for the entire experiment. The monkey was placed in its chair inside a
white painted plywood training box provided with a 15-watt house light. One side was
hinged to serve as a door and an opening was provided for television monitoring.
Electrodes for applying electrical shock in case of errors were connected to the mon-
key's tail and lower back. A stimulus presentation console with a single visual
6
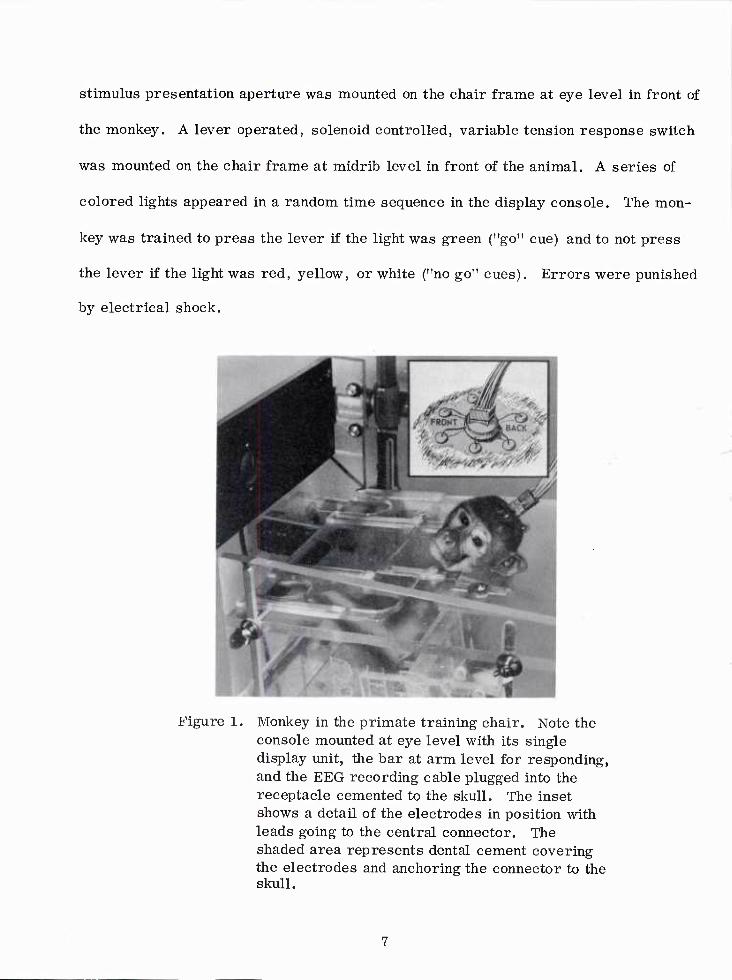
stimulus presentation aperture was mounted on the chair frame at eye level in front of
the monkey. A lever operated, solenoid controlled, variable tension response switch
was mounted on the chair frame at midrib level in front of the animal. A series of
colored lights appeared in a random time sequence in the display console. The mon-
key was trained to press the lever if the light was green ("go" cue) and to not press
the lever if the light was red, yellow, or white ("no go" cues). Errors were punished
by electrical shock.
Figure 1. Monkey in the primate training chair. Note the console mounted at eye level with its single display unit, the bar at arm level for responding, and the EEG recording cable plugged into the receptacle cemented to the skull. The inset shows a detail of the electrodes in position with leads going to the central connector. The shaded area represents dental cement covering the electrodes and anchoring the connector to the skull.

A manual procedure was used initially to teach the monkey to press the lever
when the green light appeared. If he did not press the lever within 2 seconds of the
onset of the green light, a brief electrical shock was given. After reaching profi-
ciency on this phase of the task, sequencing of stimuli was placed under automatic
control. Subsequent training was conducted in isolation. The isolation cubicle was
illuminated 1 minute prior to the start of the program to serve as a cue to the monkey
and to provide lighting for the television camera. Initial automatic training began
with only the "go" (green) stimulus being presented. After achievement of a stable
90 percent correct performance on this phase, the first "no go" light (red) was intro-
duced on the following day's session. On reaching a criterion of 90 percent correct
performance for both green and red stimuli, the monkey was confronted with a third
stimulus, the "no go" yellow, and training proceeded as with the red and green. A
fourth stimulus, the "no go" white, was entered subsequent to reaching an adequate
performance level on the previous three. Each stimulus was presented for 2 seconds.
The monkey was shocked for failure to respond to green and for responding to any
negative light stimulus. A response to green extinguished that stimulus but a "no go"
stimulus remained on for the full 2 seconds regardless of response. Stimulus presen-
tations averaged approximately six per minute over a 90-minute session, 50 percent
being "go" (green) cues and 50 percent equally divided among the three "no go" lights.
Shock for omission or commission error was automatically delivered for 100 milli-
seconds , with intensity varied manually depending on the training stage and shock
response of the monkey.

As the monkey's proficiency rose, the shock intensity was increased gradually
to a maximum (8 mA) at which it was maintained during all subsequent training and
test sessions. This was done to avoid disrupting the early learning process with high
shock levels and to prevent lapses of performance accuracy after learning the task
by providing sufficiently intense punishment for errors. In addition, the high shock
level provides, in this motivational system, maximum incentive for correct perform-
ance after irradiation, although even this incentive is ineffective in the early transient
incapacitation (ETI) period which most monkeys pass through a few minutes after the
pulse.
Daily sessions of 1-1/2 hours were held at the same time in the morning until
each monkey achieved a level of 90 percent or better correct response to all cues for
3 consecutive days. The mean time to reach this level of performance was 25 days.
At this time, the last four monkeys in this series were removed from the chairs, and
catheters for blood pressure measurement were implanted under general anesthesia
in the abdominal aorta via the femoral artery and in the vena cava via the femoral
vein.33
Behavioral and EEGbase lines were selected from one of the sessions conducted
on each of the 3 days immediately preceding the day of exposure. Prior to each of
these sessions, the monkey was removed from the testing chamber, transported to
the reactor exposure room area, allowed to remain for several minutes, and then
returned to the testing chamber. An additional l/2-hour session was given at the
same time (3:00 p.m.) on each of these days, and the EEGwas periodically sampled
overnight. Testing time and recording equipment for the exposure session were

identical with previous training and test sessions, only the location differed. The
possible effect of the latter factor on performance was minimized by the adaptation
transportations described above and by placing the animal in the exposure room in a
plywood box identical with his training box.
The monkeys were positioned in Exposure Room No. 1 of the AFRRI-TRIGA
reactor to receive a dose calculated from previous dosimetry of 2500 rads of pulsed
gamma-neutron radiation. The gamma-neutron ratio, free-in-air, was about 60 to
40. The midline tissue dose (MTD) was obtained by determining the tissue kerma,
free-in-air, at the midline exposure volume and multiplying this value by an experi-
mentally derived factor (0. 85). Dosimetry on these animals indicated a mean dose of
2529 rads with a range from 2300 to 2800 rads. The entrance dose at the monkey's
surface was 112 percent of the free-in-air dose, at specimen midline it was 85 per-
cent of the free-in-air dose, and at exit it was 54 percent of the free-in-air dose.
On the day of irradiation the monkeys were placed in the reactor exposure room
and recording leads were connected. After the exposure room door was closed the
regular testing sequence started. The radiation pulse occurred 1/2 hour later with
no interruption of the cue presentation program, which continued for another hour
after the pulse.
To record the EEG, a low noise Microdot wire harness conducted the EEG sig-
nals from the animal to a switch panel where any combination of existing signals could
be arranged and then fed in pairs to double-ended input preamplifiers. The EEG
signal pairs used in this study were right frontal-right occipital, with one exception
when the left frontal-left occipital pair was used because of noise problems in the right
10

frontal-right occipital leads. All signals were filtered at 0.1 Hz-1 MHz bandwidth and
amplified 100 times at this stage, then routed to an Ampex DAS100 14-channel mag-
netic tape system with a bandwidth setting of 1-50 Hz, amplified 50 times (peak to
peak), and recorded on analog tape. The EEG signals were both preceded and fol-
lowed by 3-minute calibration periods. Calibration consisted of consecutive 1-minute
periods of zero input, 1 mV square waves (10/sec), and zero input. In addition,
three sets of known test signals were recorded near the beginning, middle, and end of
the l-l/2-hour session. These signals consisted, respectively, of a complex sine
wave with 3, 10, and 30 Hz components, a white noise (all frequencies within a band-
width of 5 Hz to 20 KHz present at identical amplitudes), and a sawtooth signal, all of
known root mean square amplitudes. These signals served the dual purpose of check-
ing the timing accuracy of the digitizing procedures and verifying the accuracy of the
spectral analysis computer program. A graphic time code and behavioral event codes
were also recorded on additional channels. Simultaneous visible records were
obtained on a Brush pen writer or monitored on oscilloscopes.
The analog data on magnetic tape were stored for later computer processing, at
which time taped EEG signals were played back, amplified five times at a 1-50 Hz
bandwidth, and transmitted to the Scientific Data Systems 920 computer for digitizing
and analysis. Just prior to entering the analog to digital converter, the signals were
again filtered through a Krohn-Hite filter with bandwidth set at 0.1-35 Hz. The EEG
data were digitized at a rate of 100 samples per second and stored on digital tape.
The data to be analyzed for this study consisted of 10-second epochs of EEG
signals immediately preceding onset of stimulus lights. These epochs were selected
11

from the Brush records with care being taken to exclude motion artifacts. In the
base-line period (the day preceding irradiation) 10 epochs were selected preceding
green stimuli ("go" cue) and 10 preceding nongreen stimuli ("no go" cues) scattered
throughout the entire l-l/2-hour session. Ten "go" and ten "no go" epochs preceding
correct responses were picked in the 30-minute preirradiation period on the day of
exposure. Epochs preceding any errors were also selected in these time periods,
although errors were very few because of the high response accuracy. In the 1 hour
after the pulse, all epochs preceding errors were selected, and at least 50 percent of
all artifact-free epochs preceding correct responses were chosen for analysis. The
starting times of these epochs were entered on card coding forms for keypunching.
Cardiovascular and response latency data were measured on the Brush records.
Response latency refers to the time from the light cue onset to the time the monkey
makes its response.
The primary purpose of this study was to determine whether EEC patterns could
be associated with animal behavior (performance) under a specific set of conditions.
To accomplish this the mass of data collected on each animal had to be reduced to a
manageable form, and measures which characterize an EEG spectrum were required.
Power spectral density calculation was used to reduce 10-second EEG epochs to a plot
of intensity versus frequency. Since the power density spectrum has the characteris-
20 tics of a statistical distribution function (Jenkins and Watts, p. 222), one might
characterize the spectrum by its moments. The first moment is indicative of the
location of the center of mass of a distribution function and the second moment is a
measure of spread of a distribution. The implications in terms of EEG configuration
12

are that if the first moment center of mass measure (units in hertz) is low, then slow-
waves are predominant in the EEG, If the first moment is high, then higher frequen-
cies are present in the EEG, If the second moment measure (units in hertz) is small,
then the EEG shows a regular wave form synchronized around the frequency band indi-
cated by the value of the first moment. If the second moment is large, then the EEG
consists of a wider range of frequencies. The shape of the EEG spectrum is not sym-
metrical and often looks like Figure 2A. Since this is reminiscent of the log normal
distribution, often encountered in biostatistical data, plotting the data on a log fre-
quency scale would tend to make it symmetrical and would make the moments of the
log frequency spectra easier to interpret. The median frequency is also considered
since it gives the point that divides the area of the power spectral density function in
half and has the same meaning regardless of the shape of the spectrum. A final meas-
ure that is used to characterize the power spectral density function is the total power
which is the sum of all of the intensities without regard to frequency. It is an indica-
tion of the average amplitude of the EEG during the time of the epoch. If the power
increases, then the amplitude of the EEG wave form increases. The power spectra
were obtained by first calculating the autocorrelation function and then the smoothed
power spectral density function using a weighted cosine transform. These terms are
explained and the method of calculating the power spectral density function using the
Parzen window for smoothing is described in Jenkins and Watts.20 The method as
described, using 10-second duration epochs and digitizing at 100 points per second
with 200 lags in the autocorrelation calculation, resulted in a bandwidth of about
1/2 cycle per second, i.e., frequencies differing by 1/2 Hz can be distinguished.
13

0.3]
0.24
0.13
0.12
0.06
0.48
0.42
0.36
0.30
0.24
0.18
0.12
0.C6
1
1—'—\—1—1—!—[
I I I i
_L i _ ̂ ^ 1
J ll A
klf^ y miAMM^^ mt 100 nV
1
-v---aH ^ |1'| I'll M '' '1 ilT^j- t:t^ WfiHf
_J tm^nt
, j
* EDIAN = 5.05
MIL = 5.11
SDL = 2.64
ij = Areo OTAL POWER
v> 1
|-i»cH
encompassed by AMlL
= 4,337
1
► ASDL
i
-MEDIAN
100 nV
h-l"c-|
MEDIAN = 1.95
AMlL = 2.48
ASDL = 1.84
| ) - Area encompossed by AMI Li ASDL
TOTAL POWER = 28,545
10 15 20
FREQUENCY (hertz)
30
Figure 2. Samples of "raw" EEG epochs and their associated power spectral density plots. A. From a time period prior to irradiation. Three measures used to char- acterize the spectral density plot are illustrated. The median indicates the point at which 50 percent of the total power lies below and 50 percent above; AMlL is anal- ogous to the mean of the power distribution and ASDL is a measure of spread. Note the multipeaked nature of the distribution and the rather large spread indicated by ASDL in the shaded area. B. From the ETI period of incapacitation after irradia- tion. Note relative to the normal EEG in A that now most of the power is shifted into a large peak at around 1. 5 Hz with corresponding downward shifts in the median and AMlL measures; ASDL is reduced; and the total power in the epoch has increased relative to preirradiation.
14

The final step of the spectral analysis program calculates total power which is
the sum of intensities over all frequencies. The intensity at each frequency is divided
by this total power, making the new sum equal to one and giving a relative intensity (I)
at each frequency (W). The output of the spectral analysis program is in the form of
100 pairs of values: frequency (W) and relative intensity (I) from 0.1 to 40 Hz. The
I values resemble proportions or percentages in the histogram interpretation of the
spectrum. Thus we have the first moment
40 Ml = L UWi
j=0 J J
and the second moment
.2 Var W = SIjWj - (Ml)
SD - /Var W .
Using the Parzen window, none of the I's can be negative.
The log moments were obtained by taking the logarithm of frequency and com-
puting
MIL = EIj(logWj)
Var L = Llj(logWj) -(MIL)
SDL = /Var L .
The required quantities were obtained by taking antilogs thus:
AM1L = antilog (MIL)
ASDL = antilog (SDL) .
15

Figure 2A and B illustrates the location of the A MIL and ASDL values on two power
spectral density plots. That frequency (W) at which the 50 percent point is located
is called the median frequency (MED). If the median point was between two frequen-
cies, linear interpolation was used to estimate the median.
The moment concepts were developed to permit quantification and summariza-
tion of the data on a large number of epochs in any given category for several animals.
The basic comparisons were between preirradiation and postirradiation periods;
between "go" and "no go" conditions; and between correct and incorrect responses.
The EEG epochs were categorized to allow these comparisons to be made. A com-
juter program was developed that lists the time; the category of epoch, e.g., pre-
irradiation, "go", correct; the response latency for the 10-second epoch; and the
value of power. Ml, SD, MED, AMIL and ASDL, for each epoch. The values of heart
■ate (beats per minute) and blood pressure (millimeters of mercury) are listed as
veil for each epoch. The program further groups all of the epochs of a particular
ype, e.g., postirradiation, "go", correct, and for each condition gives average val-
tes of each EEG measure and physiological variable, A program option gives the
ummary for all monkeys while another gives a plot of each of the measures versus
ime.
EX. RESULTS
Figure 3A-G presents data averaged from all seven monkeys over 5-minute
itervals. For each measure on each monkey an average value was determined for
onsecutive 5-minute intervals. The median value of each measure for all monkeys
as then calculated per 5-minute interval as indicative values for a typical animal.
16

Figure 3A presents the typical performance on both the "go" responses follow-
ing a green light cue and on the "no go" response inhibition after a nongreen light cue.
Prior to the pulse, the average performance was quite stable. An early transient
incapacitation (ETI) appeared at about 10 minutes postpulse in the "go" responses and
at about 15 minutes postpulse in the "no go" responses. Most monkeys returned to
fairly accurate performance following the ETI period, although occasional errors
occurred. It is particularly interesting that the peak decrement in response inhibi-
tion ("no go" conditions) occurred in the recovery period from the "go" response ETI,
indicating a period of confusion when the monkey was responding to all stimuli. Most
of the animals suffered a second performance decrement in the last part of the ses-
sion, including two with severe decrements which brought the average performance
down considerably. The continued high level of performance in the "no go" condition
at this time reflects the fact that lack of response was correct for these cues. That
is, lack of response due to incapacitation cannot be distinguished from inhibition of
response in the normal animal. The primary value of the "no go" condition is in the
recovery phase from the ETI when the animal is beginning to respond to cues, but
fails to inhibit responses when a "no go" cue appears.
Figure 3B represents the median response latency with the animals separated
into those showing a significant ETI within 15 minutes after the pulse and those not
exhibiting such an ETI. A rise in latency can be seen 5-10 minutes postpulse in the
ETI group and a delayed rise in the non-ETI group, followed by a short recovery and
then a trend of gradually increasing latency for the remainder of the session. The
drop in value of the median first moment, AM1L (Figure 3C), 5-15 minutes after the
17

Figure 3.
A. Median percent correct response for successive S-minute intervals for all seven monkeys for 30 minutes prior to the pulse and 60 minutes after the pulse. The solid line represents the performance on the "go" (before the green cue) condi- tion, and the dashed line that on the "no go" (before the nongreen cue) condition. Standard errors are not indicated on this or subsequent plots in this figure since the statistical assumptions prerequisite for use of this measure have not yet been verified in this study.
B. Median latency of response from cue onset for consecutive 5-minute intervals plotted separately for those monkeys (four) showing a significant ETI within 15 minutes after the pulse and for those monkeys (three) not showing such an ETI. All monkeys showed a secondary decrement toward the end of the session.
C. Median AM1L values of EEG epochs plotted in successive 5-minute intervals for those monkeys showing an ETI soon after the pulse and for those not demonstra- ting such an ETI. See text for derivation of this and subsequent EEG measures.
D. Median ASDL values of EEG epochs plotted at successive 5-minute intervals for the group of monkeys showing an ETI within 15 minutes after the pulse and those not demonstrating such an ETI.
E. Median power values of EEG epochs for ETI and non-ETI groups of monkeys plotted in 5-minute increments. The peaks at minus 10 minutes and plus 15 minutes are due to aberrantly large values from a single monkey.
Median heart rate in beats per minute plotted over 5-minute intervals for two monkeys showing an ETI and two monkeys not showing an ETI within 15 minutes after the pulse. Only four of the seven monkeys in this study were instrumented for cardiovascular measurements.
Average systemic systolic and diastolic blood pressures plotted separately for two monkeys showing an ETI and two not showing an ETI soon after the pulse.
18

z o
S 60
18
S*-'
V S M z
£ 20 0_--0 "NO GO" RESPONSES
A i
i i 1 ! 1 1 1 1
-30 -20 -10 0 10 20 30 40 50 60 f TIME (minul*i)
PULSE
A
c
1 1 1 1 1 i
V/v \/ o oNON-ETI GROUP
2 75
I 1 | 1 1
r \
1 1 1 1
2.50
"'X/"'/^ ^ 5-V
2.25 \ / D j V
1 1 I 1 1 0---ONON-ETI GROUP
1 1 1 1 -30 -20 -10
f TIME ( PULSE
10 20 30 40 50 60 -30 -20 -10 9 JO 20 30 40 50 60 f TIME (minulei)
PULSE
20,000
'5,000
^ 5,000
4,000
3,000
2,000
VIA V- /V/
•ETI GROUP ONON-ETI GROUP
\=/ \y -30 -20 -10 0 io 20 30 40 50 60
f TIME (minute,) PULSE
i
:y-°-° — 250
/" ^ 220
i
5 190
< 1 160
1.10 F
i
t
--- *f ^^ 0---0NON-ETI GROUP
-30 -20 -10 0 )0 20 30 40 50 50 f TIME (minul.t)
PULSE
19

pulse, coincides closely with the latency changes in both ETI and non-ETI groups seen
in Figure 3B. The trend toward lower values in the last part of the session follows
the performance deterioration seen at this time. Note that the AM1L values after the
pulse never reach the prepulse level, except for a brief period in the non-ETI group,
indicating a downward shift in average frequency of the EEG. A similar correlation
with performance changes is reflected in the ASDL measure shown in Figure 3D. The
previous two measures have not, to our knowledge, been used before and provide a
quantitative means of specifying changes in the power density spectrum. A measure
that has been used by other investigators is the total power. The average of the loga-
rithm of power is plotted in Figure 3E at 5-minute intervals for ETI and non-ETI
groups. Once again, this measure follows changes in performance, with peaks appear-
ing in close association with the latency changes of the two groups. Significance tests
cannot yet be applied to determine whether the apparent differences in the curves are
real. Taken together, the changes in the last three measures indicate that in the post-
pulse period, and especially during ETI, the EEG was increasing in amplitude and becom-
ing more synchronized at lower frequency values relative to preirradiation values.
The heart rate values in Figure 3F show an interesting apparent difference be-
tween ETI and non-ETI groups with the latter showing a larger increase in rate after
the pulse. The sharp drop in the last three values for the ETI group is due to one
animal which died shortly after the session. The average systemic blood pressure
values of Figure 3G indicate that those animals that did not have an ETi exhibit a
larger decrease in pressure after the pulse than those showing an ETI. However, the
relative recovery of the non-ETI group is greater than that of the ETI group.
20

Table I presents medians of values for the indicated behavioral, EEG, and car-
diovascular measures for each monkey over all epochs within a given category. Only
those epochs preceding a green cue ("go" response cue) are considered. Latency of
response shows a slight increase postirradiation in the correct category and reaches
its maximum of 2 seconds in the omission category. Note that the median AM1L val-
ues drop from 4.42 to 4.27 to 2.96 Hz in the preirradiation correct, postirradiation
correct, and postirradiation omission categories, respectively. ASDL values show
the same trend, the two measures thus indicating that the EEG is shifting into a syn-
chronous pattern at lower frequencies. The median values for power indicate relatively
small differences between epochs appearing in the correct category preirradiation and
postirradiation, but a sharp rise in power in the omission category.
Data for three of the EEG measures organized by behavioral category are pre-
sented in Table II. Each entry represents the ratio of average values of a given
measure for all epochs in a given behavioral category for the indicated monkey. The
ratio of a given measure consists of the mean value for epochs postirradiation divided
by the mean value in that category of epochs in the preirradiation period. Thus a
ratio with a value of less than one indicates a decrease in that measure and a value
greater than one indicates an increase. Ratios were used rather than mean values so
that data from all monkeys could be combined in spite of large individual preirradia-
tion differences. The trend of the data was nearly always in the same direction. For
example, considering the A MIL measure for the "go" epochs, five of the seven mon-
keys showed a drop relative to preirradiation values in the correct category and six
of the seven decreased to even lower AM1L values in the omission category. This
21

Table I. Median Values of EEG, Cardiovascular and Behavioral Measures
Preirradiation "go" correct
Monkey Latency (sec)
AMIL (Hz)
ASDL (Hz)
Power Heart rate
(beats/min) Blood pressure
(mm Hg)
34 0.7 5.03 2.91 5,356 --
43 0.8 5.55 2.55 2,572 120 124/71
110* 0.7 2.95 2.68 3,174 156 137/88
180* 1.1 4.42 2.63 1,602 164 104/73
299 0.8 3.73 2.73 32,058 202 144/92 \
653* 0.5 5.49 2.72 3,794 — —
802* 0.7 3.31 2.53 8,960 — —
Median 0.7 4.42 2.68 3,794 160 130/81
Postirradiati on "go" correct
34 0.9 4.32 2.58 5,608 — —
43 0.9 4.32 2.60 5,095 254 97/57
110* 1.0 3.78 2.52 52,053 240 120/66
180* 1.2 3.68 2.54 1,719 228 85/75
299 0.9 4.27 2.46 29,009 259 83/71
653* 0.7 4.99 2.49 4,880 — —
802* 0.8 2.75 2.46 5,322 — —
Median 0.9 4.27 2.52 5,322 247 91/69
Postirradiatic n "go" omission
34 2.0 2.96 2.40 10,643 —
43 2.0 4.29 2.22 1,702 265 107/62
110* 2.0 1.88 1.71 19,350 211 61/38
180* 2.0 2.42 2.33 2,676 154 87/77
299 2.0 4.60 2.39 37,959 272 84/75
653* 2.0 3.46 2.08 24,208 — —
802* 2.0 2.27 2.02 14,713 — —
Median 2.0 2.96 2.22 14,713 238 86/69
* Showed ETI within 15 minutes after pulse
22

Table II. Postirradiation to Preirradiation Ratios (ETI included) for AM1L, ASDL and Power
Monkey #
AM1L
"go" "no go"
Correct Omission Correct Incorrect
34 .86 .59 .89 .85
43 .78 .77 .82 .56
110 1.28 .64 1.63 2.22
180 .83 .54 .71 .87
299 1.15 1.23 .85 —
653 .90 .63 .84 .47
802 .83 .69 .72 .94
Median .86 .64 .84 .86
ASDL
34 .89 .82 .95 .93
43 1.02 .87 .92 1.01
110 .94 .64 1.03 1.06
180 .96 .88 .93 1.04
299 .90 .88 .89 —
653 .91 .76 .86 .94
802 .97 .80 .86 .95
Median .94 .82 .92 .98
Power
34 1.05 1.99 1.05 .96
43 1.98 2.61 2.02 3.96
110 16.40 6.10 7.80 5.74
180 1.07 1.67 1.16 .94
299 .90 1.18 1.57 —
653 1.28 6.38 3.45 3.68
802 .59 1.64 1.72 .53
Median 1.07 1.99 1.72 2.32
*
23
indicates that the center of mass of the spectral density plot shifted to lower frequen-
cies after irradiation, and particularly before omissions. Similarly, for the ASDL
measure there is a general shift downward after irradiation, indicating less spread in
the power spectra; that is, the EEG frequency spectrum has narrowed. The EEG
epochs of three monkeys (Nos. 43, 110 and 653) showed moderate to large increases
in power (average amplitude) relative to preirradiation values in the correct category
and all monkeys showed large increases in power in the omission category, most of
them increasing by a factor of 2 or more. The data for the "no go" correct epochs
follow the same general trend as the data in the "go" correct epochs. The data are
less consistent in the incorrect category, but these values should be taken with cau-
tion since they are based on very few samples.
In Tables I and II the data were considered without regard to whether or not
the monkey showed a significant ETI. Table III presents the same measures in the
postirradiation period as Table II, but monkeys are separated according to extent
of the ETI. The criterion was arbitrarily established as follows: if the monkey
spends 2 or less consecutive minutes at zero percent correct response to the "go"
cue, he is not considered to have a significant ETI. Zero performance for 3 or more
consecutive minutes is considered a significant ETI. It appears that there are no
large differences in any of the measures between median values in the correct cate-
gory for the ETI and non-ETI groups. In the omission category, there are larger
differences in median values between the ETI and non-ETI groups. However, the
values for the non-ETI group in the omission category show larger changes from pre-
irradiation values than do values for the non-ETI group in the correct category.
24

Table III. Postirradiation to Preirradiation Ratios in the ETI and Non-ETI Groups for the Correct and Omission Categories
Postirradiation "go' correct
Group Monkey
AM1L ASDL Power
34 .86 .89 1.05
Non-ETI 43 .78 1.02 1,98
299 1.15 .90 .90
Median . 86 .90 1.05
110 1.28 .94 16.40
ETI 180
653
.83
.90
.96
.91
1.07
1.28
802 .83 .97 .59
Median . 87 .95 1.18
Postirradiation "go' omission
34 .59 .82 1.99
Non-ETI 43 .77 .87 2.61
299 1.23 .88 1.18
Median . 77 .87 1.99
110 .64 .64 6.10
ETI 180
653
.54
.63
.88
.76
1.67
6.38
802 .69 .80 1.64
Median . 64 .78 3.89
Table IV presents the data in a manner to completely separate the values for
epochs appearing in the ETI period from those outside that period. Each entry repre-
sents the median of a set of ratios for the indicated monkey, category, and measure.
Each ratio in the set was calculated by dividing the value of the measure (AM1L,
ASDL, or power) of a given epoch in the postirradiation period by the average value
25
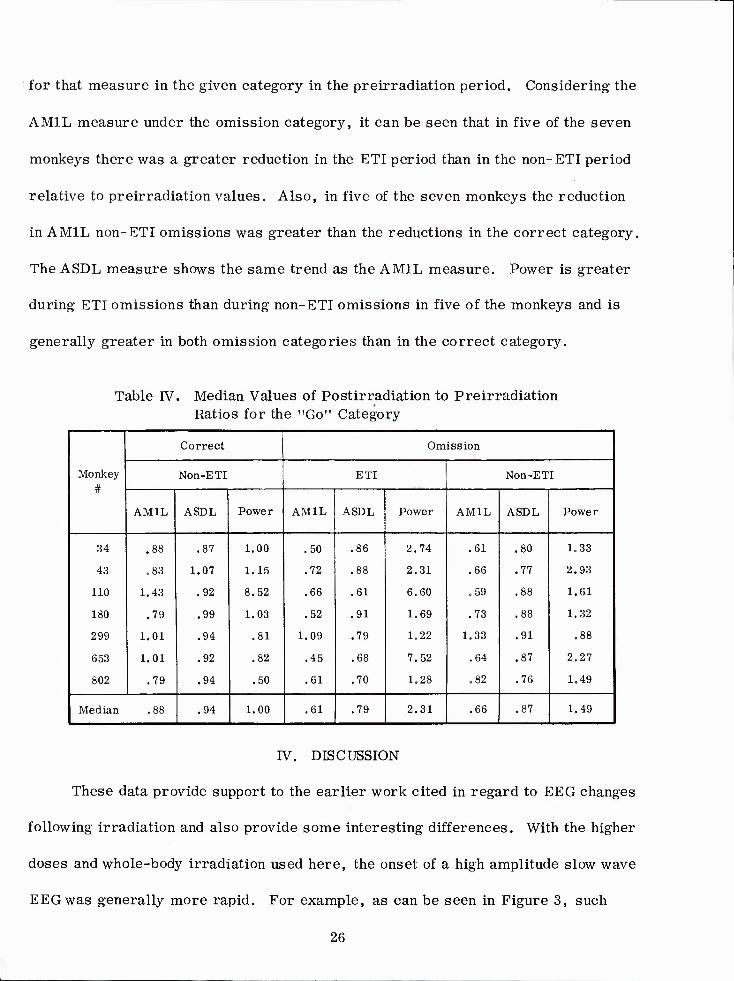
for that measure in the given category in the preirradiation period. Considering the
AM1L measure under the omission category, it can be seen that in five of the seven
monkeys there was a greater reduction in the ETI period than in the non-ETI period
relative to preirradiation values. Also, in five of the seven monkeys the reduction
in A MIL non-ETI omissions was greater than the reductions in the correct category.
The ASDL measure shows the same trend as the A MIL measure. Power is greater
during ETI omissions than during non-ETI omissions in five of the monkeys and is
generally greater in both omission categories than in the correct category.
Table IV. Median Values of Postirradiation to Preirradiation Ratios for the "Go" Category
Monkey #
Correct Omission
Non-ETI ETI Non-ETI
AM1L ASDL Power AM1L ASDL Power AM1L ASDL Power
34 .88 .87 1.00 .50 .86 2.74 .61 80 1.33
43 .83 1.07 1.15 .72 .88 2.31 .66 77 2.93
110 1.43 .92 8.52 .66 .61 6.60 .59 88 1.61
180 .79 .99 1.03 .52 .91 1.69 .73 88 1.32
299 1.01 .94 .81 1.09 .79 1.22 1.33 91 .88
653 1.01 .92 .82 .45 .68 7.52 .64 87 2.27
802 .79 .94 .50 .61 .70 1.28 .82 76 1.49
Median .88 .94 1.00 .61 .79 2.31 .66 ,87 1.49
IV. DISCUSSION
These data provide support to the earlier work cited in regard to EEC changes
following irradiation and also provide some interesting differences. With the higher
doses and whole-body irradiation used here, the onset of a high amplitude slow wave
EEC was generally more rapid. For example, as can be seen in Figure 3, such
26

changes in the EEG measures generally occurred within 10 minutes after the pulse.
5 This is comparable to the time periods in which Brooks found EEG changes after
whole-body gamma irradiation, and Tsuya after 5000-15,000 R gamma irradiation
to the head. The appearance of EEG slow waves is in contrast to the arousal EEG
14 22 found by Gangloff and Haley at 400 R total body x irradiation, by Monnier and Krupp
o with 400-600R gamma irradiation to the head, and Caster et al. with 700R total body
x irradiation. However, when Monnier and Krupp increased the dose to 900R, they
27 did find slow waves appearing in the EEG. Similarly, Ross et al. found a dose effect
between the appearance of EEG slow waves and magnitude of dose. This was probably
related to the differences in rapidity of development of neurological damage and extent
of damage at the various dose levels. The differences in species and radiation
sources make generalizations difficult, but there is a suggestion that low or moderate
doses of radiation affect the nervous system differently than high (over 900R) doses.
The slow wave phenomena may be associated with the dendritic and other cortical
9-12 disorganizations found by Caveness et al. or with biochemical or cardiovascular
dysfunctions related to the higher radiation doses.
The finding of Adey and Schoenbrun of a delayed decrement in performance
after whole head irradiation but lack of decrement (except for increased response la-
tency) with higher doses directed to the two hippocampi suggests that the performance
decrement found in this study is related either to neural structures other than the hip-
pocampus or to other physiological dysfunctions mediated by the brain. This suggestion
must be tempered by the realization that species, task, and radiation sources differed
in the two experiments.
27

There were two prime objectives of the present study: one was to find EEG
correlates of the ETI period perhaps comparable to some of the EEG changes found in
various stages of coma 0»^-L»oa- and the other was to begin a search for EEG changes
associated with making correct or incorrect responses. In regard to the first objec-
tive, reference to Figure 3 shows that there is usually, coincident with the ETI period,
a drop in AM1L and ASDL values and an increase in EEG power levels. In addition,
the data of Table I indicated that while there was a general shift downward in values
of AM1L and ASDL for EEG epochs preceding correct responses, the shift was even
greater for those epochs preceding omissions. Most of these omissions occurred in
the ETI period. As noted in the results section, median power levels were higher for
omissions than for correct responses, indicating increased EEG amplitude in the for-
mer case. This general finding is substantiated again in Table II, using ratios and
medians throughout and considering all the data postirradiation. Overall, in the "go"
cue category (must make a response to avoid shock) the AM1L and ASDL values de-
crease in the omission category relative to the correct category, and power increases
during omissions. The data in the "no go" category (must not make a response to
avoid shock) are less consistent. This is primarily due to the few cases in this cate-
gory. The data thus far considered provide support for the contention that changes in
EEG measures can be used to characterize the ETI period.
Support for the second objective, to provide EEG indices of correct or incorrect
responses, is not yet clear since most of the omissions occur in the ETI period.
Therefore the values in Table III are organized to differentiate between monkeys
showing a distinctive ETI and those that do not. There appear to be no particular
28

differences between the two groups of monkeys (with and without an ETI) in the correct
category, but in the omission category, differences are evident. The influence of the
ETI period in lowering the average frequency and raising the average amplitude of the
EEG, as indicated by the A MIL, ASDL, and power values, is seen in Table IV where
the omission category is separated into those epochs in the ETI period and those in
the non-ETI period. Values in the ETI period are shifted to a greater degree than
those in the correct category relative to the preirradiation values, those omissions in
the non-ETI period are synchronized over lower frequencies and exhibit higher aver-
age amplitudes than are characteristic of the correct category. The shifts in EEG
values noted here are not to be construed as anticipatory in the sense of a sudden
change before a cue presentation. A more reasonable interpretation of these results
is to postulate that if a cue light should appear when the EEG is in a high amplitude
slow wave condition, the probability of an error is greater than if the cue light
appeared when the EEG is closer to a normal wave form. This would seem to provide
support for the second objective of differentiating by EEG measures between correct
and incorrect responses, but such a conclusion is premature. This is due to the fact
that the data for individual EEG epochs (not shown) indicate that not only are there
AM1L values for correct responses as low as those for omissions in the ETI period,
but in the period following ETI there are omission AM1L values as high as the pre-
irradiation normal values. The same overlap holds for both ASDL and power values.
This result is not too surprising since only cortical EEG is being considered in this
report, and reports in the literature indicate that relationships between cortical and
subcortical EEG's must be measured to provide indices of the correctness of a
29
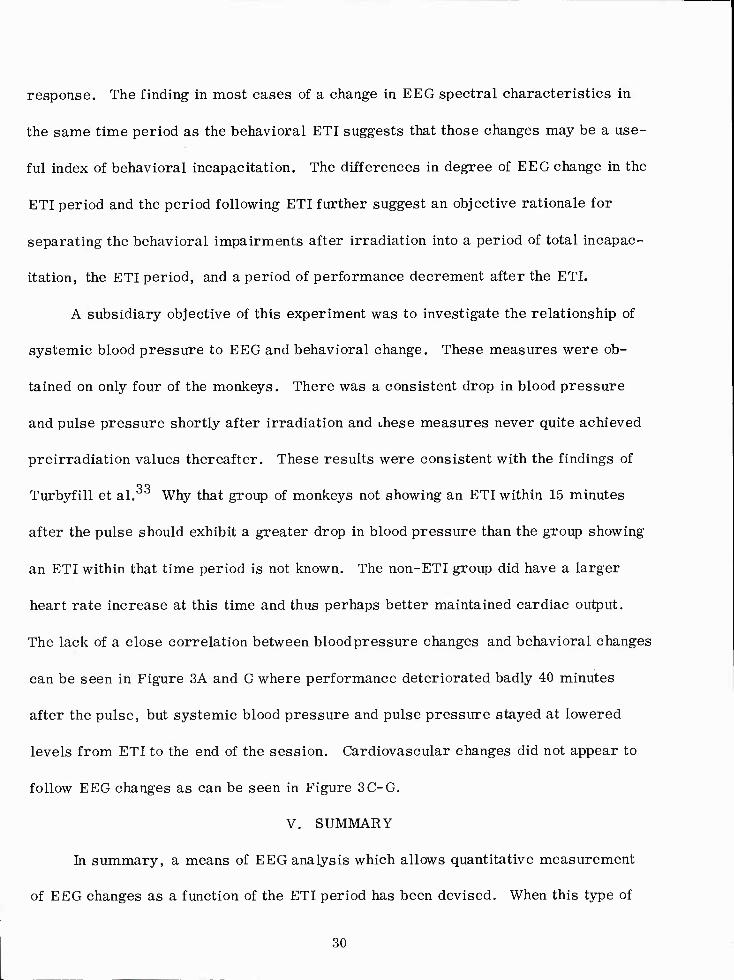
response. The finding in most cases of a change in EEG spectral characteristics in
the same time period as the behavioral ETI suggests that those changes may be a use-
ful index of behavioral incapacitation. The differences in degree of EEG change in the
ETI period and the period following ETI further suggest an objective rationale for
separating the behavioral impairments after irradiation into a period of total incapac-
itation, the ETI period, and a period of performance decrement after the ETI.
A subsidiary objective of this experiment was to investigate the relationship of
systemic blood pressure to EEG and behavioral change. These measures were ob-
tained on only four of the monkeys. There was a consistent drop in blood pressure
and pulse pressure shortly after irradiation and these measures never quite achieved
preirradiation values thereafter. These results were consistent with the findings of
Turbyfill et al. Why that group of monkeys not showing an ETI within 15 minutes
after the pulse should exhibit a greater drop in blood pressure than the group showing
an ETI within that time period is not known. The non-ETI group did have a larger
heart rate increase at this time and thus perhaps better maintained cardiac output.
The lack of a close correlation between blood pressure changes and behavioral changes
can be seen in Figure 3A and G where performance deteriorated badly 40 minutes
after the pulse, but systemic blood pressure and pulse pressure stayed at lowered
levels from ETI to the end of the session. Cardiovascular changes did not appear to
follow EEG changes as can be seen in Figure 3C-G.
V. SUMMARY
In summary, a means of EEG analysis which allows quantitative measurement
of EEG changes as a function of the ETI period has been devised. When this type of
30
analysis plus correlational techniques now being worked out are applied to subcortical
EEG records as well as to the cortical signals, the probability rises that EEG indices
of correct or incorrect response types can be found. In addition, refinements are
being made in the cardiovascular measurements which may reveal cerebral blood flow
changes associated with EEG and/or behavioral changes. The additional subcortical
placements will also permit mapping the relative radios ens it ivity of brain regions,
thus providing clues to the mode of action of radiation on the central nervous system
and to possible behavioral consequences of such regional radios ens itivity.
31

REFERENCES
1. Adey, W. R. and Schoenbrun, R. L. Irradiation effects on brain wave correlates of conditioned behavior. Los Angeles, California, University of California, Department of Anatomy and Brain Research Institute, [Final Report U. S. Atomic Energy Comission Contract AT (ll-l)-34] UCLA-34P60, 1966.
2. Arnold, A. Effects of x-irradiation on the hypothalamus: A possible explanation for the therapeutic benefits following x-irradiation of the hypophysial region for pituitary dysfunction. J. Clin. Endocrinol. 14:859-868, 1954.
3. Arnold, A. , Bailey, P. and Harvey, R. A. Intolerance of the primate brainstem and hypothalamus to conventional and high energy radiations. Neurology 4:575-585, 1954.
4. Arnold, A., Bailey, P., Harvey, R. A., Haas, L. L. and Laughlin, J. S. Changes in the central nervous system following irradiation with 23-mev x-rays from the betatron. Radiology 62:37-46, 1954.
5. Brooks, P. M. The prompt effects of whole-body irradiation at a high dose rate on the electroencephalogram of monkeys. Radiation Res. 4:206-216, 1956.
6. Carmeci, P., Davis, W. F. , Jr., Dixon, D. F. , Jr. and De Young, D. W. Implantation of ECG electrodes, EEC electrodes and temperature thermistors in the monkey (Macaca mulatta). Bethesda, Maryland, Armed Forces Radio- biology Research Institute Technical Note TN67-6, 1967.
7. Carsten, A. L. II. Irradiation and functional changes. In: Pathogenesis of X-irradlation effects in the monkey cerebral cortex. Brain Res. 7:5-27, 1968.
8. Caster, W. O., Redgate, E. S. and Armstrong, W. D. Changes in the central nervous system after 700 R total-body X-irradiation. Radiation Res. 8:92- 97, 1958.
9. Caveness, W. F. VI. Discussion. In: Pathogenesis of X-irradiation effects in the monkey cerebral cortex. Brain Res. 7:110-115, 1968.
10. Caveness, W. F., Roizin, L. , Carsten, A. and Schade, J. P. Early and late effects of X-irradiation on the cerebral cortex of the monkey. Trans. Am. Neurol. Assoc. 89:126-127, 1964.
11. Caveness, W. F., Roizin, L., Carsten, A. and Schade, J. P. The effects of x-irradiation on the cerebral cortex of the monkey. Trans. Am. Neurol. Assoc. 92:188-193, 1967.
32

12. Caveness, W. F., Roizin, L., Innes, J. R. M. and Carsten, A. Delayed effects of x-irradiation on the central nervous system of the monkey. In: Response of the Nervous System to Ionizing Radiation, pp. 448-475. Haley, T. J. and Snider, R. S., editors. Boston, Massachusetts, Little, Brown and Company, 1964.
13. Chatrian, G. E., White, L. E., Jr. and Daly, D. Electroencephalographic pat- terns resembling those of sleep in certain comatose states after injuries to the head. Electroenceph. Clin. Neurophysiol. 15:272-280, 1963.
14. Gangloff, H. and Haley, T. J. Effects of X-irradiation on spontaneous and evoked brain electrical activity in cats. Radiation Res. 12:694-704, 1960.
15. Garcia, J., Buchwald, N. A., Bach-y-Rita, G., Feder, B. H. and Koelling, R. A. Electroencephalographic responses to ionizing radiation. Science 140:289- 290, 1963.
16. Graham, E. S., Farrer, D. N., Carsten, A. L. and Roizin, L. Decrements in visual acuity of rhesus monkeys (Macaca mulatta) as a delayed effect of occip- ital cortex irradiation. Radiation Res. 45:373-383, 1971.
17. Herrmann, R. W., Kaplan, S. J., White, R. K. and Davis, W. F., Jr. Sleep profiles of the monkey as affected by gamma-neutron radiation. Bethesda, Maryland, Armed Forces Radiobiology Research Institute Scientific Report SR68-14, 1968.
18. Ibrahim, M. Z. M., Haymaker, W., Miquel, J. andRiopelle, A. J. Effects of radiation on the hypothalamus in monkeys. Arch. Psychiat. Nervenkr. 210: 1-15, 1967.
■
19. Innes, J. R. M. and Carsten, A. Delayed effects of localized x-irradiation of the nervous system of experimental rats and monkeys. In: Fundamental Aspects of Radiosensitivity. Report of Symposium held June 5-7, 1961, BNL-675. Brookhaven Sympos. Biol. 14:200-203, 1961.
20. Jenkins, G. M. and Watts, D. G. Spectral Analysis and its applications. San Francisco, Cambridge, London, Amsterdam, Holden-Day, 1968.
21. Kiloh, L. G. and Osselton, J. W. Clinical Electroencephalography. London, Butterworths, 1961.
22. Monnier, M. and Krupp, P. Early action of gamma radiations on electrical brain activity and behavior in the rabbit. Exptl. Neurol. 3:419-431, 1961.
33

23. Nair, V., Sugano, H. and Roth, L. J. Recovery of central nervous system func- tions impaired by lethal head X-irradiation. Proc. Soc. Exptl. Biol. Med. 112:273-277, 1963.
24. Ono, Y., Tsuya, A. and Kawakami, M. Effects of head irradiation on paradoxi- cal sleep (EEG afterreaction) in the rabbit. Radiation Res. 38:365-378, 1969.
25. Roizin, L. III. Histopathologic findings. In: Pathogenesis of X-irradiation effects in the monkey cerebral cortex. Brain Res. 7:28-58, 1968.
26. Roizin, L. and Schade, J. P. V. Ultrastructural findings. In: Pathogenesis of X-irradiation effects in the monkey cerebral cortex. Brain Res. 7:87-109, 1968.
27. Ross, J. A. T., Leavitt, S. R., Hoist, E. A. and Clemente, C. D. Neurological and electroencephalographic effects of x-irradiation of the head in monkeys. Arch. Neurol. Psychiat. 71:238-249, 1954.
28. Sams, C. F., Aird, R. B., Adams, G. , Ellman, G. and Endo, S. A functional response of the central nervous system to low-level irradiation. Trans. Am. Neurol. Assoc. 89:128-132, 1964.
29. Sams, C. F., Endo, S., Aird, R. B., Adams, G. D. and Ellman, G. L. Func- tional response of the central nervous system of dogs to low-level irradiation. Acta Radiol. (Therapy) 5:177-184, 1966.
30. Schade', J. P. and Caveness, W. F. IV. Alteration in dendritic organization. In: Pathogenesis of X-irradiation effects in the monkey cerebral cortex. Brain Res. 7:59-86, 1968.
31. Silverman, D. Retrospective study of the EEG in coma. Electroenceph. Clin. Neurophysiol. 15:486-503, 1963.
32. Tsuya, A. The effects of cobalt-60 (gamma radiation) on the central nervous system electroencephalographic and pathological studies with recently intro- duced techniques. Final Report on grant # DA-CRD-AG-S92-544-64-G24. U. S. Army Research and Development Group (9984) (Far East), 1965.
33. Turbyfill, C. L., Roudon, R. M. and Kieffer, V. A. Behavior and physiology of the monkey (Macaca mulatta) following 2500 rads of pulsed mixed gamma- neutron radiation. Bethesda, Maryland, Armed Forces Radiobiology Research Institute Scientific Report SR71-10, 1971.
34

34. Uzzell, B. P. and Sheer, D. E. Decreases in 40-Hz EEG activity in the olfac- tory bulb following y-irradiation of the cat. Radiation Res. 46:343-352, 1971.
35. Yanson, Z. A. Electrophysiological study of changes occurring in conditioned- reflex activity of rabbits after total and partial exposure to x-rays. Oak Ridge, Tennessee, U. S. Atomic Energy Commission, Technical Information Service, AEC-tr-3661 (Book 1), Biology and Medicine, pp. 40-50, 1959.
36. Zeman, W. Radiosensitivities of nervous tissues. In: Fundamental Aspects of Radiosensitivity. Report of Symposium held June 5-7, 1961, BNL-675. Brookhaven Sympos. Biol. 14:176-199, 1961.
35

DISTRIBUTION LIST AIR FORCE
The Surgeon General, U. S. Department of the Air Force, Washington, D. C. 20314 (1) Executive Officer, Director of Professional Services, Office of the Surgeon General, Hq. USAF (AFMSPA),
Washington, D. C. 20314 (1) Headquarters, U. S. Air Force (AFMSPAB), Washington, D. C. 20314 (1) Office of the Command Surgeon (ADCSG), Hq. Aerospace Defense Command, USAF, Ent AFB, Colorado 80912 (1) Air Force Weapons Laboratory, ATTN: WLIL (1), ATTN: WLRB-2 (1), Kirtland AFB, New Mexico 87117 (2) Chief, Nuclear Medicine Department, P. O. Box 5088, USAF Hospital, Wright-Patters on AFB, Ohio 45433 (1) Chief, Radiobiology Division (RA), USAF School of Aerospace Medicine, Aerospace Medical Division (AFSC),
Brooks AFB, Texas 78235 (2) USAFSAM, ATTN: EDAD, Brooks AFB, Texas 78235 (1)
ARMY
The Surgeon General, U. S. Department of the Army, Washington, D. C. 20314 (1) Surgeon General, ATTN: MEDDH-N, U. S. Department of the Army, Washington, D. C. 20314 (1) Commandant, U. S. Army Chemical Center and School, ATTN; AJMCL-T, Fort MoClellan, Alabama 36201 (1) USACDC CSSG, Doctrine Division, Fort Lee, Virginia 23801 (1) Commanding Officer, U. S. Army Combat Developments Command, Institute of Nuclear Studies, Fort Bliss, Texas
79916 (1) CG, USCONARC, ATTN: ATUTR-TNG (NBC), Fort Monroe, Virginia 23351 (1) Commanding General, U. S. Army Electronics Command, ATTN: AMSEL-GG-TD, Fort Monmouth, New Jersey
07703 (1) Nuclear Branch AMCRD-DN-RE, U. S. Army Materiel Command, Washington, D. C. 20315 (1) Commanding Officer, U. S. Army Medical Research Laboratory, Fort Knox, Kentucky 40121 (1) U. S. Military Academy, ATTN: Document Library, West Point, New York 10996 (1) Commanding Officer, USA Nuclear Medical Research Detachment, Europe, APO New York, N. Y. 09180 (2) Army Research Office, ATTN: Chief, Scientific Analysis Branch, Life Sciences Division, 3045 Columbia Pike,
Arlington, Virginia 22204 (1) Division of Nuclear Medicine, Walter Reed Army Institute of Research, Walter Reed Army Medical Center,
Washington, D. C. 20012 (5) Commanding Officer, U. S. Army Environmental Hygiene Agency, ATTN: USAEHA-RP, Edgewood Arsenal,
Maryland 21010 (1) Commandant, U. S. Army Medical Field Service School, ATTN: MEDEW-ZNW, Fort Sam Houston, Texas 78234 (1)
NAVY
Chief, Bureau of Medicine and Surgery, U. S. Navy Department, Washington, D. C. 20390 (1) Chief, Bureau of Medicine and Surgery, ATTN: Code 71, U. S. Navy Department, Washington, D. C. 20390 (1) Commanding Officer, Naval Aerospace Medical Institute, U. S. Naval Aviation Medical Center, ATTN: Director of
Research, Pensacola, Florida 32512 (3) Head, Animal Behavioral Sciences Branch, Naval Aerospace Medical Institute, Naval Aerospace Medical Center,
ATTN: Dr. John S. Thach, Jr. , Pensacola, Florida 32512 (1) Commanding Officer, Nuclear Weapons Training Center, Atlantic, Nuclear Warfare Department, Norfolk, Virginia
23511 (1) Commanding Officer, Nuclear Weapons Training Center, Pacific, U. S. Naval Air Station, North Island, San Diego,
California 92135 (1) Commanding Officer, Naval Submarine Medical Center, Naval Submarine Base, NL, ATTN: Medical Library,
Groton, Connecticut 06340 (1) Commanding Officer, Naval Submarine Medical Center, Naval Submarine Base, NL, ATTN: Code 53, Nuclear Medi-
cine Training Division, Groton, Connecticut 06340 (1)
D. O. D.
Director, Defense Nuclear Agency, Washington, D. C. 20305 (1) Director, Defense Nuclear Agency, ATTN: DDST, Washington, D. C. 20305 (1) Director, Defense Nuclear Agency, ATTN: Mr. P. H. Haas, DDST, Washington, D. C. 20305 (1) Director, Defense Nuclear Agency, ATTN: Technical Library (APTL), Washington, D. C. 20305 (2) Commander, Field Command, Defense Nuclear Agency, ATTN: FC Technical Library, Kirtland AFB, New Mexico
87117 (1) Commander, Headquarters Field Command, Defense Nuclear Agency, ATTN: FCTG8, Kirtland AFB, New Mexico
87117 (2) Director, Armed Forces Institute of Pathology, Washington, D. C. 20305 (1) Administrator, Defense Documentation Center, Cameron Station, Bldg. 5, Alexandria, Virginia 22314 (12)
37

OTHER GOVERNMENT
U. S. Atomic Energy Commission, Headquarters Library, Reports Section, Mail Station G-17, Washington, D. C. 20545 (1)
U. S. Atomic Energy Commission, Division of Biology and Medicine, Washington, D. C. 20545 (1) U. S. Atomic Energy Commission, Bethesda Technical Library, 7920 Norfolk Avenue, Bethesda, Maryland 20014 (1) National Aeronautics and Space Administration, Manned Spacecraft Center, ATTN: Dr. R. E. Benson, Code DD63,
Houston, Texas 77058 (1) National Aeronautics and Space Administration, Manned Spacecraft Center, ATTN: Dr. B. D. Newsom, Code DB4,
Houston, Texas 77058 (1) National Library of Medicine, Bethesda, Maryland 20014 (1) U. S. Public Health Service, Bureau of Radiological Health, Division of Biological Effects, 12720 Twinbrook Park-
way, Rockville, Maryland 20852 (1) U. S. Public Health Service, Bureau of Radiological Health, Library, 12720 Twinbrook Parkway, Rockville, Mary-
land 20852 (1) U. S. Public Health Service, Northeastern Radiological Health Laboratory, 109 Holton Street, Winchester, Massa-
chusetts 01890 (1) U. S. Public Health Service, Southeastern Radiological Health Laboratory, P. O. Box 61, Montgomery, Alabama
36101 (1) U. S. Public Health Service, Southwestern Radiological Health Laboratory, P. O. Box 15027, Las Vegas, Nevada
89114 (1)
OTHER
Argonne National Laboratory, Library Services Department, Report Section Bldg. 203, RM-CE-125, 9700 South Cass Avenue, Argonne, Illinois 60440 (1)
Boeing Company Aerospace Library, ATTN: 8K-38 Ruth E. Peerenboom, P. O. Box 3999, Seattle, Washington 98124 (2)
Dr. J. T. Brennan, Radiology Department, University of Pennsylvania, 3400 Spruce Street, Philadelphia, Pennsyl- vania 19104 (1)
Brookhaven National Laboratory, Information Division, ATTN: Research Library, Upton, Long Island, New York 11973 (2)
Dr. J. S. Burkle, Director of Nuclear Medicine, York Hospital, York, Pennsylvania 17403 (1) University of California, Lawrence Radiation Laboratory, Library, Bldg. 50, Room 134, Berkeley, California
94720 (1) Director, Radiobiology Laboratory, University of California, Davis, California 95616 (1) University of California, Lawrence Radiation Laboratory, Technical Information Division Library L-3, P. O. Box
808, Livermore, California 94551 (2) University of California, Laboratory of Nuclear Medicine and Radiation Biology, Library, 900 Veteran Avenue,
Los Angeles, California 90024 (1). Cdr. William H. Chapman, USN (Ret.), Bio-Medical Division L-523, Lawrence Radiation Laboratory, University
of California, P. O. Box 808, Livermore, California 94551 (1) Director, Collaborative Radiological Health Laboratory, Colorado State University, Fort Collins, Colorado 80521 (1) Dr. L. W. Davis, Radiology Department, University of Pennsylvania, 3400 Spruce Street, Philadelphia, Pennsyl-
vania 19104 (1) Dr. T. C. Evans, Radiation Research Laboratory, College of Medicine, University of Iowa, Iowa City, Iowa 52240 (1) Mr. Orin Gelderloos, Division of Literature, University of Michigan, Dearborn Campus, Dearborn, Michigan 48124 (1) General Dynamics/Fort Worth, ATTN: Librarian, P. O. Box 748, Fort Worth, Texas 76101 (1) Gulf General Atomic Incorporated, ATTN: Library, P. O. Box 608, San Diego, California 92112 (1) I IT Research Institute, ATTN: Document Library, 10 West 35th Street, Chicago, Illinois 60616 (1) Los Alamos Scientific Laboratory, ATTN: Report Librarian, P. O. Box 1663, Los Alamos, New Mexico 87544 (1) Director, Nuclear Science Center, Louisiana State University, Baton Rouge, Louisiana 70803 (2) Lovelace Foundation for Medical Education and Research, Document Library, 5200 Gibson Boulevard, S. E. ,
Albuquerque, New Mexico 87108 (1) Dr. Ross A. McFarland, Guggenheim Professor of Aerospace Health and Safety, Harvard School of Public Health,
665 Huntington Avenue, Boston, Massachusetts 02115 (1) Dr. J. I. Marcum, Rand Corporation, 1700 Main Street, Santa Monica, California 90401 (1) Massachusetts Institute of Technology, M. I. T. Libraries, Technical Reports, Room 14 E-210, Cambridge, Massa-
chusetts 02139 (1) Dr. Harvey M. Patt, Laboratory of Radiobiology, University of California, San Francisco Medical Center, San
Francisco, California 94122 (1)
38
OTHER (continued)
Purdue University, Nuclear Engineering Library, Lafayette, Indiana 47907 (1) Dr. S. M. Reichard, Director, Division of Radiobiology, Medical College of Georgia, Augusta, Georgia 30902 (1) University of Rochester, Atomic Energy Project Library, P. O. Box 287, Station 3, Rochester, New York 14620 (1) Dr. H. H. Rossi, 630 West 168th Street, New York, N. Y. 10032 (1) Dr. E. L. Saenger, Director, Radioisotope Laboratory, Cincinnati General Hospital, Cincinnati, Ohio 45229 (1) Sandia Corporation Library, P. O. Box 5800, Albuquerque, New Mexico 87115 (1) Scope Publications, Franklin Station, P. O. Box 7407, Washington, D. C. 20004 (1) Texas A. and M. University, Radiation Biology Laboratory, Texas Engineering Experiment Station, College Station,
Texas 77840 (2) Texas Nuclear Corporation, ATTN: Director of Research, Box 9267 Allandale Station, Austin, Texas 78756 (1) Western Reserve University, Department of Radiology, Division of Radiation Biology, Cleveland, Ohio 44106 (1) Mr. Lionel Zamore, 601 Brightwater Court, Brooklyn, New York 11235 (1)
FOREIGN
International Atomic Energy Agency, Karntnerring 11, Vienna I, 1010, Austria (1) National Lending Library for Science and Technology, Boston Spa, Yorkshire, England (1) Directorate of Medical and Health Services, FAF (Federal Armed Forces), Bonn, Ermekeilstrasse 27, West
Germany (1) Abteilung fiir Strahlenbiologie im Institut fiir Biophysik der Universitat Bonn, 53 Bonn-Venusberg, Annaberger Weg
15, Federal Republic of Germany (2) Prof. Dr. H. Langendorff, Direktor des Radiologischen Instituts der Universitat, 78 Freiburg im Breisgau, Albert-
strasse 23, Germany (1) Priv.-Doz. Dr. O. Messerschmidt, Radiologisches Institut der Universitat, 78 Freiburg im Breisgau, Albertstrasse
23, Germany (1) Dr. Helmut Mitschrich, Sanitatsamt der Bundeswehr, 53 Bonn-Beuel, Zingsheimstrasse 5, Germany (2) Prof. Dr. F. Wachsmann, Gesellschaft fiir Strahlenforschung m.b. H., 8042 Neuherberg bei Mimchen, Institut fiir
Strahlenschutz, Ingolstadter Landstrasse 1, Miinchen, Germany (1) Col. Joachim Emde, Direktor, Spezialstab ATV, ABC-und Selbstschutzschule, 8972 Sonthofen 2/Allgau, Berghofer-
strasse 17, West Germany (1) Puerto Rico Nuclear Center, ATTN: Reading Room, College Station, Mayaguez, Puerto Rico 00708 (2)
39
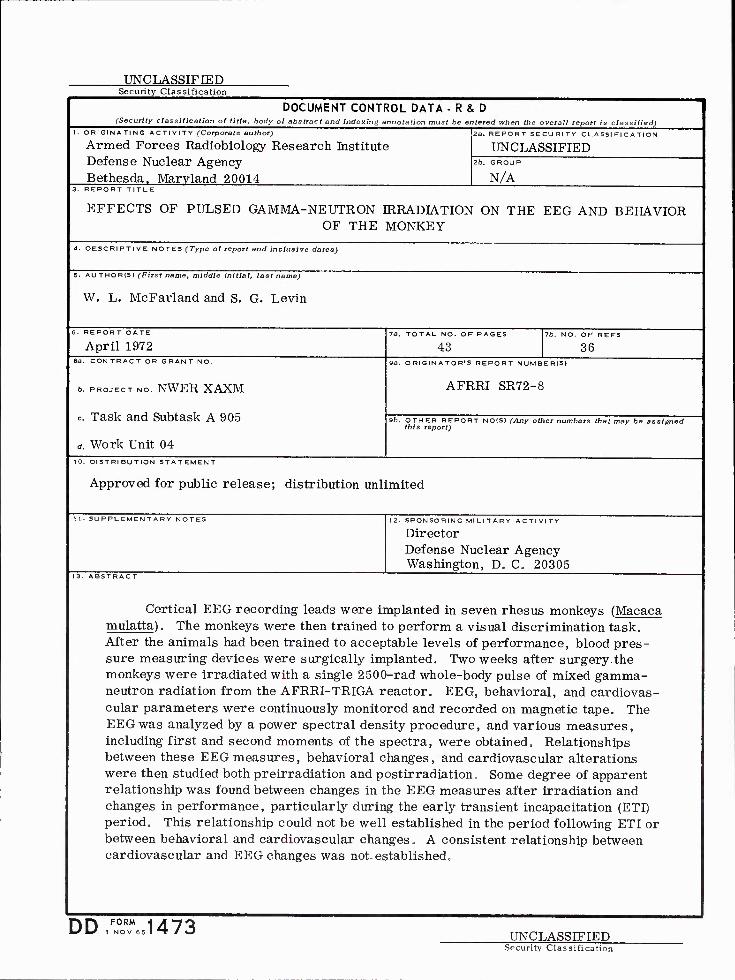
UNCLASSIFIED Security Classification
DOCUMENT CONTROL DATA -R&D (Security classification of title, body of abstract and indexing annotation must be entered when the overall report is classified)
1. ORIGINATING A c Tl VI T Y fCorporafe au(hor)
Armed Forces Radiobiology Research Institute Defense Nuclear Agency Bethesda. Maryland 20014
2e. REPORT SECU Rl TY CLASSIFICATION
UNCLASSIFIED 2b, GROUP
N/A 3. REPORT TITLE
EFFECTS OF PULSED GAMMA-NEUTRON IRRADIATION ON THE EEC AND BEHAVIOR OF THE MONKEY
A. DESCRIPTIVE NOTES (Type of report and inclusive dates)
5- AUTHOR(S) (FitOt name, middle initial, last name)
W. L. McFarland and S. G. Levin
6- REPOR T D A TE
April 1972 7a. TOTAL NO. OF PAGES
43 7b. NO. OF REFS
36 ia. CONTRACT OR GRANT NO.
6. PROJECT NO. NWER XAXM
c. Task and Subtask A 905
d. Work Unit 04
9a. ORIGINATOR'S REPORT NUMBER(S)
AFRRI SR72-8
9b. OTHER REPORT NO(S) (Any other numbers that may be assigned this report)
10. DISTRIBUTION STATEMENT
Approved for public release; distribution unlimited
11. SUPPLEMENTARY NOTES 12- SPONSORING MILITARY ACTIVITY
Director Defense Nuclear Agency Washington, De Ce 20305
13. ABSTRACT
Cortical EEG recording leads were implanted in seven rhesus monkeys (Macaca mulatta). The monkeys were then trained to perform a visual discrimination task. After the animals had been trained to acceptable levels of performance, blood pres- sure measuring devices were surgically implanted. Two weeks after surgery the monkeys were irradiated with a single 2500-rad whole-body pulse of mixed gamma- neutron radiation from the AFRRI-TRIGA reactor. EEG, behavioral, and cardiovas- cular parameters were continuously monitored and recorded on magnetic tape. The EEG was analyzed by a power spectral density procedure, and various measures, including first and second moments of the spectra, were obtained. Relationships between these EEG measures, behavioral changes, and cardiovascular alterations were then studied both preirradiation and postirradiation. Some degree of apparent relationship was found between changes in the EEG measures after irradiation and changes in performance, particularly during the early transient incapacitation (ETI) period. This relationship could not be well established in the period following ETI or between behavioral and cardiovascular changes. A consistent relationship between cardiovascular and EEG changes was not.established.
DD FORM 1473 UNCLASSIFIED Security Classification