Effects of Physical Aging at Elevated Temperatures on the ... · with classical lamination theory....
40
NASA Technical Memorandum 109114 •//J-_G /3 72-z- The Effects of Physical Aging at Elevated Temperatures on the Viscoelastic Creep of IM7/K3B Thomas S. Gates Langley Research Center, Hampton, Virginia Mark Feldman Old Dominion University, Norfolk, Virginia Junel_4 (NASA-TM-IO9114) THE EFFECTS OF PHYSICAL AGING AT ELEVATED TEMPERATURES ON THE VISCOELASTIC CREEP ON IMT/K3B (NASA. Langley Research Center) 3_ p N94-34396 Unclas G3/26 0013722 National Aeronautics and Space Administration Langley Research Center Hampton, Virginia 23681-0001 https://ntrs.nasa.gov/search.jsp?R=19940029890 2020-05-15T04:14:43+00:00Z
Transcript of Effects of Physical Aging at Elevated Temperatures on the ... · with classical lamination theory....
NASA Technical Memorandum 109114
•//J-_G
/3 72-z-
The Effects of Physical Aging at ElevatedTemperatures on the Viscoelastic Creepof IM7/K3B
Thomas S. Gates
Langley Research Center, Hampton, Virginia
Mark Feldman
Old Dominion University, Norfolk, Virginia
Junel_4
(NASA-TM-IO9114) THE EFFECTS OFPHYSICAL AGING AT ELEVATED
TEMPERATURES ON THE VISCOELASTIC
CREEP ON IMT/K3B (NASA. Langley
Research Center) 3_ p
N94-34396
Unclas
G3/26 0013722
National Aeronautics and
Space Administration
Langley Research Center
Hampton, Virginia 23681-0001
https://ntrs.nasa.gov/search.jsp?R=19940029890 2020-05-15T04:14:43+00:00Z

k_
=111

Abstract
Physical aging at elevated temperature of the advanced composite IM7/K3B
was investigated through the use of creep compliance tests. Testing consisted
of short term isothermal, creep/recovery with the creep segments performed at
constant load. The matrix dominated transverse tensile and in-plane shear
behavior were measured at temperatui'es ranging from 200 to 230oc. Through
the use of time based shifting procedures, the aging shift factors, shift rates
and momentary master curve parameters were found at each temperature.
These material parameters were used as input to a predictive methodology,
which was based upon effective time theory and linear viscoelasticity combined
with classical lamination theory. Long term creep compliance test data wascompared to predictions to verify the method. The model was then used to
predict the long term creep behavior for several general laminates.
KEY WORDS: Polymeric composites, physical aging, creep, viscoelasticity

Introduction
Strength, stiffness and weight considerations make polymer matrix
composites (PMC's) desirable for structural materials in such diverseapplications as aircraft, civil infrastructure and biomedical implants. One
common aspect shared by structural designers and material developers for all
these PMC applications is the concern for long term durability. Whenconsidering durability, adverse environmental conditions, high loads, elevated
temperature and fatigue may all play a role in determining the useful lifetime of
a PMC structure. To address these problems, accurate analytical predictive
methods and comprehensive material property characterization techniques areessential.
One material behavior which is ubiquitous to all polymeric materials isphysical aging. This type of aging is a thermoreversible process which occurs
due to the evolution of the free volume in a polymer toward thermodynamic
equilibrium after cooling below the glass transition temperature (TIz). Thisevolutionary process may be affected by many parameters includiffg
temperature, moisture and stress. Struik{ 1) showed that it was possible to
isolate the physical aging process in polymers from other behaviors by
performing isothermal creep compliance tests and using superposition
techniques to establish the aging related material constants. Linear
viscoelasticity was used to characterize the creep and the "effective time" theory
was developed to aid in predicting the long term creep compliance from shortterm test data.
It is the intent of this paper to utilize the test techniques and analysis tools
given by Struik(1), and adapt them to the elevated temperaturecharacterization of physical aging in an advanced graphite/thermoplastic PMC.
For the purposes of this research, short term was defined as tests spanning
approximately 3 decades of time whereas long term was defined as testsspanning approximately 5 decades. Material property testing consisted of short
term, isothermal, creep/recovery with the creep segments performed at
constant load. Both transverse tensile and in-plane shear behavior weremeasured. Through the use of time based shifting procedures, the aging shift
factors, shift rates and momentary master curve parameters were found at
each temperature.
These material parameters were used as input to a predictive methodology
given by Brinson and Gates(2) which was based upon effective time theory andlinear viscoelasticity combined with classical lamination theory. Long term
creep compliance test data were compared to predictions to verify the method.
2

The model was then used to predict the long term behavior for several generallaminates.
Traditionally, time/temperature superposition (TTSP] provides a method bywhich long term behavior can be predicted from short term tests, therebyproviding an accelerated test scheme. As described by Griffith et.al(3), TTSPhas a long history of use in viscoelastic characterization of materials and anumber of procedures have been proposed to arrive at the TTSP master curve.However, for long term creep, Struik's(1) work with polymers and more recentlytests on PMC's by Sullivan et.al(4) have shown that TTSP by itself is notsufficient to account for the long term effects of physical aging. This has led tothe development of the effective time theory as a way of predicting the effects ofphysical aging.
Material System
The PMC material used in this study was a continuous carbon fiber
reinforced, amorphous thermoplastic polyimide. The material was fabricated by
DuPont and designated IM7/K3B. The as received Tg was 240oc as measuredby Dynamic Mechanical Analyzer (DMA) G" peak. CHemical aging of the K3B
polymer was not expected to occur. For this study, it was therefore assumed
that the Tgof IM7/K3B would remain constant over the duration of thematerial characterization tests used in the current study.
All methods verification and material property tests utilized a rectangular
specimen of approximately 241mm x 25mm with a 12 or 8 ply thickness. Per
ply thickness was approximately .0135cm. The transverse and shear creep
compliance data came from [90] 12 and [+45]2 s specimen layups respectively.
Three to four replicates were used at each test temperature. Although all the
specimens came from the same material lot, many of the replicate specimens
were cut from different panels.
Test Procedures
Testing was performed to understand material behavior, develop material
constants for the analytical model and to provide verification of the predictive
model. This section will highlight some of the important test procedures.
Specific procedures and techniques relating to testing may also be found in
Feldman and Gates(3}.
Short Term Testing
The test temperatures selected for the study were 200 o, 208 o, 215 o, 225 o,
and 230oc. These temperatures were selected to ensure that measurable aging
3
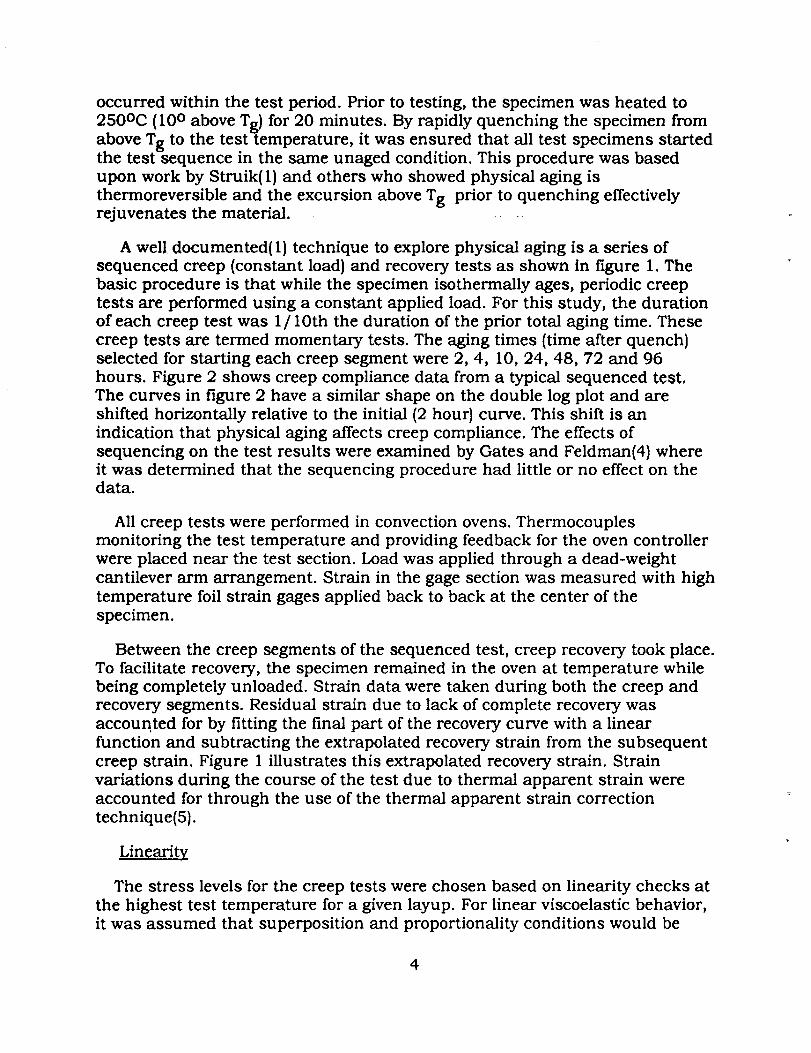
occurred within the test period. Prior to testing, the specimen was heated to250oc (10° above Tg] for 20 minutes. By rapidly quenching the specimen fromabove Tg to the test temperature, it was ensured that all test specimens startedthe test sequence in the same unaged condition. This procedure was basedupon work by Struik(1) and others who showed physical aging isthermoreversible and the excursion above Tg prior to quenching effectivelyrejuvenates the material.
A well documented(I] technique to explore physical aging is a series ofsequenced creep (constant load] and recovery tests as shown in figure 1. Thebasic procedure is that while the specimen isothermally ages, periodic creeptests are performed using a constant applied load. For this study, the durationof each creep test was 1/10th the duration of the prior total aging time. Thesecreep tests are termed momentary tests. The aging times {time after quench]selected for starting each creep segment were 2, 4, 10, 24, 48, 72 and 96
hours. Figure 2 shows creep compliance data from a typical sequenced test.
The curves in figure 2 have a similar shape on the double log plot and are
shifted horizontally relative to the initial {2 hour] curve. This shift is an
indication that physical aging affects creep compliance. The effects of
sequencing on the test results were examined by Gates and Feldman(4) whereit was determined that the sequencing procedure had little or no effect on thedata.
All creep tests were performed in convection ovens. Thermocouples
monitoring the test temperature and providing feedback for the oven controller
were placed near the test section. Load was applied through a dead-weight
cantilever arm arrangement. Strain in the gage section was measured with high
temperature foil strain gages applied back to back at the center of the
specimen.
Between the creep segments of the sequenced test, creep recovery took place.
To facilitate recovery, the specimen remained in the oven at temperature while
being completely unloaded. Strain data were taken during both the creep andrecovery segments. Residual strain due to lack of complete recovery was
accounted for by fitting the final part of the recovery curve with a linear
function and subtracting the extrapolated recovery strain from the subsequent
creep strain. Figure 1 illustrates this extrapolated recovery strain. Strain
variations during the course of the test due to thermal apparent strain were
accounted for through the use of the thermal apparent strain correction
technique(S].
Linearit¥
The stress levels for the creep tests were chosen based on linearity checks at
the highest test temperature for a given layup. For linear viscoelastic behavior,
it was assumed that superposition and proportionality conditions would be
4
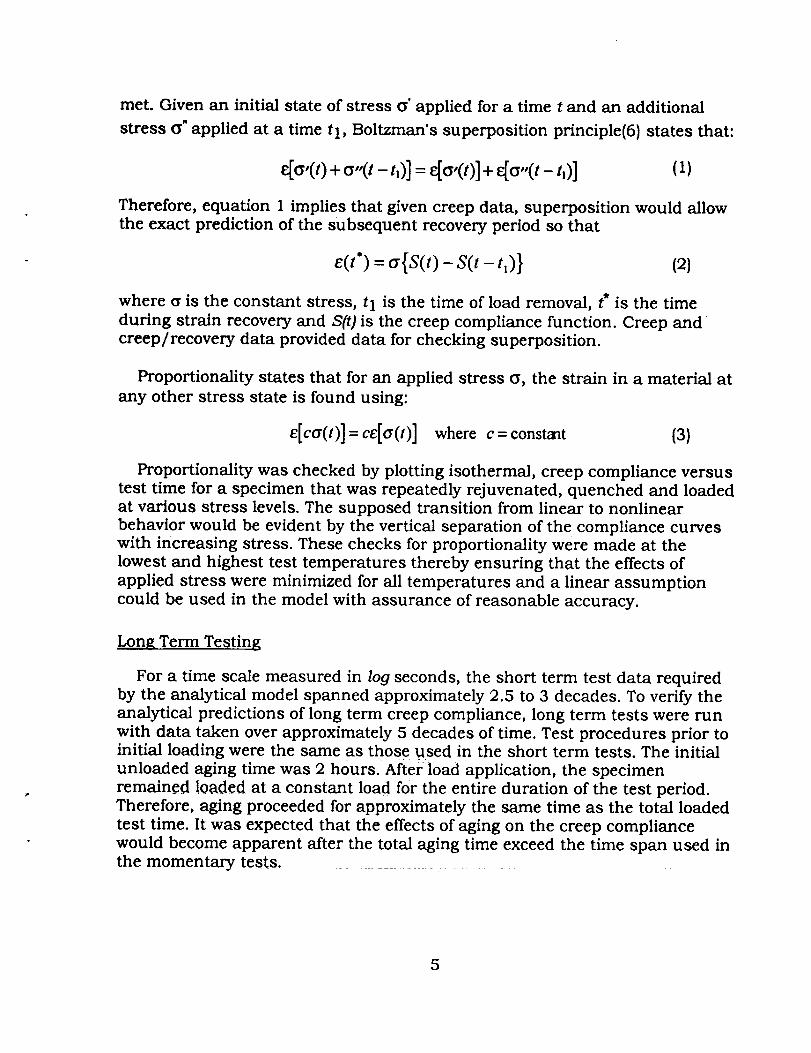
met. Given an initial state of stress a' applied for a time t and an additional
stress ¢_" applied at a time tl, Boltzman's superposition principle(6) states that:
+ - t,)]= + - t,)] (1)
Therefore, equation 1 implies that given creep data, superposition would allow
the exact prediction of the subsequent recovery period so that
e(t °) = cr {S(t) - S(t - tl) } (2)
where 6 is the constant stress, t I is the time of load removal, t* is the time
during strain recovery and S(t} is the creep compliance function. Creep and
creep/recovery data provided data for checking superposition.
Proportionality states that for an applied stress G, the strain in a material at
any other stress state is found using:
e[c(y(t)]=ce[ty(t)] where c=constmt (3)
Proportionality was checked by plotting isothermal, creep compliance versus
test time for a specimen that was repeatedly rejuvenated, quenched and loadedat various stress levels. The supposed transition from linear to nonlinear
behavior would be evident by the vertical separation of the compliance curves
with increasing stress. These checks for proportionality were made at the
lowest and highest test temperatures thereby ensuring that the effects of
applied stress were minimized for all temperatures and a linear assumption
could be used in the model with assurance of reasonable accuracy.
Long Term Testing
For a time scale measured in log seconds, the short term test data required
by the analytical model spanned approximately 2.5 to 3 decades. To verify the
analytical predictions of long term creep compliance, long term tests were run
with data taken over approximately 5 decades of time. Test procedures prior toinitial loading were the same as those used in the short term tests. The initial
unloaded aging time was 2 hours. Afterload application, the specimen
remained loaded at a constant load for the entire duration of the test period.Therefore, aging proceeded for approximately the same time as the total loaded
test time. It was expected that the effects of aging on the creep compliance
would become apparent after the total aging time exceed the time span used inthe momentary tests.
5

Analytical Model
An analytical model was developed(2) to predict the long term creep
compliance given the short term data as input. Defining "long term" as any
time greater than the time scale of the material property tests, it was expected
that the model would provide insights into the effects of physical aging on the
long term viscoelastic behavior of advanced polymeric composites.
Linear Viscoelastic Creep Compliance
The ability to satisfy Boltzman superposition and proportionality
requirements were the conditions necessary for linear viscoelastic behavior. In
general, the time dependent linear creep compliance was modeled with a three
parameter expression given by
S(t) = S ° e <'/_)_ (41
where S o, x, and 13are the initial compliance, retardation time and shape
parameter respectively.
Time Based SuDerposition
Time/aging-time superposition of the short term creep compliance test data
provided the means for the data to be collapsed into a single momentary
master curve (MMC) at each test temperature. As demonstrated by Struik(1}
and illustrated in figure 2, horizontal separation of the sequenced creep
compliance curves is due to aging and can be characterized by the aging shift
factor (-log a). This shift factor is simply defined as the horizontal distance
required to shift a compliance curve to coincide with a reference compliance
curve. A linear fit of all the shift factors versus the logarithmic aging time (log
te) for each MMC, gave the aging shift rate
d lo_, a= (5)
dlog t,
The reference compliance curve could be any of the sequenced curves, but
for convenience of data manipulation, the longest (96 hour) compliance curve
was selected as the reference during formation of the MMC. However, to
facilitate data reporting, all MMC parameters were referenced to the shortest (2
hour} compliance curve. For a horizontal (time) translation of a compliance
curve, only the retardation time pdrameter needs to be recalculated. Given the
aging shift rate and reference curve parameters, the translation from one aging
time to another was accomplished through the use of
6

(6)
where te_ is the reference aging time as given in Brinson and Gates(2).
Equation 5 implies a linear relation between log a and log te. Figure 3 shows
this relationship for one of the replicate tests used to establish the MMC's. The
shift factors for the data on figure 3 were found from the curves on figure 2 and
are representative of all the IM7/K3B MMC data.
To facilitate the collapse of the shifted data for the MMC, vertical(compliance] shifts were also utilized. These shifts were small in comparison to
the magnitude of the horizontal (time] shifts. This use of small vertical shifts in
reduction of PMC creep compliance/aging data was also reported by Sullivan
et.al(7) and Hastie et.al(8). A recent report by the authors(3) determined thatcombined horizontal and vertical shifts had little effect on the resulting shift
rates when compared to the shift rate found through horizontal shifting only.
Composite Physical Agin_
To provide the analytical model necessary to make long term creepcompliance predictions for PMC's, Brinson and Gates (2) developed a time
dependent form of laminated plate theory which incorporated Struik's(1]
effective time theory. For a single lamina under plane stress conditions, the
stress-strain relations for any fiber orientation are given in Jones(9) by
e_ = IS
7_
(7)
where eij and ¢_ij represent the strain and stress in the body axis directions and[S] is the transformed compliance matrix given by
where [T] is the transformation matrix and [S] is the compliance matrix
referenced to the material coordinate axis given by
IS,, S,2 J$22
0 $66
(9)
7
As demonstrated by Sullivan et.al(6) and Hastie et.al (7), the only time
dependent compliance terms in equation 9 are the transverse ($22) and shear
($66}. Therefore, using equation 4, the two time dependent terms are given as
0$22 (t) = f(Szv ]3-a, "¢z_(t, _,f ), #z_; t) (10)
0Sa6 (t) =f($66, fl_, "¢66(t,,,f ), ]_66; t) (11)
where terefiS the reference aging time.
For the laminated composite plate, the laminate compliance referenced to
the body axis are Sx, Sy, and Sxy which are found by using the laminacompliance terms given above arid the normal laminated plate theory as given
by Jones(9). Due to the time dependence of equations 10 and 11, the laminate
compliance will also be time dependent. The amount of time dependence and
the effects of aging will depend on the layup and therefore the relative
contributions of equations 10 and 11 to the total laminate compliance.
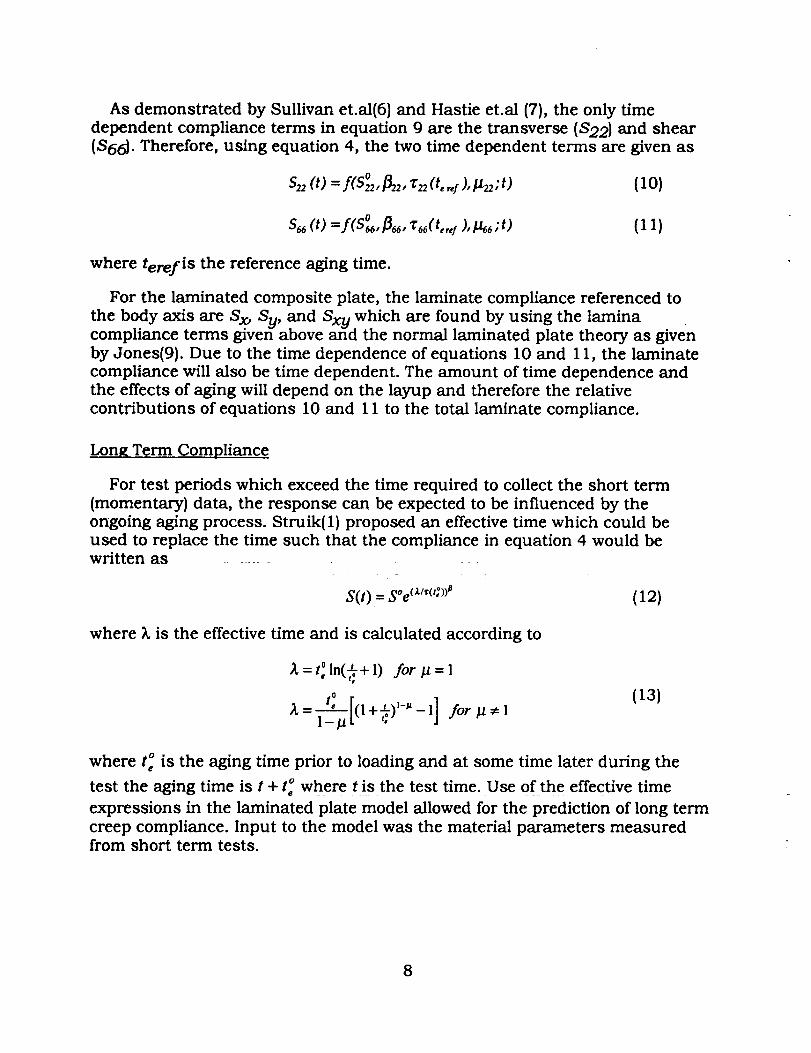
Long T.erm Compliance
For test periods which exceed the time required to collect the short term
(momentary) data, the response can be expected to be influenced by the
ongoing aging process. Struik(1) proposed an effective time which could be
used to replace the time such that the compliance in equation 4 would bewritten as
S(t) = S_'e (_'(':))p ( 1 2)
where _. is the effective time and is calculated according to
_,-t,- o ln(_ + 1) for ]_ = 1
t__2__"[{ 1o
= +-' _-" - 1] for #"I
J
(13)
where t 0 is the aging time prior to loading and at some time later during the
test the aging time is t 4- t ° where t is the test time. Use of the effective time
expressions in the laminated plate model allowed for the prediction of long term
creep compliance. Input to the model was the material parameters measured
from short term tests.
8

Results
Lincerity
Coincidence of the compliance curves in figures 4 and 5 indicated that stresscaused less than 15% variation in compliance on the log scale. In addition,
figures 4 and 5 show no clear trend in location of the curves in relation to the
applied stress. Based upon these results and the fact that the same applied
stress level was used at all temperatures, it was assumed that proportionality
was met for all tests. From data such as that shown in figure 6, it was also
assumed that the linear superposition condition was met for all tests. It was
recognized that the assumption of linear viscoelastic behavior based uponthese results might not be conclusive, however it was felt that deviations from
linearity were small enough to confidently proceed with the linear model. The
final applied stress levels chosen for the creep tests were 2.66 MPa and 6.81
MPa for the transverse and shear tests respectively.
Momentary Compliance Master Curves
As mentioned, three to four replicate specimens were used to generate the
isothermal momentary master curves (MMC's) for $22 and $66. The MMC
parameters (SO,z, _), given in table 1, were found by fitting equation 1 to the
combined data sets from all replicates. Figures 7-15 show the resultant MMC's
with selected error bars included to indicate the spread in the data. The
magnitude of these errors were less than. 18 GPa with most measured errors
significantly smaller than this. In general, the $66 (shear} compliance data was
better behaved than the $22 (transverse} data.
It should be noted that even though only one set of MMC parameters are
given in table 1, each of the replicate tests had their own shift rate (it) found
through the procedures described previously. Therefore, the shift rate given in
table 1 is an average value. The number of replicate tests and the standard
deviation of tt are also provided in table 1. The average shift rates are plotted
versus test temperature in figures 16 and 17 for the shear and transverse
compliance respectively. The data points in these figures were connected with asmooth curve to illustrate the trends.
r For comparison purposes, the resultant MMC's for each temperature are
plotted together in figures 18 and 19 for the transverse and shear compliance
respectively. The error bars of the previous figures were not included for clarity.
These curves represent the sum of all the short term sequenced creep
compliance data.
9
Time-Temperature Superpositi0n Master Curves
The isothermal MMC's for each compliance direction could also be collapsedby using time/temperature superposition (TTSP). Each set of isothermal MMC's(figures 18 and 19) was collapsed to coincide with the 200oc curve to form the
TTSP master curves shown in figures 20 and 21. The TTSP shift rates were
found from a linear fit to time shift factor (log_r) versus temperature. The shift
rates associated with each TTSP master curve were .059 and .049 (Iog(sec.)/oc)
for the transverse and shear compliance respectively. TTSP shift rates along
with the aging time shift rates (_) can be used in expressions such as those
given in Brinson and Gates (2) to aid in data reduction and interpretation.
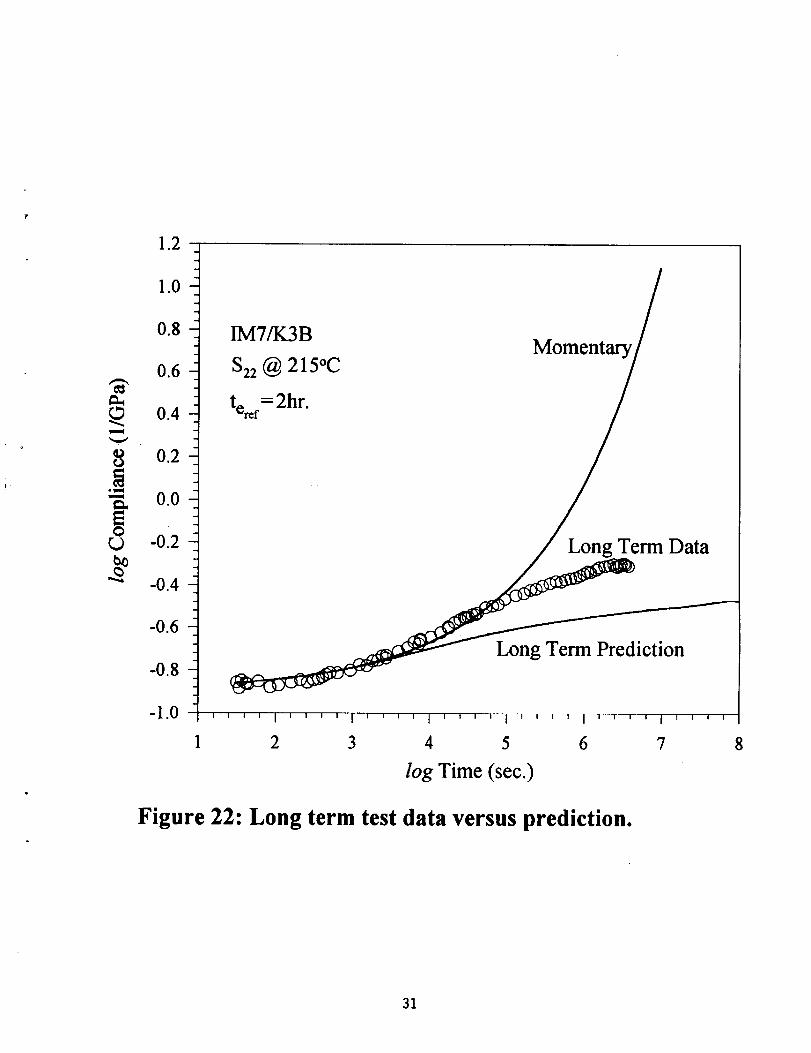
Methods Verification
Data from several long term (approximately 1200 hours) creep tests were
used to verify the predictive methodology. These data were compared to thelong term predictions made using the short term MMC data of table 1 and the
analytical methods outlined above. Figures 22-24 show data and predictions
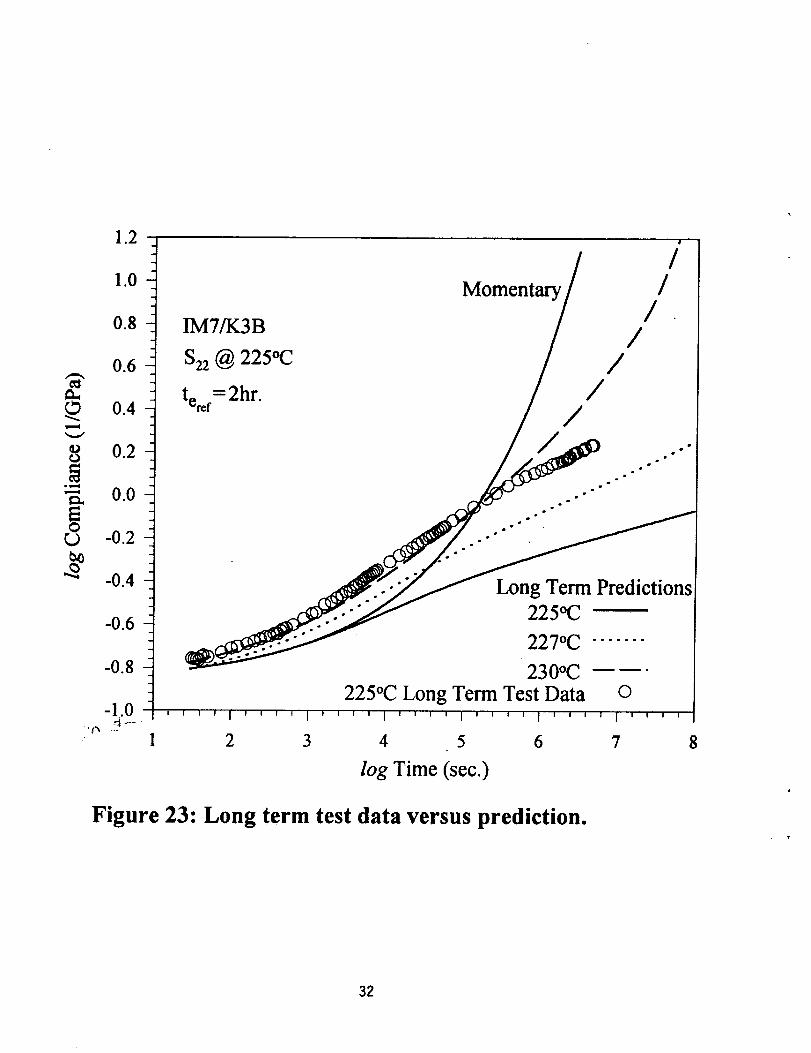
for transverse and shear creep compliance at 215 and 225oc. Figure 23
includes predictions at 225 °, 227 ° and 230oc to illustrate the temperature
sensitivity of long term creep when testing close to Tg. The momentary curvesin these figures were predicted from the short term data without accounting for
aging effects. The long term predictions relied upon the effective time theory tohandle the aging effects. To test beyond 7 decades would require over 3 months
and to test beyond 8decades wouId require over 3 years. THe facilities for such
long term tests were not available in this study.
Lon_ Term Predictions
The parameters in table 1 and the analytical model were used to predict the
effects of aging on the isothermal, constant load compliance of quasi-isotropic
and [+45/90]s laminated IM7/K3B plates. The compliancevalues in the
predictions were normalized to the initial value to show the relative changes.Predictions were made out to 8 decades oftime which is approximately 3.2
years.
Figure 25 shows predictions of Sg and Sxy for a quasi-isotropic laminate at225oc. This figure illustrates the diTferences-in the individual compliance terms
as well as the aging time dependent behavior of a fiber dominated laminate.
To demonstrate the predicted dependence on test temperature, figure 26
shows the long term behavior of Sy at 200, 215 and 225oc. Figure 27 showsthe dependence of long term creep compliance on laminate layup. In this
figure, Sy was predicted for a quasi-isotropic and a [+45/90], laminate at
10

215oc. The differences between a fiber versus matrix dominated layup areclearly evident.
Summary and Discussion
ErrQr Analysis
Replicate tests on specimens cut from different panels revealed specimen to
specimen scatter in the data. This is clearly demonstrated by the error bars offigures 7-15. However, as shown by Feldman and Gates(3}, repeat tests on the
same specimen generated only small deviations (less than 5%) in the results.
These results coupled with the strict adherence to test procedures and periodic
calibration of all test equipment leads to the belief that experimental errors
inherent in the data were minimized. The primary source of error in the data
was felt to be the panel-to-panel material inconsistencies. One additional factor
to note however, is that the material property tests and the long term
verification tests were run on different test stands. Consequently, slight
differences in specimen thermal profiles and temperature stability should beconsidered a source of data error.
Material Master Curves
The material momentary master curves of figures 18 and 19 show the clear
temperature dependency of short term creep compliance. The ordering of the
curves was as expected with the highest temperatures resulting in the highest
creep compliance. The directional dependency of the PMC is also evident by
noting the differences in the compliance between the transverse and sheartests.
Aging time shift rates found from the isothermal MMC's showed a clear
temperature dependency over the range investigated. As shown in figures 16
and 17, as test temperature approached Tg, the shift rate (_) decreased.Additional data over a wider range of temperatures would be required to
establish global maximums and minimums. At Tg, the polymer is inequilibrium and theoretically, a shift rate of zero would indicate a material
exhibiting no aging behavior. Although the shift rate was assumed constant
over time at a given temperature, results by Lee and McKenna(10) indicated
that a polymer may exhibit a change in shift rate as it ages into a equilibrium
state. However, to reach this condition would require a long aging time and/or
aging temperatures very close to Tg. Modeling of this time dependent change inshift rate and the implications in regards to the effective time theory were
explored in Brinson and Gates(2).
Collapsing the MMC's to form the TTSP master curves was performed using
horizontal shifts only. For the ideal case, these curves should collapse
11

completely. The scatter evident in figures 20 and 21 are due to the sources ofscatter in the MMC°s as explained above. Despite this scatter, the resultsdemonstrates that TTSP will work satisfactorily on short term data.
Predictive Model
The predictive model provided a means of analytically studying the effects of
physical aging on long term creep compliance. Figures 22-24 indicate that the
model does a good job of predicting the long term creep compliance from short
term data. All of these figures show the long term prediction to be lower than
the test data. Part of the differences between test and prediction may be due tothe material inconsistencies mentioned previously. Figure 23 illustrates that
the differences between test and prediction may also be due to slight variations
in test temperature. Comparing the momentary versus long term predictions in
figures 22-24 illustrates the large errors which would occur if predictions didnot include the effects of aging.
For the cases investigated to date, the coupling of linear viscoelasticity,
classical lamination theory and effective time theory has provided a good
predictive model for long term creep. Barfing the occurrence of creep ruptureor aging into equilibrium, it was not expected that creep compliance data
greater than 7 decades of time would deviate significantly from the trends
indicted in the data of figures 22-24. However, without actual data, the
complete verification of a prediction spanning years is not feasible.
Comparison of the analytical model to 1200 hour test data provided the
confidence to use the model for parametric studies such as shown in figures
25-27 for laminates under constant load and temperature. As indicated by
these figures, even a fiber dominated laminate may exhibit sensitivity of certain
material parameters to aging time and temperature.
12

References
[I] Struik, L.C.E., Physical Aging in Amorphous Polymers and Other Materials,
Elsevier Scientific Publishing Company, New York, 1978.
[2] BHnson, L. C. and Gates, T. S., "Effects of Physical Aging on Long-Term
Creep of Polymers and Polymer Matrix Composites.",NASA Langley Research
Center TM 109081, February, 1994.
[3] Griffith, W. I., Morris, D. H., and Brinson, H. F., "The Accelerated
Characterization of Viscoelastic Composite Materials," Virginia Tech Center for
Adhesion Science, VPI-E-80-15, Virginia Polytechnic Institute and State
University, April, 1980.
[4] Sullivan, J. L., Blais, E. J. and Houston, D., _Physical Aging in the Creep
Behavior of Thermosetting and Thermoplastic Composites," Composites Sci'eru_.and Technology, Vol. 47, 1993.
[5] Feldman, M. and Gates, T. S., "Physical Aging Above 200oc, '' SEM Spring
Conference, Society for Experimental Mechanics, Baltimore, Maryland, May,1994.
[6] Gates, T. S. and Feldman, M., "The Effects of Stress and Physical Aging
on the Creep Compliance of a Polymeric Composite," NASA Langley ResearchCenter TM 109047, November, 1993.
[7] Murry, W.M., and Miller, W.R., The Bonded Electrical Resistance Strain
Gage, Oxford University Press, New York, 1992.
[8] Ferry, J. D., Viscoelastic Properties of Polymers, 3rd Edition. John Wileyand Sons, Inc., New York. 3rd Edition, 1980.
[9] Hastie, R. L. and Morris, D. H., "The Effect of Physical Aging on the Creep
Response of a Thermoplastic Composite.", ASTM STP # 1174, High Temperature
and Environmental Effects in Polymer Matrix Composites, Editors, C. Harris andT. Gates, 1992.
[10] Jones, R. M., Mechanics of Composite Materials. Scripta Book Company,Washington, D.C. 1975.
[11] Lee, A. and McKenna, G.B., "The Physical Ageing Response of an Epoxy
Glass Subjected to Large Stresses," Polymer, Vol. 31, March, 1990.
13

Compl.
Term
$22
366
Temp.(°C}
200
208
215
225
230
200
208
215
225
S o
( 1 / GPa]
.133
.130
.127
• 134
.118
.238
.236
.239
.227
(sec.)
156347.
123003.
76897.
17588.
2829.
55550.
28874.
9186.
2404•
.423
.366
.315
.297
•231
.383
.362
.382
.301
.864
.927
•999
.876
.482
1.051
1.070
1.017
.928
(std. dev.)
• 139
.016
.030
.092
.068
.030
.030
.056
.082
|
number of
replicates
3
3
3
3
4
3
3
4
4
Table 1. Momentary master curve parameters for both the transverse
and shear creep compliance.
14

MAX,--
Stress
Aging Time
Recovery. >L Creep___
I I
Str
"_= extral:_ol_tedrecovery"i_-, - ..... _2 __
t
i
Time
Figure I: Schematic illustrating sequenced creep/recovery tests.
15

w--I
8
O
-0.30
-0.35
-0.40
-0.45
-0.50
-0.55
-0.60
IM7/K3B
S66 @ 215°C
Aging Time = 2hr
4hr lOhr
24hr48hr
' _ " ' I ' ' ' ' I ' ' J ' I
1 2 3 4
log Time (sec.)
" I | I I
Figure 2: Typical shear compliance momentary curves.
5
2.0
O,4,--I
o
1.0
0.5
IM71K3Bter_=2hr. @ 215°C
• = .930
/O -' ' ' I ' ' ' ' I ' ' ' ' I ' ' ' ' I ' ' ' '
0.5 1.0 1.5 2.0
log Aging Time (hr.)
2.5
16
Figure 3: Typical aging shift factor as a function of aging time.

8 -o.4
_ -0.5
-0.6
IM7/K3B
$66 @ 225°C
7.30 MPa
__ 6.39 MPa
5.48 MPa
4.47 MPa
3.65 MPa
.... I ' ' ' ° I ° '
1 2 3
log Time (see.)
Figure 4: Shear compliance proportionality check.
(3
[]
A
_7
<>
OI==,,=I
o
,w==l
O
-0.2
-0.4
-0.6
-0.8
IM7/K3B
522 @ 230°C
2.66 MPa
2.36 MPa
2.07 MPa
1.77 MPa
.... I ' ' ' ° L
1 2 3
log Time (sec.)
(3
[]
A
I I I I
Figure 5: Transverse compliance proportionality check.17
4

0.0007
0.0006
0.0005
0.0004
0.0002
0.0001
0.0000
IM7/K3B
822 @230°C
Prediction
Recovery Data ©
0 0 0 0 0 0 0 Q--O--O-O 0 0
0 1000 2000 3000 4000 5000 6000
Time (see.)
Figure 6: Linear superposition creep / recovery sequence.
18

-0.50
E0
rj
-0.55
-0.60
-0.65
-0.70
-0.75
-0.80
-0.85
IM7/K3B
$22 @ 200°C
teref = 2hr.
-0.90 ' ' ' ' I ' ' , , t ' ,
1 2 3
log Time (see.)
I I [ I !
4
Figure 7: Transverse compliance MMC at 200°C.
!
5
19

-0.50
-0.55
-0.65
owml
t_
(.) -0.75
-0.80
-0.85
-0.90
IM7/K3B
822 @ 208°C _//teref= 2hr.
1 2 3 4
log Time (sec.)
Figure 8: Transverse compliance MMC at 208°C.
5
2O

-0.45
-0.50
-0.55
-0.60
(.)
-0.75
-0.80
-0.85
-0.90
IM7/K3B
S22 @ 215°C
te_f= 2hr.
1 2 3 4
log Time (sec.)
Figure 9: Transverse compliance MMC at 215°C.
5
21

-0.20
-0.25
-0.30
-0.35
-0.50
-0.55
'_' -0.600
-0.65
-0.70
-0.75
-0.80
-0.85
-0.90
IM7/K3B
S22 @ 225°C
te_ef= 2hr.
.... I ' ' ' ' I ' ' ' ' I
1 2 3 4
log Time (sec.)
I I I t
Figure 10: Transverse compliance MMC at 225°C.
5
22
EO
-0.1
-0.2
-0.3
-0.4
-0.5
-0.6
-0.7
-0.8
-0.9
IM7/K3B
822 @ 230°C
tenor = 2hr.
' ' ' ' I ' ' ' ' I ' ' ' ' I , -7---
1 2 3 4
log Time (sec.)
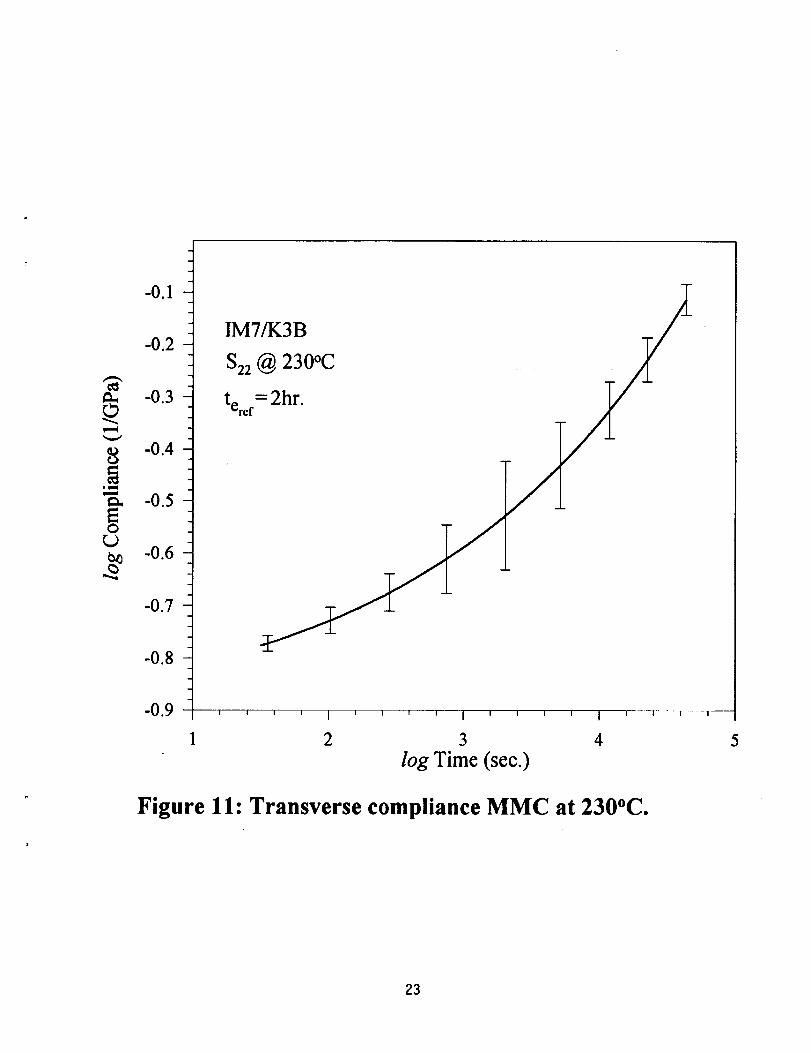
Figure 11: Transverse compliance MMC at 230°C.
5
23

-0.15
-0.20
-0.25
_" -0.30
_o -0.45
-0.50
-0.55
-0.60
-0.65
IM7/K3B
$66 @ 200°C
teref = 2hr.
"--'--7" 1 I" 7_--'_1--T I T 1 | 1 ! • ! [
1 2 3 4
log Time (see.)
Figure 12: Shear compliance MMC at 200°C.
! I !
24

w.,,,4
Or,.)
-0.05
-0.10
-0.15
-0.20
-0.25
-0.30
-0.35
-0.40
-0.45
-0.50
-0.55
-0.60
-0.65
IM7/K3B
$66 @ 208°C
ter_r = 2hr.
! I i 1 I
3
log Time (sec.)
Figure 13: Shear compliance MMC at 208°C.
!
5
25

0.4
0.2
0.0
._ -0.2
rj
_ -0.4
-0.6
-0.8
°
IM7/K3B
$66 @ 215°C
tear= 2hr.
' ' ' ' I I w f I I ' ' ' ' I
2 3 4
log Time (sec.)
Figure 14: Shear compliance MMC at 215°C' -:
5
26

0.5
EO
r..)
0.4
0.3
0.2
0.1
0.0
-0.1
-0.2
-0.3
-0.4
-0.5
-0.6
IM7/K3B
$66 @ 225°C
teref= 2hr.
1 2 3 4
log Time (sec.)
I I I I
5
Figure 15: Shear compliance MMC at 225°C.
27

1.06
1.04
1.02
1.00
rd3
0.98
0.96
0.94
0.92
EM7/K3B
° ' '' I '''' t , ,'"'r-r- I , , , i i , i , i I ' ' ' ' I ' ' ' '
195 200 20:5 210 215 220 225 230
Temperature (°C)
Figure 16: Shear compliance shift rate as a function of temperature.
1.1
1.0
0.9o
0.8
o_
0.7
0.6
0.5
0.4
_ IMT/K3B
I I l l i '1 I ! I I I rl I''1 ] I I I I I I I I I [ I I I *1 I I | I I i ....
195 200 205 210 215 220 225 230 235
Temperature (°C)
Figure 17: Transverse compliance shift rate as a function of temperature.
28

0.4
0.2
o.o
-0.2
_ -0.4
-0.6
-0.8
IM7/K3B 225°C/
566 te_r--2hr" ///_15°C
j
200oC
' ' ' ' I ' " ' ' I ' ' ' ' I ' ' ' '
1 2 3 4
log Time (sec.)
Figure 18: Shear compliance momentary master curves.
-0.2
-0.4
i-0.6
-0.8
' ' ' ' I ' ' ' ' I ' ' ' ° I ' ° ' '
1 2 3 4 5
log Time (secs.)
Figure 19: Transverse compliance momentary master curves29

8
vmm4
OL)
0.4
0.2
0.0
-0.2
-0.4
-0.6
-0.8
IM7/K3B
S66 te_,_2hr.
225oC o
215oC a
208oC
200oC v
Best Fit
' ' ' ' t ' ' ' ' I ' ' ' ' 1 • I , I I ' ' ' ' I ' ' ' '
1 2 3 4 5 6 7
log Time (sec.)
Figure 20: Shear compliance TTSP master curve 200°C to 225°C.
0.0
-0.2
_" -0.4O
-0.6O
-0.8
-1.0
IM7/K3B
S22 ter0f--2hr.
1 7
230oC o
225oC a
215°C "
208oC v
200oC o
Best Fit
2 3 4 5 6
log Time (sec.)
Figure 21: Transverse compliance TTSP master curve 230°C to 200°C.3O
1.2
_D
Or,.)
1.0
0.8
0.6
0.4
0.2
0.0
-0.2
-0.4
-0.6
-0.8
-1.0
IM7/K3B
522 @ 215°C
teref = 2hr.
Momentary
Long Term Data
Long Term Prediction
' ' ' ' I ' ' ' ' I ' ' ' ' I ' ' i-r- Imr--T-1 I r_ , , I _ ' ' '
2 3 4 5 6 7
log Time (sec.)
8
Figure 22: Long term test data versus prediction.
31
1.2
1.0
0.8
0.6
0.4
o 0.20
00 -0.2
-0.4
-0.6
-0.8
IM7/K3B
$22 @ 225°C
ter_f= 2hr.
Momentary
//
//
//
//
Long Term Predictions225oC
227oC .......
230oC m._..225°C Long Term Test Data ©
' ''' I'''' I' ' _ _ I ' ''' I' ''' I'' '' I ''' '
2 3 4 5 6 7 8
log Time (sec.)
Figure 23: Long term test data versus prediction.
32

1.2
O
O
1.0
0.8
0.6
0.4
0.2
0.0
-0.2
-0.4
-0.6
IM7/K3B
$66 @ 215°C
teref= 2hr.
Momentary
Long Term Data
Long Term Prediction
' ' ' ' I ' ' ' ' l ' T i ", I i ' ' ' I ' ' i t_i ' ' ' X--l-' ' ' '
:_ _2' _ i 13 =:':4 • 5 6 7
...... :' log Time (see.)
Figure 24: Long term test data versus prediction.
8
33

1.16
1.14
1.12
1.10
rO•_ 1.08
1.06
1.04
1.02
1.00
IM7/K3B
225°(2
2hrs. _ S_teref=
[0/+45/90].
Sy
| | f i .,
i i i I I ' ' ' ' I " ''' '' I " I " "' I " ' ' ' I ' ' ' '
0 2 4 6 8 10
log Time (sec.)
Figure 25: Prediction of the effects of aging on long term compliance.
Directional dependency in a laminate is illustrated.
34

1.12
1.10
• 1.08
0r..)•_ 1.06
1.04
1.02
1.00
IM7/K3B
Sy
te_f= 2hrs.
[0/+45/90L215oC
' ' I ' ' ° ' I , , ,--_ I ' _ ' ' I ' ' ' r I ' ' ' i -
0 2 4 6 8 10
log Time (sec.)
Figure 26: Prediction of the effects of aging on long term compliance.
Temperature dependency in a laminate is illustrated.
35

1.20
O
O
1.18
1.16
1.14
1.12
1.10
1.08
1.06
1.04
1.02
1.00
IM7/K3B
Sy
teref = 2hrs.
[+45/90],
[0/+45/90],
--w_'", I ' ' ' I ' ' ' ' I ' ' '°"'" I _ ' " ' I ' ' ' '
0 2 4 6 8 I0
logTime (sec.)
!
Figure 27: Prediction of the effects of aging on long term compliance.Laminate layup dependency is illustrated.
36


REPORT DOCUMENTATION PAGEOMB No. 0704.0188
m¢ recluclng Ine oumen, m warmgtmt _ 8en/_ Ok_lcl_ate for Ir/r_mtatiml O_ and R_ t216 jdhm=n Omdm High_ Sule__ b m=omm d Mmmmmm_md 8,c_t, PUenm_ Redu¢_ P,ola_ (0704.01m. W_h_m. 0C _ ' '
1. AGENCY USE ONLY (Leave blank) J2. REPORT DATE ! 3. REPORT TYPE ANO DATES COVERED
I June 1994 I Technical Memorandum4. TITLE AND SU_,,ILE & FUNDING NUMBERS
The Effects of Physical Aging at Elevated Temperatures on the WU 505-63-50-04Viscoelastic Creep of IM7/K3B
6. AUTHORS)
Thomas S. Gates and Mark Feldman
7. PERFORMING ORGANIZATION NAME(S) AND ADORESS{ES) 8. PERFORMING ORGANIZATION
NASA Langley Research Center REPORTNUMBERHampton, VA 23681-0001
9. SPONSORING I MONITORING AGENCY NAME(S) AND ADORESS_S) 10. SPONSORING I MONITORING
National Aeronautics and Space Administration AGENCYREPORTNUMBERWashington, DC 20546-0001 NASA TM- 109114
11. SUPPLEMENTARY NOTES
Gates: Langley Research Center, Hampton, VA; Feldrnan: Old Dominion University, Norfolk, VA. Presented at
the ASTM 12th Symposium on Composite Materials: Testing and Design, Montreal, Canada, May 16-17, 1994.
12a. DISTRIBUTIONI AVAILABILITYSTATEMENT
Unclassified - Unlimited
Subject Category - 26
12b. DISTRIBUTION COOE
13, ABSTRACT (Maximum 200 words)
Physical aging at elevated temperature of the advanced composite IMT/K3B was investigated through the use ofcreep COmpliance tests. Testing consisted of short term isothermal, creep/recovery with the creep segmentsperformed at COnstant load. The matrix dominated transverse tensile and in-plane shoar behavior were
measured at temperatures ranging from 200 to 230°C. Through the use of time based shifting procedures, the
aging shift factors, shift rates and momentary master curve parameters were found at each temperature. Thesematerial parameters were used as input to a predictive methodology, which was based upon effective time theoryand linear viscoelasticity COmbined with classical lamination theory. Long term creep COmpliance test data was
COmpared to predictions to verify the method. The model was then used to predict the long term creep behaviorfor several general laminates.
14. SUBJECT TERMS
Polymeric COmposites; Physical aging; Creep; Viscoelasticity
17. SECURITY CLASSIFICATIONOF REPORT
Unclassified
NSN 7540-01-2_
18. SECURITY CLASSIFICATIONOF THIS PAGE
Unclassified
19, SEcuR$'I_Y CLASSIF ICATK)NOF ABSTRACT
16. NUMBER OF PAGES
37
16. PRICE CODE
A03
20. LIMITATION OF ABSTRACT
Standard Form 291 (Rev. 249)Pracrlx_ by,q_, Ski. Z_.ln2m._