
EFFECTS OF PAIR PROGRAMMING ON LEARNING EFFICIENCY...
25
CHAPTER 5 EFFECTS OF PAIR PROGRAMMING ON LEARNING EFFICIENCY 5.1 Introduction Pair programming is one of the important practices of the lightweight development methodology, namely XP. The pair programming refers to the practice of two developers working together in a single computer terminal to develop and test programs. The roles of pair programming are driver and navigator where the driver writes the code and the navigator helps the driver and looks for e n o n (Beck, 2000). This chapter explains the research work done in evaluating the effects of pair programming on learning process. Section 5.2 introduces the research problem. The adopted research method is briefly explained in section 5.3. In addition, it explains the reasons for conducting a pilot study. Section 5.4 explains the pilot study. Section 5.5 describes the study conducted to evaluate the learning efficiency. It includes the description of experimental design, threats, data collection procedures and the execution of the experiment. The results of the experiment are presented in section 5.6. Section 5.7 discusses the implication of the results. A brief summary is given in section 5.8. 5.2 Problem Definition Software development is a learning process (developers cannot program faster than they can learn) (Dudziak, 2000). The efficiency of the learning process can be measured using the following parameten: 1. Elapsed Time (Duration): It is defined as the total development time elapsed between the start and completion of programming task including debugging.
-
Upload
nguyendieu -
Category
Documents
-
view
219 -
download
5
Transcript of EFFECTS OF PAIR PROGRAMMING ON LEARNING EFFICIENCY...

CHAPTER 5
EFFECTS OF PAIR PROGRAMMING ON
LEARNING EFFICIENCY
5.1 Introduction
Pair programming is one of the important practices of the lightweight
development methodology, namely XP. The pair programming refers to the practice
of two developers working together in a single computer terminal to develop and test
programs. The roles of pair programming are driver and navigator where the driver
writes the code and the navigator helps the driver and looks for enon (Beck, 2000).
This chapter explains the research work done in evaluating the effects of pair
programming on learning process. Section 5.2 introduces the research problem. The
adopted research method is briefly explained in section 5.3. In addition, it explains
the reasons for conducting a pilot study. Section 5.4 explains the pilot study. Section
5.5 describes the study conducted to evaluate the learning efficiency. It includes the
description of experimental design, threats, data collection procedures and the
execution of the experiment. The results of the experiment are presented in section 5.6.
Section 5.7 discusses the implication of the results. A brief summary is given in
section 5.8.
5.2 Problem Definition
Software development is a learning process (developers cannot program faster
than they can learn) (Dudziak, 2000). The efficiency of the learning process can be
measured using the following parameten:
1 . Elapsed Time (Duration): It is defined as the total development time elapsed
between the start and completion of programming task including debugging.

2. Design Quality: The extent to which the design satisfies the completeness and
correctness of the requirements.
3. Acquired Knowledge: It indicates individual's gained knowledge and
programming skills.
It is argued in literature that pair programming. an important practice of XP,
enhances the learning efficiency. Even though many reasons were stated for increase
in learning efficiency by the use of pair programming, the research is to be conducted
to evaluate the effectiveness of pair programming quantitatively. Prior researches on
pair programming have been carried out in two directions. In one direction, the
researchers conducted surveys and collected opinions of the respondents about pair
programming and analyzed its impact (Melnik and Maurer, 2002; Sanders, 2001;
Williams and Kessler, 2000a; Peter, 2002; Declue, 2003; Thomas er ol., 2003; Keenan,
2002a). This kind of study is called as attitude study. In the other direction, the
researchers analyzed the performance of the research participants through formal
experiments when they adopt pair programming for completing the programming
tasks. (Nosek, 1998; Williams and Kessler, 2000a; McDowell et al., 2002)
(Nawck i and Wojciechowski, 2001; Tomayko, 2002b (The above research works
are discussed in section 2.5.3). These studies on pair programming have the following
limitations:
I . Elapsed rime (duration): Pair programming practice of XP suggests the rotation of
pair partners once or twice in a day. The planning game suggests that a user story is
divided into task. Viewing from these perspectives, a pair works for about 3 hours to
complete a programming task. Most of the prior research works was carried out in
academic environments and pair programming was evaluated in the context of two or
three laboratory exercises that were spread over the entire semester. Such exercises
are called long duration exercises. Even though, the empirical evidence supports the
effectiveness of pair programming in laboratory classes for long-duration exercises,
the extent to which this pair programming is beneficial in programming tasks of short
duration is to be investigated. There are few reports on the evaluation of the effects of
pair programming on shortduration programming tasks (Nosek, 1998; Nawrocki and
Wojciechowski 2001). However, these investigations have not included the
debugging in evaluating the efficiency of the pair programming in their experiments.
2 . Design Quali@: Software design plays an important role in software development.
Williams and Kessler (2000a) compared the design quality between pair programming
and traditional method groups by measuring the length of the code to implement the
same functionality. This measure is generally not considered as an effective design
quality measure. In another report, Succi (2001) proposed the use of CK metric suits
to compare design aspects of the resulting software products and defect behavior to
assess the benefits of the pair programming practice. Thus the effectiveness of pair
programming on design quality has not been explored effectively so far and it is to be
evaluated. Out of many quality factors of design (Pressman 2001), the following are
the important factors to be considered for evaluating the leaming efficiency:
a) Correctness (the extent to which the design represents the requirements
correctly).
b) Completeness (the extent to which the design represents the
requirements completely).
3. Acquired Knowledge: In most of the previous research works, the effectiveness of
pair programming was evaluated by measuring the characteristics of the products
(computer programs) that were developed by the research participants. However, to
prove that pair programming is an effective learning methodology, the improvement
in individual's subject knowledge and programming skills have to be measured. Only
very few attempts have been made to measure the individual performance (Mcdowell
el al., 2002; Williams el a/.. 2002) in the academic environment. The results of the
above experiments were contradicting with each other.
Hence, it is necessary to conduct a study to evaluate the effects of pair
programming on learning efficiency in the context of short-duration programming
tasks.
5.3 Research Approach
In the present study, the following three parameters are considered as learning
efficiency: Elapsed Time, Design Qualiry and Acquired Knowledge. Formal
experiment is chosen as investigation approach due to the advantages associated with
the approach (Fenton and Pfleeger, 1996; Deligiannis et al., 2001). It was decided to
conduct the formal experiment using students of Department of Computer Science &
Engineering and Information Technology, Pondicherry Engineering College, in their
regular laboratory classes. The students have to complete programming tasks
(laboratory exercises), which approximately require three hours for completion. These
programming tasks are generally referred as short-duration laboratory exercises. The
focus of the present study was to compare the learning efficiency of the students when
they adopt pair programming with that of traditional method for doing short-duration
laboratory exercises. Here, the traditional-method is referring to solo programming
where only one student is involved in the development of a program for a laboratory
exercise. The formal experiments are to be conducted to validate the following
proposed hypthesis:
Hypothesis 1: Elapsed time,for completing the laboratory exercises is less when pair
programming is used than that oftraditional method.
Hypothesis 2: The qualiry of design for laboratory exercises is better when the pair
programming is adopted that of traditional method.
Hypothesis 3: The subject knowledge and programming skill that are gained by
programmer ore higher when pair programming is used than that of traditional
method.
The above hypotheses are proposed based on the theoretical explanation on
the benefits of pair programming and from the results of the earlier research on pair
programming (The detailed discussion is available in section 2.5). In all of the above
hypotheses, a laboratory exercise is considered to be of three hours' duration without
a break and is done under the supervision of a laboratory instructor.
Pilot Study
Since the experimentation is to be carried out in regular classes, it is also
necessary to know the following from the students' point of view:
1. Willingness to adopt pair programming.
2. Kind of pair partners who are required to form a pair for effective learning.
These issues represent the attitude of students towards pair programming.
Hence, pilot study is conducted with small groups of students to know the attitude of
the students towards pair programming. Henceforth, in this report the pilot study will
be called as attitude study.
5.4 Attitude Study
The attitude study was conducted to find the attitude of students towards pair
programming. This was done by collecting opinions from students on important issues
of pair programming. The next section clearly detines the objectives of the attitude
study.
5.4.1 Objectives of Attitude Study
(i) To Obtain Willinpeas of Students to Adopt Pair programming:
Traditionally, the students adopt solo programming for doing exercises in laboratory
courses. The introduction of pair programming as new learning methodology,
radically changes the way in which students do the laboratory exercises. Since the
students are important elements in evaluation of a new learning methodology. it is
necessary to obtain their willingness in adopting it. Some of the previous research
works reveal that the students' opinion on adopting the pair programming were
obtained in the context of long duration exercises (Melnik and Maurer, 2002; Sanders
2001; Williams and Kessler, 2000a; Peter, 2002; Declue, 2003; Thomas et al., 2003;
Keenan, 2002a). Here it is needed to obtain students' willingness to adopt pair
programming in doing shortduration exercises.
(ii) To Identify the Partner of a Pair: In pair programming, the students
have to interact closely. In such situations, composition for a pair plays major role for

the effective learning (Dick and Zarnett, 2002; Williams and Kessler, 2000c; Hayes,
2001). The students' choice of the pair partner depends on many social factors such as
the personality, academic achievement, gender and mother tongue of the other partner.
Out of these factors, the gender and academic achievement level of the other partner
are important factors. Hence, it is necessary to obtain the students view on the
composition of a pair for effective learning with respect to the following:
1. Academic achievement level of students participating in a pair.
2. Gender of the students participating in a pair.
5.4.2 Attitude Study Method
Subjects
The study was conducted at the Departmerit of Computer Science &
Engineering and Information Technology, Pondicherry Engineering College. Twenty-
two students (13 boys and 9 girls) were from Master of Computer Application
(M.C.A) course and 62 (45 boys and 17 girls) students were from Bachelor of
Technology (B.Tech) course.
Data Collection
In order to provide an exposure to pair programming, the selected students
were asked to adopt pair programming to do two laboratory exercises. The students
for each pair were assigned randomly except that no pair was repeated with same
members for doing the two exercises. The exercise for each of the laboratory classes
was announced only at the beginning of the laboratory classes. The pairs had to
develop and test the programs in the laboratory itself. At the end of the second
exercise, questionnaires were distributed to all and were asked to fill the questionnaire
individually (not pair wise). The questions in the questionnaire were framed to collect
the opinion of the students on pair programming. The questionnaire is given below:
Please tick only one answer for each question.
1. If you think the pair programming improves the effective learning, do you want it
to be introduced in the laboratory as a way of doing lab experiments?
a) Yes b) No
Answer the following three questions (Q. No. 2 and 3) by assuming that the
pair programming is introduced in your regular laboratory classes:
2. You learn more through pair programming if your partner being of
a) Same academic achievement level as yours
b) Better academic achievement level than yours
C) Less academic achievement level than yours
d) Anybody, because the academic achievement level of partner specifically
does not contribute to the learning
3. The learning will be more effective if the pair is formed with persons of
a) Same gender
b) Different gender
c) Any gender. because the selection of gender specifically does not
contribute to the learning
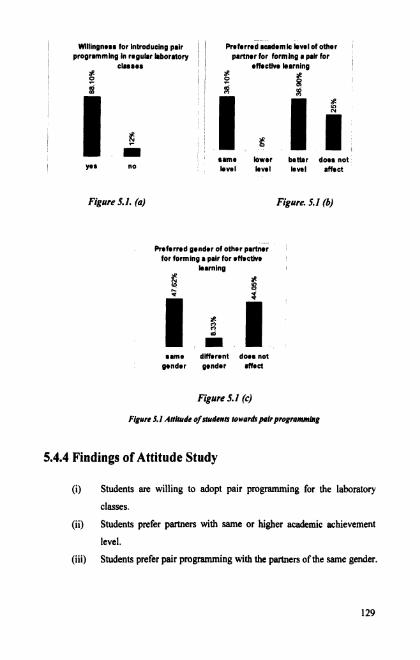
5.4.3 Data Analysis of Attitude Study
The data were collected from the filled-in questionnaires. The collected data
are presented in table D. 1 in Appendix D. The data were analyzed using percentages.
The results are presented graphically in figure 5.1 (a) to 5.1 (c).
Wllllngnas8 for Introducing palr Prafarrad r u d a m k bval of other progrrmmlng 10 ropular laboratory , partner tor formlnp r pair for
classer sffscttv. learning 8 D g h
j g = same ig i i lower bottrr does not
P* no b v ~ l k v l l Ieval affect
Figure 5.1. (a) Figure. 5.1 (6)
Rafarrad pendar of other partner for forming r pair for effactiva
same dmerant doas not pander grndar &st
Figure 5.1 (c)
Ngvre 5.1 Aniiudc of students towardspalrpro~ram.uIng
5.4.4 Findings of Attitude Study
(i) Students are willing to adopt pair programming for the laboratory
classes.
(ii) Students prefer partners with same or higher academic achievement
level.
(iii) Students prefer pair programming with the partners of the same gender.

The findings of the attitude study encouraged to conduct further experiments
to find the effects of pair programming on learning efficiency. In addition, the results
of the attitude study helped to assign pair partners in a pair in the formal experiment.
The formal experiment and the results are explained in the subsequent sections.
5.5 Experiment
5.5.1 Experimental Design
Variables
Independent Variable: The independent variables represent the cause for the effect in
any experiment. The effect in the present study is learning efficiency and the
conjectured cause is the learning methodology. Thus, the independent variable for the
study is learning methodology. The independent variable can be manipulated in three
ditrerent ways of manipulating the independent variables namely presence or absence
of technique, amounr ~echnique and type ~echnique (Johnson and Christensen, 2003).
For this experiment, the type technique is chosen as it the present our problem. The
two types of independent variables namely pair progmmming and traditional method
(solo programming) was considered for experiment.
Dependent Variables: Dependent variables represent the effects that are specified in
the hypotheses. The effects that are specified in the hypothesis and the corresponding
dependent variables are given in table 5.1.
Table 5.1 Dependem Variables
The elleeh that are specified in the research
hypothesea
Hypothesis I : Elapsedtime.
Name of dependent variable of experiment
Elapsed Time: The time taken to complete an exercise was
measured. This was measured in minutes. The time taken to
complete an exercise was attributed to the pair in the pair
programming group and it was attributed to the individual
student in the traditional method group.

Apart from these dependent variables. cumulative percentage of m a r b for
each student was also obtained. The cumulative percentage of marks is computed by
the total marks scored in all subjects up to the semester in which a student is studying
divided by total number of subjects. The computed fraction is represented as a
percentage. This cumulative percentage of marks was used to verify the equivalence
of two groups and to verify the existence of a covariate. A covariate is a variable
whose effect has not been studied but it influences the outcome of an experiment
(Boniface, 1995).
Hypothesis 2: Quality of
design for laboratory
exercises.
Hypothesis 3: Subject
knowledge and
programming skills that are
gained by the individual
students
Quantification of Learning Efficiency: The improvement in learning efficiency (if
any) of the pair programming group compared to that of the traditional method group
is quantified by adopting the following steps:
Design Marlo: The design document for the laboratory
exercise was evaluated and awarded marks. The design was
evaluated for a maximum of 10 marks. The design marks for a
laboratoly exercise was awarded to a pair in the pair
programming group whereas it was awarded to each individual
student in the traditional method group.
Test Marks: The students in both groups were asked to take up
a test individually after completing the exercise and awarded
marks. The test was of both objective and descriptive type
questions for 20 marks and conducted for a period of 30
minutes.
I . The improvement in design murk (if any) due to the adoption of pair
programming is expressed as a percentage difference between the mean values
of design marks of pair programming and traditional method. In the same way,
the improvements in elapsed time (duration) and test marks are to be
computed.
2. Weights are assigned to the three values (computed in step 1) as follows:
Weights of 20%. 60% and 20% are assigned to the improvement of design
marks, elapsed time and test marks respectively. The higher weight is assigned
to elapsed time as it involves the coding and testing skills. The weighing
scheme is based on the evaluation pattern that is generally adopted in
evaluating the students in the final semester examinations.
3. The improvement in learning efficiency is computed as shown below:
The improvement in learning eflciency =
llmprovemenr of elapsed time in percentage X 60) + flmprovement of
design marks in percenlage X 20) + (Improvement of test marks in
percenra~e X 20)) / /20+60+20). Equation 5.1
Design
We used the two-group single factor post-rest-only design (Trochim. 2000).
The overview of the experimental design is given in table 5.2. The selected students
from the sampling process were randomly assigned to two different groups. Hence,
the two groups were equivalent in all respects. The two groups were administered two
different types of learning methodology: traditional method and pair programming.
The students in the traditional method group were asked to work individually and the
students in the pair programming group were asked to work in pairs.
In pair programming, programmers have to interact closely. In such a
situation, the composition of pair plays a major role for effective learning. In software
industry the success of pair programming depends on the personality traits of pair
partners (Sanders, 2001; Dick and Zarnett, 2002; Hayes, 2001a). Even in academic
environment, choosing of pair partner plays a major role for effective learning. The
random assignment of the partners to a pair may lead to an incompatible pair and it
may pose an internal validity threat to the present experiment. In order to avoid this
internal validity h a t , the students were asked to form pain based on the findings of
the attitude study (Section 5.4.4).
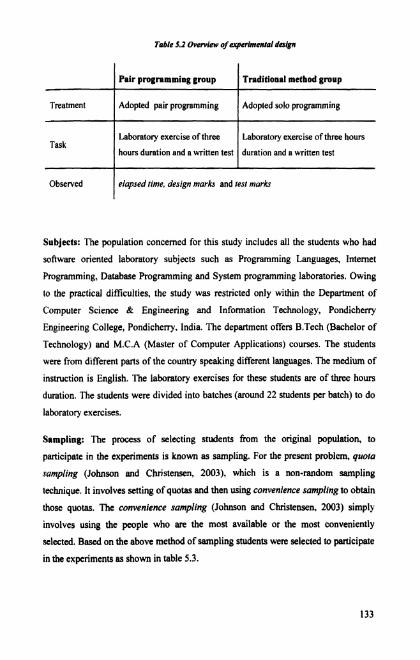
Table 5.2 Overview of erperlmenlal design
Subjects: The population concerned for this study includes all the students who had
software oriented laboratory subjects such as Programming Languages, Internet
Programming, Database Programming and System programming laboratories. Owing
to the practical difficulties, the study was restricted only within the Department of
Computer Science & Engineering and Information Technology, Pondicheny
Engineering College, Pondicheny. India. The department offers B.Tech (Bachelor of
Technology) and M.C.A (Master of Computer Applications) courses. The students
were from different parts of the country speaking different languages. The medium of
instruction is English. The laboratory exercises for these students are of three hours
duration. The students were divided into batches (around 22 students per batch) to do
laboratory exercises.
Treatment
Task
Observed
Sampling: The process of selecting students from the original population, to
participate in the experiments is known as sampling. For the present problem, quota
sampling (Johnson and Christensen, 2003), which is a non-random sampling
technique. It involves setting of quotas and then using convenience sampling to obtain
those quotas. The convenience sampling (Johnson and Christensen, 2003) simply
involves using the people who are the most available or the most conveniently
selected. Based on the above method of sampling students were selected to participate
in the experiments as shown in table 5.3.
Pair programming gmup
Adopted pair programming
Laboratory exercise of three
hours duration and a written test
Traditional method gmup
Adopted solo programming
Laboratory exercise of three hours
duration and a written test
elapsed lime, design marks and test marks

Table 5.3. Selected studenlc from sompllngprocess
5.5.2 Experiment Instrumentation and Preparation
The activities concerned with the preparation of the experiment including the
preparation of instruments are described below:
I . The selected batches of students were given a lecture about pair programming
for about an hour. In the lecture, students were taught about the roles of pair
programming. They were also asked to practice pair programming for one
laboratory session before carrying out the actual experiment.
2. The test cases for the exercises were finalized by the laboratory instructor.
3. The laboratory exercises that were conducted for the present study were
framed as shown in table 5.4. The selected students were assigned different
exercises, based on the course and the year of study. The assignment of
different questions rather than the same question to the students had posed an
internal validity threat to experiment. However, the threat was foreseen and
handled the threat as explained in section 5.5.4.
4. The question papen (objective and descriptive) were prepared for conducting
a test. The questions were coined in such a way to test the knowledge gained
in the subject and programming skills.

Table 5.4 Laboratory exrcises conducted
Course and the Laboratory exercise r year of M d y 1 I I
B.Tech, F~rst year 3 Batches Array operations in C language -1 Creation of database and accessing information
for SQL queries in Java
Graphical simulation of CPU scheduling
algorithms with user Interface in Visual Basic 1 I Parsing a grven C program file to find out the I
5.5.3 Conduct of Experiment and Data Collection
M.C.A, First year
M.C.A, Second year
The experiments were conducted in different time slots. Students of each batch
were randomly divided into two groups: pair programming versus traditional method.
The students who adopted pair programming were requested to switch the roles of
navigator and dnver whenever it was required. The students were made to know the
exercises only at the beginning of laboratoty classes. The general worknow in doing
the short-duration exercises consists of the following sequence of the activities:
I . The students have to prepare a design document. The design is represented
by structure charts and flowcharts andior algorithms. The design document
is evaluated for 10 marks by laboratory instructors. The design document
is evaluated based on the completeness and correctness of the design
which is based on the following.
(a). the extent by which the design coven the required functionality.
(b). correctness of f lowch~slstmcture chartsialgorithms.
(c), right level of detail.
Any incomplete or wrong design is indicated to the students and they are
asked to redo the design document correctly. Each pair in the pair-
programming group has to submit only one design document.
I Batch
1 Batch
number of functions, parameter and type
data using C language
List operations in C language
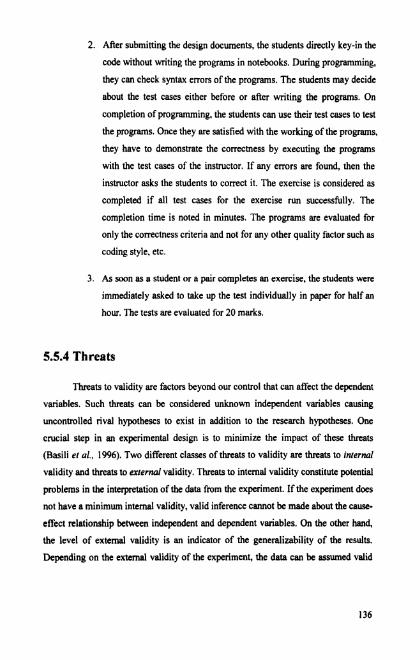
2. After submitting the design documents, the students directly key-in the
code without writing the programs in notebooks. During programming,
they can check syntax errors of the programs. The students may decide
about the test cases either before or after writing the programs. On
completion of programming, the students can use their test cases to test
the programs. Once they are satisfied with the working of the programs,
they have to demonstrate the correctness by executing the programs
with the test cases of the instructor. If any errors are found, then the
instructor asks the students to correct it. The exercise is considered as
completed if all test cases for the exercise run successfully. The
completion time is noted in minutes. The programs are evaluated for
only the correctness criteria and not for any other quality factor such as
coding style, etc.
3. As soon as a student or a pair completes an exercise, the students were
immediately asked to take up the test individually in paper for half an
hour. The tests are evaluated for 20 marks.
5.5.4 Threats
Threats to validity are factors beyond our control that can affect the dependent
variables. Such threats can be considered unknown independent variables causing
uncontrolled rival hypotheses to exist in addition to the research hypotheses. One
cmcial step in an experimental design is to minimize the impact of these threats
(Basili et a/. , 1996). Two different classes of threats to validity are threats to internal
validity and threats to exlernal validity. Threats to internal validity constitute potential
problems in the interpretation of the data from the experiment. If the experiment does
not have a minimum internal validity, valid inference cannot be made about the cause-
effect relationship between independent and dependent variables. On the other hand,
the level of external validity is an indicator of the generalizability of the results.
Depending on the external validity of the experiment, the data can be assumed valid

in other populations and settings. The threats that are anticipated and tried to control
are explained below.
lnternal Validity Threats
The two-group design of the present experiment eliminates many of the
internal validity threats (Trochim, 2000). However, it was found that there were still
some other internal validity threats in the experiment and they were handled as
explained below.
Threat due lo Instrumenlation: The experiment involved two hundred and fourteen
students, from the B.Tech and M.C.A are grouped into ten batches. When students of
different levels were participating, it is not relevant to assign the same laboratory
exercise to all students. Hence, different exercises were given to the students as
shown in the table 5.4. In this kind of situation, it is necessary to ensure that all the
students are doing the exercises of same duration and same level of difficulty. The
uniformity in duration and the difficulty level of the exercises were verified by
conducting the same set of laboratory exercises using traditional method, with
students who were not involved in the present study. It was also ensured that the
batches chosen for the experiment in a year had been taught by the same teacher.
Threui due ro Selection: Each student in a batch was assigned randomly to either the
pair programming group or the traditional method group. The test for the equivalence
of two groups is done and is explained in section 5.6.1.
External Threat
Generally, the students in the department are very cordial to each other and
they are ready to help each other. If this kind of environment does not exist, the
results of the present experiment will not be valid.
5.6 Results
Data Analyais Procedures
The collected data from the experiment are presented graphically using box
plots indicating the individual data points, the 10 and 90 percent quartiles (as
whiskers), the 25 and 75 percent quartiles (by the edges of the box), and the mean (by
a cross line in the box). The outlier points in the data were identified and an analysis
of these points revealed no abnormality.
The analysis of data was carried out as follows:
1. The equivalence of two groups was tested using t-test.
2. The check for the existence of covariance was done using correlation
coefficients.
3. The validation of the hypotheses was done with t-tests.
In the present study, the I-test was used to compare the learning efficiency of
pair programming and traditional groups. The detailed explanation of the t-tests has
been given in Appendix A(A.1). The level qfsignificance for the present study was set
at 0.05.
5.6.1 Equivalence of Two Groups
Even though the random assignment of subjects (students) to the two groups
ensures equality, it is good to check the equality of the two groups using some other
parameter. It is decided to use academic achievement level of the students as the
parameter. For the present study, the academic achievement level is represented by
the cumulative perwntage of the marks. For uniformity, the Cumulative Grade Point
Average (C.0.P.A) of M.C.A students was converted into cumulative percentage of
marks through interpolation using conversion table 5.5 (IITD, 2000). The conversion
table has equivalent cumulative percentage of marks for the C.0.P.A from 5.75 to 8
only and the equivalent cumulative percentage of marks for C.0.P.A of 8.5 and 9 are
extrapolated.

Table 5.5 Conwrslon fable fur C.G.P.A lo percentage of marks
The box plot of percentage marks of pair programming and traditional method groups
are given in figure 5.2.
C.G.P.A
Percentage
of marks
Figure 5.2 Barploljor percenlage ofmarksforpalr programming and lradltlonal mahod
group
The independent t-test was applied on the cumulative percentage of the marks and the
results are presented in the table 5.6 (refer Appendix D (D.3) for details of the test).
As the p-value is more than 0.05, it can be concluded that the groups do not differ
significantly with respect to academic achievement level at 95% confidence level.
5.75
50.0
Table 5.6 Paramdm for chccklngfor fesling equlvalmcc between palrprogramming and
IradUional method groups
Number Hypothesis tating
studentr parameten
Pair programming D e p s of freedom = 21 1
pvalue = 0.769 Traditional 73,97 5,86 0,59 Significance level = 0.05
method Difference in mean = 0.25 1
6.25
55.0
6.75
60.0
7.50
70.0
8.00
75.0
8.50
80.7
9.00
86.4

5.6.2 Checking of a Covariate
The cumulative percentage of marks of a student was not a factor in
our design. Since the cumulalive percentage of marks represents the academic
achievement level of the students, it may influence the output (dependent) variables.
If the cumulative percenlage of m u r k influences the outcome of the experiment
considerably, it should be included as a covariate in our analysis. In order to test the
extent of influence of the cumulative percentage of marks on the output (dependent)
variables, the correlation relationship between cumulative percentage of m a r h and
the output (dependent) variables are to be computed. In the case of pair programming
the average cumulative percentage of marks of two students has been used. The
correlation results (refer Appendix D (D.4)) shown in table 5.7 indicate that a
negligible correlation relationship exists between elapsed time and cumulative marks
percentage. A low correlation relationship exists between d e s i ~ mark7 and
cumulative marks percentage as well as test marks and cumulative marks percentage.
An influencing variable may be considered as covariate only if the correlation
coefficient is more than 0.3 (Davis, 1971). In the present experiment all the
correlations coefficients are less than 0.3 and hence cumulatir~e percentage uf marks
was not considered as covariate.
Table 5.7 Correlation bmueen percentage of marks and dependent wrlables
Note: Interprefatiom according ro descriptors). .Ol-.O9 (negligible), .lo-.29 (low).
.30-.49 (moderate). .50-.69 (substantial), .70-.99 (wry high), and 1.0 (j+vt).
5.6.3 Testing of Hypotheses
The pmposcd hypothesis are validated using t-test (Refer Appendix D for
details of t-test (D.6) and data (D.2, D.5)).

Hypothesis I: The students who adopt pair programming complete the laboratory
exercises faster than the students who adopt the traditional method. In order to check
the mean value of elapsed lime of the pair programming group is significantly lower
than that of the traditional method group, the following statistical hypotheses were
used.
Null Hypothesis MEPPG= MEMG
Alternate Hypothesis MEPW < MEMO
Where MEPW - Mean value of Elapsed time of Pair programming Group
MEMO- Mean value of Elapsed rime of Traditional method Group
The box plot for the variable elapsed time is presented in figure 5.3.
Flgure 5.3 Box plot for elapsed tinu to complete a loboratory uurck forpa l r
progrommlng m d rrod&bnol method group
The results of the t-test are shown in table 5.8. Since the p-value is less than
0.05, the null hypothesis is rejected and the alternative hypothesis is accepted at the
confidence level of 95%. This in turn leads to the acceptance of research hypothesis I
Tobk S.8 TrsIin8poromnrrs for hypolhesh I
Group
Pair programming
Traditional method
:$ 3.5
2.8
Number of
students
58
98
Hypothesis testing pmmeters
t-value = -7.33 Degrees of freedom = I22 p-value 4.000 Significance level = 0.05 Difference in mean = -32.50
M m =138.9
METMG =171,4
Std. Dev.
26.4
27.3

Hypothesis 2: The quality of design for laboratory exercises is better when the
students adopt pair programming than that the traditional method to do laboratory
exercises of short-duration In order to check mean value of design m a r k of the pair
programming group is significantly higher than that of traditional method group the
following statistical hypothesis are used.
Null Hypothesis MDMPK~= MDMTMG
Alternate Hypothesis MDMPPG'MDMTMG
Where MOMPK - Mean value of Design Marks of Pair programming Group
MDMTMO - Mean value of Design Marks of Traditional method Group
The box plot for the output variable design murky is presented in figure 5.4.
Figun S.4 Box plotfor design marks of palrpro#rammlng and Iradillonal mcfhodgmup
The results of the t-test are shown in table 5.9. Since the p-value is less than
0.05, null hypothesis is rejected and the alternate hypothesis is accepted at the
confidence level of 95%. This in turn leads to the acceptance of research hypothesis 2.
Table 5.9 Tmtlng psramden for hypolhslr 2
0.18
0,,6
Std. Dev,
1.37
,59
Croup
Pair programming
Traditional method
Hypothesis testing pnmmeten
t-value= 3'31 Degrees of freedom = 133 p-0.001 Significance level = 0.05 Difference in mean =0.798
Number of
studeota
58 Pain
98 Students
Mean
MDm = 6.94
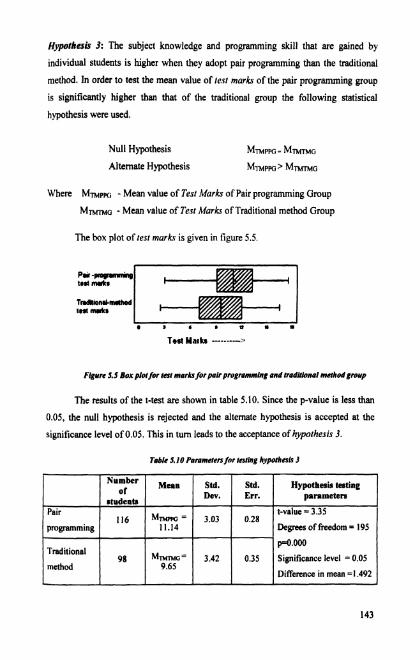
Hyporhesb 3: The subject knowledge and programming skill that are gained by
individual students is higher when they adopt pair programming than the traditional
method. In order to test the mean value of rest mark5 of the pair programming group
is significantly higher than that of the traditional group the following statistical
hypothesis were used.
Null Hypothesis MTMPPC~ - M m m ~
Alternate Hypothesis MTMPPG> M ~ M G
Where MTMPK; - Mean value of Test Marks of Pair programming Group
MTMTMG - Mean value of Test Marks of Traditional method Group
The box plot of lest mark5 is given in figure 5.5.
Flgvrc 5.5 Box plot for resf marks for pair programming and Iradillonal mclhodgrovp
The results of the t-test are shown in table 5.10. Since the p-value is less than
0.05, the null hypothesis is rejected and the alternate hypothesis is accepted at the
significance level of 0.05. This in turn leads to the acceptance of hypothesis 3.
Table 5. I0 Paramders fnr fcsting hypofhnls 3
Std. Dev.
3.03
3.42
M T ~ w ~ = 11.14
M ~ G = 9.65
Pair
programming
Traditional
method
Number of
atudents
116
98
Std. Err.
0.28
0.35
Hypothesis testing parameters
t-value = 3.35
Degrees of freedom = 195
p=o.ooo Significance level = 0.05
Difference in mean =I ,492

5.7 Discussion
The mean values of elapsed time (table 5 .8 ) for pair programming and
traditional method group are used to compute the relative elapsed time and are
illustrated graphically in figure 5.6. The pairs in the pair programming group
completed their assignments by 19 % faster than the individual students of the
traditional method group. Ow experimental results validate the earlier arguments that
pair programming is very effective in debugging and correcting the errors.
Relative Elapsed Time
Pair Programming Trad~tional Method
Figure. 5.6 Comparison of elapsed lime
The graphical representation of the mean values of design marks (table 5.9)
for the pair programming and the traditional method group are shown in fiw 5.7.
Design Marks
Patr Prqnmmlng Trad~tlonal Method I I
I
I - 1 Figure 5.7 Comparisons ojdslgn m r k s

The resulting quality of the design has improved by 8%, which is statistically
significant. This improvement in the desixn marks indicates that the presence of the
pair partner helps to achieve a design which satisfies the requirements completely and
correctly than that of the traditional method group students.
The mean values of test marks (table 5.10) for pair programming and
traditional method group are presented graphically in figure 5.8.
Test Marks
20
16
12
8
0 0 r! Palr Programm~ng Trad~t~onal Method
Figure 5.8 Comparisons of lest marks
It is seen from the figure that rest marks of the pair programming groups are
8% higher than the other group. This difference is also statistically significant. The
rest marks represent gained knowledge and programming skills of an individual.
The improvement noted above in the mean values of the dependent variables
between two groups are also used to quantify the improvement of leaming efficiency
as described in the section 5.5.1. The improvement in learning efficiency due to the
adoption of pair programming over traditional method was computed as 16%. which
is quite significant. Hence, it is concluded that pair programming increases the
learning efficiency when it is adopted for short-duration programming tasks. In
addition the following indirect benefits of pair programming are also identified during
the experiment.
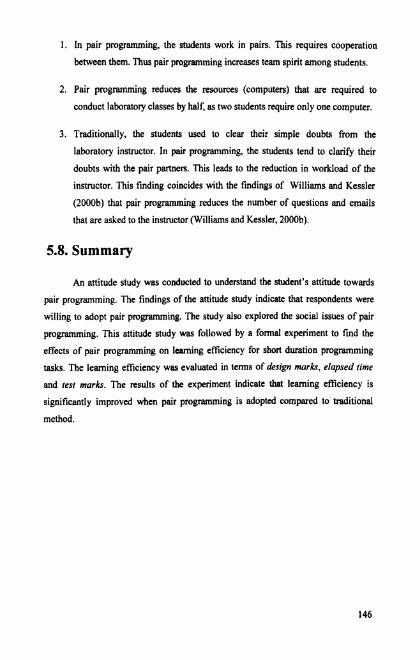
1. In pair programming, the students work in pairs. This requires cooperation
between them. Thus pair programming increases team spirit among students.
2. Pair programming reduces the resources (computers) that are required to
conduct laboratory classes by half, as two students require only one computer.
3. Traditionally, the students used to clear their simple doubts from the
laboratory instructor. In pair programming, the students tend to clarify their
doubts with the pair partners. This leads to the reduction in workload of the
instructor. This finding coincides with the findings of Williams and Kessler
(2000b) that pair programming reduces the number of questions and emails
that are asked to the instructor (Williams and Kessler, 2000b).
5.8. Summary
An attitude study was conducted to understand the student's attitude towards
pair programming. The findings of the attitude study indicate that respondents were
willing to adopt pair programming. The study also explored the social issues of pair
programming. This attitude study was followed by a formal experiment to find the
effects of pair programming on leaming efficiency for short duration programming
tasks. The learning efficiency was evaluated in terms of design morkr, elapsed time
and test marks. The results of the experiment indicate that learning efficiency is
significantly improved when pair programming is adopted compared to traditional
method.