Effects of Organic Retention and Management on Nitrogen Flux in a Coarse, Glacial Outwash Soil at...
24
Effects of Organic Retention and Management on Nitrogen Flux in a Coarse, Glacial Outwash Soil at Matlock, WA. A.B. Adams, Rob Harrison, Cindy Flint (Uni. of Washington), Stephen Schoenhultz (Oregon State Uni.), Tim Harrington (USDA Forest Service PNWRS – Olympia), Randall Greggs (Green Diamond Resource Co.), and
-
date post
20-Dec-2015 -
Category
Documents
-
view
215 -
download
2
Transcript of Effects of Organic Retention and Management on Nitrogen Flux in a Coarse, Glacial Outwash Soil at...
Effects of Organic Retention and Management on Nitrogen Flux in a Coarse, Glacial Outwash Soil at
Matlock, WA.
A.B. Adams, Rob Harrison, Cindy Flint (Uni. of Washington),
Stephen Schoenhultz (Oregon State Uni.),
Tim Harrington (USDA Forest Service PNWRS – Olympia),
Randall Greggs (Green Diamond Resource Co.), and
Mike Mosman and Jeff Madsen (Port Blakely Tree Farms, LP)
A COLLABORATIVE STUDY

INTRODUCTION
• One of 3 sites that can be treated as independent studies:– Fall River (soil N pool > 13,000 kg/ha)– Molalla (~ 6000 kg/ha N)– Matlock (~3000 kg/ha N)
• Three levels of woody debris manipulation with or without competing vegetation control (3 x 2 design)
• Treatments applied to 0.3 ha plots (50 x 60 m)
OBJECTIVES OF STUDY• To quantify effects of logging debris levels &
competing vegetation on flux (nutrients, toxins, etc.) and its impact on ground water quality.
• To determine if differences in flux explains differences in Doug-fir growth rates (e.g., mineralization of organic N into forms favorable to tree assimilation).

RESIDUAL O
HORIZONS
SMALL A
Bw
CGROVE SOIL SERIESCOARSE, GLACIAL
OUTWASH

WEATHER DATA IS COLLECTED ON-SITE; FOR
EVAPOTRANSPIRATION USE AIR TEMP. @ 25cm &
DAILY PPT. FROM TIPPING BUCKET AVERAGED
MONTHLY
A FENCE WAS BUILT AROUND THE STUDY AREA

LTSP MATLOCK PLOTMAP
MANAGEMENT TREATMENTS
• SECOND GROWTH DOUG-FIR FOREST (FOREST)
• STEM ONLY–NO VEGETATION CONTROL (BO-NVC)
• STEM ONLY–VEGETATION CONTROL (BO-VC)
• WHOLE-TREE–NO VEGETATION CONTROL
(WT-NVC)
• WHOLE-TREE – VEGETATION CONTROL (WT-VC)
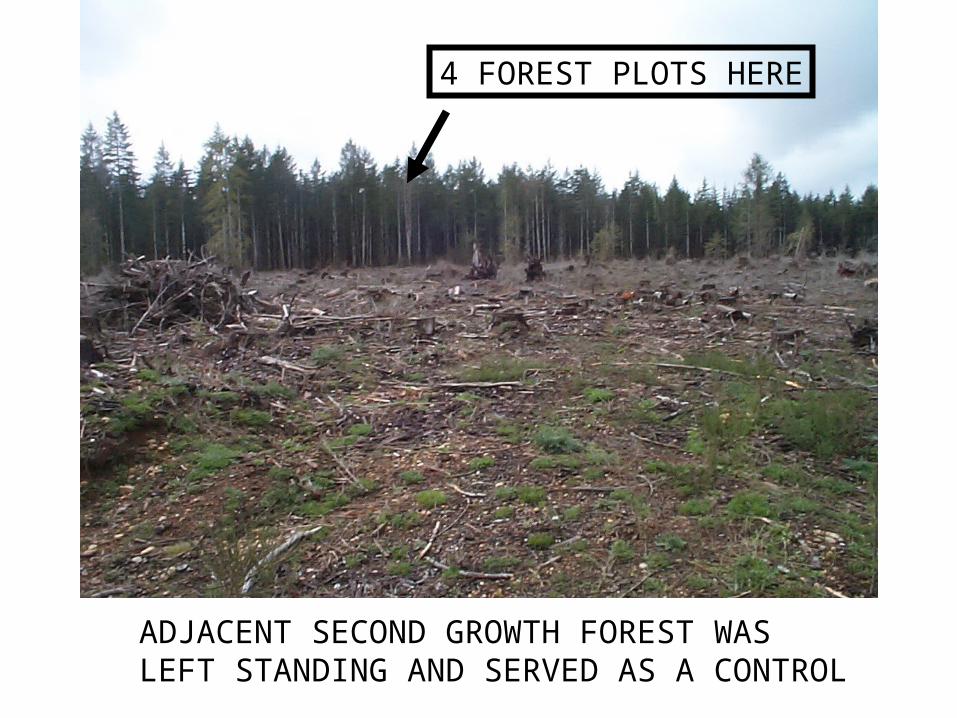
ADJACENT SECOND GROWTH FOREST WASLEFT STANDING AND SERVED AS A CONTROL
4 FOREST PLOTS HERE
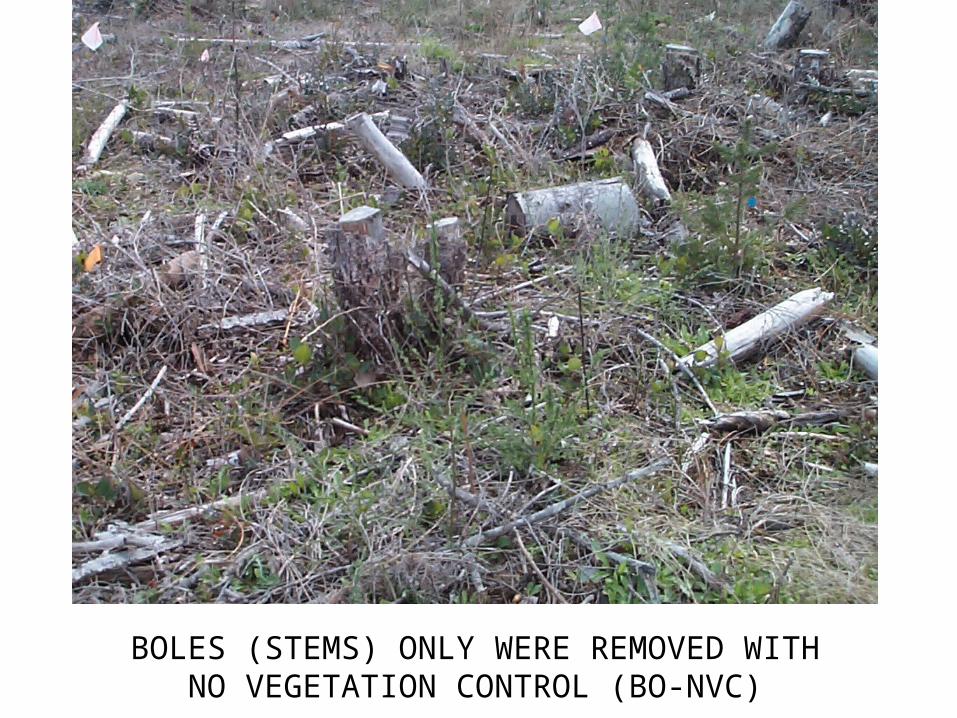
BOLES (STEMS) ONLY WERE REMOVED WITH
NO VEGETATION CONTROL (BO-NVC)

WHOLE TREES WERE REMOVED WITH NO VEGETATION CONTROL (WT-NVC)
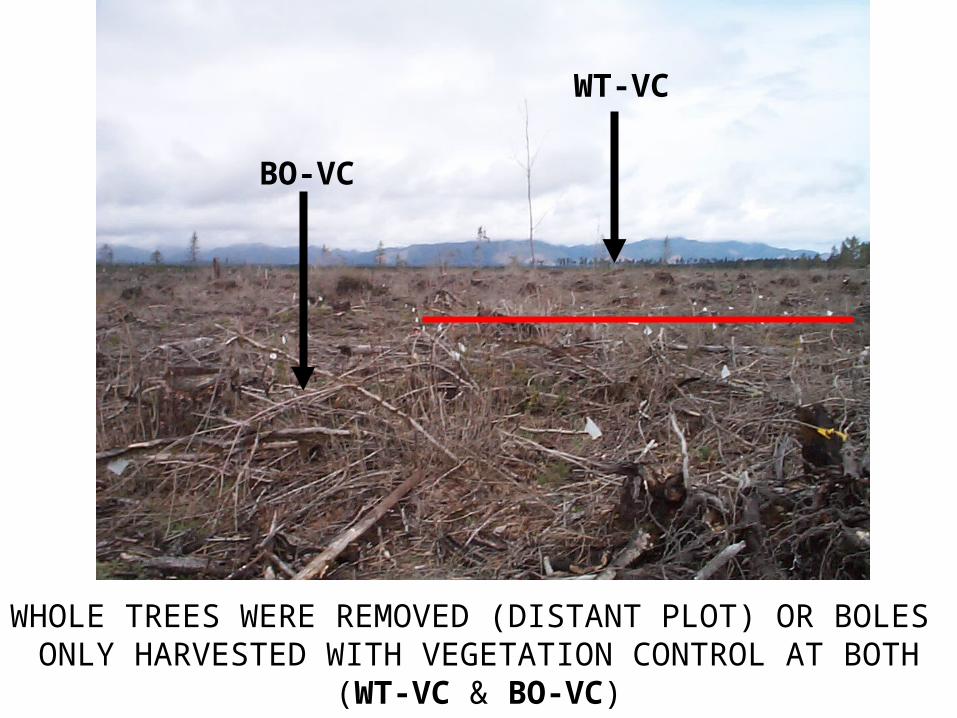
WHOLE TREES WERE REMOVED (DISTANT PLOT) OR BOLES ONLY HARVESTED WITH VEGETATION CONTROL AT BOTH
(WT-VC & BO-VC)
WT-VC
BO-VC

GROVE SOIL SERIES
Two lysimeters (20 cm & 100 cm) negative tension lysimeters were installed at each plot to measure flux of dissolved nitrogen and carbon in the soil water.
Lysimeters are offset toavoid 20 cm lysimeter interferring with flow of water to 100 cm ceramic cup.

BASIS FOR LYSIMETER DEPTHS
• 20 cm is depth at which plants absorb nutrients.
• 100 cm is depth at which solutes are considered leached from system.

• NO3
• NH4
• Dissolved Organic Nitrogen (DON)
• Total N
• Dissolved Organic Carbon (DOC)
Water samples are taken to our soilslab and analyzed for (milligrams/L):
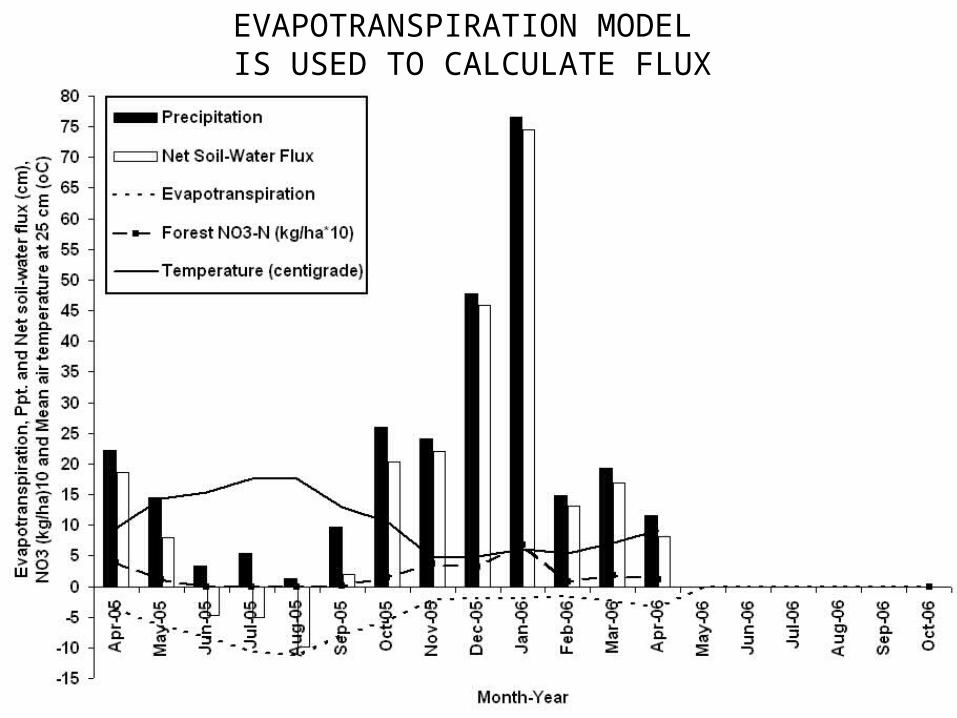
EVAPOTRANSPIRATION MODEL IS USED TO CALCULATE FLUX

NO3-N CONCENTRATIONS AT 20 cm
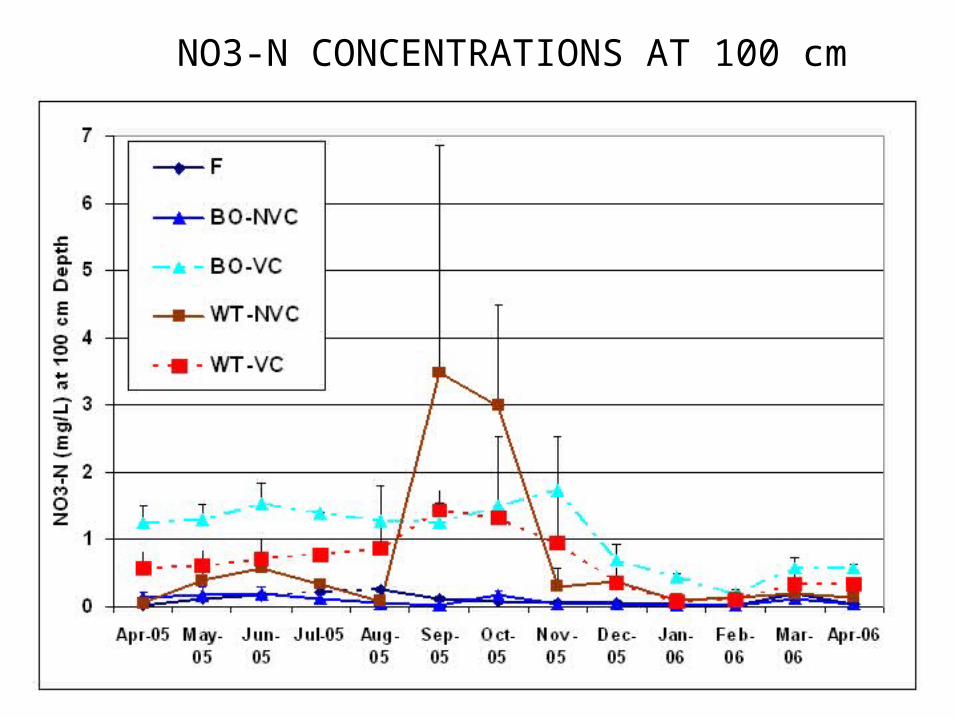
NO3-N CONCENTRATIONS AT 100 cm
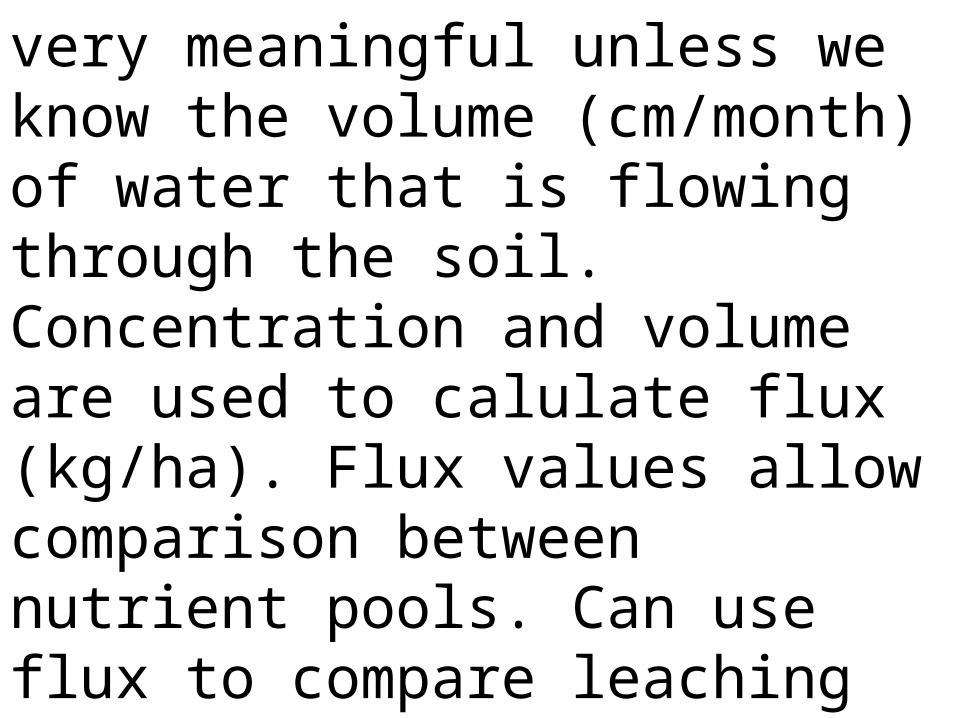
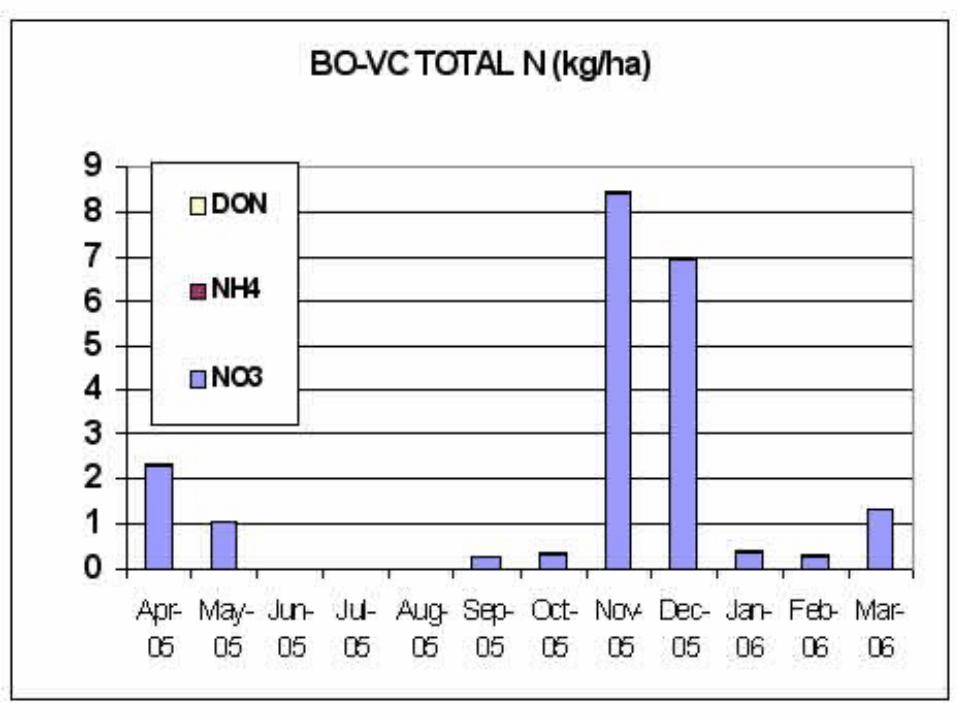
We measure concentration (mg/L) of water sample, but concentration is not very meaningful unless we know the volume (cm/month) of water that is flowing through the soil. Concentration and volume are used to calulate flux (kg/ha). Flux values allow comparison between nutrient pools. Can use flux to compare leaching differences with WT vs. BO vs. Forest and NVC with VC.
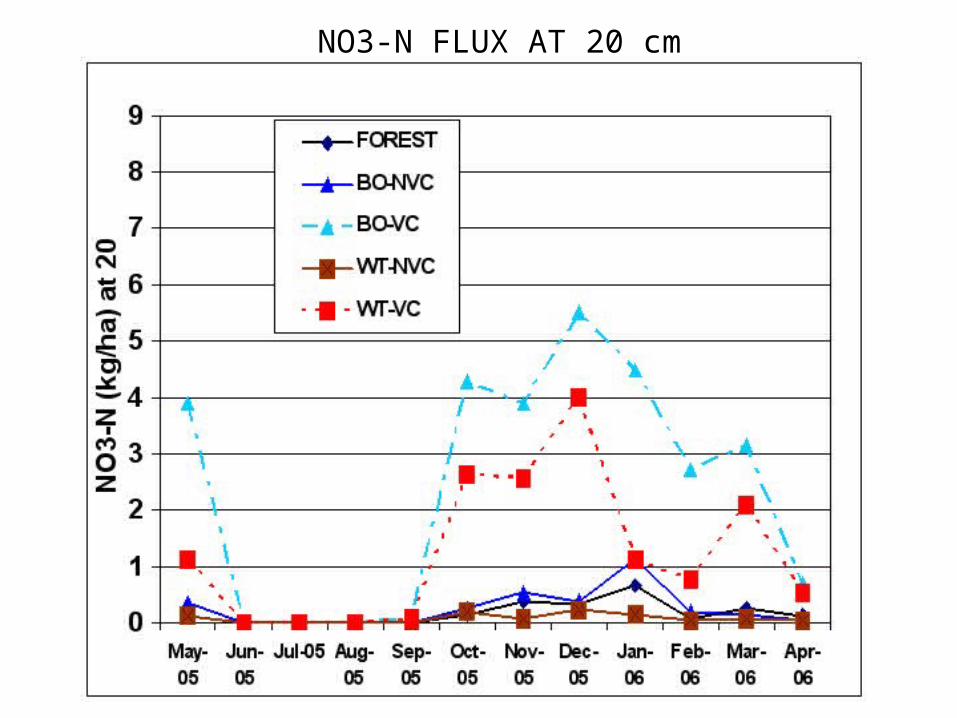
NO3-N FLUX AT 20 cm
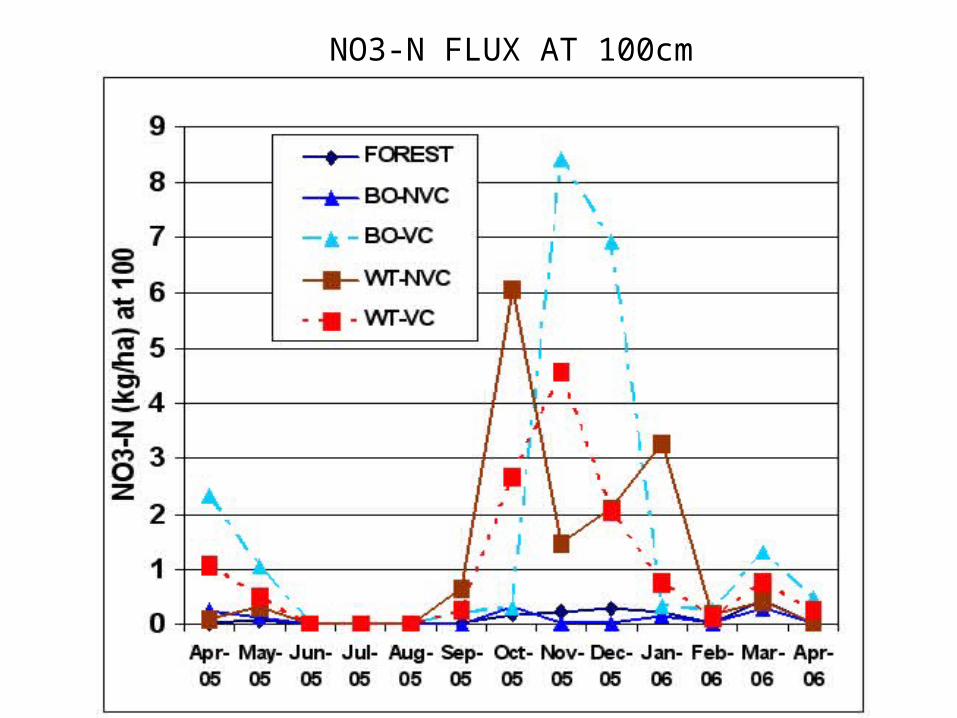
NO3-N FLUX AT 100cm
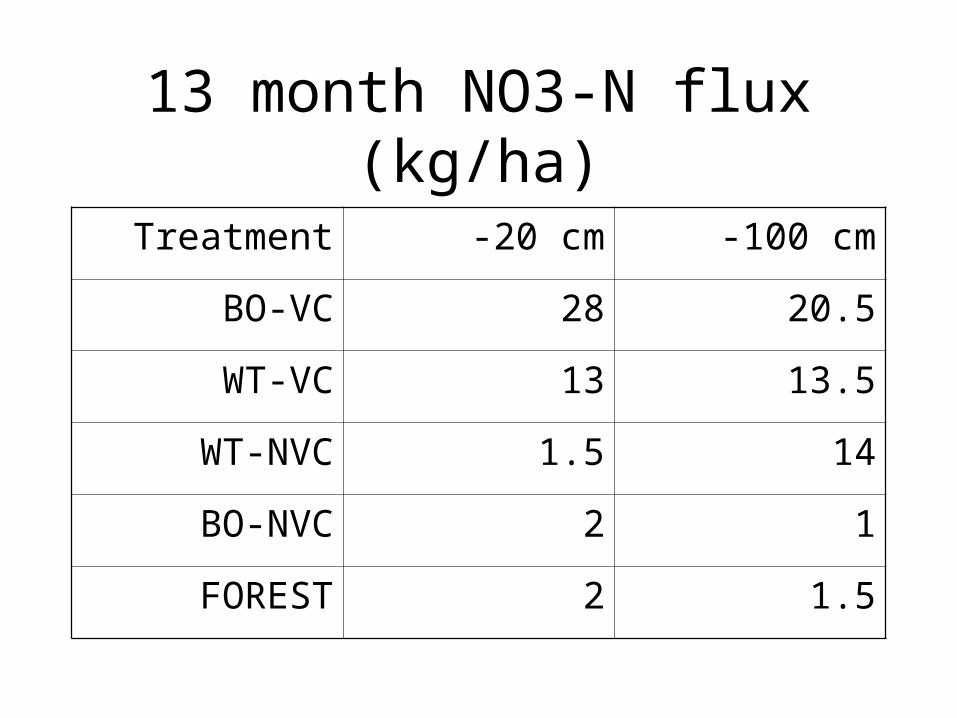
13 month NO3-N flux (kg/ha)
Treatment -20 cm -100 cm
BO-VC 28 20.5
WT-VC 13 13.5
WT-NVC 1.5 14
BO-NVC 2 1
FOREST 2 1.5
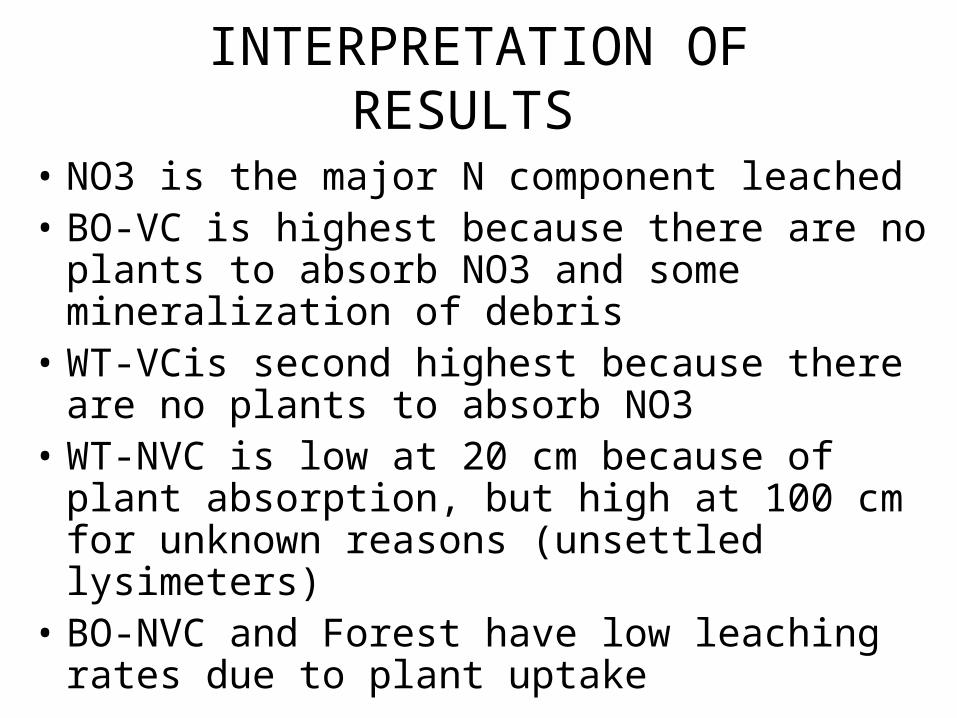
INTERPRETATION OF RESULTS
• NO3 is the major N component leached• BO-VC is highest because there are no plants to
absorb NO3 and some mineralization of debris• WT-VCis second highest because there are no
plants to absorb NO3• WT-NVC is low at 20 cm because of plant
absorption, but high at 100 cm for unknown reasons (unsettled lysimeters)
• BO-NVC and Forest have low leaching rates due to plant uptake
SUMMARY
1) STUDY ALLOWS US TO CALCULATE THE VARIOUS LEVELS OF NUTRIENTS AND THEIR STABILITY IN DIFFERENT ECOSYSTEM COMPARTMENTS
2) RESULTS WILL ALLOW MANAGERS TO CONSIDER THE EFFECT OF DIFFERENT LEVELS OF LOGGING ON NUTRIENT POOLS AND PRODUCTIVITY
3) RESULTS CAN BE COMPARED WITH FALL RIVER AND MOLALLA