Effects of Mineral Content in Bovine Drinking Water: Does ... · Effects of Mineral Content in...
104
Effects of Mineral Content in Bovine Drinking Water: Does Mineral Content Affect Milk Quality? Georgianna Rhodes Mann Thesis submitted to the faculty of the Virginia Polytechnic Institute and State University in partial fulfillment of the requirements for the degree of Master of Science in Life Sciences In Food Science and Technology Susan E. Duncan, Chair Sean F. O’Keefe Andrea M. Dietrich Katharine F. Knowlton March 6, 2013 Blacksburg, Virginia Keywords: milk, oxidation, sensory, iron, dairy
Transcript of Effects of Mineral Content in Bovine Drinking Water: Does ... · Effects of Mineral Content in...
Effects of Mineral Content in Bovine Drinking Water:
Does Mineral Content Affect Milk Quality?
Georgianna Rhodes Mann
Thesis submitted to the faculty of the Virginia Polytechnic Institute and State
University in partial fulfillment of the requirements for the degree of
Master of Science in Life Sciences
In
Food Science and Technology
Susan E. Duncan, Chair
Sean F. O’Keefe
Andrea M. Dietrich
Katharine F. Knowlton
March 6, 2013
Blacksburg, Virginia
Keywords: milk, oxidation, sensory, iron, dairy
Effects of Mineral Content in Bovine Drinking Water:
Does Mineral Content Affect Milk Quality?
Georgianna Rhodes Mann
ABSTRACT
Implications of water chemistry on milk synthesis are not well described yet water is an
important nutrient for dairy cattle. High mineral concentrations (>0.3 mg/kg Fe and others) may
be associated with natural levels in ground water, contaminating sources, drought conditions, or
storage systems. This study evaluated effects of added iron in bovine drinking water on milk
composition (Ca, Cu, Fe, P) measured by inductively coupled plasma mass spectrometry and
oxidative stability measured by thiobarbituric acid reactive substances assay for
malondialdehyde (MDA), volatile chemistry and sensory analysis (triangle test). Prepared
ferrous lactate treatments, corresponding to 0, 2, 5, and 12.5 mg/kg drinking water levels were
given abomasally (10 L/d) to 4 lactating dairy cows over 4 periods (1 wk infusion/period) in a
Latin square design. Milk was collected (d6 of infusion), processed (homogenized, pasteurized),
and analyzed within 72 h of processing and 7 d of refrigerated storage. No differences in MDA
(1.46±0.04 mg/kg) or iron (0.22±0.01 mg/kg) were observed in processed milk. Cross effects
analysis (treatment*cow) showed significant differences in calcium, copper and iron (P < 0.05).
Sensory differences (P < 0.05), in treatment vs. control, suggested iron from water sources
contributes to milk flavor changes. A case study with high and low (0.99; 0.014 mg/kg) iron
treatments revealed no significant differences (P > 0.05) in mineral composition (0.23±0.06
mg/kg Fe) or MDA (0.77±0.03 mg/kg) of raw milk. Iron added to milk causes changes in
oxidation; high levels of iron in bovine drinking water may not have observed effects.
iii
ACKNOWLEDGEMENTS
This research would not have been possible without the help of those in the Food Science
and Technology department. A special thank you is extended to Walter Hartman, Harriet
Williams and Kim Waterman. Others who offered their time and effort are Jeri Kostal, Daryan
Johnson, Kristen Leitch, Laurie Bianchi, Katie Goodrich and Matt Schroeder. I would also like to
thank Dr. Duncan for supporting and guiding me through the entirety of the research. My family
and my Northstar church family, especially Rachel McCord, are also worthy of a special thank
you for constant support and relentless love. The College of Agriculture and Life Sciences Pratt
Endowment at Virginia Tech partially funded this research.
iv
TABLE OF CONTENTS
Title .............................................................................................................................................. i
Abstract ........................................................................................................................................ ii
Acknowledgements ....................................................................................................................... iii
Table of Contents .......................................................................................................................... iv
List of Figures ............................................................................................................................... vi
List of Tables ................................................................................................................................ vii
Chapter I: Introduction .................................................................................................................. 1
Chapter II: Literature Review ........................................................................................................ 7
Chapter III: Manuscript ................................................................................................................. 21
Abstract ...................................................................................................................................... 21
Introduction................................................................................................................................ 22
Materials and Methods ............................................................................................................... 26
Results and Discussion ............................................................................................................... 38
Conclusions................................................................................................................................ 54
References .................................................................................................................................... 55
Chapter IV: Appendices ................................................................................................................. 68
Appendix A: Experiment 1. IRB Approval Letter ....................................................................... 68
Appendix B: Experiment 1. Consent Form ................................................................................. 69
Appendix C: Experiment 1 and 3. Instruction Ballot ................................................................... 72
Appendix D: Experiment 3. Study Design .................................................................................. 73
Appendix E: Experiment 3. IRB Approval Letter ........................................................................ 75
Appendix F: Experiment 3. Consent Form .................................................................................. 76
Appendix G: Experiment 1. TBARS and Sensory Test ................................................................ 79
Appendix H: Experiment 2. ICP-MS and TBARS ...................................................................... 80
v
Appendix I: Experiment 3. Gross Composition ........................................................................... 82
Appendix J: Experiment 3. Oxidative Stability ........................................................................... 86
Appendix K: Experiment 4. Gross Composition and TBARS ..................................................... 92
Appendix L: Virginia State Dairyman Article, January 2013 ....................................................... 95
vi
LIST OF FIGURES
Figure 1.1: Groundwater Iron Concentrations ................................................................................ 2
Figure 2.1: Stages of Autooxidation .............................................................................................. 18
Figure 3.1: Experiment 1, Treatment vs. MDA .............................................................................. 40
Figure 3.2: Experiment 3, Treatment vs. Mineral Content by Individual Cow ................................ 45
Figure 3.3: Experiment 3, Treatment vs. Mineral Content by Cow ................................................. 46
Figure 3.4: Experiment 3, Treatment vs. MDA by Cow ................................................................. 47
Figure 3.5: Experiment 3, Treatment vs. MDA .............................................................................. 49
Figure H1: Experiment 2, Day vs. MDA ....................................................................................... 81
Figure J1: Experiment 3, Treatment vs. MDA ............................................................................... 88
Figure J2: Experiment 3, Treatment vs. MDA (Cow 4558 Excluded) ............................................. 89
Figure K1: Experiment 4, Treatment vs. Mineral Content .............................................................. 94
vii
LIST OF TABLES
Table 3.1: Experiment 3, Latin Square Design ............................................................................... 29
Table 3.2: Experiment 3, Sensory Test ........................................................................................... 50
Table D1: Experiment 3, Cow Feed ............................................................................................... 73
Table D2: Experiment 3, Sample Period Layout ............................................................................ 74
Table G1: Experiment 1, TBARS .................................................................................................. 79
Table G2: Experiment 1, Sensory Test ........................................................................................... 79
Table H1: Experiment 2, Mineral Content ..................................................................................... 80
Table H2: Experiment 2, TBARS .................................................................................................. 80
Table I1: Experiment 3, Mineral Content ....................................................................................... 82
Table I2: Experiment 3, Gross Composition .................................................................................. 83
Table I3: Experiment 3, Gross Composition F Table ...................................................................... 84
Table I4: Experiment 3, Mineral Composition F Table................................................................... 85
Table J1: Experiment 3, TBARS ................................................................................................... 86
Table J2: Experiment 3, TBARS by Cow ...................................................................................... 87
Table J3: Experiment 3, MDA F Table ........................................................................................... 90
Table J4: Experiment 3, Hexanal ................................................................................................... 90
Table J5: Experiment 3, Pentanal ................................................................................................... 91
Table J6: Experiment 3, Sensory Test ............................................................................................ 91
Table K1: Experiment 4, Gross Composition ................................................................................. 92
Table K2: Experiment 4, Mineral Composition in Literature ......................................................... 93
Table K3: Experimental 4, Milk Yield ........................................................................................... 93
1
CHAPTER I
INTRODUCTION
Water is often overlooked as one of the most important nutrients for dairy cattle yet cows
consume a high amount, ca. 0.0946 m3 (25 gallons), of water per day. In addition, water usage on
the dairy farm to clean and cool cows and irrigate the land increases water demand to nearly 5.41
x 10-8
km3/cow/yr (14,300 gallons) which is equivalent to ca. 4.51 x 10
-9 km
3/cow/mo (1,191
gallons) (Chase, 2006). Global water demand for livestock (animals used for food production) is
projected in 2025 at 235.7 km3, an increase of over 630% compared to the 37 km
3 utilized in
1995. The dairy industry will be affected by the increased demand for water resources
(Rosegrant and Cai, 2002).
Dairy farmers must be resourceful to overcome the challenges of water shortages.
Recycling or reuse of water for dairy cattle consumption may be necessary during drought or in
severely restricted fresh water regions. Though these methods may provide the needed water to
produce milk, understanding possible implications of the mineral characteristics of these water
sources on cow health and milk quality is imperative (Collignon, 2009). An excess of any heavy
metal, particularly iron and copper, may cause adverse effects on milk quality (Hegenauer et al.,
1979a).
High concentrations of iron and other heavy metals may be associated with natural levels
in ground water, run-off from mining or other contaminating sources, drought conditions, or even
from the watering systems used for storing water for animal consumption (McNeill, 2006; Bury
et al., 2011). Iron concentrations in groundwater sources are variable. In a study of mineral
composition of well water, iron concentration ranged between less than ten µg/kg to greater than
300 µg/kg. The iron concentration in water in the southwest portion of Virginia generally ranges
2
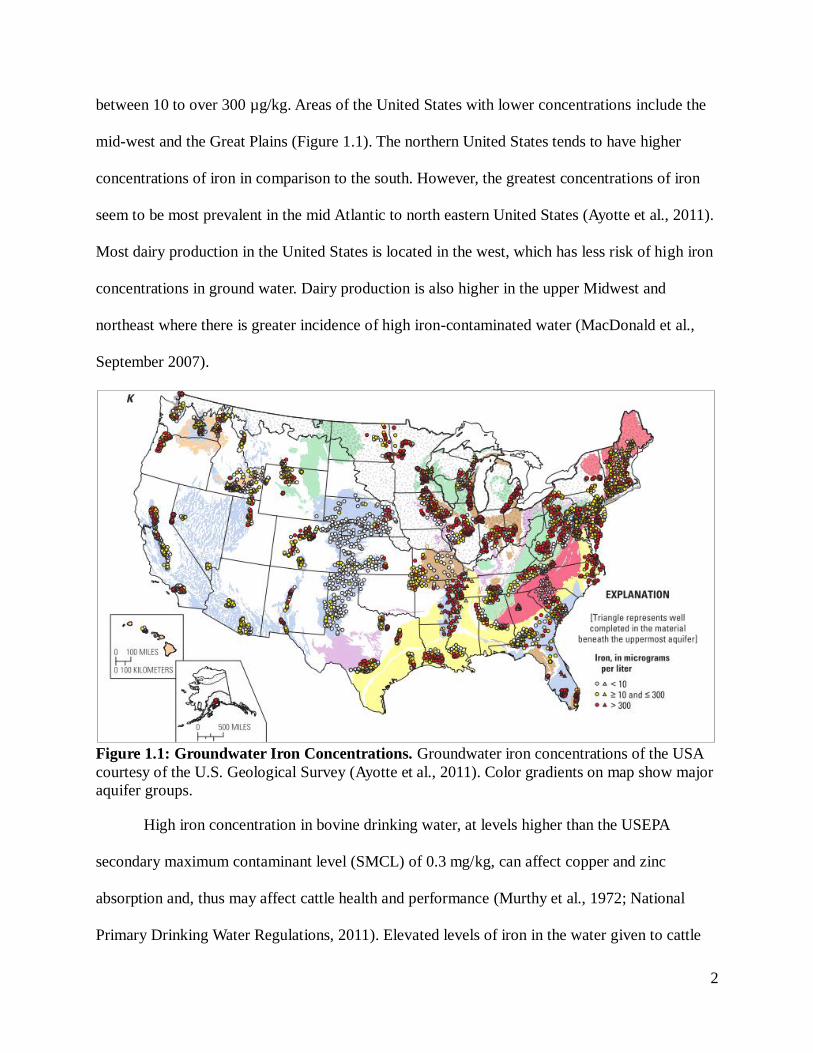
between 10 to over 300 µg/kg. Areas of the United States with lower concentrations include the
mid-west and the Great Plains (Figure 1.1). The northern United States tends to have higher
concentrations of iron in comparison to the south. However, the greatest concentrations of iron
seem to be most prevalent in the mid Atlantic to north eastern United States (Ayotte et al., 2011).
Most dairy production in the United States is located in the west, which has less risk of high iron
concentrations in ground water. Dairy production is also higher in the upper Midwest and
northeast where there is greater incidence of high iron-contaminated water (MacDonald et al.,
September 2007).
Figure 1.1: Groundwater Iron Concentrations. Groundwater iron concentrations of the USA
courtesy of the U.S. Geological Survey (Ayotte et al., 2011). Color gradients on map show major
aquifer groups.
High iron concentration in bovine drinking water, at levels higher than the USEPA
secondary maximum contaminant level (SMCL) of 0.3 mg/kg, can affect copper and zinc
absorption and, thus may affect cattle health and performance (Murthy et al., 1972; National
Primary Drinking Water Regulations, 2011). Elevated levels of iron in the water given to cattle
3
could have a potential effect on milk synthesis, too. Though it is known that iron acts as a pro-
oxidant, little research has been identified that examines the specific role of iron in the water
given to dairy cattle (Sugiarto et al., 2010). It is known that iron can affect palatability of the
water provided to cattle, which may cause the animals to consume less water, leading to less
milk production (National Primary Drinking Water Regulations, 2011). This study seeks to
answer the possibility that excess iron in the water provided to cattle may alter milk composition
and affect processed milk properties and oxidative stability.
It is known that iron added directly to milk can affect oxidation rates and, consequently,
the chemical composition of milk (Hegenauer et al., 1979a; Gaucheron et al., 1996; Gaucheron,
2000; Raouche et al., 2009). Outside of the elevated oxidative effects that added iron has on
milk, the effect of elevated iron on milk proteins has also been studied. Lactoferrin, an iron-
binding protein present in milk, may be affected by additional iron in milk. Lactoferrin
concentration increased in human breast milk when mothers were given elevated dietary iron
(Zapata et al., 1994). A similar increase in lactoferrin levels in bovine milk in response to
increased iron in their dietary water may occur although there are no studies to document this
hypothesis Another study based on lactoferrin in infant formula has shown that lactoferrin was
able to inhibit oxidation acceleration by binding to the iron added to the infant formula. A
suggestion that has been made is to supplement infant formula with lactoferrin to control the
effects of iron on oxidation rates (Satue-Gracia et al., 2000).
Supplementation of milk with iron has shown effects, not only on oxidation rates, but
also on the mineral distribution in the milk. The addition of ferrous chloride (FeCl2) to skim milk
significantly decreased the pH of milk from 6.73 to 6.63. This, in turn, also displaces calcium
and inorganic phosphate in the milk, which could potentially affect processes such as cheese
4
making (Chaplin, 1984; Gaucheron et al., 1996).
Milk used for cheese making must have the proper calcium to phosphorus ratio and pH to
allow for a successful process (Upreti and Metzger, 2007). With a lower milk pH, the calcium is
more soluble, altering colloidal casein needed for cheese making. If the calcium concentrations
in the casein are lower, cheese yield is reduced or calcium chloride must be added. Cheese
manufacturers incur economic costs associated with altered milk mineral and protein
composition. Potential issues are not limited to cheese making and could extend to other milk
products such as a phenomena known as “feathering” in individual coffee creamer cups
(Hutkins, 2006). The direct effects that iron in drinking water has on milk synthesis and
composition and subsequent milk and dairy product processing and quality are not known.
Excess iron intake may affect milk synthesis, with subsequent effects on milk
composition, flavor and oxidation rates. It is possible that an increase in iron can lead to
spontaneous oxidation in the final milk product (Hegenauer et al., 1979b). Spontaneous
oxidation is defined as the oxidation of milk/milkfat due to a number of factors rather than any
recognized cause in particular. Current studies suggest that this spontaneous oxidation may be
due to low concentrations of antioxidants but this notion is not fully explored (Nicholson and
Charmley, 1993; Timmons et al., 2001). This can cause significant problems since it often occurs
in herds that tend to be well-managed and often have no other problems. Many times only a few
cows will produce milk that readily undergoes spontaneous oxidation rather than the entire herd,
furthering difficulties in finding a solution to the problem (Barrefors et al., 1995). This
spontaneous oxidation flavor oven develops without addition of other oxidants like heavy metals
and is seemingly unexplained (Frankel, 1991). The susceptibility of milk to spontaneous
oxidation often varies and in some milk can occur very quickly. Many commercial dairies have
5
very few cattle displaying these qualities in their milk (<10%), but subsequent oxidation of
commingled milk in the bulk tank can progress rapidly (Timmons et al., 2001). This spontaneous
oxidized flavor of milk renders it unsuitable for human consumption in many cases (Nicholson
and Charmley, 1993).
Oxidation of milk, and consequently, milk products causes unacceptable off-flavors that
can result in substantial economic losses. These impacts in profit loss may not only occur in
milk, but also in foods using oxidized dairy ingredients. If ignored, this chemical reaction can
create an undesirable and unacceptable product from an otherwise sound food source, affecting
consumer satisfaction and product integrity. Research has revealed that consumers can readily
perceive oxidized off-flavors, such as those induced by light, and do not prefer these flavors
when compared to flavor of untainted products (White and Bulthaus, 1982).
Oxidation of homogenized, pasteurized milk is less susceptible to metal-induced
oxidation and when inaccurately stored can quickly become subject to light-induced off-flavor.
These two processes, each resulting in oxidation, create distinct flavor profiles. The metal-
induced oxidation often causes a cardboard-type off-flavor while the latter produces a burnt
feathers characteristic. The metal-induced, or termed generic by some studies, flavors from
oxidation also can offer an astringent (pucker) mouthfeel sensation (Alvarez, 2009). These
negative sensory characteristics from the milk subsequently can affect dairy product (cream,
butter, yogurt, ice cream, milk powder) quality and shelf-life as well as other food products in
which these are incorporated.
This study is part of an interdisciplinary project that examines the implications of water
quality on cattle health and milk. The goal of this project was to evaluate the relationship
between iron content in the bovine water supply and resulting processed milk quality. Milk was
6
collected from cows under controlled experimental conditions of iron exposure, represented by
abomasal infusion, as well as a case study from a dairy farm with two water sources delivering
low and high iron concentrations to the lactating dairy cows. Milk quality, with specific
attention to mineral composition and milk oxidation, was assessed. This study will offer more
information on how iron affects milk synthesis, composition, and resulting product quality and
functionality.
The objectives of this study were to:
Characterize the effect of low, moderate, and high levels of abomasally-infused iron on
milk composition, specifically iron, copper, phosphorus, calcium, protein and ash content of
processed fluid milk;
Determine the effect of iron concentration on oxidative stability of fluid whole processed
milk over 7 days of storage;
Identify if low and high iron concentrations from two water sources provided to a
lactating dairy herd affected mineral content and oxidative stability of raw milk.
The results of this multidisciplinary study could potentially impact the consideration
necessary by dairy farmers to ensure an appropriate water supply for their herd. Water quality is
carefully monitored for human consumption but the water supply for the dairy herd producing
Grade A milk does not have EPA defined SMCL. These results could potentially have national
and international implications pertaining to water use, reuse or recycling in dairy production and
processing operations.
7
CHAPTER II
LITERATURE REVIEW
Water Availability and Quality Needed for Dairy Production and Processing
Water Use in Dairy Production. Water withdrawal is defined as water use that takes
water from its source and is no longer available due to evaporation, incorporation into products,
consumption or removed from the immediate water environment (Vickers, 2010). In the 2005
U.S. Geographical Survey, a total of 0.008 km3/d (2,140 M gal) of water was withdrawn and
used for livestock (livestock, feed lots, dairy operations) and aquaculture, totaling 3 percent of
the water withdrawn in the United States. Of this, 60 percent was supplied by groundwater rather
than surface water (Barber, 2009). Standards for water sources on dairy farms are separated into
farm operations and milking operations. Farm operation water regulations require that ground
water must be a safe distance (depending on the nature of the contaminant and water source)
from contamination sources (salts, detergents and other substances that dissolve in water).
Milking operations require potable water and some can be reclaimed from heat exchangers for
milking operations one time (Grade “A” Pasteurized Milk Ordinance, 2011).
Dairy producers are making the shift to fewer cows producing higher volumes of milk,
resulting in lower costs and resources. Since 1944 the annual production of milk per cow has
increased fourfold in the United States (53 B kg milk/25.6 M cattle in 1944; 84 B kg milk/9.2 M
cattle in 2007) which reduces the overall water requirements but increase the importance of the
individual cow (Capper et al., 2009; MacDonald et al., September 2007).
Water Use in Dairy Processing. Water needs for dairy, including processing, are high.
Water used in processing fluid milk is for heating, cooling, washing, and clean-up. To avoid
contamination, potable water used in milking operations on the farm usually cannot be reused as
8
reclaimed water must fulfill strict regulations to avoid product contamination (Grade “A”
Pasteurized Milk Ordinance, 2011). Dairy production, compared to beef, consumes a relatively
high amount of water (Simmons, 2011). Approximately four gallons of water is needed to
produce one gallon of milk; some processing plants have effectively implemented conservation
strategies to reduce the ratio of water to milk (1:1). Water use has become more efficient as in
2007, as 65 percent less water was being used per gallon of milk produced than in 1944
(Raouche et al., 2009; Simmons, 2011).
Implications of Drought in Dairy Production and Processing. The sparse rain in 2012
and record high temperatures provided for one of the most devastating and widely known
droughts in the United States in the last 25 years (Sutter, 2012; U.S. Drought 2012: Farm and
Food Impacts, 2013). Drought, as defined by soil moisture depleted below levels for healthy
crops (Gleick et al., 2012), has forced farmers to ration feed and water among dairy cows as feed
prices increased.
Cows require approximately 0.0946 m3 (25 gallons) of water per day (Chase, 2006); in
response to the drought conditions many dairy cows were culled, lowering milk production as
feed and water sources became scarcer. Milk production in 2013 is projected to have no increase
due to the high feed costs from the 2012 drought (U.S. Drought 2012: Farm and Food Impacts,
2013). In some cases these extreme conditions have forced producers to sell their stock and
consider bankruptcy. Not only are these pressing environmental hazards devastating, but they are
also very costly to farmers, consumers, and government (Sutter, 2012). In response, farmers and
producers are increasing their water conservation strategies and implementing recycling
strategies (Gleick et al., 2012).
Water conservation, recycling and reuse must be used with caution to keep water quality
9
acceptable (Collignon, 2009). Water that is physically separated from milk products such as
water used in heating and cooling for milk operations or in the processing plant can also be
reclaimed with limited numbers of reuse and specific applications (culinary steam, cleaning
solution, pre-rinse, heating). Reclaimed water in processing cannot be carried over day to day
(Grade “A” Pasteurized Milk Ordinance, 2011).
When water conservation simply is not enough and water must be reused or recycled,
other strategies like reverse osmosis are employed to ensure water safety and quality in effluent
streams by reverse osmosis. This method, while excellent for filtering out impurities, can be very
costly (Milani et al., 2011). Large corporate entities like the McDonald’s Corporation are striving
to conserve by using less water (e.g. beef processing facilities) for example (Muirhead, 2012).
Water Quality Implications in Dairy Production and Processing. Agricultural, industrial
and residential influences contribute to water contamination. Water contaminants include
microorganisms, disinfectants (and byproducts), chemicals (organic and inorganic),
radionucleotides, minerals and metals (National Primary Drinking Water Regulations, 2011).
These factors not only play a role in the effects on water at the biological level, but water
chemistry is also affected. Such contaminants result in undesired chemicals in the water,
alterations of the natural pH balance and increased costs for water treatment to ensure its safety
for consumers (Gleick et al., 2012). The Environmental Protection Agency (EPA) in cooperation
with the United States Department of Agriculture (USDA) have established effluent limitations
as well as restrictions on feeding to limit nitrogen and phosphorus produced by the cows to limit
the impacts on water resources.
Water composition widely varies across the United States, particularly in groundwater
(Ayotte et al., 2011). Water can carry many microminerals including heavy metals. The most
10
pertinent heavy metal of concern for this study is iron. Iron is notably one of the most important
metals mined in the world and is imperative for steel production, with about 98 percent of
mining efforts channeled into steelmaking. This mining process is vital for manufacturing,
transport and construction industries but water can become easily contaminated (Bury et al.,
2011). Even abandoned mines from years past continue to contaminate streams in the United
States (Gleick et al., 2012). Pollution of groundwater and surface water alike have not been
restricted to mining effects; municipal and agricultural practices have also contributed (Theron et
al., 2008).
Due to the negative sensory aspects and discoloration that iron imparts on drinking water,
the United States Environmental Protection Agency (EPA) has assimilated secondary standards,
which are non-enforceable guidelines to regulate contaminants. These specific contaminants
have aesthetic effects or changes on the appearance of water that may be displeasing to
consumers. For iron the secondary standard is 0.3 mg/kg (National Primary Drinking Water
Regulations, 2011). Data gathered at Virginia Polytechnic Institute and State University has
revealed a groundwater iron concentrations of ca. 0.2 mg/kg, near the secondary standard set by
the EPA (Dietrich, 2007).
Iron in water systems can be found in various chemical forms. Ferrous iron found in
groundwater (Fe2+
) can oxidize to become ferric iron (Fe3+
), forming precipitates. This oxidation
process can be affected by pH, temperature and the presence or absence of several catalysts.
When there are large amounts of ferrous iron present in water the dissolved oxygen in the water
will be used to oxidize the ferrous iron to ferric iron, depleting the oxygen in the water and
steadily lowering the pH of the water, affecting water quality (Stumm and Lee, 1961).
Despite the negative effects iron can cause, secondary standards for iron are not
11
enforceable and iron levels are unregulated. In some cases, groundwater levels have been
recorded to be as high as 240 mg/kg, far above the secondary standard set by the EPA. Iron also
varies among diel periods (24 hour blocks of time) with the cycle of ferrous to ferric iron and
back (Kay et al., 2009). Iron may bind to phosphorus, a vital nutrient for crop growth. With an
increase in iron, and in some cases aluminum, there is less available phosphorus for plants,
causing problems for agriculture (Sims and Sharpley, 2005). If these excess nutrients,
particularly metals, are not controlled they can ultimately create pollution problems by building
up in soil, surface water, and in groundwater (MacDonald et al., September 2007). The effects of
iron from bovine drinking water on milk phosphorus concentrations have not been studied.
Implication of Iron in Bovine Nutrition. Water and dairy farming share a close
relationship since the major component of milk is water (87 %). The influence of water on milk
production is demonstrated by higher levels of milk production in areas of high rainfall (Tait et
al., 2005). During a water shortage or water contamination, milk production can be affected by
alterations in milk quality or lower production (Chase, 2006). Due to high levels of water needed
per cow, it is likely that high (above EPA secondary standards) iron content in water (>0.3
mg/kg) could influence milk composition and oxidative stability (National Primary Drinking
Water Regulations, 2011). Genther and Beede demonstrated that metallic flavors in milk, as
occurs at the EPA SMCL, may cause cattle to consume less water and produce less milk (Gary et
al., 2007; Genther and Beede, 2013).
Minerals may also contaminate milk in post-processing situations if water high in
minerals is used for cleaning purposes. Water composition, varying by location, can be affected
by plumbing materials. Copper, iron, and stainless steel are all metals used for piping. Iron pipes
can leech iron into the water being carried (Gidi et al., 2004). Iron corrosion in plumbing is
12
affected by a number of factors, many of which are common in water distribution systems
(McNeill, 2006). Due to the metal leeching problems many metal pipes have been replaced with
galvanized piping and plastics (McNeill, 2006).
Milk Composition and Mineral Stabilization
General Milk Composition Holstein cattle produce milk containing ca. 3.5% milk fat and
generally produce 10-40 kilograms per day of milk, which is composed of ca. 8.7-34.8 kilograms
of water (2.3-9.21 gallons). Whole processed milk is comprised of about 87% water, 3.25% fat
and 4% protein. The remaining constituents in milk are lactose, minerals and other solids (Hunt
and Nielsen, 2009). As a high percent of milk is water, it is important to consider the dietary
water of the cow and how this could affect milk quality.
Milk is also rich in bioavailable minerals used by the human body, including phosphorous
and calcium. Other minerals of interest are iron and copper, however both are pro-oxidants,
which have biological significance as well (Hegenauer et al., 1979a; Hegenauer et al., 1979b).
Copper is present in levels of 0.1-0.6 mg/kg in raw milk (Goff and Hill, 1993; Hunt and Nielsen,
2009). Raw milk generally contains 930 mg/kg of phosphorus (900-1000 mg/kg) where calcium
content is often higher (1180 mg/kg) (White and Davies, 1958; Goff and Hill, 1993; Jensen,
1995). Calcium is present in milk in the form of primarily calcium citrate as well as calcium
phosphate (in casein) (Jensen, 1995). Iron averages 0.5 mg/kg with a range of 0.3-0.6 mg/kg in
raw milk (Hunt and Nielsen, 2009). Similar concentrations of minerals have been found in whole
processing (pasteurized, homogenized) milk (1130 mg/kg Ca, 0.11 mg/kg Cu, 0.3 mg/kg Fe, 910
mg/kg P) (Milk Facts, 2013).
Iron and phosphorous bind to milk proteins (Jenness, 1974; Walstra et al., 1984; Sims and
Sharpley, 2005). About 10 percent of iron in milk is bound to casein proteins, with 20-30 percent
13
bound to iron-binding proteins like lactoferrin and transferrin and is in the ferric (Fe3+
) form
(Jenness, 1974; Fransson and Lonnerdal, 1983; Jensen, 1995).
Iron content of bovine milk tends to vary with location, stage of lactation, time of the
year and breed. A 0.4 mg/kg fluctuation of iron content in milk has been recorded during a
bovine lactation period. Higher levels of iron are expected in early stages of milk production and
highest (2-3 times that of normal milk) in milk containing colostrum (1-2 mg/kg) (Underwood,
1971; Murthy et al., 1972; Jensen, 1995). Iron content of milk is not affected by diet but studies
on the effects of drinking water are minimal (Murthy et al., 1972; Fransson and Lonnerdal,
1983).
Proteins. About 20 percent of iron is located in the fat fraction of milk, with 30-60
percent bound to transferrin or lactoferrin in the aqueous phase, and another 10 percent bound to
the casein. Cow milk contains 0.019-0.194 mg/kg each transferrin and lactoferrin (Jenness, 1974;
Fransson and Lonnerdal, 1983; Jensen, 1995; Lönnerdal, 2009). Milk proteins include whey (20
percent) and casein (80 percent). The casein micelles occur in milk as colloidal complexes of
protein subunits (αs1, αs2, β, κ) and salts (calcium phosphate) (Jensen, 1995; Hutkins, 2006).
These proteins not only act as carriers for minerals but they contribute to the physical
characteristics like flavor, color, gelling and foaming properties (Jenness, 1974).
Lactoferrin is the primary whey protein in milk and has a high affinity for ferric iron
(Jenness, 1974; Fransson and Lonnerdal, 1983). Lactoferrin has two binding sites for iron.
Manganese and zinc also bind to the same site (Lönnerdal et al., 1985). Lactoferrin levels have
been shown to decrease throughout milk production but are higher in cattle with infections,
suggesting a role in infection control (Rainard et al., 1982; Satue-Gracia et al., 2000).
Antimicrobial activity of lactoferrin has been studied and it may aid in nutritional uptake in
14
infants (Lönnerdal, 2009). Aside from antimicrobial properties, lactoferrin has demonstrated the
ability to act as an antioxidant by binding iron (Satue-Gracia et al., 2000).
The relationship between increased dietary lactoferrin and the amount of iron in the
resulting human breast milk is unknown (Satue-Gracia et al., 2000). Human infants are not able
to readily consume bovine milk due their inability to fully digest the proteins and minerals
(Jensen, 1995). For infants unable to consume breast milk fortified infant formula is often given,
supplemented with iron. Iron as a pro-oxidant often makes infant formulas susceptible to
oxidation. Lactoferrin, a metal chelator, inhibited the prooxidant effects of iron in infant formula,
attributed to its high iron affinity (Jensen, 1995; Satue-Gracia et al., 2000; Decker et al., 2010a).
Transferrin inhibits lipid oxidation in foods by binding to iron; affinity is strongest at a neutral
pH (Mancuso et al., 1999; Decker et al., 2010a).
Lipids. Milk contains antioxidant properties including the saturation of milk lipids and
the presence of vitamin E (tocopherol) (Varnam and Sutherland, 1994). Light, temperature, and
metals contribute to an increased risk autooxidation, leading to milk oxidation despite the natural
protection (Clark et al., 2009).
Pasteurized milk, unlike raw milk, does not tend to exhibit auto oxidation but light-
induced reactions are a cause of concern. Milkfat globules in raw milk are enveloped by the
milkfat globule membrane (MFGM), which provides protection of milkfat against oxidative
processes until disruption, such as homogenization, occurs. When homogenized, the milkfat
globule membrane is disrupted and contact of trace minerals (Fe, Cu, Zn) with lipids greatly
increases. Homogenization increases the surface area of the fats by ten times or more (Decker et
al., 2010b). Churning of milk disrupts the MFGM, increasing the chances of lipids coming into
contact with minerals.
15
During homogenization, emulsification of milkfat with the protein fraction occurs,
exposing lipids to iron binding proteins. A stable phosphoprotein protective barrier might prevent
the iron from affecting the lipids by staying bound to the proteins like lactoferrin (Hegenauer et
al., 1979b). Lactoferrin and transferrin may prevent the interaction of minerals with milk lipids
(Allen and Hamilton, 1994). If iron fortification can be carried out such that the iron binds to the
proteins, the oxidation process slows by a significant degree (Sugiarto et al., 2010; Guzun-
Cojocaru et al., 2011).
Other than post-processing effects, research supports the notion that different milking
periods can have an effect on oxidation of milk. Winter milk, higher in acidity than summer milk,
is more susceptible to oxidized flavors (Brown and Thurston, 1940).
Explorations on the oxidative stability of milk as determined by feed types have been
considered. In particular the types of fatty acids in the milk produced by the bovine as a result of
varying feeds and additives have been observed (Havemose et al., 2006). This alteration of the
milk fatty acid profile is thought to have a health benefit, though it comes at a cost. With more
unsaturated fatty acids comes a higher risk of oxidation. Specifically, the polyunsaturated fats
(PUFAs) are at an increased loss risk from the oxidation reactions (Gonzalez et al., 2003).
Alternatively, modification of fatty acid profiles of milk has been used to suppress oxidative
processes in milk. Focant et al. supplemented cattle feed with antioxidants to change the fatty
acid profiles of milk. This was relatively effective and resulted in less oxidation of the final milk
product (Focant et al., 1998).
16
Role of Iron in Milk Shelf Life
Effect of Iron Induced Oxidation on Milk Flavor. Milk, naturally low in iron, has been
supplemented with iron to increase nutritive value (Kurtz et al., 1973). Iron-supplemented milk
was used in chelation (with proteins) studies to prevent the iron from increasing oxidation rates
(Hegenauer et al., 1979b; Guzun-Cojocaru et al., 2011). Elevated levels of ferrous iron causes
increased lipid peroxidation (Hegenauer et al., 1979b). When iron is added in the ferric form less
lipid peroxidation results (Kay et al., 2009). Though there is less lipid peroxidation, the addition
of the ferric compounds to milk can still impart metallic flavors (Gaucheron et al., 1996). Heavy
metals (iron) can decrease the stability of fats even at low levels and trace amounts of metals can
cause further oxidation problems (Dobarganes and Velasco, 2002). Iron supplementation of milk
can cause various undesirable effects in the final product contributing to a decreased shelf life
(Gaucheron et al., 1996).
Oxidation of milk can have economic and product quality impacts, as milk plays a major
role as a product as well as a food ingredient. Due to the relatively high fat content of whole milk
(3.25 percent) it is particularly susceptible to chemical changes as a response to time, light, and
pro-oxidants.
Milk is susceptible to oxidation, altering the protein structure, fatty acid composition,
nutrient value, and sensory quality (Decker et al., 2010b). Oxidation alone can contribute to the
poor acceptability of many dairy products and shorten product shelf life. During oxidation,
peroxides are formed due to the reaction between the unsaturated fatty acids and oxygen. More
specifically, the esters in these unsaturated fatty acids reaction with the oxygen which in turn
yields carbonyl compounds. These carbonyl compounds then provide the “oxidized” flavor that
is unpleasant to many consumers and are detectable at very low levels (Brown and Thurston,
17
1940). Milk has a mild and mellow flavor, oxidative defects can be readily noted and are not
easily masked. The “oxidized” flavor can often be detected by consumers, especially in fluid
milk (Frankel, 2005). Flavor profiles of milk affected by metal-induced oxidation include
cardboard, papery, metallic, painty, cappy, oily, and fishy (Havemose et al., 2006; Clark et al.,
2009). Metal-induced flavor is characterized by a rapid taste reaction when the product is placed
in the mouth. The flavor also has a tendency to linger even after the sample is expectorated
(Bodyfelt et al., 1988; Clark et al., 2009).
Off-flavors associated with oxidation and poor quality can carry over into other products
including milk, butter, yogurt, and cream (Decker et al., 2010b). Metallic flavors, originally
pinpointed to metals used in pipes in dairy processing plants, have caused serious metallic off-
flavors with high frequency. Maintenance of product production without metallic off-flavors is a
challenge, as water supplies must be constantly controlled against the exposure to copper, iron
and manganese. Butter and cheese have a water rinse processing step and water quality must be
considered. Hard water can relay metals to the final dairy product. Metallic or oxidized flavors in
butter may be initiated by rinsing water; the oxidized flavors are readily detected during the
classification process are often given a “below grade” rating (USDA, 1989; Clark et al., 2009).
While many off-flavors are attributed to light-oxidized flavors, metals such as copper are also
responsible for the formation of off-flavors (Jenq et al., 1988; Cadwallader et al., 2007).
Oxidation can be the cause of significant losses. Various techniques have been tested and
are used in order to incorporate antioxidants into milk products. Several of these methods are by
injecting antioxidants into the cows, adding antioxidants to feeds or the direct addition of
antioxidants into final dairy products (Nicholson and Charmley, 1993; Jung et al., 1998; van
Aardt et al., 2005a). The bioavailability is greatly decreased when antioxidants are ingested and
18
antioxidant levels will not remain constant as storage of the milk will decrease the antioxidant
level (Jensen, 1995; Nielsen et al., 2001). Currently antioxidants are added directly to milk and
are considered an additive and must be labeled as such (Food and Drug Administration; van
Aardt et al., 2005a).
Assessment of metal induced oxidation. Oxidation is widely categorized into two types:
photooxidation and autooxidation, the latter of which is more pertinent to this study. Lipid
oxidation yields free radicals, lipid hydroperoxides, and a number of secondary oxidation
products (Decker et al., 2010a).
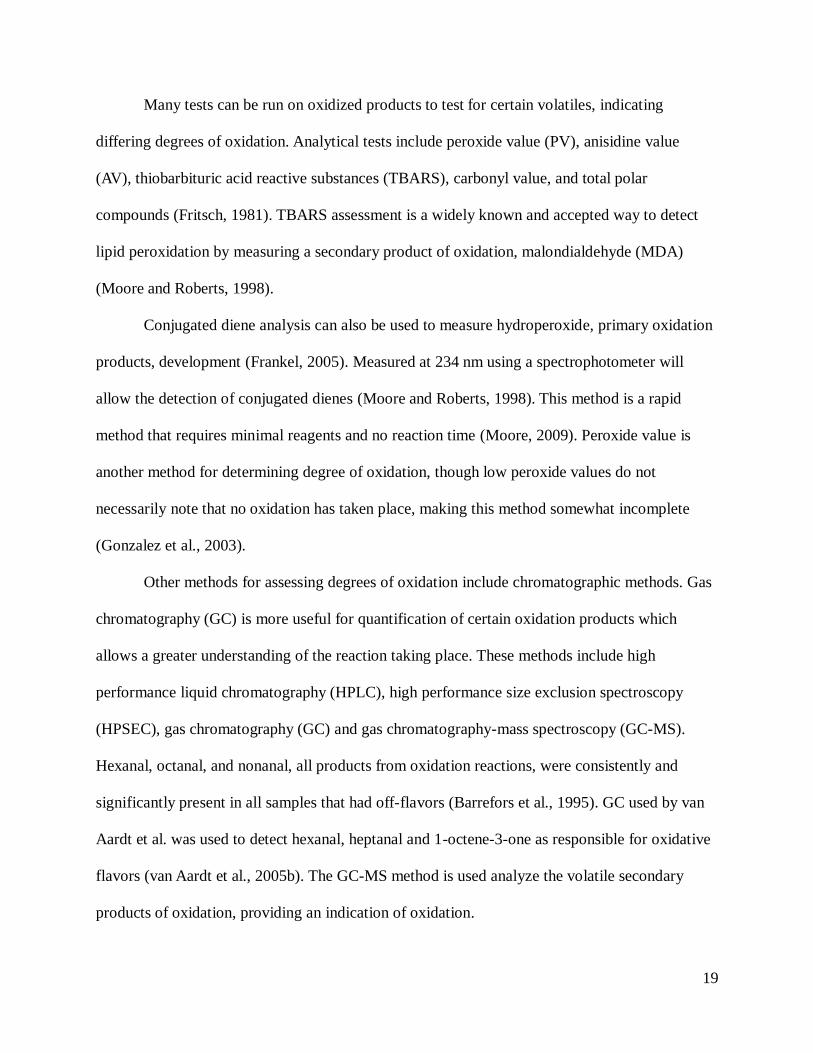
The process of oxidation can be characterized by three stages: initiation, propagation, and
termination (Fennema, 1996). Hydroperoxides, primary products of oxidation, are readily formed
and can cause further degradation to the lipids and destruction of flavor quality. Hydroperoxides,
intermediate compounds, are decomposed into alkoxy radicals and hydroxy radicals by
homolysis of the peroxide bond to further the oxidation process (Henry et al., 1992).
The secondary, and sometimes tertiary, oxidation products include aldehydes, ketones,
alcohols, hydrocarbons and core aldehydes. Secondary products are those that are detectible at
generally low levels and can provide negative sensory aspects: off-flavors and aromas (Gonzalez
et al., 2003; Decker et al., 2010b). Many different molecular species are responsible for the
volatiles produced from the oxidation reactions and make quantification of oxidation difficult.
Figure 2.1: Stages of Autooxidation (Fennema, 1996)
Initiation Initiator free radicals (R, ROO)
Propagation
R + O2 ROO
ROO + RH ROOH + R
R + R
Nonradical
products R + ROO
ROO + ROO
19
Many tests can be run on oxidized products to test for certain volatiles, indicating
differing degrees of oxidation. Analytical tests include peroxide value (PV), anisidine value
(AV), thiobarbituric acid reactive substances (TBARS), carbonyl value, and total polar
compounds (Fritsch, 1981). TBARS assessment is a widely known and accepted way to detect
lipid peroxidation by measuring a secondary product of oxidation, malondialdehyde (MDA)
(Moore and Roberts, 1998).
Conjugated diene analysis can also be used to measure hydroperoxide, primary oxidation
products, development (Frankel, 2005). Measured at 234 nm using a spectrophotometer will
allow the detection of conjugated dienes (Moore and Roberts, 1998). This method is a rapid
method that requires minimal reagents and no reaction time (Moore, 2009). Peroxide value is
another method for determining degree of oxidation, though low peroxide values do not
necessarily note that no oxidation has taken place, making this method somewhat incomplete
(Gonzalez et al., 2003).
Other methods for assessing degrees of oxidation include chromatographic methods. Gas
chromatography (GC) is more useful for quantification of certain oxidation products which
allows a greater understanding of the reaction taking place. These methods include high
performance liquid chromatography (HPLC), high performance size exclusion spectroscopy
(HPSEC), gas chromatography (GC) and gas chromatography-mass spectroscopy (GC-MS).
Hexanal, octanal, and nonanal, all products from oxidation reactions, were consistently and
significantly present in all samples that had off-flavors (Barrefors et al., 1995). GC used by van
Aardt et al. was used to detect hexanal, heptanal and 1-octene-3-one as responsible for oxidative
flavors (van Aardt et al., 2005b). The GC-MS method is used analyze the volatile secondary
products of oxidation, providing an indication of oxidation.
20
Sensory analysis is another way to assess the degree of oxidation in a product. Analytical
methods are sometimes unable to detect very low levels of volatiles responsible for oxidation,
whereas human response may be much more sensitive to the volatiles (Ogden, 1993). Sensory
methods can bridge a gap that the analytical methods cannot. Comparisons between the tested
analytical methods and sensory results are common in research as the two methods often agree
on results (Decker et al., 2010b). Significant sensory differences have been shown to agree with
analytical methods reveling effects of light oxidation (van Aardt et al., 2005b). In particular the
following compounds; hexanal, 2-hexanol, heptanol, 2-octenal, and 2,4-decadienal correlate with
oxidation as detected by sensory methods and the TBARS analysis (Gordon et al., 2007).
21
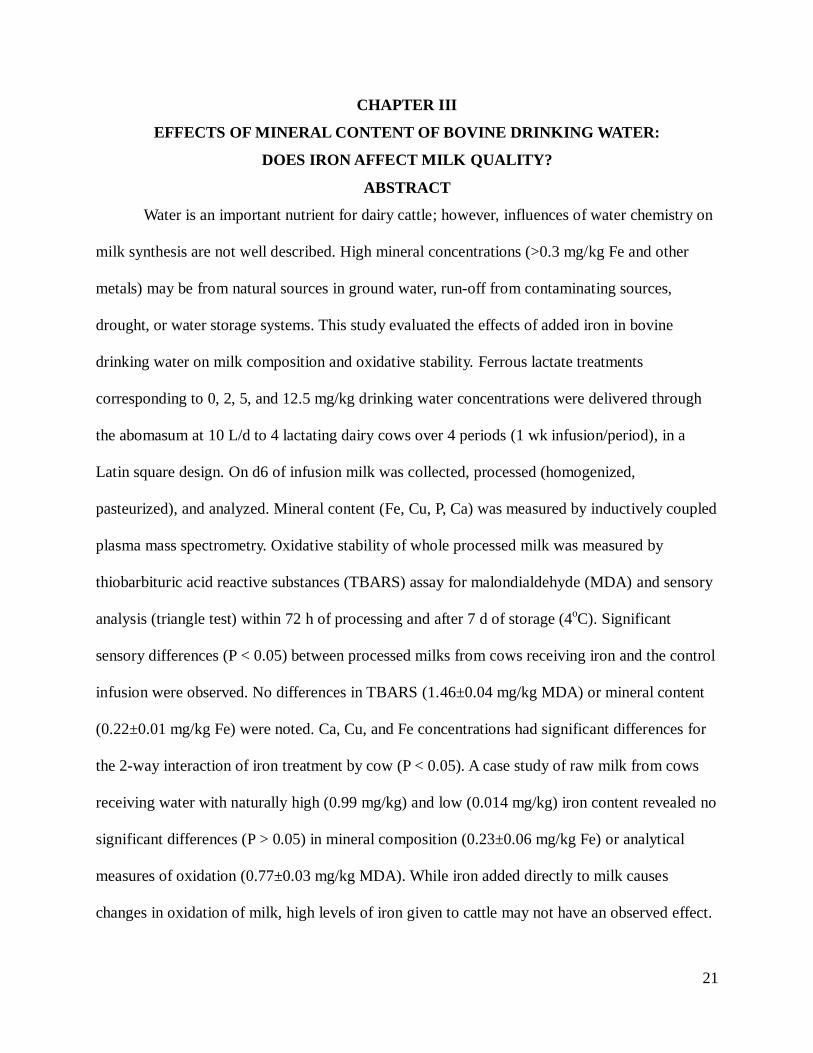
CHAPTER III
EFFECTS OF MINERAL CONTENT OF BOVINE DRINKING WATER:
DOES IRON AFFECT MILK QUALITY?
ABSTRACT
Water is an important nutrient for dairy cattle; however, influences of water chemistry on
milk synthesis are not well described. High mineral concentrations (>0.3 mg/kg Fe and other
metals) may be from natural sources in ground water, run-off from contaminating sources,
drought, or water storage systems. This study evaluated the effects of added iron in bovine
drinking water on milk composition and oxidative stability. Ferrous lactate treatments
corresponding to 0, 2, 5, and 12.5 mg/kg drinking water concentrations were delivered through
the abomasum at 10 L/d to 4 lactating dairy cows over 4 periods (1 wk infusion/period), in a
Latin square design. On d6 of infusion milk was collected, processed (homogenized,
pasteurized), and analyzed. Mineral content (Fe, Cu, P, Ca) was measured by inductively coupled
plasma mass spectrometry. Oxidative stability of whole processed milk was measured by
thiobarbituric acid reactive substances (TBARS) assay for malondialdehyde (MDA) and sensory
analysis (triangle test) within 72 h of processing and after 7 d of storage (4oC). Significant
sensory differences (P < 0.05) between processed milks from cows receiving iron and the control
infusion were observed. No differences in TBARS (1.46±0.04 mg/kg MDA) or mineral content
(0.22±0.01 mg/kg Fe) were noted. Ca, Cu, and Fe concentrations had significant differences for
the 2-way interaction of iron treatment by cow (P < 0.05). A case study of raw milk from cows
receiving water with naturally high (0.99 mg/kg) and low (0.014 mg/kg) iron content revealed no
significant differences (P > 0.05) in mineral composition (0.23±0.06 mg/kg Fe) or analytical
measures of oxidation (0.77±0.03 mg/kg MDA). While iron added directly to milk causes
changes in oxidation of milk, high levels of iron given to cattle may not have an observed effect.
22
INTRODUCTION
Water is often overlooked as one of the most important nutrients for dairy cattle yet cows
consume a high amount, ca. 0.095 m3 (95 L; 25 gallons), of water per day, plus the water used to
irrigate land and cool cattle (Chase, 2006). Global water demand for livestock (animals used for
food production) is projected in 2025 at 235.7 km3, an increase of over 630% compared to the
water utilized in 1995. The dairy industry will be affected by the increased demand for water
resources (Rosegrant and Cai, 2002).
Dairy farmers must be resourceful to overcome the challenges of water shortages.
Recycling or reuse of water for dairy cattle consumption may become necessary for augmenting
ground and surface water resources. Understanding possible implications of the mineral
characteristics of water sources on cow health and milk quality is imperative (Collignon, 2009).
An excess of any heavy metal, particularly iron and copper, may cause adverse effects on milk
quality (Hegenauer et al., 1979a).
High concentrations of iron and other heavy metals may be associated with natural levels
in ground water, run-off from mining or other contaminating sources, drought conditions, or even
from the watering systems used for storing water for animal consumption (McNeill, 2006; Bury
et al., 2011). Iron concentrations in groundwater sources are variable. In a study of mineral
composition of well water across the U.S., iron concentration ranged between less than ten µg/kg
to greater than 300 µg/kg. The iron concentration in well water in the southwest portion of
Virginia displays that broad range (10 to 300+ µg/kg) (Ayotte et al., 2011).
High iron concentration in bovine drinking water, at levels higher than the USEPA
secondary maximum contaminant level (SMCL) of 0.3 mg/kg (300 µg/kg), can affect copper and
zinc absorption, thus, may affect cattle health and performance (Murthy et al., 1972; National
23
Primary Drinking Water Regulations, 2011). Elevated levels of iron in the water given to cattle
could have a potential effect on milk synthesis, too. Though it is known that iron acts as a pro-
oxidant, little research has been identified that examines the specific role of iron in the water
given to dairy cattle (Sugiarto et al., 2010). It is known that iron can affect palatability of the
water provided to cattle, which may cause the animals to consume less water, leading to less
milk production (National Primary Drinking Water Regulations, 2011). This study seeks to
answer the possibility that excess iron in the water provided to cattle may alter milk composition
and affect processed milk properties and oxidative stability (Jensen, 1995). As iron added
directly to milk affects oxidative stability, it also affects the chemical composition of milk.
Addition of ferrous chloride to skim milk has shown a decrease in pH and displacement of
minerals such as calcium and inorganic phosphate from colloidal phase to the aqueous phase in
the β-casein (Hegenauer et al., 1979a; Chaplin, 1984; Gaucheron et al., 1996; Gaucheron, 2000;
Raouche et al., 2009).
Oxidation of milk and, consequently, milk products causes unacceptable off-flavors that
can affect milk quality, contributing to decreased product sales. Off-flavor impacts may not only
occur in milk but also in foods using oxidized dairy ingredients. Oxidation reactions can create
an undesirable and unacceptable product from an otherwise sound food source, affecting
consumer satisfaction and product integrity. Research has revealed that consumers can readily
perceive oxidized off-flavors and do not prefer these flavors when compared to flavor of
untainted products (White and Bulthaus, 1982).
This experimental study is part of an interdisciplinary project that examines the
implications of water quality on cattle health and milk quality. The goal of this project was to
evaluate the relationship between iron content in the bovine water supply and resulting processed
24
milk quality This study will offer more information on how iron affects milk synthesis,
composition, and resulting product quality and functionality.
The objectives of this study, as addressed through four experiments, were:
Experiment 1: Effect of Direct Addition of Iron on Oxidative Stability of Milk.
Evaluate the effect of direct addition of iron, up to 30 mg/kg ferrous sulfate, on
changes in oxidative characteristics (sensory differences, malondialdehyde
concentration) of commercially processed milk.
Experiment 2: Validation of Inductively Coupled Plasma Mass Spectrometry (ICP-MS)
and TBARS Extraction Protocols on Processed Milk
Evaluate the reproducibility of mineral analyses used in the experimental and case
studies.
Experiment 3: Influence of Abomasal Infusion of Iron on Oxidative Stability of Processed
Milk
Characterize the effect of low (200 mg/kg), moderate (500 mg/kg), and high
(1250 mg/kg) levels of abomasally-infused iron on milk composition, specifically
iron, copper, phosphorus, calcium, protein and ash content of processed fluid
milk. Determine the effect of iron concentration on oxidative stability of fluid
whole processed milk over 7 days of storage.
Experiment 4 (Case Study): Effect of Low and High Iron Sources in Bovine Drinking
Water on Mineral Composition and Oxidative Stability of Raw Milk
Identify if low and high iron concentrations from two water sources provided to a
lactating dairy herd affected mineral content and oxidative stability of raw milk.
25
The results of this multidisciplinary study could potentially impact the consideration
necessary by dairy farmers to ensure an appropriate water supply for their herd. Water quality is
carefully monitored for human consumption but the water supply for the dairy herd producing
Grade A milk does not have EPA-defined SMCL. These results could potentially have national
and international implications pertaining to water use, reuse or recycling in dairy production and
processing operations.
26
MATERIALS AND METHODS
Sample collection/preparation steps and experimental design for each experiment are
described first. Analytical methods used in more than one study are subsequently described.
Experiment 1: Effect of Direct Addition of Iron on Oxidative Stability of Milk.
Preparation of Iron Stock Solutions. Four iron stock solutions (0 mg/kg (control), 0.3
mg/kg, 3 mg/kg, 30 mg/kg) were made with food grade ferrous sulfate (FeSO4; Sigma-Aldrich,
PA, CAS 13463-43-g). Solutions were prepared by adding ferrous sulfate (control (0 mg/kg): no
addition; low: 0.010 g; medium: 0.10g; high: 1.0g) into distilled water (30 mL; wt/wt) with
agitation. Stock solutions were made within one hour of application into the milk.
Preparation of Iron-Contaminated Processed Milk Samples. Whole milk (3.25% milkfat;
Kroger brand, Cincinnati, OH) was purchased from the local supermarket in five one gallon
packages (high density polyethylene, no visible light protection additives). All packages had the
same code date and were selected from the front row display on neighboring levels. Each gallon
of milk was prepared such that approximately 3 L remained in the original packaging by means
of removing and discarding 785 mL of the commercial milk. Four treatments (control 0mg/kg,
low 0.3 mg/kg, medium 3.0 mg/kg, high 30 mg/kg) were prepared by adding 30 mL of each
stock solution to 3L of milk (one package per iron concentration; two packages per control).
Calculated ferrous sulfate concentrations in the milk, based on stock solution addition, were 0
mg/kg (control), 0.0027 mg/kg (low), 0.027 mg/kg (medium) and 0.27 mg/kg (high). Milk was
stored in a dark walk-in cooler (Tonka, Hopkins, MN) at 4oC for 3 days before analyses were
completed. Oxidative stability was determined by sensory triangle test analyses and
thiobarbituric acid reactive substances (TBARS) assay (see Analytical Methods section).
Sensory and Statistical Analyses. Duplicate TBARS assays were completed in each
27
replicate (n=3). An ANOVA was run to determine differences between treatments. Sensory
analysis testing was approved by the Virginia Tech Institutional Review Board (IRB 12-158,
Appendix A). Statistical parameters for the sensory testing by triangle tests were α = 0.05, β =
0.20, and proportion of discriminators (pd) of 30%, requiring 43 sensory participants (43
observations per test comparison). A critical number of 21 correct observations per test
comparison was needed to claim that the two samples were different (Meilgaard et al., 2007).
Experiment 2: Validation of Inductively Coupled Plasma Mass Spectrometry (ICP-MS) and
TBARS Extraction Protocols on Processed Milk.
Two commercially processed milk products (3.25% milkfat; Simple Truth Organic,
Kroger, Cincinnati, OH; Kroger brand, Kroger, Cincinnati, OH) were purchased locally and
stored in a dark walk-in cooler at 4C for one day. A nitric acid digestion extraction procedure for
infant formula was applied to extraction of minerals in both milk products with subsequent
analyses of extracted minerals by ICP-MS (Cook and Suddendorf, 1984). The degree of
variability of the extraction process and ICP-MS analysis was estimated based on standard
deviation of quadruplicate extractions from each product. Reliability of the mineral composition
from the extraction was compared to literature values for processed (homogenized, pasteurized)
milk (Murthy et al., 1972; McKinstry et al., 1999; Brescia et al., 2003). A TBARS assay also was
completed on the commercial milk samples (quadruplicate extractions) to verify reliability of the
extraction and to estimate degree of variation over 7 days (days 1, 8) of refrigerated storage
(4C; no light exposure). An ANOVA was used to determine differences between days of storage
and milk type (organic, nonorganic). Data was compared to previous data from our laboratory
and to published data, as available.
28
Experiment 3: Influence of Abomasal Infusion of Iron on Oxidative Stability of Processed
Milk
Milk from this study was collected from cows receiving abomasal infusion as previously
described in the literature in press (Feng et al., 2013).
Preparation of Ferrous Lactate Solutions. Ferrous iron was chosen as it has high
bioavailability for the dairy cow (Nutrient Requirements of Dairy Cattle, 2001). Ferrous lactate
(C6H10FeO6) treatments were prepared at four concentrations: control (0 mg/kg), low (200
mg/kg), medium (500 mg/kg) and high (1250 mg/kg). These levels corresponded to drinking
water levels of 0 mg/kg, 2 mg/kg, 5 mg/kg, and 12.5 mg/kg, assuming each cow drinks 100
L/day. Cows were infused with 10 L/day. Ferrous lactate solutions were made using double
distilled water and the iron content of each solution was monitored each day. Infusion bags were
changed nightly and immediately taken to lab for iron analysis to ensure that content was 95% or
greater of the intended amount. Spectrophotometry was used to ascertain iron content (DU-460
Spectrophotometer, Beckman, Miami, FL) (Feng et al., 2013).
Preharvest Experimental Conditions and Raw Milk Collection. Before the beginning of
the study, approval for the study from the Virginia Tech Institutional Animal Care and Use
Committee (IACUC) was obtained (12-027-DASC). During the treatment period, four ruminally-
cannulated early lactation (second lactation) cows (2 Holstein and 2 Holstein x Jersey cross)
were isolated from external water sources to eliminate outside variables, housed in individual
stalls, and given a standard basal diet and a standardized water source (Table D1).
The treatments given to each cow were randomly assigned during each of four 2-week
periods so that each cow served as her own control (Table 3.1). Each cow each received all iron
water treatments in a 4x4 Latin square design. Each period, lasting two weeks, consisted of a
wash out period during the first 7 days when the cattle were individually fed in Calan doors
29
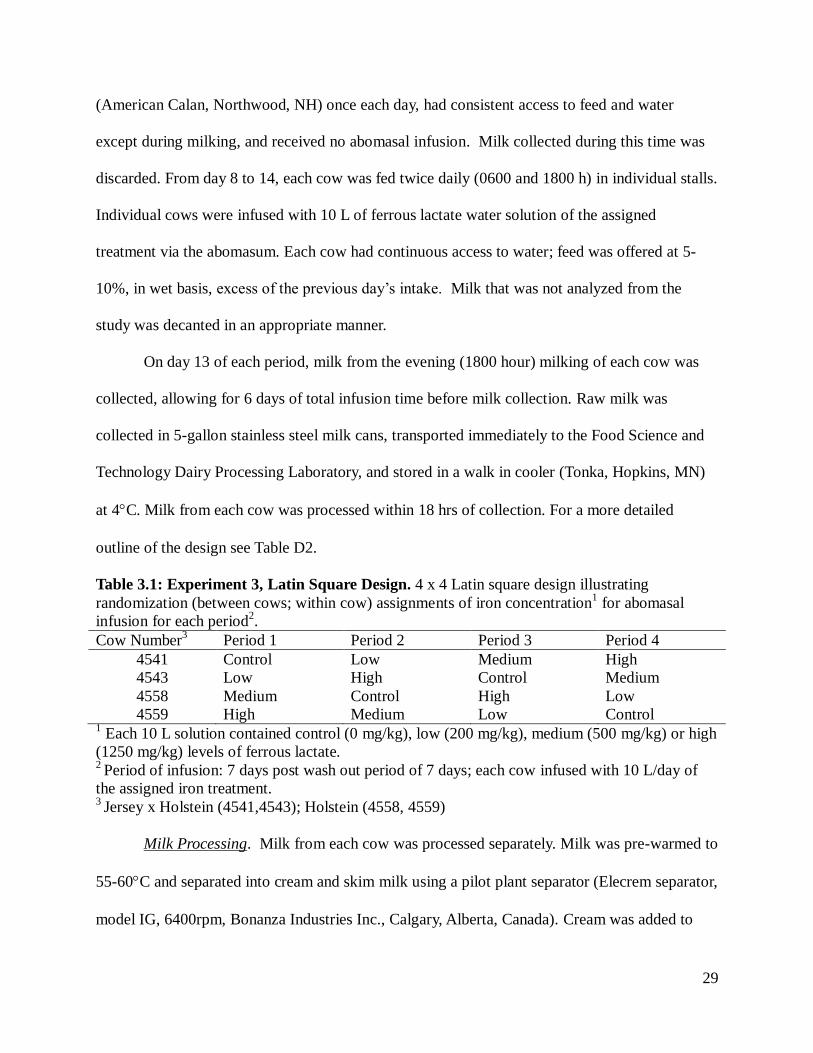
(American Calan, Northwood, NH) once each day, had consistent access to feed and water
except during milking, and received no abomasal infusion. Milk collected during this time was
discarded. From day 8 to 14, each cow was fed twice daily (0600 and 1800 h) in individual stalls.
Individual cows were infused with 10 L of ferrous lactate water solution of the assigned
treatment via the abomasum. Each cow had continuous access to water; feed was offered at 5-
10%, in wet basis, excess of the previous day’s intake. Milk that was not analyzed from the
study was decanted in an appropriate manner.
On day 13 of each period, milk from the evening (1800 hour) milking of each cow was
collected, allowing for 6 days of total infusion time before milk collection. Raw milk was
collected in 5-gallon stainless steel milk cans, transported immediately to the Food Science and
Technology Dairy Processing Laboratory, and stored in a walk in cooler (Tonka, Hopkins, MN)
at 4C. Milk from each cow was processed within 18 hrs of collection. For a more detailed
outline of the design see Table D2.
Table 3.1: Experiment 3, Latin Square Design. 4 x 4 Latin square design illustrating
randomization (between cows; within cow) assignments of iron concentration1 for abomasal
infusion for each period2.
Cow Number3
Period 1 Period 2 Period 3 Period 4
4541 Control Low Medium High
4543 Low High Control Medium
4558 Medium Control High Low
4559 High Medium Low Control 1 Each 10 L solution contained control (0 mg/kg), low (200 mg/kg), medium (500 mg/kg) or high
(1250 mg/kg) levels of ferrous lactate. 2 Period of infusion: 7 days post wash out period of 7 days; each cow infused with 10 L/day of
the assigned iron treatment. 3 Jersey x Holstein (4541,4543); Holstein (4558, 4559)
Milk Processing. Milk from each cow was processed separately. Milk was pre-warmed to
55-60C and separated into cream and skim milk using a pilot plant separator (Elecrem separator,
model IG, 6400rpm, Bonanza Industries Inc., Calgary, Alberta, Canada). Cream was added to
30
skim milk to achieve 3.18%±0.04% milkfat, as verified by the Babcock procedure using AOAC
989.04 (Bradley, 2000). Milk was homogenized using a laboratory 2-stage homogenizer (13.8
Mpa (2000psi)—first stage; 5.52 Mpa (800 psi)—second stage)(model 15MR, 55.2 Mpa
(8000psi), APV Gaulin, Inc., Everett, Massachusetts, U.S.A.).
Standardized milk was vat pasteurized at 66C for 30 minutes. Microbial quality was
assessed by aerobic plate count standard methods using aerobic count petrifilm (3M Petrifilm,
Microbiology Products 3M Health Care, ST Paul MN), following standard methods (Laird DT,
2004). Processed milk, two gallons per cow (treatment), was packaged in translucent food grade
high density polyethylene gallon packages. Packages were sanitized with a chlorine (100 mg/kg)
rinse (dH2O). Milk packages were stored inside a large portable cooler to prevent light
penetration and the cooler was placed in a larger walk-in cooler (Tonka, Hopkins, MN) at 4C
case for 11 days. This holding period allowed for adequate time for all analyses to be run, as it
was not possible to run all analyses within 24 hours, effectively showing a difference in week
one and week two analyses (day 1 and day 8). Each analysis procedure was repeated on the same
day of each week. Each period sequence was as follows: processing (d0), TBARS (d1, d8), GC-
MS and sensory (d2, d9), protein, ash and ICP-MS preparation (d3, d10). Week one analyses
were run within 72 h of milk processing (subsequently designated d1) and week two analyses
were run within 7 days of week one analyses (subsequently designated d8).
Virginia Tech IRB approval was received prior to recruitment of human subject
participants (IRB 12-227, Appendix E). Participants completed three sensory triangle tests (d1
and d8), comparing milk from the control cow to each treatment. The order of the three triangle
tests and within each 3-sample test was balanced across panelists. Statistical parameters of =
0.05, =0.3, and pd of 30% required a minimum of 36 observations per comparison on each day
31
of testing (Meilgaard et al., 2007). A critical number of 18 correct observations per test
comparison was needed to determine that the treatment milk was different from the control milk
on each testing day of each period when n=36 participants (Meilgaard et al., 2007). A critical
number of 58 correct observations per overall test comparison over the four periods (n = 144
total observations) was needed to establish that there was a significant difference between control
and treatments for day 2 and day 9. The combined number of observations (n=288) per
comparison required a critical number of 96 to establish if there was a significant difference
between control and each treatment.
Statistical Analyses. A Latin square design was used for assigning iron-infusion
treatments to each cow (n=4 replications). A random effects analysis of variance (ANOVA) was
used to determine the effects of infused iron on the dependent variable of composition (total
protein, ash, concentration of each mineral) using JMP vs. 10.0.0 Pro Statistical Discovery
Software (SAS Institute Inc, Cary, NC). Effects of time (2 levels: d1, d8) and treatment (4 levels
of iron) on oxidative stability parameters (TBARS, total volatiles) were analyzed by Tukey-
Kramer analysis. If no time effects were observed, values were treated as duplicates to increase
the power of the test. A cross effects analysis was completed to see the effects of 2-way and 3-
way interactions (cow by treatment, treatment by period, period by cow, and cow by period by
treatment) for gross composition dependent variables (protein, ash) and TBARS. An effects test
of week nested within treatment was also run for TBARS. Mean values and standard errors for
each dependent variable were calculated for each iron-infusion treatment by week (day). All
statistical measures were carried out with a predetermined alpha of 0.05. Virginia Tech's
Laboratory for Interdisciplinary Statistical Analysis (LISA) was consulted to ensure appropriate
statistical analyses were used.
32
Experiment 4 (Case Study): Effect of Low and High Iron Sources in Bovine Drinking Water
on Mineral Composition and Oxidative Stability of Raw Milk
A dairy farm in Franklin County, Virginia was identified with two water sources having
different iron concentrations. 204 cows had ad libitum access to the water source to the low iron
(mean±SD; 0.014±0.005 mg/kg Fe) water source (free stall) and the other portion of the herd
(136 cows) had ad libitum access to the high iron (0.99±0.61 mg/kg Fe) water source (outside
water hydrant). Water iron levels were determined by ICP-MS. Feed, milking and other herd
management conditions were consistent for all milking cows. The influence of extended
exposure of high iron water consumption on composition and oxidative stability of raw milk was
determined.
Dairy Herd Information Association (DHIA) Analyses. Samples from 340 cows from the
dairy farm were submitted to the Virginia Tech DHIA lab for sample analysis. Samples were
obtained by a DHIA technician on the farm site. The technician recorded milk weights from
cows and took milk samples in vials. Preservative treatments, bronopol to control bacteria and
natamycin to suppress yeast growth, were in sample vials before sample addition. Samples were
shipped via UPS, no refrigeration, and delivered day after collection. Testing was done promptly
by the DHIA lab for fat composition, protein, nonfat solids and somatic cell count. Samples
were analyzed using flowcytometry technology to determine somatic cell count and Fourier
Transform Infared analysis for milk composition (CombiFossTM
, Foss, Denmark).
During the testing each sample was heated a minimal amount and returned to room
temperature. DHIA-tested samples were retrieved and taken to the Food Science and Technology
building within 12 hours of receipt by the DHIA lab where they were stored in a dark cooler at
4oC to prevent further oxidation for 12 hours. Individual cows were separated into the two
treatments based on herd information provided by the farm owner. Each racking number on the
33
sample correlated to a cow number that identified which water source was provided to the cow.
Pooled test samples were created by mixing 10 mL each from 17 individual cows. The pooled
samples (n=8 samples per water treatment) were transferred into plastic LDPE bottles, labeled
appropriately, and stored in a dark cooler at 4oC for 4 hours. Due to DHIA container failures
some individual cow samples had to be discarded so not all 372 cows were represented in the
pooled samples. In order to make sample sizes equal for both treatments 272 cow samples were
used in the study.
Pooled samples were extracted and TBARS analyses completed on the same day that
pooled samples were created. Each pooled sample was analyzed in duplicate. A nitric acid
digestion was performed on each sample within 5 days of being pooled; the digested samples
were analyzed for mineral content using ICP-MS after 15 days of storage.
Statistical Analyses. Means and standard error were determined. Differences between
iron treatments in reference to MDA concentration (TBARS), mineral content (Ca, Cu, Fe, P),
and lab analyses from the DHIA laboratories (milk volume, percent fat, percent protein) were
determined by using ANOVA. All statistical measures were carried out with a predetermined
alpha of 0.05.
Analytical Methods
Milk Composition Analyses. In addition to the fat analysis by Babcock method, milk was
analyzed for gross composition (total protein, ash) and mineral composition (day 1 and day 8 for
experiment 3). Protein content was determined following the instructions using a commercial
protein analysis kit (2-D Quant Kit, General Electric, Fairfield, Connecticut, USA). Percent ash
was measured using the gravimetric method (AOAC 945.46) (Bradley, 2000). Ash was
calculated with the following formula (Siddique et al., 2010).
34
Ash (%) =
Calcium, copper, iron and inorganic phosphorus concentrations was measured on each
sample (experiment 2, 3, 4) by ICP-MS (Thermo Electronic Corporation, X-Series ICP-MS,
Waltham, MA). Before the milk was analyzed by ICP-MS, the milk was prepared using a
modified nitric acid digestion procedure based on a method described for infant formula (Cook
and Suddendorf, 1984). A 10% nitric acid (HNO3) solution was made from 67-70% HNO3
(EMD, Canada, CAS 7697-37-2). Glassware was cleaned by soaking overnight in 10% HNO3
and thoroughly rinsed with nanopure water. Milk was vigorously shaken to ensure mixing before
allocating 50mL into a 250 mL beaker. HNO3 (3 mL) was added to milk and placed on a hotplate
to evaporate to less than 10 mL, but not to dryness. The sample was then removed from the
hotplate, cooled, and 5 mL of HNO3 added. The beaker was covered with a watch glass to allow
a gentle reflux action to occur until the mixture was again evaporated to less than 10mL; it was
then removed to let cool. Hydrochloric acid (EMD, Canada, CAS 7647-01-0)-H2O (5 mL of 1:1
solution) and 5 mL of nanopure water were added to the cooled mixture and heated for 15
minutes. After the final heating, the mixture was cooled and filtered using WhatmanTM
41 paper
filters to remove lipids (GE Healthcare, Buckinghamshire, UK). The filtered liquid was stored in
60 mL low density polyethylene sealed plastic bottles and stored at room temperature until ICP-
MS analysis using an inductively coupled plasma emission spectrometer using Standard Method
3125B (Rice et al., 2012).
Oxidation Analyses. Oxidative stability of milk was estimated based on assessment of
malondialdehyde by means of the TBARS test and changes in volatile chemistry using gas
chromatography-mass spectroscopy (GC-MS). Sensory evaluation was used to determine if
overall differences in flavor and odor existed between milk from control and iron-infused cows
35
for each treatment level. Analyses were completed on days 1 and day 8 post-processing and all
analyses for oxidation were completed within 24 hrs of each respective day.
TBARS. TBARS analyses were completed to measure secondary metabolites of oxidation
(aldehydes), specifically malondialdeyde (MDA), which can indicate oxidation (Spanier and
Traylor, 1991). Each sample (1 mL) was homogenized in a 15 mL plastic centrifuge tube by
means of a vortex prior to the analysis and weighed for accuracy. Samples were diluted by
adding 4 mL dH2O and recovering 1 mL of the diluted sample for analysis. Then 2 mL of
solution I (0.375% thiobarbituric acid, 0.506% SDS, 9.370% acetic acid) were added with 0.1
mL of solution III (antioxidant and chelator solution). Samples were vortexed to ensure proper
mixing. Samples were capped and kept at 95C in a water bath for 60 minutes. Cooled samples
were placed under a fume hood and 2.5 mL of solution II (15:1 mixture of n-butanol and
pyridine) were added. Samples were mixed by vortexing for 10 seconds each then centrifuged at
25C at 3000 rpm for 15 minutes. Approximately 2.5-3 mL of the top-layer organic solution were
pipetted into a cuvette and the absorbance was read at 532 nm under a fume hood (Milton Roy
Spectronic 21D Spectrophotomer, Milton Roy Company, Rochester, NY). The amount of MDA
per sample was determined by using a standard curve made by means of a linear regression on
absorbance values and mg/kg malondialdehyde of the 4 standard tetramethoxypropane (TMP)
solutions. Standard solutions, one per concentration, were 0, 2.5, 5, and 7 micromol TMP.
Samples of milk were tested in duplicate.
Volatile Chemistry. GC-MS analysis was used to determine changes in the volatile
straight chain aldehydes in the milk (experiment 3) as a result of the oxidation process (Barrefors
et al., 1995). Volatile compounds were adsorbed and concentrated onto an 85-μm
carboxenpolydimethyl siloxane solid phase micro-extraction (SPME) fiber (Supelco, Bellefonte,
36
PA) that had been conditioned at manufacturer recommended temperature conditions (Supelco,
Bellefonte, PA). The fiber was conditioned using an empty sealed vial to calibrate the machine
and to ensure desorption of extraneous compounds on the SPME fiber prior to sample analysis.
Samples of milk (8 mL) were pipetted into 20 mL amber vials. All samples were kept, by means
of a tray cooler, at 4oC (MC 03-01, PAL System CTC Analytics, Lake Elmo, MN). The SPME
fiber was injected (4 mm) into the sample headspace through the septum using an autosampler
(CombiPAL, CTC Analytics / Leap Technologies, San Diego, CA). The sample was heated to
45°C on an RCT basic heater with an ETS-D4 Fuzzy Controller (IKA Werke, Wilmington, NC)
while being agitated at 250rpm, 5 seconds on and 2 seconds off,. The extraction time, allowing
adsorption, was 20 minutes long. An HP5890A along with a HP 5972 series mass selective
detector (Hewlett Packard, Palo Alto, CA) was used to analyze the volatile oxidation products
that were adsorbed onto the fiber. Desorption occurred onto a DB-5 capillary column (30m x0.25
mm I.D. x 0.25μm film thickness, J&W Scientific, Folsom, CA). Volatiles were separated on the
column by the following conditions: helium gas flow 1.8 mL/min; injector temperature of 280oC.
Initial run temperature was 35oC for 15 seconds. The temperature then increased at a rate of 15
oC
per minute until 180oC was reached and was held for 30 seconds. The temperature was then
increased at 20oC/minute to reach a final detector temperature of 260
oC and held for 30 seconds.
The program analysis was run in splitless mode. Total run time was approximately 25 minutes.
Eternal standards of hexanal (Acros Organics, New Jersey, USA, CAS 66-25-1) and pentanal
(Acros Organics, New Jersey, USA, CAS 110-62-3) were diluted in dH2O and used to identify
and quantitate volatile oxidation products (Li, 2011). The chromatograms, both for samples and
standards, were analyzed and plotted in HP ChemStation software (Hewlett Packard, Palo Alto,
CA). Standards were evaluated and identified by peak times and areas under their respective
37
curves. For each period (four total) in the experimental study, milk was analyzed for volatiles
within 3 days of processing and again within 10 days of processing. Each treatment was tested in
duplicate (n=8).
Sensory Evaluation. Sensory discrimination testing by triangle tests was used to
determine if samples were perceptibly different, possibly as a function of oxidation. Sensory
testing in experiment 1 and 3 occurred in the sensory laboratory of the Food Science and
Technology Department. Panelists were seated in individual booths under white lighting. Testing
was managed using the Sensory Information Management System (SIMS) software (Sensory
Computer System LLC, Morristown, NJ). Data were collected using touchscreen monitors,
downloaded to the server, and data compilation for each triangle test completed by the software.
Milk samples (ca. 30 mL) were poured into portion cups (60 mL), capped with lids, and
refrigerated (4C) until testing. Samples were coded with 3-digit numbers. Triangle test samples
(control versus iron treatment) were presented in a balanced order as determined by the SIMS
software. Panelists were asked to taste each sample, comparing the milk aroma and flavor, and
identify which sample was different from the other two.
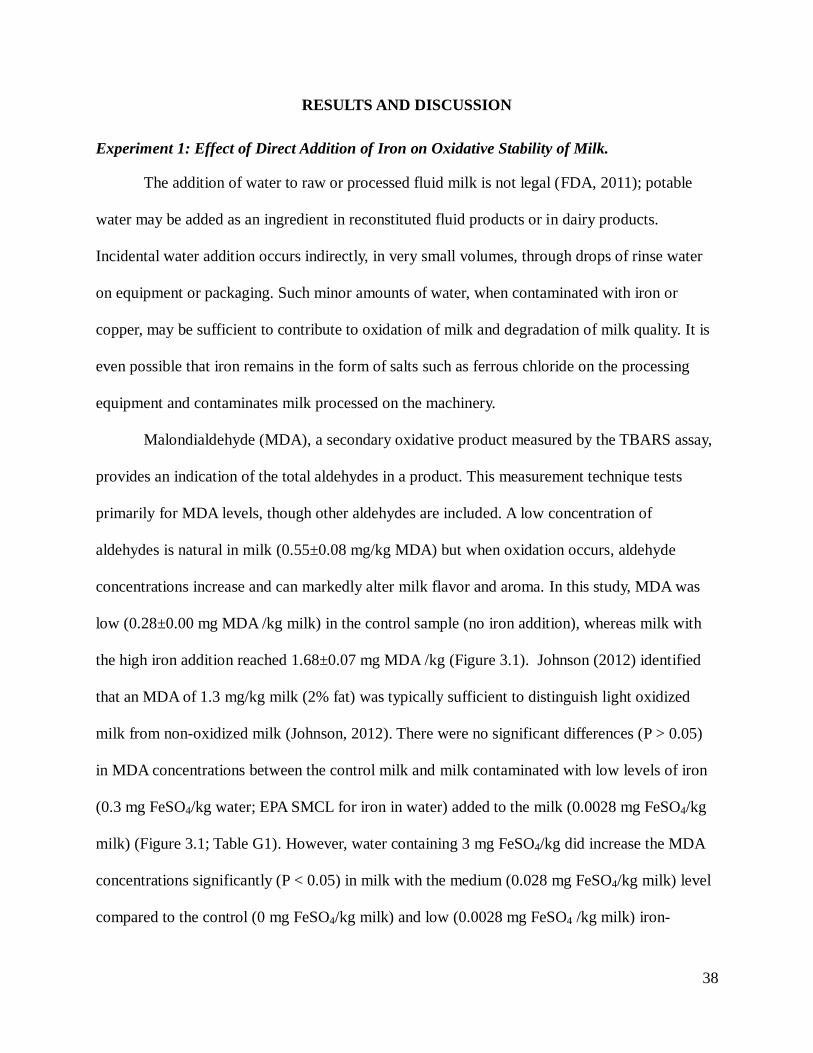
38
RESULTS AND DISCUSSION
Experiment 1: Effect of Direct Addition of Iron on Oxidative Stability of Milk.
The addition of water to raw or processed fluid milk is not legal (FDA, 2011); potable
water may be added as an ingredient in reconstituted fluid products or in dairy products.
Incidental water addition occurs indirectly, in very small volumes, through drops of rinse water
on equipment or packaging. Such minor amounts of water, when contaminated with iron or
copper, may be sufficient to contribute to oxidation of milk and degradation of milk quality. It is
even possible that iron remains in the form of salts such as ferrous chloride on the processing
equipment and contaminates milk processed on the machinery.
Malondialdehyde (MDA), a secondary oxidative product measured by the TBARS assay,
provides an indication of the total aldehydes in a product. This measurement technique tests
primarily for MDA levels, though other aldehydes are included. A low concentration of
aldehydes is natural in milk (0.55±0.08 mg/kg MDA) but when oxidation occurs, aldehyde
concentrations increase and can markedly alter milk flavor and aroma. In this study, MDA was
low (0.28±0.00 mg MDA /kg milk) in the control sample (no iron addition), whereas milk with
the high iron addition reached 1.68±0.07 mg MDA /kg (Figure 3.1). Johnson (2012) identified
that an MDA of 1.3 mg/kg milk (2% fat) was typically sufficient to distinguish light oxidized
milk from non-oxidized milk (Johnson, 2012). There were no significant differences (P > 0.05)
in MDA concentrations between the control milk and milk contaminated with low levels of iron
(0.3 mg FeSO4/kg water; EPA SMCL for iron in water) added to the milk (0.0028 mg FeSO4/kg
milk) (Figure 3.1; Table G1). However, water containing 3 mg FeSO4/kg did increase the MDA
concentrations significantly (P < 0.05) in milk with the medium (0.028 mg FeSO4/kg milk) level
compared to the control (0 mg FeSO4/kg milk) and low (0.0028 mg FeSO4 /kg milk) iron-
39
containing water treatments. MDA concentration in milk with the high iron treatment (1.68 mg
MDA /kg ±0.07) was significantly different from the MDA in milk with the medium treatment
(1.09 mg MDA /kg±0.04) and above the 1.3 mg MDA/kg concentration recognized by Johnson
(2012) as a sensory threshold for perceptible oxidation. Sensory results confirmed that the
addition of iron contributed to sensory differences, even at the low level of iron addition (EPA
SMCL concentration; Table G2), which suggests that the sensory difference between a non-
oxidized and a slightly oxidized milk sample may be more sensitive than the TBARS assay and
that the incidental contamination of milk with water containing iron can affect milk sensory
quality. Although not specifically tested, the just noticeable sensory difference between a non-
oxidized sample and a slightly oxidized sample (control vs. low iron treated sample) may
correspond to as little as 0.2 mg/kg MDA, based on the TBARS assay. This estimate is based on
a direct sensory comparison of samples, using a triangle test method, and may not be sufficient to
identify oxidation in an independent sample by an untrained consumer. These subtle differences
did not seem to have the same effect in experiment 3, but the milk used in experiment was from
individual cows and processed differently than in a commercial setting.
It is well known that the addition of iron to milk by direct addition (Gaucheron et al.,
1996; Gaucheron, 2000; McKie et al., 2001; Raouche et al., 2009) and to various milk products
(unstandardized, skim milk, infant formula) causes oxidation (Hegenauer et al., 1979a;
Gaucheron et al., 1996; Satue-Gracia et al., 2000; Raouche et al., 2009). Iron is quite unstable,
particularly in the ferrous form (McKie et al., 2001) and rapidly initiates auto-oxidation of
unsaturated fatty acids. However, this study documented that even a small amount of iron in the
water source used within the dairy farm or processing plant for cleaning of cows, equipment, or
packaging can affect quality of the final product.
40
Figure 3.1: Experiment 1, Treatment vs. MDA. Malondialdehyde (MDA) concentration
(mg/kg; mean SE; n=3), as indication of oxidation in commercially processed milk treated with
iron (ferrous sulfate) solutions at four levels [control (0 mg/kg low (0.3 mg/kg; EPA SMCL
level), medium (3 mg/kg) and high (30 mg/kg)]. Final (added) iron concentrations in milk were
control (0 mg/kg); low (0.0028 mg/kg); medium (0.028 mg/kg); and high (0.28 mg/kg). Milk
was stored for 3 days (4C; no light exposure). Error bars display standard error from the mean.
Statistically significant differences (P < 0.05) are represented by different superscript letters,
determined by ANOVA.
41
Experiment 2: Validation of Inductively Coupled Plasma Mass Spectrometry (ICP-MS) and
TBARS Extraction Protocols on Processed Milk
This purpose of this validation study was to ensure that both the nitric acid digestion
methods and ICP-MS use could be replicated with low variation. It was also imperative to ensure
that the analyses obtained results that were within normal range as compared to published data
for milk mineral composition.
Published concentrations of calcium, copper, iron and phosphorus in processed whole
milk, based on USDA Nutrient Database (Milk Facts, 2013), are 1130 mg/kg 0.11 mg/kg, 0.30
mg/kg, and 910 mg/kg respectively. Mineral (Ca, Cu, Fe, P) concentration between milk and
organic processed milk (900±13.3 mg/kg Ca, 0.029±0.002 mg/kg Cu, 0.215±0.008 mg/kg Fe,
and 650±10.3 mg/kg P) were not statistically different (P > 0.05) (Table H1). Based on the
published values, the extraction and ICP-MS analysis of each mineral was 80% for calcium, 27%
for copper, 72% for iron and 71% for phosphorus. However, the phosphorus analyzed is
inorganic. While mineral levels are lower than reported by USDA (Milk Facts, 2013),
observations for calcium, iron and phosphorus fall within the ranges for each mineral found
within published literature. Previous studies on commercially processed milk have shown that
mineral content varies, perhaps based on analytical procedure as well as milk source (Murthy et
al., 1972; Hunt and Meacham, 2001; Birghila et al., 2008; Hunt and Nielsen, 2009). Mineral
concentration in processed milk range between 1097-1495 mg/kg Ca, 0.042-0.18 mg/kg Cu,
0.17-1.45 Fe, and 854-930 mg/kg P (Murthy et al., 1972; Goff and Hill, 1993; Rodríguez
Rodríguez et al., 1999; Hunt and Meacham, 2001; Hunt and Nielsen, 2009). Atomic absorption
spectroscopy of mineral composition in commercially processed milk showed broad ranges in
copper (0.042-0.18 mg/kg Cu) and iron concentrations (0.20-1.45 mg/kg Fe) (Murthy et al.,
1972). Birghila et al. (2008) reported iron concentrations in pasteurized milk between 0.8 mg/kg
42
to as high as 11.84 mg/kg, displaying that iron levels in milk vary widely (Birghila et al., 2008).
It is known that copper precipitates easily at a moderate pH, ca. pH 6 and that iron has a
tendency to lower pH (Chaplin, 1984; Gaucheron et al., 1996; Balintova and Petrilakova, 2011).
Method of analysis does seem to have an effect on mineral recovery, contributing to a wide range
of mineral reports. Studies on mineral waters have shown lower recovery rates for Fe and Cu in
comparison to Al, Ni or Mo (Haraguchi et al., 2004).
ICP-MS analysis for each mineral provided low variance, with standard deviations less
than 10%, with the exception of iron (16%). Low variation in the present study shows that
mineral analysis using ICP-MS provides a way to compare relationships among treatments and
consequential effects on mineral levels. The low degree of variation may still allow conclusions
to be drawn about mineral level relationships among milk samples (Goff and Hill, 1993).
Experiment 3: Influence of Abomasal Infusion of Iron on Oxidative Stability of Processed
Milk
Milk Composition. Compositional analyses of the raw milk from this study was reported
in Feng et al. (Feng et al., 2013). Protein (3.8%), fat (3.2%) and ash (0.6%) content of the
processed milk were not statistically different (P > 0.05) with respect to cow, week, nor treatment
(Table I2 and I3) and were within normal ranges for processed milk (Murthy et al., 1972;
Jenness, 1974; Goff and Hill, 1993; Moreno-Rojas et al., 1993; Moreno-Rojas et al., 1994).
However, processing period did have a significant effect on percent protein (data not shown) and
there was a statistically significant (P=0.01) 3-way interaction (treatment*cow*period) (Table
I3). Variations in composition may be attributed to small variations in processing conditions,
differences in cow breed, stage of lactation, as progression of the season (Jensen, 1995).
Iron, copper, phosphorus and calcium concentrations in the processed milk did not differ
significantly (P > 0.05) among the different iron infusion treatments (935±26 mg/kg Ca,
43
0.040±0.001 mg/kg Cu, 0.220±0.010 mg/kg Fe, 847±27 mg/kg P) based on ANOVA analysis.
Main effects tests did show significant interactions for calcium, copper, and iron for 2-way
interaction of cow x treatment (P <0.05), suggesting that treatment may have affected mineral
composition of milk differently among cows (Table I4). Concentrations for calcium, copper, iron
and phosphorus were 82%, 36%, 74%, and 93% of the USDA reported values for whole (3.25%)
milk (Milk Facts, 2013) and were similar to the results from the ICP-MS study on milk and
organic milk. These minerals were specifically reported as indicators of pro-oxidants (copper,
iron) in the milk and to determine effects of dietary iron on milk calcium and phosphorus, which
are important for casein stability and dairy product processing. The pro-oxidants, copper and
iron, revealed significant interactions for the 3-way interaction between treatment x cow x period
(Table I4).
Colloidal Ca and P are strongly associated with the casein proteins of milk (Goff and Hill,
1993). The Ca:P ratio (ca. 4:3) is important to note as it plays a vital role in cheese making and
balancing the pH for proper ripening (Upreti and Metzger, 2007). Cheese curd, mostly casein,
contains calcium phosphate (Ca3(PO4)2). Cheese making potential for milk can be influenced by
the Ca:P ratio as calcium phosphate plays an integral part is curd formation and stabilization
(Cerbulis and Farrell, 1976; Hutkins, 2006). The Ca:P ratio of the means in this study was about
3.3:3. However, the wide variation in the experimental study suggests that this may not be
accurate for each cow (Figure 3.2).
Mineral composition of milk has been linked to bovine feed. Copper levels in milk are
attributed to copper concentrations in feed (Havemose et al., 2006) whereas there is very little
information about the relationship of iron concentrations in feed or water associated with
changes in iron concentrations in the milk (Underwood, 1971; Murthy et al., 1972). Copper and
44
iron content in the milk are affected by lactation stage; iron content is also dependent on breed,
season of the year, and other handling methods (Moreno-Rojas et al., 1993; Sikiric et al., 2003).
Post-milking iron contamination historically was also associated with cans, pipes, or other
storage methods (Underwood, 1971; Murthy et al., 1972). However, this is less common than
seen in years past at the dairy industry has shifted the use of copper pipes to other materials
(Clark et al., 2009; Anonymous, 2010).
The experimental study showed more variation in mineral composition than in the direct
iron addition study on processed commercial milk. The direct iron addition study was based on
five replicate analyses from two different samples and illustrated that the protocols employed
were reproducible. In this study, cow to cow variation contributed substantially to larger standard
errors. While a Latin square is an appropriate experimental design, treatment replications (n=4
per treatment) were obtained from different cows. The following factors may have contributed to
the variation observed: limited number of cattle in the study, number of breeds (Holsteins (n=2)
and crossbreeds (n=2)), order of treatment received in reference to stage of lactation and multiple
processing steps for each treatment within each period (Murthy et al., 1972; Moreno-Rojas et al.,
1993; Moreno-Rojas et al., 1994). Figures 3.2 and 3.3 (Table I1) illustrate the variation in
concentration of these minerals in processed milk by treatment as well as individual cow-to-cow
variation. Calcium, copper and iron all showed significant differences for the 2-way interaction
of treatment x cow (P < 0.05).
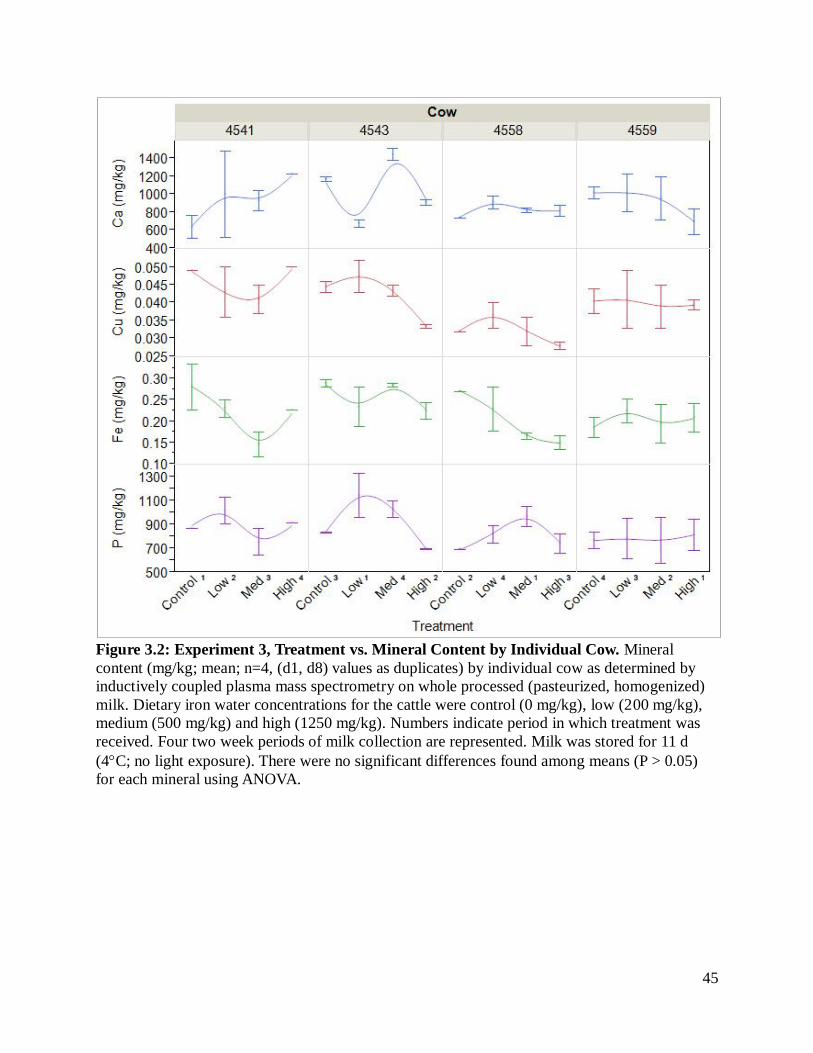
45
Figure 3.2: Experiment 3, Treatment vs. Mineral Content by Individual Cow. Mineral
content (mg/kg; mean; n=4, (d1, d8) values as duplicates) by individual cow as determined by
inductively coupled plasma mass spectrometry on whole processed (pasteurized, homogenized)
milk. Dietary iron water concentrations for the cattle were control (0 mg/kg), low (200 mg/kg),
medium (500 mg/kg) and high (1250 mg/kg). Numbers indicate period in which treatment was
received. Four two week periods of milk collection are represented. Milk was stored for 11 d
(4C; no light exposure). There were no significant differences found among means (P > 0.05)
for each mineral using ANOVA.
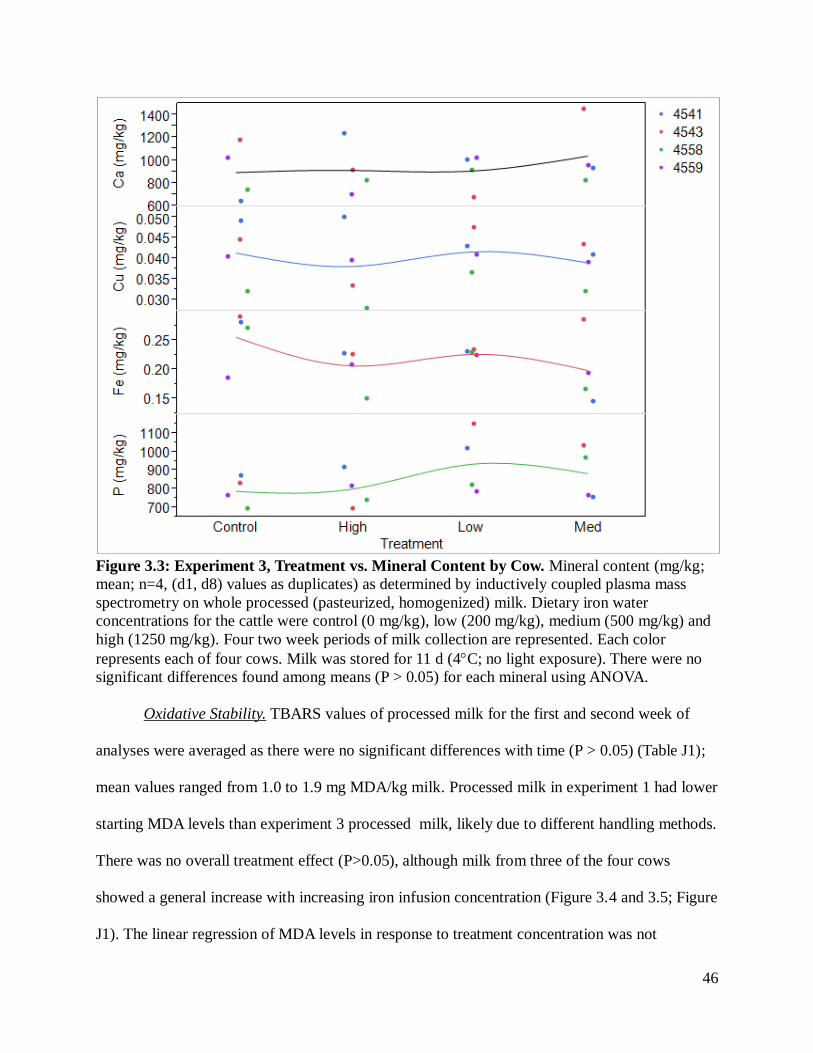
46
Figure 3.3: Experiment 3, Treatment vs. Mineral Content by Cow. Mineral content (mg/kg;
mean; n=4, (d1, d8) values as duplicates) as determined by inductively coupled plasma mass
spectrometry on whole processed (pasteurized, homogenized) milk. Dietary iron water
concentrations for the cattle were control (0 mg/kg), low (200 mg/kg), medium (500 mg/kg) and
high (1250 mg/kg). Four two week periods of milk collection are represented. Each color
represents each of four cows. Milk was stored for 11 d (4C; no light exposure). There were no
significant differences found among means (P > 0.05) for each mineral using ANOVA.
Oxidative Stability. TBARS values of processed milk for the first and second week of
analyses were averaged as there were no significant differences with time (P > 0.05) (Table J1);
mean values ranged from 1.0 to 1.9 mg MDA/kg milk. Processed milk in experiment 1 had lower
starting MDA levels than experiment 3 processed milk, likely due to different handling methods.
There was no overall treatment effect (P>0.05), although milk from three of the four cows
showed a general increase with increasing iron infusion concentration (Figure 3.4 and 3.5; Figure
J1). The linear regression of MDA levels in response to treatment concentration was not
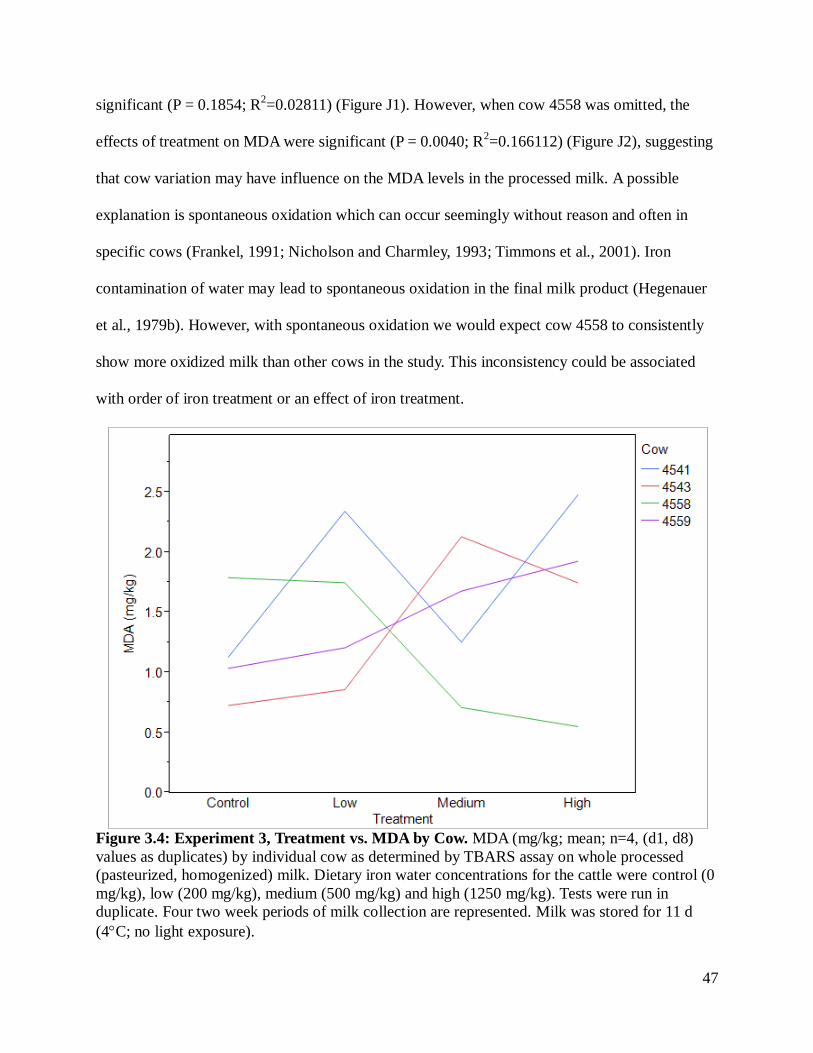
47
significant (P = 0.1854; R2=0.02811) (Figure J1). However, when cow 4558 was omitted, the
effects of treatment on MDA were significant (P = 0.0040; R2=0.166112) (Figure J2), suggesting
that cow variation may have influence on the MDA levels in the processed milk. A possible
explanation is spontaneous oxidation which can occur seemingly without reason and often in
specific cows (Frankel, 1991; Nicholson and Charmley, 1993; Timmons et al., 2001). Iron
contamination of water may lead to spontaneous oxidation in the final milk product (Hegenauer
et al., 1979b). However, with spontaneous oxidation we would expect cow 4558 to consistently
show more oxidized milk than other cows in the study. This inconsistency could be associated
with order of iron treatment or an effect of iron treatment.
Figure 3.4: Experiment 3, Treatment vs. MDA by Cow. MDA (mg/kg; mean; n=4, (d1, d8)
values as duplicates) by individual cow as determined by TBARS assay on whole processed
(pasteurized, homogenized) milk. Dietary iron water concentrations for the cattle were control (0
mg/kg), low (200 mg/kg), medium (500 mg/kg) and high (1250 mg/kg). Tests were run in
duplicate. Four two week periods of milk collection are represented. Milk was stored for 11 d
(4C; no light exposure).
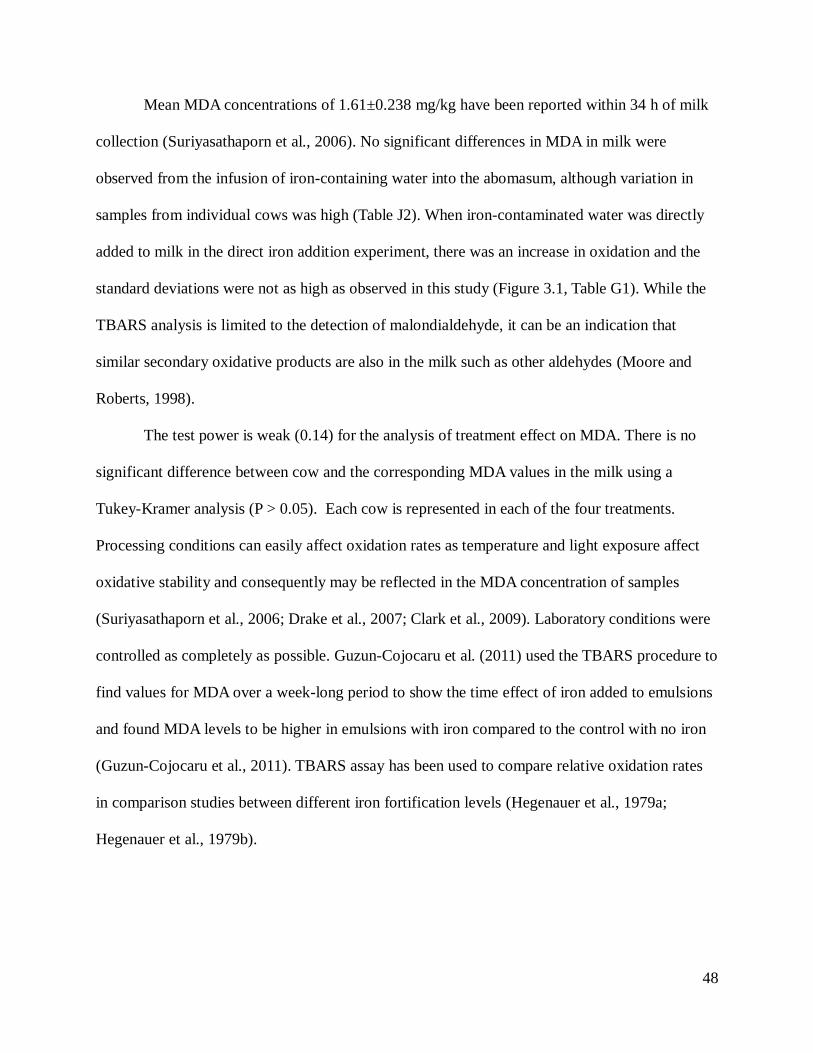
48
Mean MDA concentrations of 1.61±0.238 mg/kg have been reported within 34 h of milk
collection (Suriyasathaporn et al., 2006). No significant differences in MDA in milk were
observed from the infusion of iron-containing water into the abomasum, although variation in
samples from individual cows was high (Table J2). When iron-contaminated water was directly
added to milk in the direct iron addition experiment, there was an increase in oxidation and the
standard deviations were not as high as observed in this study (Figure 3.1, Table G1). While the
TBARS analysis is limited to the detection of malondialdehyde, it can be an indication that
similar secondary oxidative products are also in the milk such as other aldehydes (Moore and
Roberts, 1998).
The test power is weak (0.14) for the analysis of treatment effect on MDA. There is no
significant difference between cow and the corresponding MDA values in the milk using a
Tukey-Kramer analysis (P > 0.05). Each cow is represented in each of the four treatments.
Processing conditions can easily affect oxidation rates as temperature and light exposure affect
oxidative stability and consequently may be reflected in the MDA concentration of samples
(Suriyasathaporn et al., 2006; Drake et al., 2007; Clark et al., 2009). Laboratory conditions were
controlled as completely as possible. Guzun-Cojocaru et al. (2011) used the TBARS procedure to
find values for MDA over a week-long period to show the time effect of iron added to emulsions
and found MDA levels to be higher in emulsions with iron compared to the control with no iron
(Guzun-Cojocaru et al., 2011). TBARS assay has been used to compare relative oxidation rates
in comparison studies between different iron fortification levels (Hegenauer et al., 1979a;
Hegenauer et al., 1979b).
49
Figure 3.5: Experiment 3, Treatment vs. MDA. Malondialdehyde concentration (mg/kg; mean;
n=4, (d1, d8) values as duplicates), as indication of oxidation on whole processed (pasteurized,
homogenized) milk. Dietary iron water concentrations for the cattle were control (0 mg/kg), low
(200 mg/kg), medium (500 mg/kg) and high (1250 mg/kg). All of the four two week periods of
milk collection are represented. Milk was stored for 12 total days (4C; no light exposure). There
were no significant differences found between the two weeks for each mineral (P > 0.05) using a
Tukey-Kramer analysis. Four two week periods of milk collection are represented. Bars indicate
mean values; error bars display standard error from the mean. Mean MDA values are 1.17, 1.53,
1.44, and 1.68, respectively. There were no significant differences found among means (P > 0.05)
using ANOVA.
Concentration of hexanal and pentanal, volatile aldehydes that are often measured as an
indication of oxidation of milk, did not change in peak area during refrigerated storage for one
week or in response to the treatments (Tables J4 and J5).
While analytical tests did not indicate any effects of abomasal infusion of ferrous lactate
solutions on oxidative stability of the processed milk, sensory tests, using triangle testing
discrimination methods, showed that the panelists could discern differences between each
treatment sample when compared to the control (P < 0.01) (Table 3.2). Differences were
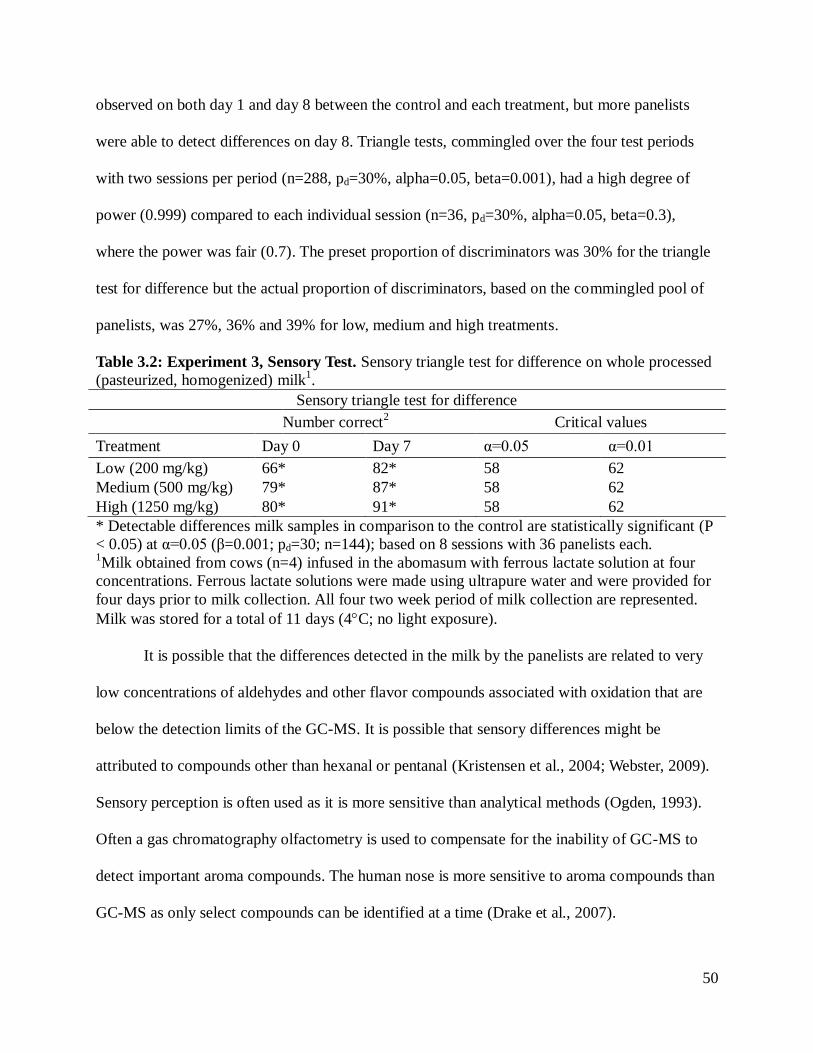
50
observed on both day 1 and day 8 between the control and each treatment, but more panelists
were able to detect differences on day 8. Triangle tests, commingled over the four test periods
with two sessions per period (n=288, pd=30%, alpha=0.05, beta=0.001), had a high degree of
power (0.999) compared to each individual session (n=36, pd=30%, alpha=0.05, beta=0.3),
where the power was fair (0.7). The preset proportion of discriminators was 30% for the triangle
test for difference but the actual proportion of discriminators, based on the commingled pool of
panelists, was 27%, 36% and 39% for low, medium and high treatments.
Table 3.2: Experiment 3, Sensory Test. Sensory triangle test for difference on whole processed
(pasteurized, homogenized) milk1.
Sensory triangle test for difference
Number correct2 Critical values
Treatment Day 0 Day 7 α=0.05 α=0.01
Low (200 mg/kg) 66* 82* 58 62
Medium (500 mg/kg) 79* 87* 58 62
High (1250 mg/kg) 80* 91* 58 62
* Detectable differences milk samples in comparison to the control are statistically significant (P
< 0.05) at α=0.05 (β=0.001; pd=30; n=144); based on 8 sessions with 36 panelists each. 1Milk obtained from cows (n=4) infused in the abomasum with ferrous lactate solution at four
concentrations. Ferrous lactate solutions were made using ultrapure water and were provided for
four days prior to milk collection. All four two week period of milk collection are represented.
Milk was stored for a total of 11 days (4C; no light exposure).
It is possible that the differences detected in the milk by the panelists are related to very
low concentrations of aldehydes and other flavor compounds associated with oxidation that are
below the detection limits of the GC-MS. It is possible that sensory differences might be
attributed to compounds other than hexanal or pentanal (Kristensen et al., 2004; Webster, 2009).
Sensory perception is often used as it is more sensitive than analytical methods (Ogden, 1993).
Often a gas chromatography olfactometry is used to compensate for the inability of GC-MS to
detect important aroma compounds. The human nose is more sensitive to aroma compounds than
GC-MS as only select compounds can be identified at a time (Drake et al., 2007).
51
However, since this study used one cow per treatment per period, it is possible that
differences in milk flavors could be associated with cow-to-cow variation. Though the Latin
square design allowed for each cow to be her own control in evaluating effects of the iron
treatments, within each period the control milk used for the sensory testing was from one cow
and compared to the treatment milks from three different cows. The study did not include the
assessment of milk in all cows when there was no abomasal infusion, which could have provided
a control to verify if any cow-to-cow variation in milk flavor was detectable. While processing
conditions were controlled as much as possible, each batch of milk (cow/treatment) was
processed independently and slight variations in temperature and time in the pasteurization vat
may have occurred. This could cause slight differences in protein denaturation, leading to flavor
variations, though this impact was likely minimal in this study (Powell, 2001).
Sensory testing cannot be exclusively replaced by other analytical tests (Barrefors et al.,
1995). The human senses capture more than just one stimulus at a time, unlike many
instrumental methods. However, it is possible for relationships to be established between
instrumental and sensory tests (Drake, 2007). When comparing the treatments (low, medium,
high) to the control milk, sufficient numbers of panelists were able to discern a detectable
difference between the samples. This is primarily an indication that the added iron in the dietary
water may have a sensory effect on the milk that is otherwise undetectable by chemical analysis
(Jenness, 1974).
Experiment 4 (Case Study): Effect of Low and High Iron Sources in Bovine Drinking Water
on Mineral Composition and Oxidative Stability of Raw Milk
Milk samples for the case study were pooled sets from two treatment levels. Cattle
received water ad libitum from a water hydrant (0.99 mg/kg) noted as high iron and from a free
stall water source (0.018 mg/kg) noted as low iron. Cattle in both herds were separated. In
52
comparison to the treatment levels made for the experimental study (0, 2, 5, 12.5 mg/kg drinking
water) these levels were low, but this unique variation in iron level treatment in water on one
farm with portion of the herd receiving each water source provided an opportunity to look at the
effects of chronic exposure to water with an iron source above the EPA SMCL. Iron levels vary
in water on dairy farms in the southwestern region of Virginia (Martel et al., 2013). This case
study provided an opportunity to evaluate effects of long term exposure to higher iron levels in
drinking water in comparison to low levels.
DHIA laboratory analyses reported milk fat (3.85%±0.04%) and protein (3.06%±0.02%),
each within normal ranges (Goff and Hill, 1993; Jensen, 1995). MDA concentrations were not
different (P>0.05) between the two iron treatments (low 0.76±0.04 and high 0.78±0.05 mg/kg
MDA) with standard errors much lower than observed in the abomasal infusion study. The MDA
values in this study were slightly lower than the MDA values in the experimental study and were
in the normal range. The milk in the case study was raw, compared to processed (homogenized,
pasteurized) milk in the experimental study but had received a mild heat treatment during the
DHIA composition testing (Suriyasathaporn et al., 2006). However, the heat treatment was not
comparable to the heat treatment used in a processing scenario, a factor that can affect oxidation
(Eric A. Decker, 2010). Despite the low TBARS values, the coefficient of variation (4.2%) was
lower than the experimental study which may be due to the pooled design of the case study
compared to the testing of individual cows in the experimental design.
No statistically significant differences (P > 0.05) were detected between the iron
treatments and mineral content (834±20 mg/kg Ca, 0.043±0.009 mg/kg Cu, 0.232±0.017 mg/kg
Fe, 671±15.4 mg/kg P) of the milk (Table K1). Other published data have reported mineral levels
to be ca. 1100-1300 mg/kg calcium, 0.1-0.6 mg/kg Cu, 0.3-0.6 mg/kg Fe, and 900-1000 mg/kg P
53
in raw milk (Goff and Hill, 1993). Fe and Cu, measured using ICP-MS technology, were 1.18-
1.35 mg/kg and 0.31-0.32 mg/kg respectively in raw milk (Brescia et al., 2003). Phosphorus
concentration in raw milk, based on ICP, ranged from 768-856 mg/kg, or were determined using
other methods such as photometry after a sulfuric acid digestion (Brescia et al., 2003). This could
perhaps explain the lower levels of phosphorous consistently found by this study. Similar to the
validation study, Ca and P levels were lower than expected. Another study on raw milk reported
higher copper values than those found in the case study, but copper in the same study was
extreme (Moreno-Rojas et al., 1993). The mineral content can vary depending on lactation stage,
climate, feed type, and time of year (Murthy et al., 1972; Moreno-Rojas et al., 1993; Havemose
et al., 2006). These factors were not controlled for in this case study.
The analyses run by DHIA are also included in Appendix K. These include kilograms of
milk given per cow on the collection day, fat percent of milk and protein percent of milk. An
interesting difference to note is that the milk yield (between the cows receiving the low iron
water (average = 31±0.58 kg) and the cows receiving the high iron-containing water (27±0.54
kg) differed significantly (P < 0.05). This could be a difference in separation of herds (fresh and
sick cattle on low iron; medium milk producers on high iron) but it is also possible that cows
drinking the higher iron water may not be as willing to drink the water with metallic flavor as the
cows drinking the low iron water (less potential of metallic taste in the water). No significant
difference (P > 0.05) was noted in milk yield when cattle were infused with iron treatments
(Feng et al., 2013). It is known that the amount of iron in water can affect the palatability of the
water (National Primary Drinking Water Regulations, 2011) and cows that are on restricted water
intake, whether from lack of availability (drought) or lack of willingness to consume (metallic
flavor) may produce less milk (Genther and Beede, 2013).
54
CONCLUSIONS
Iron added directly to milk has been shown to increase the oxidation rates of milk. In
dairy processing this contamination may be through use of wash water in the processing plant.
Dairy production on the farm also should consider mineral content of water. Until now the effect
of dietary iron of bovine drinking water on milk quality was largely unstudied. It is likely that
high levels (> 0.3 mg/kg, EPA SMCL) of iron given to cattle in their drinking water does not
accelerate oxidation rates of milk nor alter mineral composition in a significant manner; however
sensory characteristics of milk from cows given iron treatments of more than 0.3 mg/kg may
differ. High iron contamination of bovine drinking water may affect some cows more than others
and perhaps may play a role in spontaneous oxidation. It is possible that cows receiving higher
levels of dietary iron produce less milk. Awareness of mineral concentration in water is important
in protecting the quality of the final milk product. Both farmers and processors should be wary of
mineral content of the water used for operations. It is possible that long-term effects of dietary
iron on cow health may be negative; further research on the topic is needed.
55
REFERENCES
Allen, J. C. and R. J. Hamilton. 1994. Rancidity in Foods. 3 ed. Springer, London.
Alvarez, V. B. 2009. Fluid milk and cream products. Pages 73-133 in The Sensory Evaluation of
Dairy Products. 2 ed. S. Clark, M. Costello, M. A. Drake, and F. W. Bodyfelt, ed.
Springer US, New York.
Anonymous. 2010. Stainless Steel in the Dairy Industry. International Stainless Steel Forum,
Brussels, Belgium.
Ayotte, J. D., J. A. M. Gronberg, and L. E. Apodaca. 2011. Trace elements and radon in
groundwater across the United States, 1992-2003. in Scientific Investigations Report.
U.S. Geological Survey, Reston, VA.
Balintova, M. and A. Petrilakova. 2011. Study of pH influence on selective precipitation of
heavy metals from acid mine drainage. Chem. Eng. Trans. 25:1-6.
Barber, N. L. 2009. Summary of estimated water use in the United States in 2005. U. S. D. o. t.
Interior, ed. U.S. Geological Survey, Reston, VA.
Barrefors, P., K. Granelli, L. A. Appelqvist, and L. Bjoerck. 1995. Chemical characterization of
raw milk samples with and without oxidative off-flavor. J. of Dairy Sci. 78(12):2691-
2699.
Birghila, S., S. Dobrinas, G. Stanciu, and A. Soceanu. 2008. Determination of major and minor
elements in milk through ICP-AES. Environ. Eng. Mgmt. J. 7(6):805-808.
Bodyfelt, F. W., J. Tobias, and G. M. Trout. 1988. The Sensory Evaluation of Dairy Products.
Van Nostrand Reinhold, New York.
Bradley, R. 2000. Dairy products. Pages 1-83 in Official Methods of Analysis of AOAC
International. Vol. 2. 17 ed. W. Horwitz, ed. AOAC International, Gaithersburg, MD.
56
Brescia, M. A., V. Caldarola, G. Buccolieri, A. Dell'atti, and A. Sacco. 2003. Chemometric
determination of the geographical origin of cow milk using ICP-OES data and isotopic
ratios: A preliminary study. Italian J. Food Sci. 15(3):329-336.
Brown, W. C. and L. M. Thurston. 1940. A review of oxidation in milk and milk products as
related to flavor. J. Dairy Sci. 23(7):629-685.
Bury, N. R., D. Boyle, and C. A. Cooper. 2011. Iron. Pages 201-251 in Fish Physiology. Vol.
Volume 31, Part A. A. P. F. Chris M. Wood and J. B. Colin, ed. Academic Press.
Cadwallader, K. R., M. A. Drake, and R. J. McGorrin. 2007. The flavor and flavor stability of
skim and whole milk powders. Pages 217-251 in Flavor of Dairy Products. Vol. 971.
American Chemical Society, Ann Arbor, MI.
Capper, J. L., R. A. Cady, and D. E. Bauman. 2009. The environmental impact of dairy
production: 1944 compared with 2007. J. Anim. Sci. 87(6):2160-2167.
Cerbulis, J. and H. M. Farrell. 1976. Composition of the milks of dairy cattle. II. Ash, calcium,
magnesium, and phosphorus. J. Dairy Sci. 59(4):589-593.
Chaplin, L. C. 1984. Studies on micellar calcium phosphate: Composition and apparent solubility
product in milk over a wide pH range. J. of Dairy Res. 51(2):251-257.
Chase, L. 2006. How much water do dairy farms use? in AgFocus NWNY Dairy, Livestock and
Field Crops Team. Vol. 2012. Cornell University.
Clark, S., M. Costello, M. A. Drake, and F. W. Bodyfelt. 2009. The Sensory Evaluation of Dairy
Products. 2 ed. Springer US, New York.
Collignon, P. J. 2009. Water recycling - forwards or backwards for public health? Med J of
Australia 191(4):238-239.
57
Cook, K. K. and R. F. Suddendorf. 1984. Inductively coupled plasma emission spectroscopic
determination of nine elements in infant formula: collaborative study. J. Assoc. Off. Anal.
Chem. 67(5):985.
Decker, E. A., R. J. Elias, and D. J. McClements. 2010a. Oxidation in Foods and Beverages and
Antioxidant Applications. Page 408 in Understanding mechanisms of oxidation and
antioxidant activity. Vol. 1. Woodhead Publishing, Great Abington, Cambridge, UK.
Decker, E. A., D. J. McClements, and R. J. Elias. 2010b. Oxidation in Foods and Beverages and
Antioxidant Applications. Vol. 1. Woodhead Pub., Oxford; Philadelphia.
Dietrich, A. M. 2007. Virginia Groundwater Iron. Blacksburg, VA.
Dobarganes, C. and J. Velasco. 2002. Oxidative stability of virgin olive oil. Eur. J. Lipid Sci.
Tech. 104(9-10):661-676.
Drake, M. A. 2007. Invited review: Sensory analysis of dairy foods. J. Dairy Sci. 90(11):4925-
4937.
Drake, M. A., K. R. Cadwallader, and M. Whetstine. 2007. Establishing links between sensory
and instrumental analyses of dairy flavors: Example cheddar cheese. Pages 51-77 in
Flavor of Dairy Products. Vol. 971. K. R. Cadwallader, M. A. Drake, and M. R. J., ed.
American Chemical Society, Ann Arbor, MI.
Eric A. Decker, D. J. M., Ryan J. Elias. 2010. Oxidation in Foods and Beverages and Antioxidant
Applications. Vol. 1. Woodhead Pub., Oxford; Philadelphia.
Feng, X., K. F. Knowlton, A. D. Dietrich, and S. Duncan. 2013. Effect of abomasal ferrous
lactate infusion on phosphorus absorption in lactating dairy cows. in press J. Dairy Sci.
Fennema, O. R. 1996. Food Chemistry. CRC Press.
58
Focant, M., E. Mignolet, M. Marique, F. Clabots, T. Breyne, D. Dalemans, and Y. Larondelle.
1998. The effect of vitamin E supplementation of cow diets containing rapeseed and
linseed on the prevention of milk fat oxidation. J. Dairy Sci. 81(4):1095-1101.
Food and Drug Administration, D. o. H. a. H. S. Standards of identity for dairy products. 21CFR
Ch. 1. Fed. Regist. 131.110.
Frankel, E. N. 1991. Recent advances in lipid oxidation. J. Sci. of Food Agric. 54(4):495-511.
Frankel, E. N. 2005. Lipid Oxidation. 2nd ed. The Oily Press, Dundee, Scotland.
Fransson, G. B. and B. Lonnerdal. 1983. Distribution of trace elements and minerals in human
and cow's milk. Pediatr. Res. 17(11):912-915.
Fritsch, C. W. 1981. Measurements of frying fat deterioration: A brief review. J. Am. Oil Chem.
Soc. 58(3):272-274.
Gary, A. B., M. D. Andrea, and J. W. Andrew. 2007. Understanding the basics of tap water taste.
J. Am. Water Works Assoc. 99(5):100.
Gaucheron, F. 2000. Iron fortification in dairy industry. Trends Food Sci. Tech. 11(11):403-409.
Gaucheron, F., Y. Le Graet, K. Raulot, and M. Piot. 1996. Physicochemical characterization of
iron-supplemented skim milk. Int. Dairy J. 7(2-3):141-148.
Genther, O. N. and D. K. Beede. 2013. Preference and drinking behavior of lactating dairy cows
offered water with different concentrations, valences, and sources of iron. J. Dairy Sci.
96(2):1164-1176.
Gidi, V., M. Olivares, M. Edwards, A. M. Dietrich, A. J. Whelton, D. Khiari, D. Glindemann, G.
A. Burlingame, F. Pizarro, S. Subramanian, S. Dwyer, T. Younos, A. Camper, S. Duncan,
and M. Araya. 2004. Health and aesthetic impacts of copper corrosion on drinking water.
Water science and technology 49(2):55-62.
59
Gleick, P. H., L. Allen, and M. J. Cohen. 2012. The World’s Water Volume 7: The Biennial
Report on Freshwater. Vol. 7. Island Press, Washington, DC.
Goff, H. D. and A. R. Hill. 1993. Chemistry and physics. Pages 1-30 in Dairy Science and
Technology Handbook. Vol. 1. Y. H. Hui, ed. John Wiley & Sons.
Gonzalez, S., S. E. Duncan, S. F. O’Keefe, S. S. Sumner, and J. H. Herbein. 2003. Oxidation and
textural characteristics of butter and ice cream with modified fatty acid profiles. J. Dairy
Sci. 86(1):70-77.
Gordon, M. H., R. Pongsawatmanit, M. Suttajit, and P. Maisuthisakul. 2007. Enhancing the
oxidative stability of rice crackers by addition of the ethanolic extract of phytochemicals
from Cratoxylum formosum Dyer. Asia Pac. J. Clin. Nutr. 16:37-42.
U.S. Department of Health and Human Services, Food and Drug Administration, 2011. Grade
“A” Pasteurized Milk Ordinance.
Guzun-Cojocaru, T., C. Koev, M. Yordanov, T. Karbowiak, E. Cases, and P. Cayot. 2011.
Oxidative stability of oil-in-water emulsions containing iron chelates: Transfer of iron
from chelates to milk proteins at interface. Food Chem. 125(2):326-333.
Haraguchi, H., Y. Zhu, R. Hattori, A. Itoh, and T. Umemura. 2004. Multielement analysis of
commercial mineral waters by chelating resin preconcentration and ICP-MS. Biomed.
Res. Trace Elements 15(4):355-357.
Havemose, M. S., M. R. Weisbjerg, W. L. P. Bredie, H. D. Poulsen, and J. H. Nielsen. 2006.
Oxidative stability of milk influenced by fatty acids, antioxidants, and copper derived
from feed. J. Dairy Sci. 89(6):1970-1980.
60
Hegenauer, J., D. Ludwig, and P. Saltman. 1979a. Effects of supplemental iron and copper on
lipid oxidation in milk. 2. Comparison of metal complexes in heated and pasteurized
milk. J. Agric. Food Chem. 27(4):868-871.
Hegenauer, J., P. Saltman, D. Ludwig, L. Ripley, and P. Bajo. 1979b. Effects of supplemental
iron and copper on lipid oxidation in milk. 1. Comparison of metal complexes in
emulsified and homogenized milk. J. Agric. Food Chem. 27(4):860-867.
Henry, D. E., H. W. Wharton, D. R. Gardner, R. A. Sanders, and D. H. Tallmadge. 1992.
Characterization of used frying oils. Part 1: Isolation and identification of compound
classes. J. Am. Oil Chem. Soc. 69(6):499-508.
Hunt, C. D. and S. L. Meacham. 2001. Aluminum, boron, calcium, copper, iron, magnesium,
manganese, molybdenum, phosphorus, potassium, sodium, and zinc: Concentrations in
common Western foods and estimated daily intakes by infants; toddlers; and male and
female adolescents, adults, and seniors in the United States. J. Am. Diet. Assoc.
101(9):1058-1060.
Hunt, C. D. and F. H. Nielsen. 2009. Nutritional aspects of minerals in bovine and human milks.
Pages 391-456 in Advanced Dairy Chemistry. Vol. 3. 3 ed. Paul McSweeney and P. F.
Fox, ed. Springer - Verlag.
Hutkins, R. W. 2006. Microbiology and Technology of Fermented Foods. IFT Press ; Blackwell
Pub., Ames, Iowa.
Jenness, R. 1974. Biosynthesis and composition of milk. J. Investig. Dermatol. 63(1):109-118.
Jenq, W., R. Bassette, and R. E. Crang. 1988. Effects of light and copper ions on volatile
aldehydes of milk and milk fractions. J. Dairy Sci. 71(9):2366-2372.
Jensen, R. G. 1995. Handbook of Milk Composition. Academic Press, San Diego.
61
Johnson, D. S. 2012. Protective effects of titanium dioxide packaging modification on sensory
and oxidative changes in milk over 35 day shelf-life. Department of Food Science and
Technology Masters of Science Life Sciences:100.
Jung, M. Y., S. H. Yoon, H. O. Lee, and D. B. Min. 1998. Singlet oxygen and ascorbic acid
effects on dimethyl disulfide and off-flavor in skim milk exposed to light. J. Food Sci.
63(3):408-412.
Kay, R. T., G. E. Groschen, D. H. Dupre, T. D. Drexler, K. L. Thingvold, and H. J. Rosenfeld.
2009. Diel sampling of groundwater and surface water for trace elements and select
water-quality constituents at a former zinc smelter site near Hegeler, Illinois. Pages vi, 64
p. in Scientific Investigations Report. - ed. U.S. Geological Survey.
Kristensen, D., R. V. Hedegaard, J. H. Nielsen, and L. H. Skibsted. 2004. Oxidative stability of
buttermilk as influenced by the fatty acid composition of cows' milk manipulated by diet.
J. Dairy Res. 71(1):46-50.
Kurtz, F. E., A. Tamsma, and M. J. Pallansch. 1973. Effects of fortification with iron on
susceptibility of skim milk and nonfat dry milk to oxidation. J. Dairy Sci. 56(9):1139.
Laird DT, G.-L. A., Scher FM, Graham TE, Reddy R. 2004. Microbiological count methods.
Pages 153-186 in Standard Methods For The Examination Of Dairy Products. 17 ed. H.
M. Wehr and J. F. Frank, ed. American Public Health Association, Washington, D.C.
Li, Q. 2011. Controlling light oxidation flavor in omega-3 fatty acid enriched 2% milk by
packaging films. Food Science and Technology Master of Science in Life Sciences:121.
Lönnerdal, B. 2009. Nutritional roles of lactoferrin. Current Opinion Clin. Nutr. Metabolic Care
12(3):293-297.
62
Lönnerdal, B., C. L. Keen, and L. S. Hurley. 1985. Manganese binding proteins in human and
cow's milk. Am. J. Clin. Nutr. 41(3).
MacDonald, J. M., E. J. O’Donoghue, McBride, Nehring, Sandretto, and Mosheim. September
2007. Profits, Costs, and the Changing Structure of Dairy Farming. Page 35 in USDA
Economic Research Report. Economic Research Service.
Mancuso, J. R., D. J. McClements, and E. A. Decker. 1999. The effects of surfactant type, pH,
and chelators on the oxidation of salmon oil-in-water emulsions. J. Agric. Food Chem.
47(10):4112-4116.
Martel, C., K. Phetxumphou, S. Duncan, A. D. Dietrich, and R. E. James. 2013. Effects of well
water quality on dairy farms in Virginia. in VCE Conference. Blacksburg, VA.
McKie, A. T., D. Barrow, G. O. Latunde-Dada, A. Rolfs, G. Sager, E. Mudaly, M. Mudaly, C.
Richardson, D. Barlow, A. Bomford, T. J. Peters, K. B. Raja, S. Shirali, M. A. Hediger, F.
Farzaneh, and R. J. Simpson. 2001. An iron-regulated ferric reductase associated with the
absorption of dietary rron. J. Sci. 291(5509):1755-1759.
McKinstry, P. J., H. E. Indyk, and N. D. Kim. 1999. The determination of major and minor
elements in milk and infant formula by slurry nebulisation and inductively coupled
plasma - optical emission spectrometry (ICP-OES). J. Food Chem. 65(2):245-252.
McNeill, L. S. 2006. Water quality factors influencing iron and lead corrosion in drinking water.
Dissertation:102.
Meilgaard, M., G. V. Civille, and B. T. Carr. 2007. Sensory Evaluation Techniques. 4 ed. Taylor
& Francis, Boca Raton.
Milani, F. X., D. Nutter, and G. Thoma. 2011. Invited review: Environmental impacts of dairy
processing and products: A review. J. Dairy Sci. 94(9):4243-4254.
63
Milk Facts. 2013. USDA, http://0061459.netsolhost.com/NutritionFacts/NutrientContent.htm.
Moore, K. and L. J. Roberts. 1998. Measurement of lipid peroxidation. Free Radical Res.
28(6):659-671.
Moore, R. L. 2009. Antioxidant protection of an omega-3 fatty acid fortified dairy-based
beverage. Food Science and Technology Master of Science:136.
Moreno-Rojas, R., M. A. Amaro-Lopez, and G. Zurera-Cosano. 1993. Micronutrients in natural
cow, ewe and goat milk. Int. J. Food Sci. Nutr. 44(1):37-46.
Moreno-Rojas, R., G. Zurera-Cosano, and M. A. Amaro-Lopez. 1994. Concentration and
seasonal variation of calcium, magnesium, sodium and potassium in raw cow, ewe and
goat milk. Int. J. Food Sci. Nutr. 45(2):99-105.
Muirhead, S. 2012. JBS recognized for reducing water use. in Feedstuffs FoodLink. Vol. 84. The
Miller Publishing Co., Bloomington, MN.
Murthy, G. K., U. S. Rhea, and J. T. Peeler. 1972. Copper, iron, manganese, strontium, and zinc
content of market milk. J. Dairy Sci. 55(12):1666-1674.
United States Environmental Protection Agency, 2011. National Primary Drinking Water
Regulations. 42 CFR Part 141-142. Fed. Regist.
Nicholson, J. W. G. and E. Charmley. 1993. Injectable alpha-tocopherol for control of oxidized
flavor in milk from dairy cows. Can. J. Anim. Sci. 73(2):381-392.
Nielsen, J. H., G. Hald, L. Kjeldsen, H. J. Andersen, and H. Østdal. 2001. Oxidation of ascorbate
in raw milk induced by enzymes and transition metals. J. Agric. Food Chem. 49(6):2998-
3003.
. Nutrient Requirements of Dairy Cattle. 2001. 7 ed. National Academy Press, Ipswich, MA.
64
Ogden, L. V. 1993. Sensory evaluation of dairy products. Pages 157-175 in Dairy Science and
Technology Handbook. Vol. 1. Y. H. Hui, ed. John Wiley & Sons.
Powell, J. 2001. The sensory and analytical analyses of nonfat milk formulations: stability to
light oxidation and pasteurization. Food Science and Technology Master of Science:56.
Rainard, P., B. Poutrel, and J. P. Caffin. 1982. Lactoferrin and transferrin in bovine milk in
relation to certain physiological and pathological factors. Ann. Vet. Res. 13(4):321-328.
Raouche, S., S. Naille, M. Dobenesque, A. Bot, J.-C. Jumas, J.-L. Cuq, and S. Marchesseau.
2009. Iron fortification of skim milk: Minerals and 57Fe Mössbauer study. Int. Dairy J.
19(1):56-63.
Rice, E. W., R. B. Baird, A. D. Eaton, and L. S. Clesceri. 2012. Standard Methods for the
Examination of Water and Wastewater. 22 ed. American Public Health Association,
Washington, D.C.
Rodríguez Rodríguez, E. M., M. Sanz Alaejos, and C. Díaz Romero. 1999. Chemometric studies
of several minerals in milks. J. Agric. Food Chem. 47(4):1520-1524.
Rosegrant, M. W. and X. M. Cai. 2002. Global water demand and supply projections Part - 2.
Results and prospects to 2025. Water International 27(2):170-182.
Satue-Gracia, M. T., E. N. Frankel, N. Rangavajhyala, and J. B. German. 2000. Lactoferrin in
infant formulas: Effect on oxidation. J. Agric. Food Chem. 48(10):4984-4990.
Siddique, F., F. M. Anjum, N. Huma, and A. Jamil. 2010. Effect of different UHT processing
temperatures on ash and lactose content of milk during storage at different temperatures.
Int. J. Agric. Biol. 12(3):439-442.
65
Sikiric, M., N. Brajenovic, I. Pavlovic, J. L. Havranek, and N. Plavljanic. 2003. Determination of
metals in cow's milk by flame atomic absorption spectrophotometry. Czech J. Anim. Sci.
48(11):481-486.
Simmons, J. 2011. Making safe, affordable and abundant food a global reality. Page 11 in Elanco
Animal Health.
Sims, J. T. and A. N. Sharpley. 2005. Phosphorus : Agriculture and the environment. American
Society of Agronomy, Madison, Wisconsin.
Spanier, A. M. and R. D. Traylor. 1991. A rapid, direct chemical assay for the quantitative
determination of thiobarbituric acid reactive substances in raw, cooked, and
cooked/stored muscle foods. J. Muscle Foods 2:165-176.
Stumm, W. and G. F. Lee. 1961. Oxygenation of ferrous iron. Indust. Eng. Chem. 53(2):143-146.
Sugiarto, M., A. Ye, M. W. Taylor, and H. Singh. 2010. Milk protein-iron complexes: Inhibition
of lipid oxidation in an emulsion. Dairy Sci. Technol. 90(1):87-98.
Suriyasathaporn, W., U. Vinitketkumnuen, T. Chewonarin, S. Boonyayatra, K. Kreausukon, and
Y. H. Schukken. 2006. Higher somatic cell counts resulted in higher malondialdehyde
concentrations in raw cows’ milk. Int. Dairy J. 16(9):1088-1091.
Sutter, J. D. 2012. Farmer: 'It was the system that failed us'. in Cable News Network. Mountain
Grove, Missouri.
Tait, A. B., J. A. Renwick, and A. H. Stroombergen. 2005. The economic implications of
climate‐induced variations in milk production. New Zeal. J. Agric. Res. 48(2):213-225.
Theron, J., J. A. Walker, and T. E. Cloete. 2008. Nanotechnology and Water Treatment:
Applications and Emerging Opportunities. Crit. Rev. Microbiol. 34(1):43-69.
66
Timmons, J. S., W. P. Weiss, D. L. Palmquist, and W. J. Harper. 2001. Relationships among
dietary roasted soybeans, milk componenets and spontaneous oxidized flavor of milk. J.
Dairy Sci. 84(11):2440-2449.
U.S. Drought 2012: Farm and Food Impacts. 2013. in Livestock sectors. Vol. 2013. USDA, ed.
Economic Research Service, http://www.ers.usda.gov.
Underwood, E. J. 1971. Trace Elements in Human and Animal Nutrition. No. xiv. Academic
Press, New York.
Upreti, P. and L. E. Metzger. 2007. Influence of calcium and phosphorus, lactose, and salt-to-
moisture ratio on cheddar cheese quality: pH changes during ripening. J. Dairy Sci.
90(1):1-12.
USDA. 1989. United States Standards for Butter. 1989. 7 CFR part 58. Fed. Regist. 58.2628.
van Aardt, M., S. E. Duncan, J. E. Marcy, T. E. Long, S. F. O'Keefe, and S. R. Nielsen-Sims.
2005a. Aroma analysis of light-exposed milk stored with and without natural and
synthetic antioxidants. J. Dairy Sci. 88(3):881-890.
van Aardt, M., S. E. Duncan, J. E. Marcy, T. E. Long, S. F. O'Keefe, and S. R. Nielsen-Sims.
2005b. Effect of antioxidant (alpha-tocopherol and ascorbic acid) fortification on light-
induced flavor of milk. J. Dairy Sci. 88(3):872-880.
Varnam, A. H. and J. P. Sutherland. 1994. Milk and Milk Products : Technology, Chemistry, and
Microbiology. Chapman & Hall, London.
Vickers, A. 2010. Handbook of Water Use and Conservation: Homes, Landscapes, Businesses,
Industries, Farms. WaterPlow Press.
Walstra, P., R. Jenness, and H. T. Badings. 1984. Dairy Chemistry and Physics. Wiley, New York.
67
Webster, J. B. 2009. Changes in aromatic chemistry and sensory quality of milk due to light
wavelength. Food Science and Technology 74(9):252.
White, C. H. and M. Bulthaus. 1982. Light activated flavor in milk. J. Dairy Sci. 65(3):489-494.
White, J. C. D. and D. T. Davies. 1958. The relation between the chemical composition of milk
and the stability of the caseinate complex: I. General introduction, description of samples,
methods and chemical composition of samples. J. Dairy Res. 25(2):236-255.
Zapata, C. V., C. M. Donangelo, and N. M. F. Trugo. 1994. Effect of iron supplementation during
lactation on human milk composition. J. Nutr. Biochem. 5:331-337.
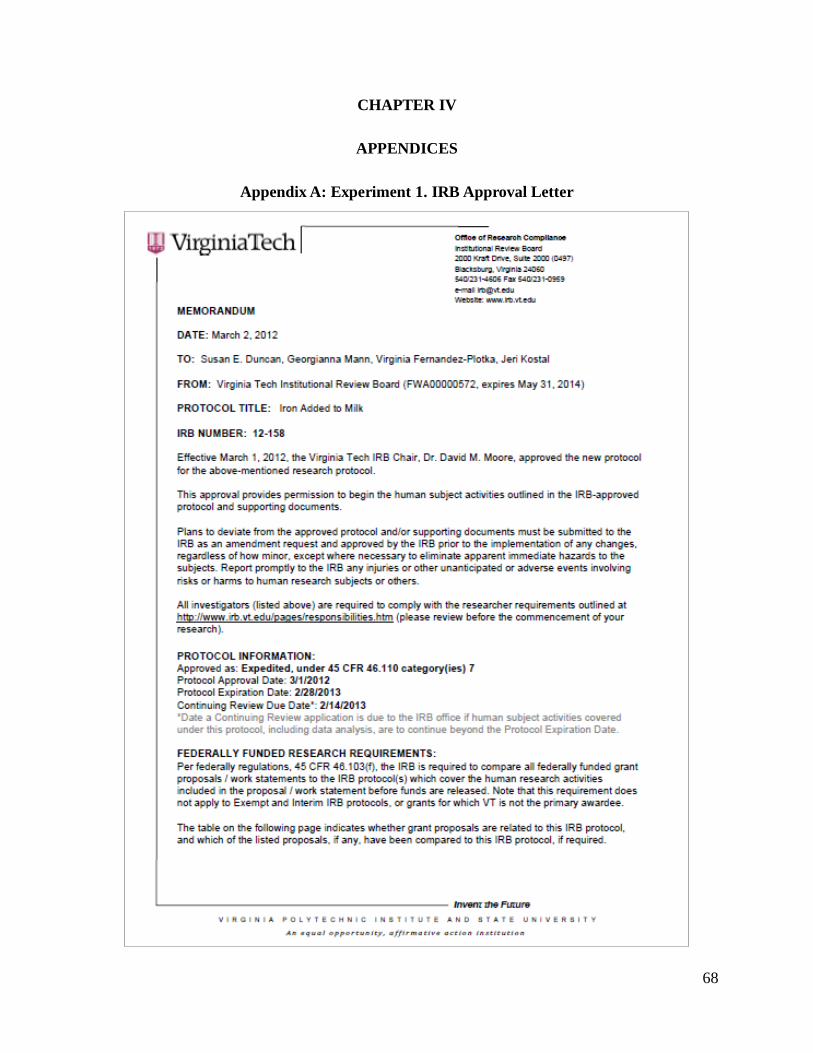
68
CHAPTER IV
APPENDICES
Appendix A: Experiment 1. IRB Approval Letter
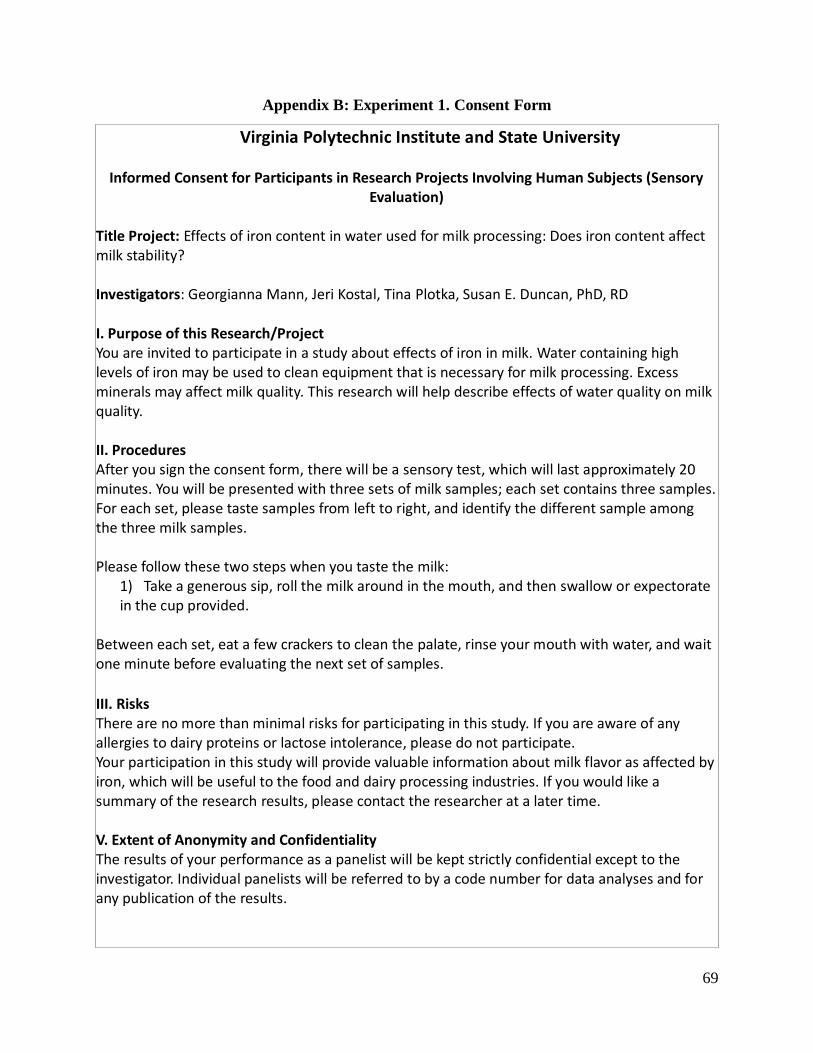
69
Appendix B: Experiment 1. Consent Form
Virginia Polytechnic Institute and State University
Informed Consent for Participants in Research Projects Involving Human Subjects (Sensory Evaluation)
Title Project: Effects of iron content in water used for milk processing: Does iron content affect milk stability? Investigators: Georgianna Mann, Jeri Kostal, Tina Plotka, Susan E. Duncan, PhD, RD I. Purpose of this Research/Project You are invited to participate in a study about effects of iron in milk. Water containing high levels of iron may be used to clean equipment that is necessary for milk processing. Excess minerals may affect milk quality. This research will help describe effects of water quality on milk quality. II. Procedures After you sign the consent form, there will be a sensory test, which will last approximately 20 minutes. You will be presented with three sets of milk samples; each set contains three samples. For each set, please taste samples from left to right, and identify the different sample among the three milk samples. Please follow these two steps when you taste the milk:
1) Take a generous sip, roll the milk around in the mouth, and then swallow or expectorate in the cup provided.
Between each set, eat a few crackers to clean the palate, rinse your mouth with water, and wait one minute before evaluating the next set of samples.
III. Risks There are no more than minimal risks for participating in this study. If you are aware of any allergies to dairy proteins or lactose intolerance, please do not participate. Your participation in this study will provide valuable information about milk flavor as affected by iron, which will be useful to the food and dairy processing industries. If you would like a summary of the research results, please contact the researcher at a later time. V. Extent of Anonymity and Confidentiality The results of your performance as a panelist will be kept strictly confidential except to the investigator. Individual panelists will be referred to by a code number for data analyses and for any publication of the results.
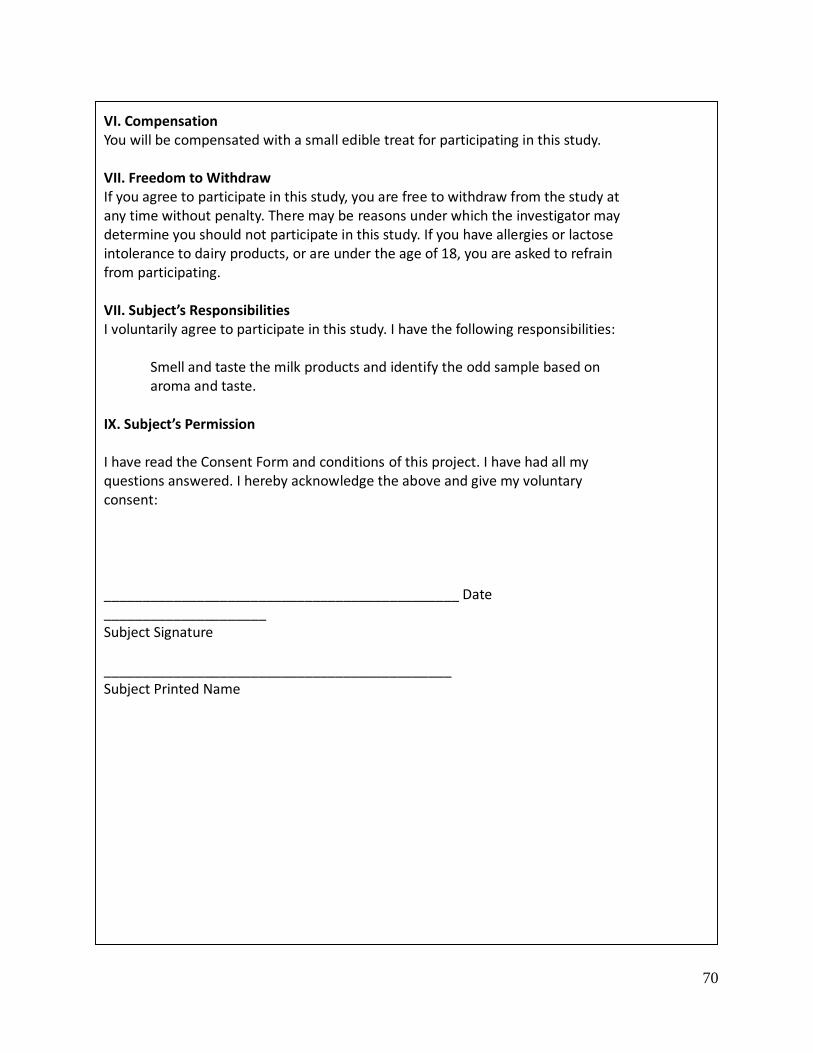
70
VI. Compensation You will be compensated with a small edible treat for participating in this study. VII. Freedom to Withdraw If you agree to participate in this study, you are free to withdraw from the study at any time without penalty. There may be reasons under which the investigator may determine you should not participate in this study. If you have allergies or lactose intolerance to dairy products, or are under the age of 18, you are asked to refrain from participating. VII. Subject’s Responsibilities I voluntarily agree to participate in this study. I have the following responsibilities:
Smell and taste the milk products and identify the odd sample based on aroma and taste.
IX. Subject’s Permission I have read the Consent Form and conditions of this project. I have had all my questions answered. I hereby acknowledge the above and give my voluntary consent: ______________________________________________ Date _____________________ Subject Signature _____________________________________________ Subject Printed Name
71
----------------------------For human subject to keep---------------------------- Should I have any pertinent questions about this research or its conduct, and
research subjects’ rights, and whom to contact in the event of a research-related injury to the subject. I may contact:
Georgianna Mann, Graduate Research Assistant, Investigator
(770) 316-0784; [email protected]
Jeri Kostal, Graduate Research Assistant, Co-Investigator
(434) 738-8918; [email protected]
Tina Plotka, Research Associate, Co-Investigator
(540) 231-9843; [email protected]
Susan Duncan, Faculty, Investigator
(540) 231-8675; [email protected]
David Moore Chair, Virginia Tech Institutional Review Board for the Protection of Human Subjects Office of Research Compliance 1880 Pratt Drive, Suite 2006 (0497) Blacksburg, VA 24061
(540) 231-4991; [email protected]
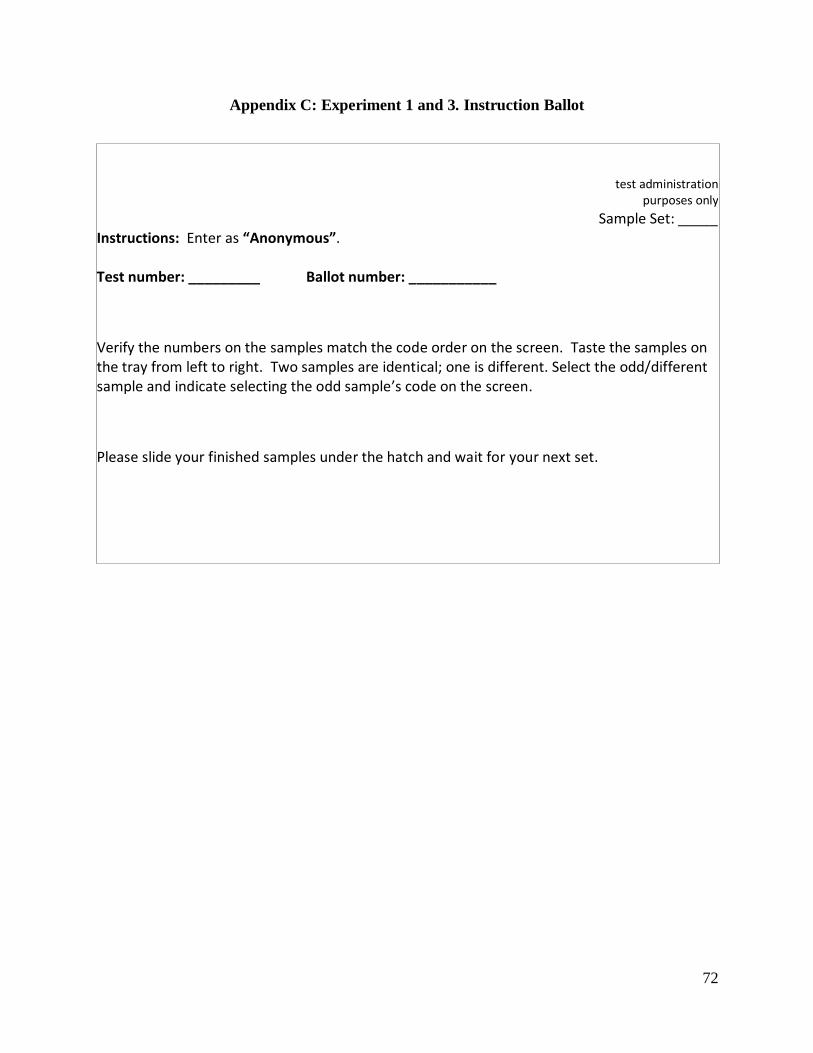
72
Appendix C: Experiment 1 and 3. Instruction Ballot
test administration
purposes only
Sample Set: _____ Instructions: Enter as “Anonymous”. Test number: _________ Ballot number: ___________
Verify the numbers on the samples match the code order on the screen. Taste the samples on the tray from left to right. Two samples are identical; one is different. Select the odd/different sample and indicate selecting the odd sample’s code on the screen.
Please slide your finished samples under the hatch and wait for your next set.
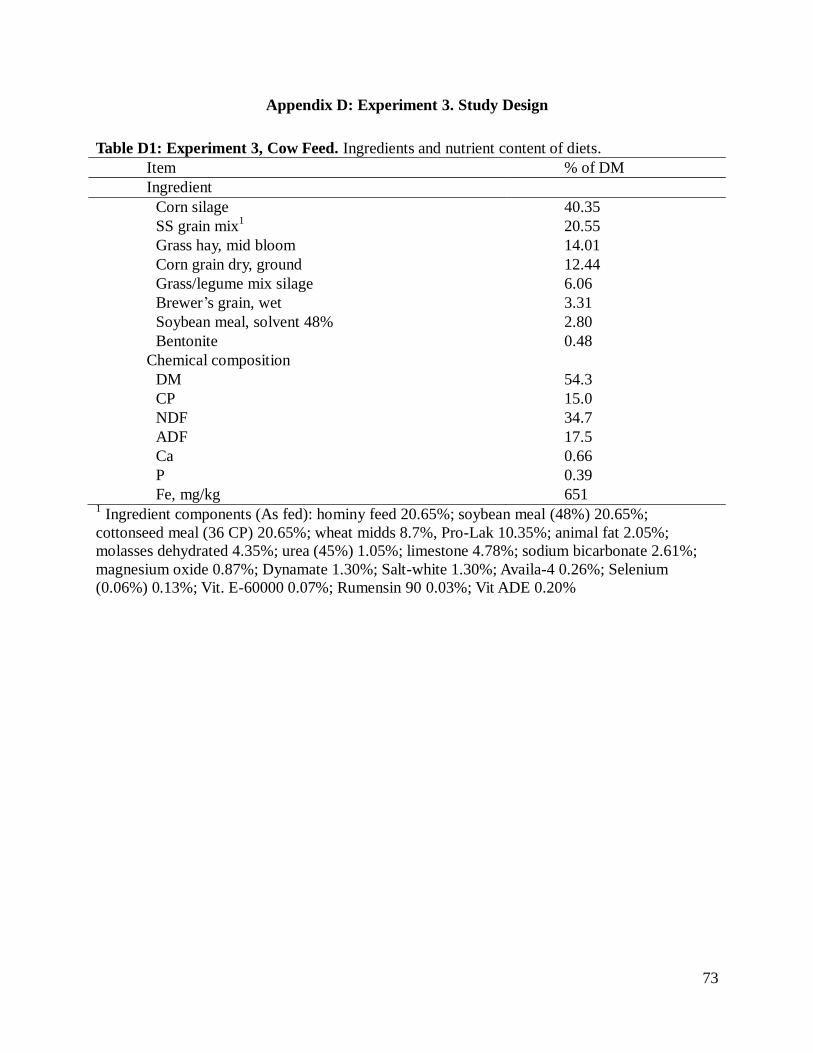
73
Appendix D: Experiment 3. Study Design
Table D1: Experiment 3, Cow Feed. Ingredients and nutrient content of diets.
Item % of DM
Ingredient
Corn silage 40.35
SS grain mix1 20.55
Grass hay, mid bloom 14.01
Corn grain dry, ground 12.44
Grass/legume mix silage 6.06
Brewer’s grain, wet 3.31
Soybean meal, solvent 48% 2.80
Bentonite 0.48
Chemical composition
DM 54.3
CP 15.0
NDF 34.7
ADF 17.5
Ca 0.66
P 0.39
Fe, mg/kg 651 1 Ingredient components (As fed): hominy feed 20.65%; soybean meal (48%) 20.65%;
cottonseed meal (36 CP) 20.65%; wheat midds 8.7%, Pro-Lak 10.35%; animal fat 2.05%;
molasses dehydrated 4.35%; urea (45%) 1.05%; limestone 4.78%; sodium bicarbonate 2.61%;
magnesium oxide 0.87%; Dynamate 1.30%; Salt-white 1.30%; Availa-4 0.26%; Selenium
(0.06%) 0.13%; Vit. E-60000 0.07%; Rumensin 90 0.03%; Vit ADE 0.20%
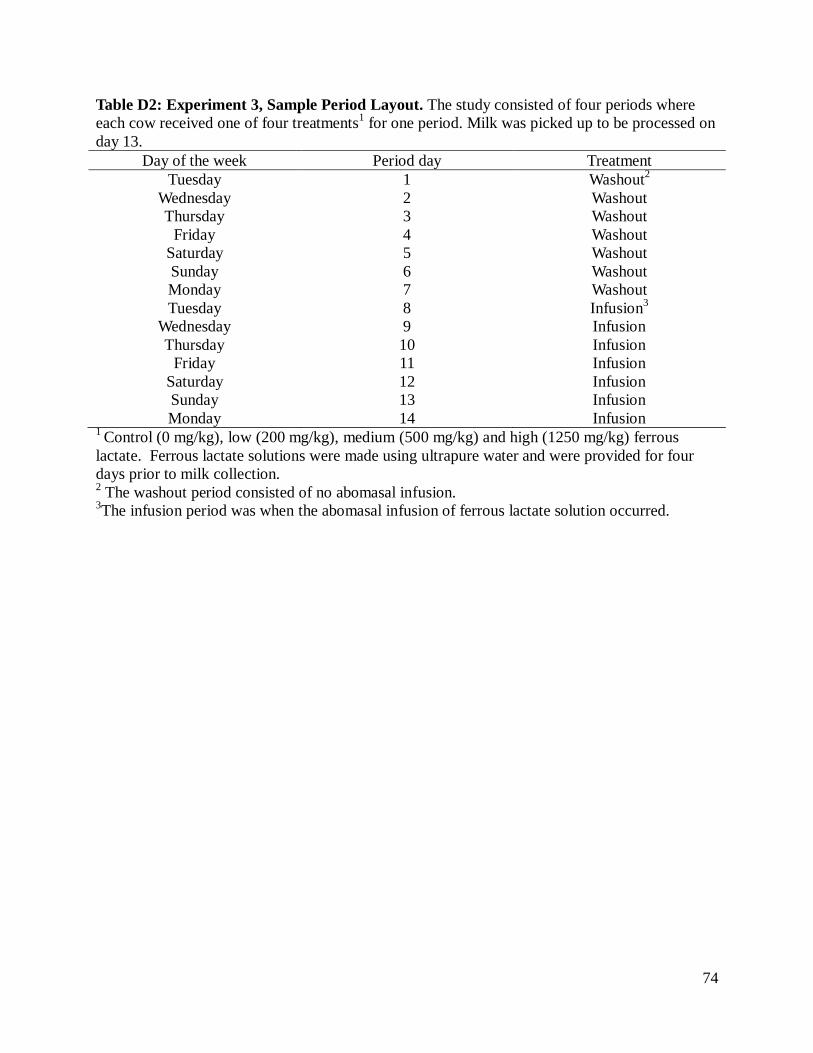
74
Table D2: Experiment 3, Sample Period Layout. The study consisted of four periods where
each cow received one of four treatments1 for one period. Milk was picked up to be processed on
day 13.
Day of the week Period day Treatment
Tuesday 1 Washout2
Wednesday 2 Washout
Thursday 3 Washout
Friday 4 Washout
Saturday 5 Washout
Sunday 6 Washout
Monday 7 Washout
Tuesday 8 Infusion3
Wednesday 9 Infusion
Thursday 10 Infusion
Friday 11 Infusion
Saturday 12 Infusion
Sunday 13 Infusion
Monday 14 Infusion 1 Control (0 mg/kg), low (200 mg/kg), medium (500 mg/kg) and high (1250 mg/kg) ferrous
lactate. Ferrous lactate solutions were made using ultrapure water and were provided for four
days prior to milk collection. 2 The washout period consisted of no abomasal infusion.
3The infusion period was when the abomasal infusion of ferrous lactate solution occurred.
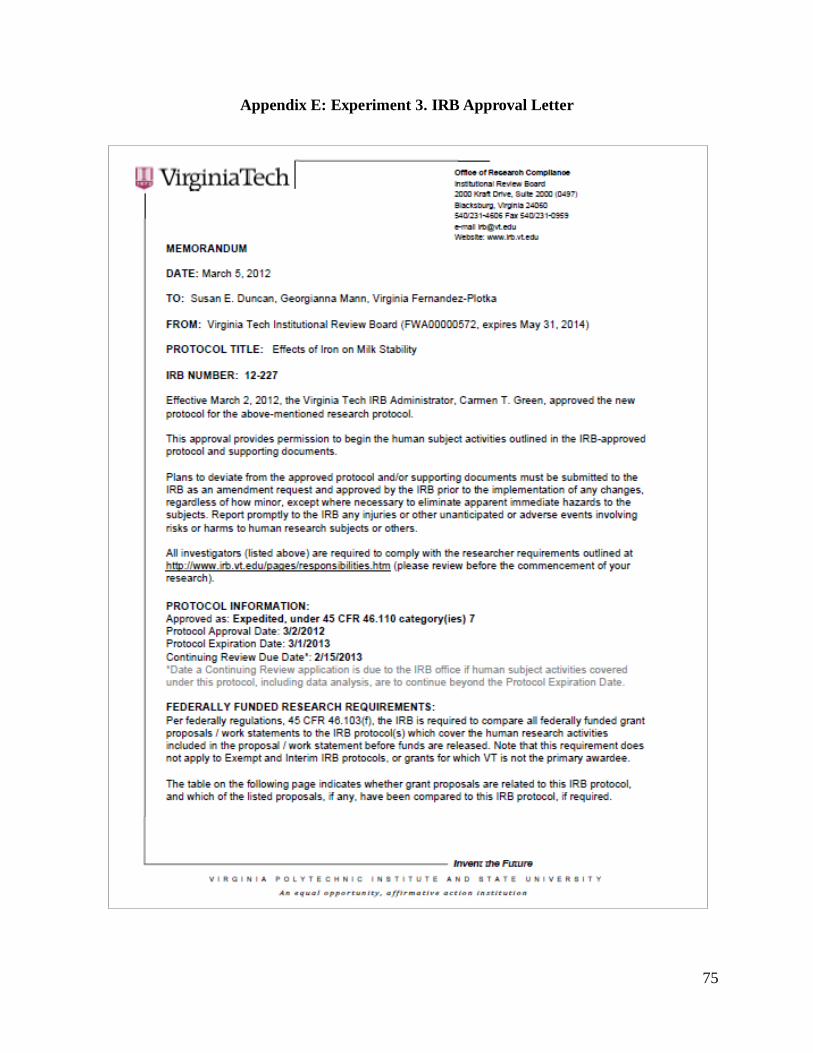
75
Appendix E: Experiment 3. IRB Approval Letter
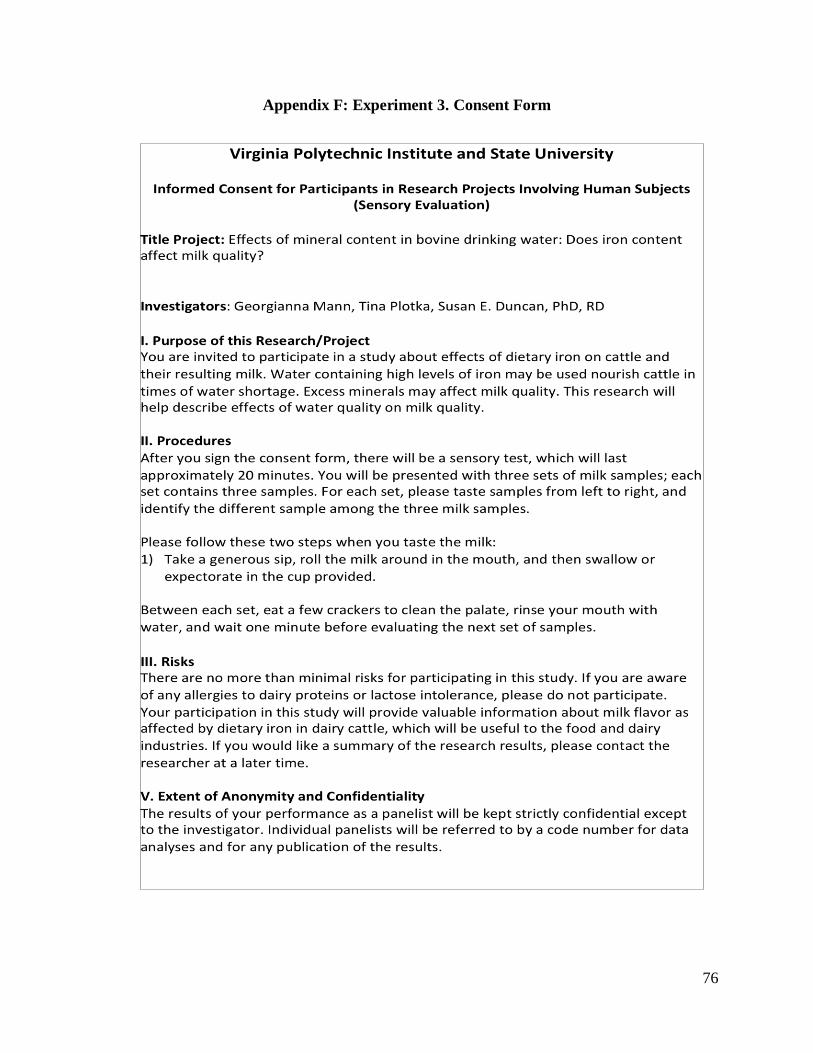
76
Appendix F: Experiment 3. Consent Form
77
VI. Compensation You will be compensated with a small edible treat for participating in this study. VII. Freedom to Withdraw If you agree to participate in this study, you are free to withdraw from the study at any time without penalty. There may be reasons under which the investigator may determine you should not participate in this study. If you have allergies or lactose intolerance to dairy products, or are under the age of 18, you are asked to refrain from participating. VII. Subject’s Responsibilities I voluntarily agree to participate in this study. I have the following responsibilities:
Smell and taste the milk products and identify the odd sample based on aroma and taste.
IX. Subject’s Permission I have read the Consent Form and conditions of this project. I have had all my questions answered. I hereby acknowledge the above and give my voluntary consent: ______________________________________________ Date _____________________ Subject Signature _____________________________________________ Subject Printed Name
78
IRB Approved Project Number: 12-227 Approval Received on: 3/5/2012
----------------------------For human subject to keep---------------------------- Should I have any pertinent questions about this research or its conduct, and research subjects’ rights, and whom to contact in the event of a research-related injury to the subject. I may contact: Georgianna Mann, Graduate Research Assistant, Investigator
(770) 316-0784; [email protected]
Tina Plotka, Research Associate, Co-Investigator
(540) 231-9843; [email protected]
Susan Duncan, Faculty, Investigator
(540) 231-8675; [email protected]
David Moore Chair, Virginia Tech Institutional Review Board for the Protection of Human Subjects Office of Research Compliance 2000 Kraft Drive, Suite 2000 Blacksburg, VA 24060
(540) 231-4991; [email protected]
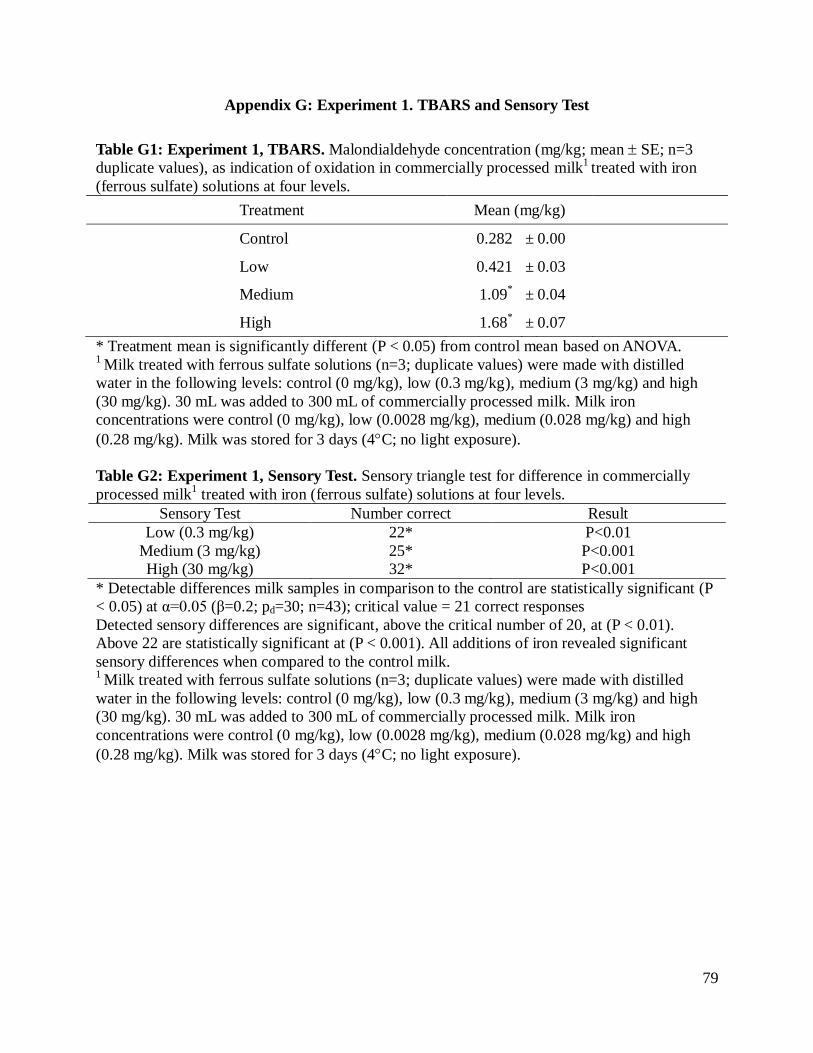
79
Appendix G: Experiment 1. TBARS and Sensory Test
Table G1: Experiment 1, TBARS. Malondialdehyde concentration (mg/kg; mean SE; n=3
duplicate values), as indication of oxidation in commercially processed milk1 treated with iron
(ferrous sulfate) solutions at four levels.
Treatment Mean (mg/kg)
Control 0.282 ± 0.00
Low 0.421 ± 0.03
Medium 1.09* ± 0.04
High 1.68* ± 0.07
* Treatment mean is significantly different (P < 0.05) from control mean based on ANOVA. 1 Milk treated with ferrous sulfate solutions (n=3; duplicate values) were made with distilled
water in the following levels: control (0 mg/kg), low (0.3 mg/kg), medium (3 mg/kg) and high
(30 mg/kg). 30 mL was added to 300 mL of commercially processed milk. Milk iron
concentrations were control (0 mg/kg), low (0.0028 mg/kg), medium (0.028 mg/kg) and high
(0.28 mg/kg). Milk was stored for 3 days (4C; no light exposure).
Table G2: Experiment 1, Sensory Test. Sensory triangle test for difference in commercially
processed milk1 treated with iron (ferrous sulfate) solutions at four levels.
Sensory Test Number correct Result
Low (0.3 mg/kg) 22* P<0.01
Medium (3 mg/kg) 25* P<0.001
High (30 mg/kg) 32* P<0.001
* Detectable differences milk samples in comparison to the control are statistically significant (P
< 0.05) at α=0.05 (β=0.2; pd=30; n=43); critical value = 21 correct responses
Detected sensory differences are significant, above the critical number of 20, at (P < 0.01).
Above 22 are statistically significant at (P < 0.001). All additions of iron revealed significant
sensory differences when compared to the control milk. 1 Milk treated with ferrous sulfate solutions (n=3; duplicate values) were made with distilled
water in the following levels: control (0 mg/kg), low (0.3 mg/kg), medium (3 mg/kg) and high
(30 mg/kg). 30 mL was added to 300 mL of commercially processed milk. Milk iron
concentrations were control (0 mg/kg), low (0.0028 mg/kg), medium (0.028 mg/kg) and high
(0.28 mg/kg). Milk was stored for 3 days (4C; no light exposure).
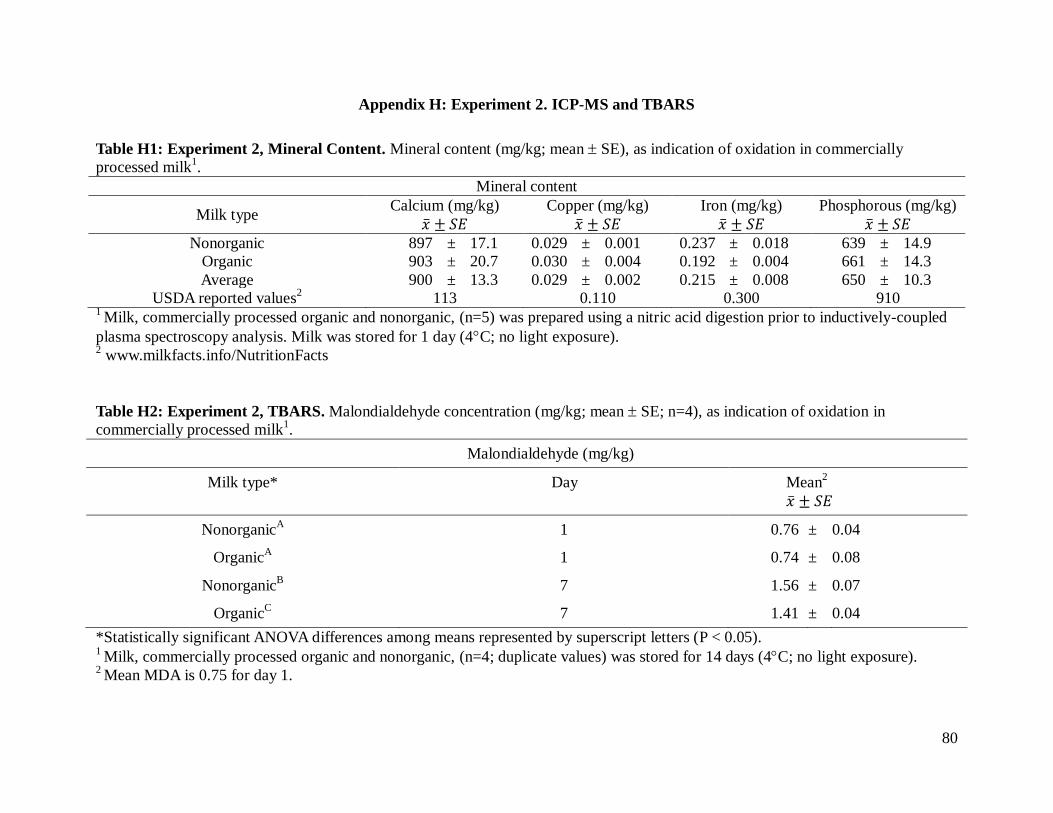
80
Appendix H: Experiment 2. ICP-MS and TBARS
Table H1: Experiment 2, Mineral Content. Mineral content (mg/kg; mean SE), as indication of oxidation in commercially
processed milk1.
Mineral content
Milk type Calcium (mg/kg)
Copper (mg/kg)
Iron (mg/kg)
Phosphorous (mg/kg)
Nonorganic 897 ± 17.1 0.029 ± 0.001 0.237 ± 0.018 639 ± 14.9
Organic 903 ± 20.7 0.030 ± 0.004 0.192 ± 0.004 661 ± 14.3
Average 900 ± 13.3 0.029 ± 0.002 0.215 ± 0.008 650 ± 10.3
USDA reported values2
113 0.110 0.300 910 1 Milk, commercially processed organic and nonorganic, (n=5) was prepared using a nitric acid digestion prior to inductively-coupled
plasma spectroscopy analysis. Milk was stored for 1 day (4C; no light exposure). 2 www.milkfacts.info/NutritionFacts
Table H2: Experiment 2, TBARS. Malondialdehyde concentration (mg/kg; mean SE; n=4), as indication of oxidation in
commercially processed milk1.
Malondialdehyde (mg/kg)
Milk type* Day Mean2
NonorganicA
1 0.76 ± 0.04
OrganicA
1 0.74 ± 0.08
NonorganicB
7 1.56 ± 0.07
OrganicC
7 1.41 ± 0.04
*Statistically significant ANOVA differences among means represented by superscript letters (P < 0.05). 1 Milk, commercially processed organic and nonorganic, (n=4; duplicate values) was stored for 14 days (4C; no light exposure).
2 Mean MDA is 0.75 for day 1.
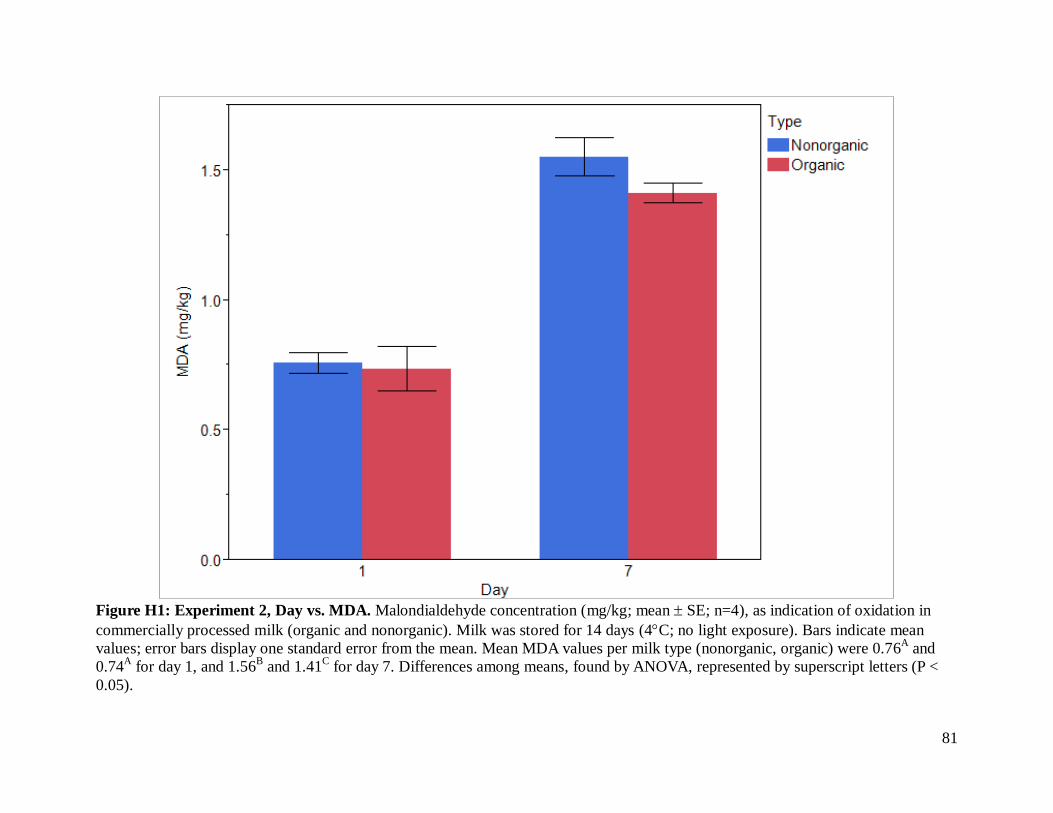
81
Figure H1: Experiment 2, Day vs. MDA. Malondialdehyde concentration (mg/kg; mean SE; n=4), as indication of oxidation in
commercially processed milk (organic and nonorganic). Milk was stored for 14 days (4C; no light exposure). Bars indicate mean
values; error bars display one standard error from the mean. Mean MDA values per milk type (nonorganic, organic) were 0.76A and
0.74A for day 1, and 1.56
B and 1.41
C for day 7. Differences among means, found by ANOVA, represented by superscript letters (P <
0.05).
82
Appendix I: Experiment 3. Gross Composition
Table I1: Experiment 3, Mineral Content. Mineral content (mg/kg; mean SE), as determined by inductively coupled plasma mass
spectrometry, on whole processed (pasteurized, homogenized) milk1.
Mineral content, averages (n=4)2
Treatment
Calcium (mg/kg)
Copper(mg/kg)
Iron (mg/kg)
Phosphorous (mg/kg)
Control (0 mg/kg iron) 925 ± 128 0.042 ± 0.003 0.255 ± 0.029 794 ± 43
Low (200 mg/kg iron) 901 ± 119 0.042 ± 0.003 0.230 ± 0.021 943 ± 103
Medium (500 mg/kg iron) 1041 ± 160 0.039 ± 0.003 0.198 ± 0.034 881 ± 97
High (1250 mg/kg iron) 871 ± 78 0.036 ± 0.004 0.196 ± 0.018 771 ± 56
Average3
935 ± 26 0.040 ± 0.001 0.220 ± 0.010 847 ± 27
USDA reported values4
113 0.110 0.300 910 1 Milk obtained from cows (n=4; (d1, d8) values as duplicates) infused in the abomasum with ferrous lactate solution at four
concentrations. Ferrous lactate solutions were made using ultrapure water and were provided for four days prior to milk collection. All
four two week period of milk collection are represented. Milk was stored for a total of 11 days (4C; no light exposure). 2 There were no statistically significant differences (P > 0.05) found among the different treatments using ANOVA.
3 Day 1 and day 8 differences in mineral composition were not statistically significant (P > 0.05) using a Tukey-Kramer analysis.
4 www.milkfacts.info/NutritionFacts
83
Table I2: Experiment 3, Gross Composition. Fat, protein and ash (%; mean SE), of whole processed (pasteurized, homogenized)
milk1.
Treatment
Analyses
Control
(0 mg/kg iron)
Low
(200 mg/kg iron)
Medium
(500 mg/kg iron)
High
(1250 mg/kg iron)
Average2
Fat (%) 3.15%±0.00% 3.21%±0.04% 3.16%±0.07% 3.21%±0.06% 3.18%±0.04%
Protein (%)3
3.99%±0.54% 3.66%±0.54% 3.91%±0.55% 3.53%±0.77% 3.77%±1.33%
Ash (%)3 0.64%±0.03% 0.53%±0.03% 0.58%±0.03% 0.58%±0.02% 0.58%±0.21%
1 Milk obtained from cows (n=4; (d1, d8) values as duplicates) infused in the abomasum with ferrous lactate solution at four
concentrations. Ferrous lactate solutions were made using ultrapure water and were provided for four days prior to milk collection. All
four two week period of milk collection are represented. Milkfat analyses were in duplicate, d1 only. Protein and ash were in duplicate
on d1 and d8. Outliers, determined by an outlier box plot, were excluded. Milk was stored for a total of 11 days (4C; no light
exposure). 2 There were no statistically significant differences (P > 0.05) found among the different treatments using ANOVA.
3 Day 1 and day 8 differences in gross composition were not statistically significant (P > 0.05) using a Tukey-Kramer analysis.
84
Table I3: Experiment 3, Gross Composition F Table. F statistic and P values for specific contrasts with gross composition (fat,
protein, ash) as response on whole processed (pasteurized, homogenized) milk1.
Contrast F Statistic P value
Milkfat (%)
Treatment*Period 0.8146 0.54
Treatment*Cow 0.3037 0.82
Cow*Period 0.0631 0.98
Treatment*Cow*Period 0.6989 0.70
Protein (%)
Treatment*Period 2.1563 0.21
Treatment*Cow 2.1264 0.22
Cow*Period 0.3331 0.80
Treatment*Cow*Period 3.523 0.01†
Ash (%)
Treatment*Period 0.3221 0.81
Treatment*Cow 0.3059 0.82
Cow*Period 0.5082 0.69
Treatment*Cow*Period 0.8787 0.56 †Notes a statistically significant effect among effects (P < 0.05)
1 Milk obtained from cows (n=4; (d1, d8) values as duplicates) infused in the abomasum with ferrous lactate solution at four
concentrations. Ferrous lactate solutions were made using ultrapure water and were provided for four days prior to milk collection. All
four two week period of milk collection are represented. Milkfat analyses were in duplicate, d1 only. Protein and ash were in duplicate
on d1 and d8. Outliers, determined by an outlier box plot, were excluded. Milk was stored for a total of 11 days (4C; no light
exposure).
85
Table I4: Experiment 3, Mineral Composition F Table. F statistic and P values for specific contrasts with mineral composition (Ca,
Cu, Fe, P) as response on whole processed (pasteurized, homogenized) milk1.
Contrast F Statistic P value
Ca (mg/kg)
Treatment*Period 1.2683 0.33
Treatment*Cow 2.584 0.05†
Cow*Period 1.0801 0.43
Treatment*Cow*Period 1.9527 0.10
Cu (mg/kg)
Treatment*Period 1.2683 0.33
Treatment*Cow 2.584 0.05†
Cow*Period 1.0801 0.43
Treatment*Cow*Period 4.227 0.00†
Fe (mg/kg)
Treatment*Period 2.1882 0.09
Treatment*Cow 3.1045 0.03†
Cow*Period 1.8159 0.13
Treatment*Cow*Period 2.6138 0.04†
P (mg/kg)
Treatment*Period 1.8654 0.14
Treatment*Cow 1.8953 0.13
Cow*Period 0.8206 0.61
Treatment*Cow*Period 1.7606 0.14 †Notes a statistically significant effect among effects (P < 0.05).
1 Milk obtained from cows (n=4; (d1, d8) values as duplicates) infused in the abomasum with ferrous lactate solution at four
concentrations. Ferrous lactate solutions were made using ultrapure water and were provided for four days prior to milk collection. All
four two week period of milk collection are represented. Milk was stored for a total of 11 days (4C; no light exposure).
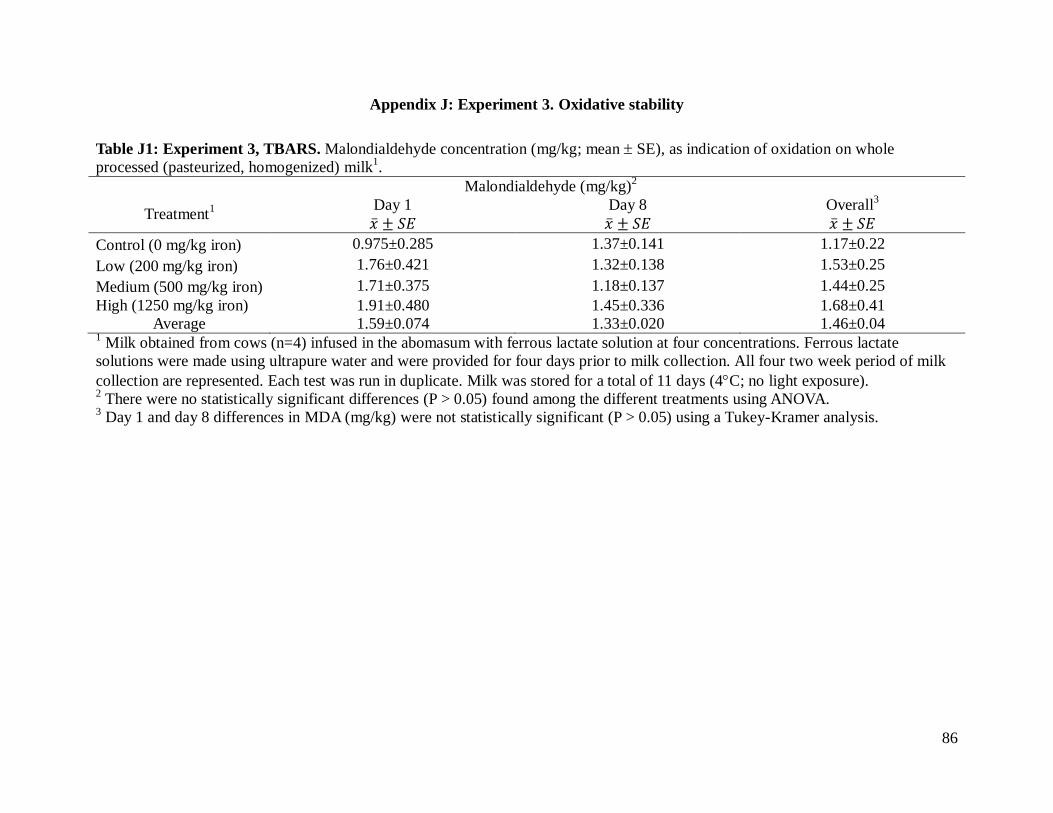
86
Appendix J: Experiment 3. Oxidative stability
Table J1: Experiment 3, TBARS. Malondialdehyde concentration (mg/kg; mean SE), as indication of oxidation on whole
processed (pasteurized, homogenized) milk1.
Malondialdehyde (mg/kg)2
Treatment1
Day 1
Day 8
Overall3
Control (0 mg/kg iron) 0.975±0.285 1.37±0.141 1.17±0.22
Low (200 mg/kg iron) 1.76±0.421 1.32±0.138 1.53±0.25
Medium (500 mg/kg iron) 1.71±0.375 1.18±0.137 1.44±0.25
High (1250 mg/kg iron) 1.91±0.480 1.45±0.336 1.68±0.41
Average 1.59±0.074 1.33±0.020 1.46±0.04 1 Milk obtained from cows (n=4) infused in the abomasum with ferrous lactate solution at four concentrations. Ferrous lactate
solutions were made using ultrapure water and were provided for four days prior to milk collection. All four two week period of milk
collection are represented. Each test was run in duplicate. Milk was stored for a total of 11 days (4C; no light exposure). 2 There were no statistically significant differences (P > 0.05) found among the different treatments using ANOVA.
3 Day 1 and day 8 differences in MDA (mg/kg) were not statistically significant (P > 0.05) using a Tukey-Kramer analysis.
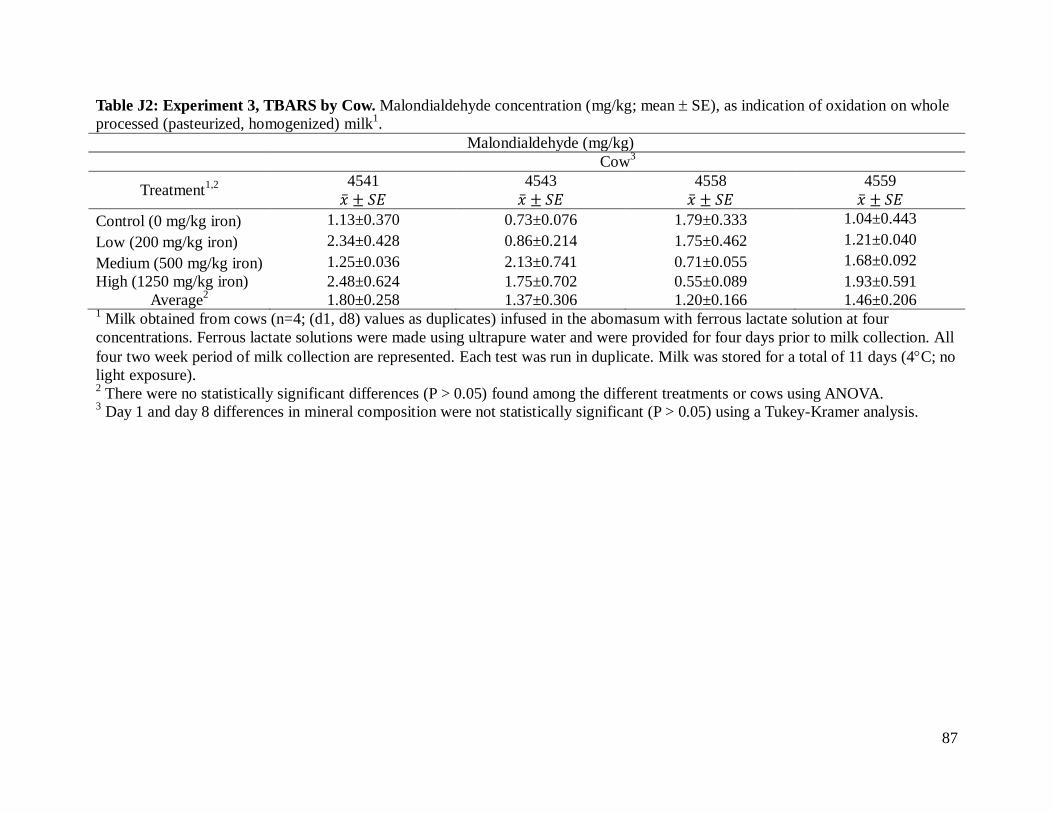
87
Table J2: Experiment 3, TBARS by Cow. Malondialdehyde concentration (mg/kg; mean SE), as indication of oxidation on whole
processed (pasteurized, homogenized) milk1.
Malondialdehyde (mg/kg)
Cow3
Treatment1,2
4541
4543
4558
4559
Control (0 mg/kg iron) 1.13±0.370 0.73±0.076 1.79±0.333 1.04±0.443
Low (200 mg/kg iron) 2.34±0.428 0.86±0.214 1.75±0.462 1.21±0.040
Medium (500 mg/kg iron) 1.25±0.036 2.13±0.741 0.71±0.055 1.68±0.092
High (1250 mg/kg iron) 2.48±0.624 1.75±0.702 0.55±0.089 1.93±0.591
Average2 1.80±0.258 1.37±0.306 1.20±0.166 1.46±0.206
1 Milk obtained from cows (n=4; (d1, d8) values as duplicates) infused in the abomasum with ferrous lactate solution at four
concentrations. Ferrous lactate solutions were made using ultrapure water and were provided for four days prior to milk collection. All
four two week period of milk collection are represented. Each test was run in duplicate. Milk was stored for a total of 11 days (4C; no
light exposure). 2 There were no statistically significant differences (P > 0.05) found among the different treatments or cows using ANOVA.
3 Day 1 and day 8 differences in mineral composition were not statistically significant (P > 0.05) using a Tukey-Kramer analysis.
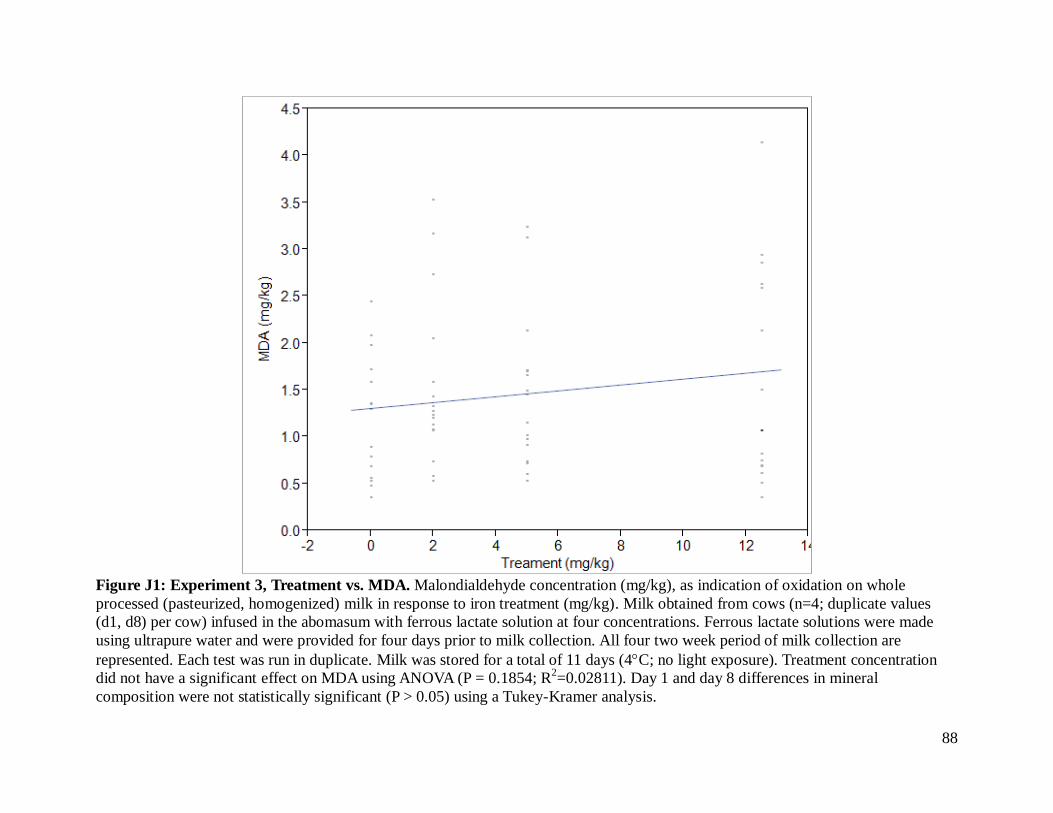
88
Figure J1: Experiment 3, Treatment vs. MDA. Malondialdehyde concentration (mg/kg), as indication of oxidation on whole
processed (pasteurized, homogenized) milk in response to iron treatment (mg/kg). Milk obtained from cows (n=4; duplicate values
(d1, d8) per cow) infused in the abomasum with ferrous lactate solution at four concentrations. Ferrous lactate solutions were made
using ultrapure water and were provided for four days prior to milk collection. All four two week period of milk collection are
represented. Each test was run in duplicate. Milk was stored for a total of 11 days (4C; no light exposure). Treatment concentration
did not have a significant effect on MDA using ANOVA (P = 0.1854; R2=0.02811). Day 1 and day 8 differences in mineral
composition were not statistically significant (P > 0.05) using a Tukey-Kramer analysis.
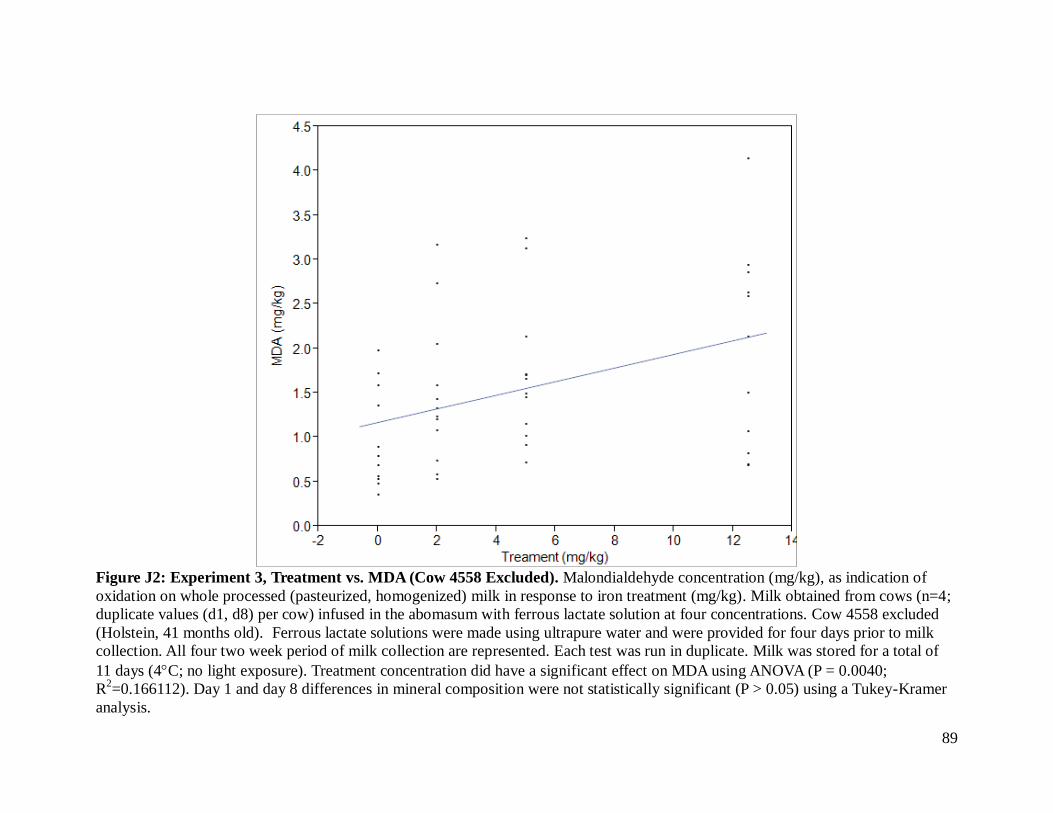
89
Figure J2: Experiment 3, Treatment vs. MDA (Cow 4558 Excluded). Malondialdehyde concentration (mg/kg), as indication of
oxidation on whole processed (pasteurized, homogenized) milk in response to iron treatment (mg/kg). Milk obtained from cows (n=4;
duplicate values (d1, d8) per cow) infused in the abomasum with ferrous lactate solution at four concentrations. Cow 4558 excluded
(Holstein, 41 months old). Ferrous lactate solutions were made using ultrapure water and were provided for four days prior to milk
collection. All four two week period of milk collection are represented. Each test was run in duplicate. Milk was stored for a total of
11 days (4C; no light exposure). Treatment concentration did have a significant effect on MDA using ANOVA (P = 0.0040;
R2=0.166112). Day 1 and day 8 differences in mineral composition were not statistically significant (P > 0.05) using a Tukey-Kramer
analysis.
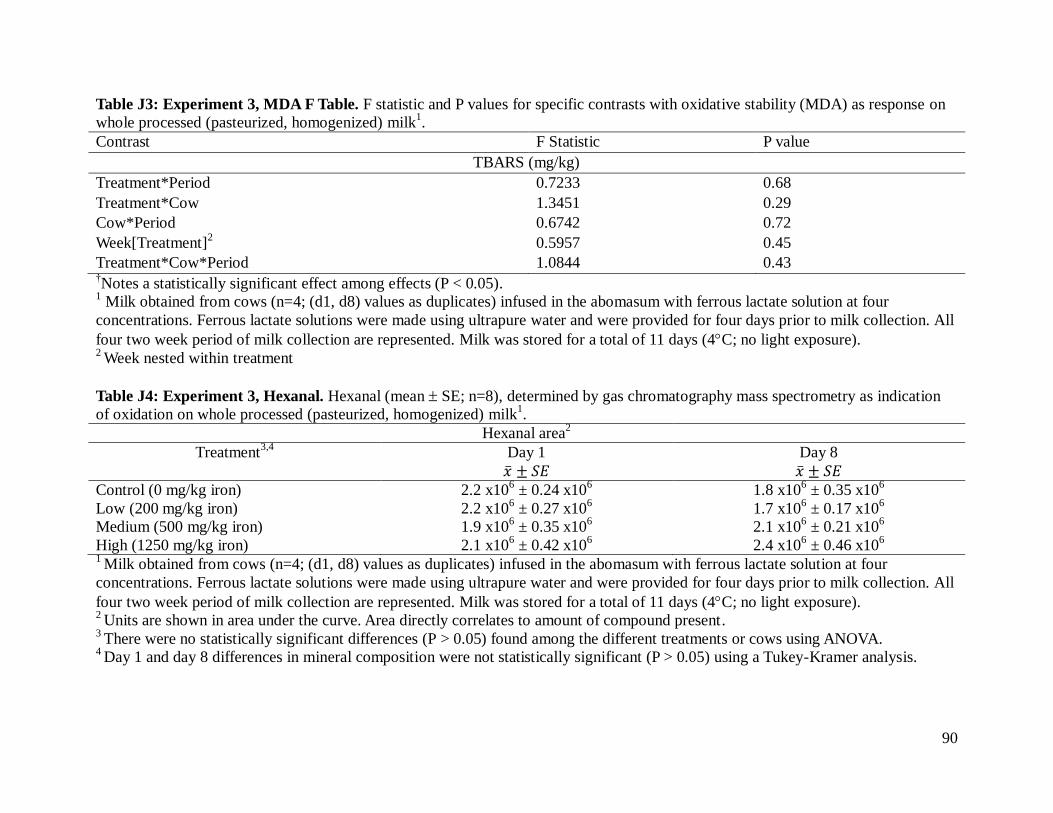
90
Table J3: Experiment 3, MDA F Table. F statistic and P values for specific contrasts with oxidative stability (MDA) as response on
whole processed (pasteurized, homogenized) milk1.
Contrast F Statistic P value
TBARS (mg/kg)
Treatment*Period 0.7233 0.68
Treatment*Cow 1.3451 0.29
Cow*Period 0.6742 0.72
Week[Treatment]2 0.5957 0.45
Treatment*Cow*Period 1.0844 0.43 †Notes a statistically significant effect among effects (P < 0.05).
1 Milk obtained from cows (n=4; (d1, d8) values as duplicates) infused in the abomasum with ferrous lactate solution at four
concentrations. Ferrous lactate solutions were made using ultrapure water and were provided for four days prior to milk collection. All
four two week period of milk collection are represented. Milk was stored for a total of 11 days (4C; no light exposure). 2 Week nested within treatment
Table J4: Experiment 3, Hexanal. Hexanal (mean SE; n=8), determined by gas chromatography mass spectrometry as indication
of oxidation on whole processed (pasteurized, homogenized) milk1.
Hexanal area2
Treatment3,4
Day 1
Day 8
Control (0 mg/kg iron) 2.2 x10⁶ ± 0.24 x10
6 1.8 x10
6 ± 0.35 x10
6
Low (200 mg/kg iron) 2.2 x10⁶ ± 0.27 x10
6 1.7 x10
6 ± 0.17 x10
6
Medium (500 mg/kg iron) 1.9 x10⁶ ± 0.35 x10
6 2.1 x10
6 ± 0.21 x10
6
High (1250 mg/kg iron) 2.1 x10⁶ ± 0.42 x10
6 2.4 x10
6 ± 0.46 x10
6
1 Milk obtained from cows (n=4; (d1, d8) values as duplicates) infused in the abomasum with ferrous lactate solution at four
concentrations. Ferrous lactate solutions were made using ultrapure water and were provided for four days prior to milk collection. All
four two week period of milk collection are represented. Milk was stored for a total of 11 days (4C; no light exposure). 2 Units are shown in area under the curve. Area directly correlates to amount of compound present.
3 There were no statistically significant differences (P > 0.05) found among the different treatments or cows using ANOVA.
4 Day 1 and day 8 differences in mineral composition were not statistically significant (P > 0.05) using a Tukey-Kramer analysis.
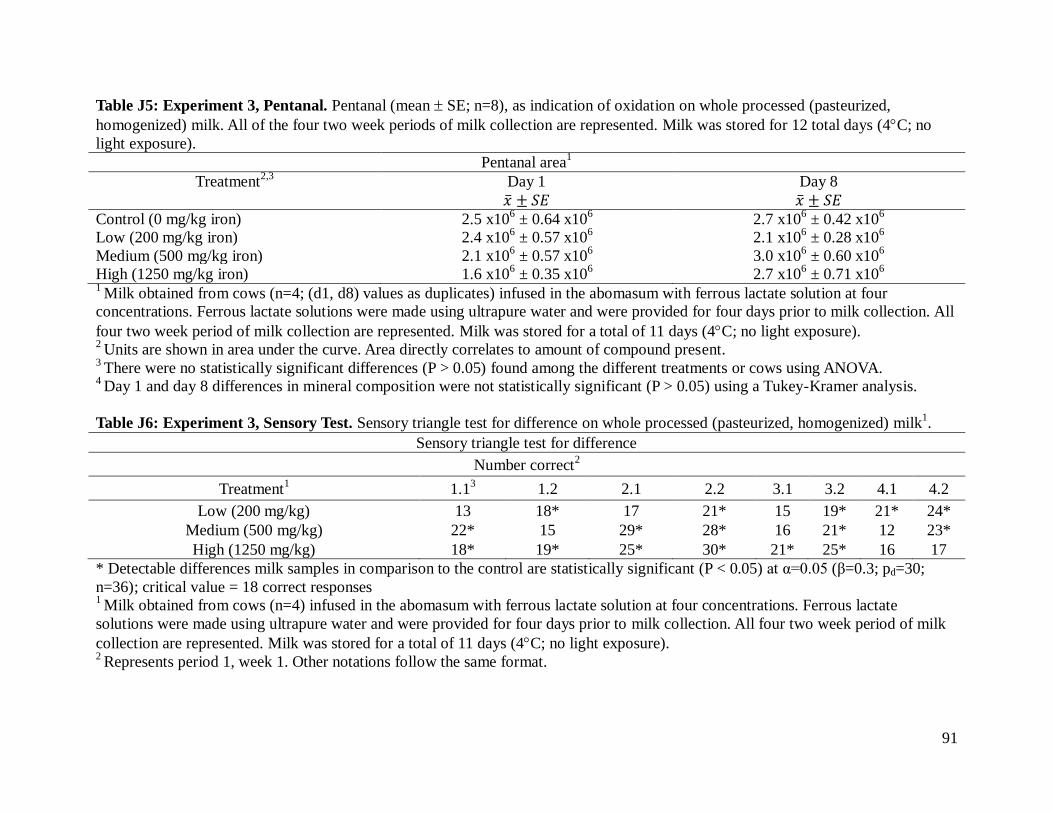
91
Table J5: Experiment 3, Pentanal. Pentanal (mean SE; n=8), as indication of oxidation on whole processed (pasteurized,
homogenized) milk. All of the four two week periods of milk collection are represented. Milk was stored for 12 total days (4C; no
light exposure).
Pentanal area1
Treatment2,3
Day 1
Day 8
Control (0 mg/kg iron) 2.5 x10⁶ ± 0.64 x10
6 2.7 x10
6 ± 0.42 x10
6
Low (200 mg/kg iron) 2.4 x10⁶ ± 0.57 x10
6 2.1 x10
6 ± 0.28 x10
6
Medium (500 mg/kg iron) 2.1 x10⁶ ± 0.57 x10
6 3.0 x10
6 ± 0.60 x10
6
High (1250 mg/kg iron) 1.6 x10⁶ ± 0.35 x10
6 2.7 x10
6 ± 0.71 x10
6
1 Milk obtained from cows (n=4; (d1, d8) values as duplicates) infused in the abomasum with ferrous lactate solution at four
concentrations. Ferrous lactate solutions were made using ultrapure water and were provided for four days prior to milk collection. All
four two week period of milk collection are represented. Milk was stored for a total of 11 days (4C; no light exposure). 2 Units are shown in area under the curve. Area directly correlates to amount of compound present.
3 There were no statistically significant differences (P > 0.05) found among the different treatments or cows using ANOVA.
4 Day 1 and day 8 differences in mineral composition were not statistically significant (P > 0.05) using a Tukey-Kramer analysis.
Table J6: Experiment 3, Sensory Test. Sensory triangle test for difference on whole processed (pasteurized, homogenized) milk1.
Sensory triangle test for difference
Number correct2
Treatment1 1.1
3 1.2 2.1 2.2 3.1 3.2 4.1 4.2
Low (200 mg/kg) 13 18* 17 21* 15 19* 21* 24*
Medium (500 mg/kg) 22* 15 29* 28* 16 21* 12 23*
High (1250 mg/kg) 18* 19* 25* 30* 21* 25* 16 17
* Detectable differences milk samples in comparison to the control are statistically significant (P < 0.05) at α=0.05 (β=0.3; pd=30;
n=36); critical value = 18 correct responses 1 Milk obtained from cows (n=4) infused in the abomasum with ferrous lactate solution at four concentrations. Ferrous lactate
solutions were made using ultrapure water and were provided for four days prior to milk collection. All four two week period of milk
collection are represented. Milk was stored for a total of 11 days (4C; no light exposure). 2 Represents period 1, week 1. Other notations follow the same format.
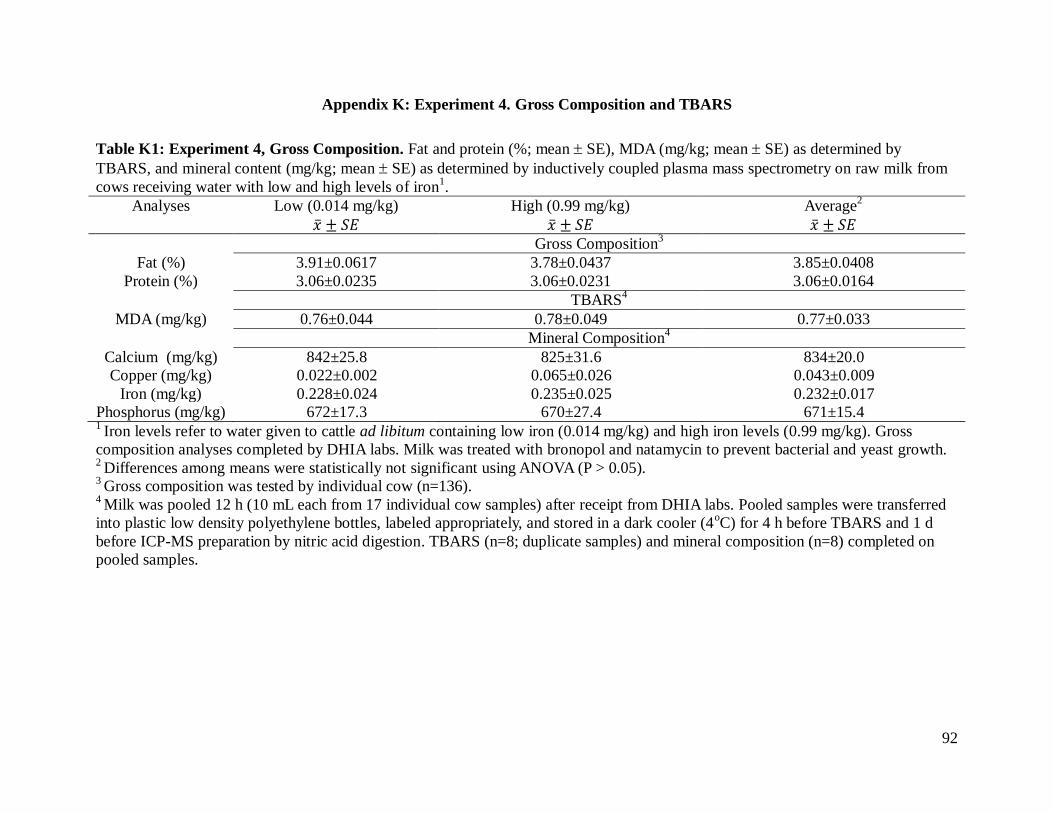
92
Appendix K: Experiment 4. Gross Composition and TBARS
Table K1: Experiment 4, Gross Composition. Fat and protein (%; mean SE), MDA (mg/kg; mean SE) as determined by
TBARS, and mineral content (mg/kg; mean SE) as determined by inductively coupled plasma mass spectrometry on raw milk from
cows receiving water with low and high levels of iron1.
Analyses Low (0.014 mg/kg)
High (0.99 mg/kg)
Average2
Gross Composition3
Fat (%) 3.91±0.0617 3.78±0.0437 3.85±0.0408
Protein (%) 3.06±0.0235 3.06±0.0231 3.06±0.0164
TBARS4
MDA (mg/kg) 0.76±0.044 0.78±0.049 0.77±0.033
Mineral Composition4
Calcium (mg/kg) 842±25.8 825±31.6 834±20.0
Copper (mg/kg) 0.022±0.002 0.065±0.026 0.043±0.009
Iron (mg/kg) 0.228±0.024 0.235±0.025 0.232±0.017
Phosphorus (mg/kg) 672±17.3 670±27.4 671±15.4 1 Iron levels refer to water given to cattle ad libitum containing low iron (0.014 mg/kg) and high iron levels (0.99 mg/kg). Gross
composition analyses completed by DHIA labs. Milk was treated with bronopol and natamycin to prevent bacterial and yeast growth. 2 Differences among means were statistically not significant using ANOVA (P > 0.05).
3 Gross composition was tested by individual cow (n=136).
4 Milk was pooled 12 h (10 mL each from 17 individual cow samples) after receipt from DHIA labs. Pooled samples were transferred
into plastic low density polyethylene bottles, labeled appropriately, and stored in a dark cooler (4oC) for 4 h before TBARS and 1 d
before ICP-MS preparation by nitric acid digestion. TBARS (n=8; duplicate samples) and mineral composition (n=8) completed on
pooled samples.
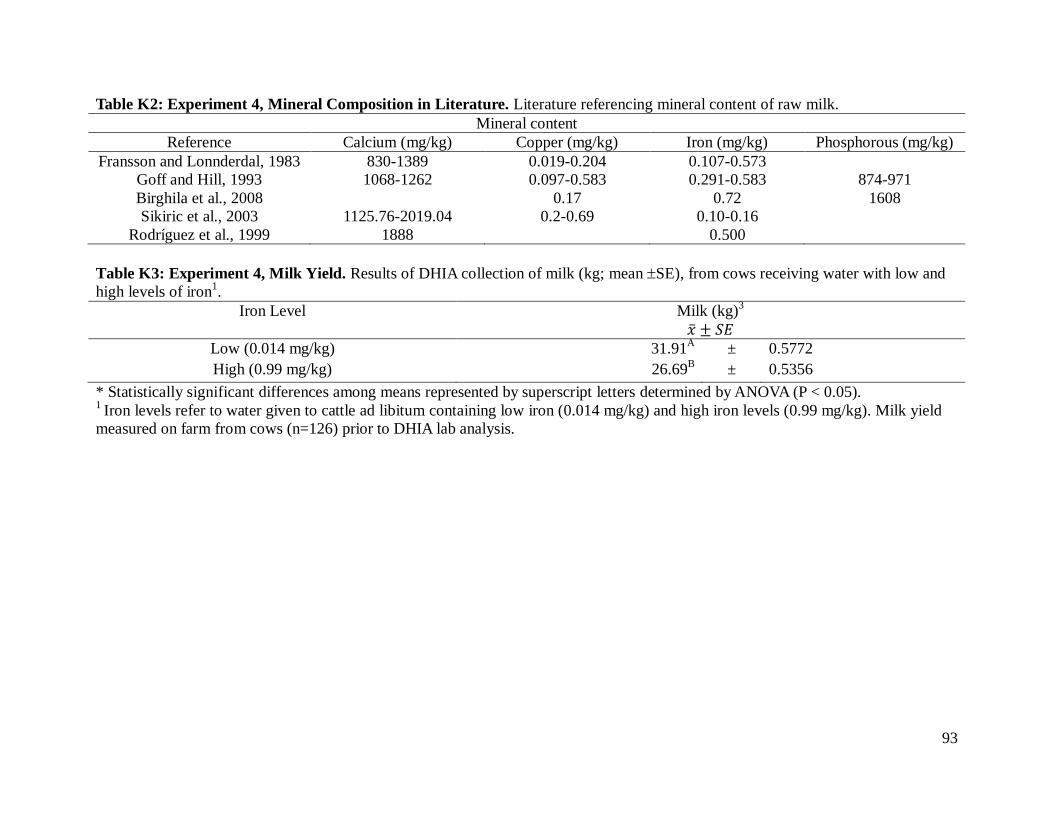
93
Table K2: Experiment 4, Mineral Composition in Literature. Literature referencing mineral content of raw milk.
Mineral content
Reference Calcium (mg/kg) Copper (mg/kg) Iron (mg/kg) Phosphorous (mg/kg)
Fransson and Lonnderdal, 1983 830-1389 0.019-0.204 0.107-0.573
Goff and Hill, 1993 1068-1262 0.097-0.583 0.291-0.583 874-971
Birghila et al., 2008
0.17 0.72 1608
Sikiric et al., 2003 1125.76-2019.04 0.2-0.69 0.10-0.16
Rodríguez et al., 1999 1888 0.500
Table K3: Experiment 4, Milk Yield. Results of DHIA collection of milk (kg; mean SE), from cows receiving water with low and
high levels of iron1.
Iron Level Milk (kg)3
Low (0.014 mg/kg) 31.91A
± 0.5772
High (0.99 mg/kg) 26.69B
± 0.5356
* Statistically significant differences among means represented by superscript letters determined by ANOVA (P < 0.05). 1 Iron levels refer to water given to cattle ad libitum containing low iron (0.014 mg/kg) and high iron levels (0.99 mg/kg). Milk yield
measured on farm from cows (n=126) prior to DHIA lab analysis.
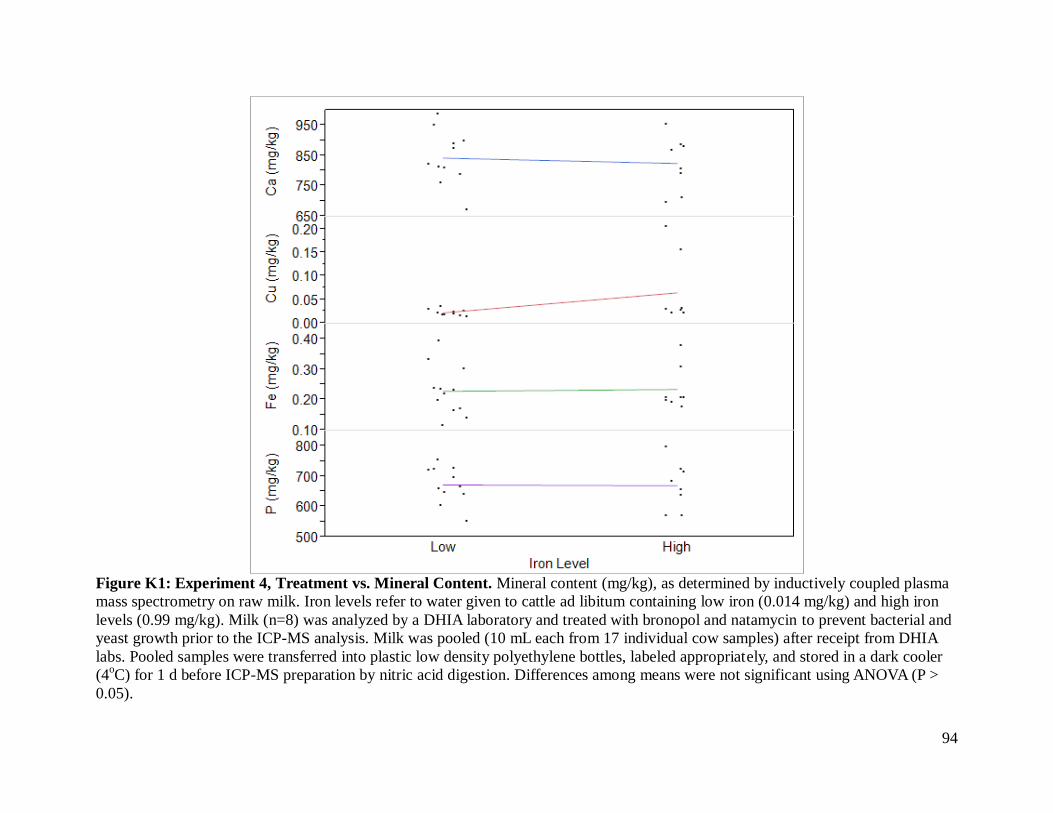
94
Figure K1: Experiment 4, Treatment vs. Mineral Content. Mineral content (mg/kg), as determined by inductively coupled plasma
mass spectrometry on raw milk. Iron levels refer to water given to cattle ad libitum containing low iron (0.014 mg/kg) and high iron
levels (0.99 mg/kg). Milk (n=8) was analyzed by a DHIA laboratory and treated with bronopol and natamycin to prevent bacterial and
yeast growth prior to the ICP-MS analysis. Milk was pooled (10 mL each from 17 individual cow samples) after receipt from DHIA
labs. Pooled samples were transferred into plastic low density polyethylene bottles, labeled appropriately, and stored in a dark cooler
(4oC) for 1 d before ICP-MS preparation by nitric acid digestion. Differences among means were not significant using ANOVA (P >
0.05).
95
Appendix L: Virginia State Dairyman Article, January 2013
Water Use in the Dairy Industry: Learning from New Zealand
By: Georgianna Mann, Dr. Susan Duncan
Department of Food Science and Technology, Virginia Polytechnic Institute and State University
Drought is a term that seems to be on the minds of many Americans after the dry summer
of 2012. The impacts of drought on dairy production causes difficulty with production, and
subsequently, higher milk and dairy product costs. Drought affects water availability and quality,
which are important for cow health and milk quality. Georgianna Mann, a graduate student in
Food Science and Technology at Virginia Tech, travelled to New Zealand to investigate the
issues of water availability and quality on the New Zealand dairy industry. She talked with
farmers, a dairy cooperative, and dairy representatives at the New Zealand Field Days, the largest
agribusiness event in the Southern Hemisphere. Georgianna was specifically interested in
minerals in water sources for dairies.
Regardless of whether the dairy production is in the Southern or Northern hemisphere,
water is used on the dairy farm for animal cooling, wash-down, and hydration. In addition water
is needed for cleaning and sanitation of the operations, parlor and equipment, and cooling of
milk. In the U.S. dairy industry over the past 70 years, water usage requirements for producing a
gallon of milk have decreased by 65% but there are some aspects that cannot be reduced. About
30 gallons of drinking water are needed per cow per day for maintaining health and producing
milk. This means that over 3,000 gallons of good quality water are required daily on a 100-cow
farm just to sustain the animals.
While the USA has far more renewable water resources than New Zealand, the 2012
drought suggests that we might learn from the industry in New Zealand. Most of the concerns
about water quality and availability in New Zealand are largely tied to the new government
96
implementation of “water take” regulations, a policy designed to curtail wasteful water usage on
the farms. These “water take” regulations are quite similar to water restrictions that may be
implemented in the United States in the face of a drought, but deep wells where water is taken
from, called bores, will be equipped with meters on them to closely monitor the amount of water
used. New Zealand has “controlled activity consents” which require farmers to obtain consent for
any water needed above the stock water supply (standard allocations per herd) if there are over
215 cows in the herd, according to a regional council member. Herds smaller than 215 are not
considered to be of significant impact on the full allocation of water resources but in the future it
is likely all farms will need to meet the strict regulations. An astonishing 3,500 farms will be
requiring these consents in the Waikato region on the North Island of New Zealand over the next
three years. This is reflective of New Zealand’s growing concern for their water supply.
In one particular New Zealand water “catchment”, akin to a watershed, the farms are
using “using all the water resources we’ve got”, according to a regional council member. Most
water for dairy cattle is derived from bores and tested for quality before use. In some areas the
water cannot be used due to overloads of heavy metals, especially iron. One farmer noted that
“the water was orange. We had to cap the bore; it was too full of iron.” He elaborated on methods
used to improve the metal-laden water, using “huge filters on the deep bores… but it’s quite
expensive and you have to keep changing the medium since the lifespan is 4-5 months. It back
flushes every hour. It’s horrible water coming out.”
New Zealand, a country boasting the “100% Pure” tourism advertisements, seeks to
entice visitors by selling its closeness to raw nature. While New Zealand is actively assessing
water needs from a conservation standpoint, they are taking no risk of wasting this valuable
resource. One of the ways farmers reuse water is to irrigate land with the effluents. This,
97
however, is strictly monitored to ensure too much nitrogen and phosphorus is not being returned
to the soil. The New Zealand government and its citizens are devoted to keeping water resources
pristine, particularly lakes. The regional council member noted that Lake Taupo has “very low
losses but what we’re seeing with a lake that is so pristine, any farming in the catchment is
creating an effect so we’re starting to see deep algal blooms accumulating in the lake”. The New
Zealand drive for water conservation stems from the desire to preserve this valuable resource.
Virginia did not suffer directly from the 2012 drought like other regions of the U.S.
However, the dairy industry in Virginia can recognize that the water resources available today
may not be as abundant in the future. The United States, in contrast to New Zealand, has a water
withdrawal per capita that is more than three times that of New Zealand. Virginia appears “rich”
in water resources. However, when water availability and quality become stressed and costs for
available water increase, the effects will be felt in the dairy industry. Restrictions, whether
regulated or imposed because of lack of water resources, could indirectly limit dairy herd size
and quality milk production. Dairy producers and processors can be thinking proactively about
options for water conservation, including reuse and recycling of water, and consideration of the
implications these options have on dairy production and processing.